I.INTRODUCTION
In competitive service-driven industries, customer satisfaction has emerged as a central indicator of strategic success, closely tied to long-term business profitability. It reflects the extent to which organizations meet or exceed customer expectations and directly influences customer behavior, brand perception, retention, and loyalty. Satisfied customers are less likely to churn, more inclined to engage in positive word-of-mouth, and contribute to sustainable revenue growth. Beyond profitability, firms that consistently achieve high satisfaction levels tend to secure larger market shares, benefit from reduced marketing costs, and operate with greater efficiency [1,2].
In today’s digital economy, satisfaction has evolved from a reactive performance measure into a proactive strategic goal. Companies are increasingly investing in tools that capture real-time customer sentiment and convert it into actionable insights. This proactive orientation has positioned satisfaction not only as a quality metric but also as a foundation for organizational adaptability and resilience in dynamic markets [3,4].
For service-intensive sectors such as aviation, where competition is intense and service interactions are highly visible, customer satisfaction is one of the most critical determinants of business success. Airlines operate in a service environment that involves multiple stages of interaction—including ticket purchasing, check-in, boarding, in-flight experience, and post-flight support—each of which shapes overall passenger perceptions. Even minor service gaps can disproportionately impact customer trust and loyalty, making consistent service delivery a critical factor in sustaining competitiveness. Bridging the gap between customer expectations and actual service delivery is central to achieving high satisfaction levels and building enduring customer relationships [5]. Customers who perceive high value in their service experience are more willing to join loyalty programs, purchase premium services, and remain less sensitive to price fluctuations. This willingness to pay a premium not only increases direct revenue but also enhances predictability in demand forecasting. Furthermore, loyalty-driven behaviors such as consistently choosing the same carrier or recommending it to peers will support market share stability in a sector where switching costs are relatively low. In contrast, dissatisfied passengers are quick to defect to competitors, forcing airlines to rely heavily on costly promotions and discounts to fill capacity, thereby eroding profitability [6,7].
Recent advances in machine learning have created new opportunities to enhance the understanding of customer satisfaction. By analyzing large-scale passenger feedback, machine learning models can identify hidden patterns, determine the most influential service attributes, and predict future customer behaviors. This data-driven perspective provides organizations with powerful insights to optimize operational performance while simultaneously elevating the customer experience [8,9].
Building on this foundation, this study makes the following contributions. First, we conducted a comprehensive benchmarking study of machine learning algorithms, ranging from simple baselines to advanced ensembles, for predicting airline passenger satisfaction. Second, we applied three complementary feature attribution techniques, permutation importance, gain-based measures, and Shapley Additive exPlanations (SHAP), to ensure consistent and interpretable identification of satisfaction drivers. Third, we revealed actionable business insights by pinpointing in-flight Wi-Fi service, online boarding, seat comfort, and cleanliness as the most influential service attributes. Lastly, we demonstrated the strategic value of AI in translating technical findings into managerial decisions that enhance customer loyalty and profitability.
The remainder of this paper is organized as follows. Section II presents the literature review. Section III describes the dataset, preprocessing steps, and machine learning methodology. Section IV reports experimental results and feature importance analysis. Finally, Section V concludes the study and discusses limitations and future research directions.
II.LITERATURE REVIEW
Customer satisfaction is a central construct in service research, playing a vital role in shaping loyalty, repurchase intentions, and overall business performance. Previous studies have shown that satisfaction is influenced by a combination of tangible and intangible factors. For example, Zandi et al. [10] demonstrated that elements such as product quality, pricing, and perceived value collectively shape customer evaluations, emphasizing the need for a comprehensive understanding of satisfaction drivers. Similarly, Liu et al. [11] highlighted that satisfaction acts as a mediator between the perceived usefulness of digital services and users’ subscription intentions, while psychological factors, such as AI-related anxiety, could affect this process by either strengthening the positive impact of perceived usefulness when users feel confident and comfortable, or weakening it when users experience fear or uncertainty toward AI-driven services. Beyond functional attributes, the service environment has been identified as a crucial factor. Chen [12] found that well-designed service environments create memorable experiences that not only enhance customer satisfaction but also foster stronger loyalty. In the digital sphere, Sinemus et al. [13] emphasized that features like ease of navigation, personalization, and reliability significantly improve user satisfaction with mobile applications. Extending this perspective, Choi and Yi [14] compared human and AI service agents, revealing that the type of interaction channel strongly shapes customer perceptions, with AI agents often preferred in contexts where efficiency and consistency were highly valued.
Building on this, passenger satisfaction has emerged as a key focus within the transportation sector, where it plays a vital role in fostering loyalty and ensuring long-term service sustainability. Recent research has increasingly examined the factors influencing travelers’ experiences, with particular emphasis on service quality, safety, reliability, and the integration of innovative technologies. Studies on ground transportation have widely emphasized that service quality is central to shaping passenger satisfaction, loyalty, and usage behavior. In small-scale transport, Ong et al. [15] highlighted in the Philippines that responsiveness, tangibility, and empathy were key for tricycle users, while assurance and reliability had little impact. Similarly, in bus services, Ubaidillah et al. [16] showed that tangibility, cleanliness, and reliability strongly determined satisfaction in Malaysia, recommending infrastructure upgrades such as Wi-Fi, cashless systems, and real-time tracking. Research on mass transit systems has confirmed these patterns while adding contextual nuances. A study in Singapore’s MRT [17] showed that reliability, assurance, and tangibility most strongly influenced satisfaction, which in turn predicted behavioral intention. Recent research on aviation has increasingly focused on leveraging advanced analytics and artificial intelligence (AI) to address the growing complexity and globalized nature of air travel. A large-scale text mining to analyze passenger feedback was applied in [18]; their findings identified that safety, punctuality, and staff professionalism are the dominant factors influencing satisfaction. Similarly, another research [19] combined sentiment analysis with machine learning and revealed that value for money and ground services were among the strongest predictors of passenger satisfaction. In parallel, [20] emphasized the importance of data-driven strategies for airlines, demonstrating how AI and predictive analytics can be applied to personalize passenger experiences, optimize flight operations, and deliver targeted interventions. Their findings showed that AI-driven personalization significantly improved customer engagement and loyalty, while predictive maintenance and operational analytics reduced delays and service disruptions. These strategies collectively enhance both passenger satisfaction and overall airline performance.
At a more granular level, an asymmetric impact performance analysis (AIPA) was utilized to examine how individual service attributes affect satisfaction and dissatisfaction differently [21]. Their study revealed that seat comfort and food services were the main sources of dissatisfaction, while value for money and customer service were the strongest positive drivers of satisfaction. Complementing this, a multi-criteria decision-making framework was proposed in [22]. They integrated the Analytic Hierarchy Process (AHP) with Monte Carlo simulation to evaluate airline services across 51 dimensions covering pre-flight, in-flight, and post-flight stages. This combination allows the model to account for uncertainty in passenger preferences and produces more reliable rankings of service quality. The framework helps managers identify key improvement areas, prioritize actions, and allocate resources effectively to enhance overall passenger satisfaction.
While existing studies have advanced our understanding of passenger satisfaction through diverse approaches—ranging from traditional service quality assessments to AI-driven analytics—they often focus on isolated aspects of the travel experience or rely on black-box models that lack interpretability. Many recent works emphasize either predictive accuracy or factor identification without providing clear, actionable guidance for airline managers. In contrast, our study introduces a comprehensive and explainable framework that not only predicts passenger satisfaction with high accuracy but also explains why specific factors matter, bridging the gap between advanced analytics and practical decision-making. By integrating explainable AI techniques with real-world airline data, our research delivers interpretable insights that empower airlines to prioritize resources, tailor services to passenger needs, and design targeted strategies that enhance loyalty and operational performance. This contribution positions our work at the intersection of cutting-edge technology and managerial relevance, offering a novel approach to improving passenger satisfaction and sustaining competitive advantage in the evolving aviation industry.
III.METHODOLOGY
This section presents the research design and methodological framework adopted to analyze and predict passenger satisfaction. It begins by describing the dataset and its relevance to the aviation industry and then details the preprocessing steps implemented to ensure data integrity and readiness for analysis. Finally, it outlines the modeling approach used to build and compare multiple machine learning algorithms, laying the foundation for the subsequent evaluation presented in the results section.
A.DATASET DESCRIPTION
This study utilizes a large-scale airline passenger satisfaction dataset comprising 129,880 post-flight survey responses collected from passengers traveling with US-based commercial airlines [23]. The dataset is publicly available on Kaggle: https://www.kaggle.com/datasets/teejmahal20/airline-passenger-satisfaction.
Each entry in the dataset corresponds to a completed flight and includes a combination of demographic variables, travel-related details, and subjective evaluations of service quality across various stages of the air travel experience. Passenger demographics include age, gender, frequent flyer membership status, and travel purpose (business or personal). Travel characteristics cover flight class, flight distance, and delay times. The core of the dataset consists of 14 service quality attributes, each rated by passengers on a standardized five-point Likert scale, ranging from 1 (very bad) to 5 (very good). These attributes span multiple service phases, including online booking, airport facilities, in-flight amenities, and onboard services. The target variable, passenger satisfaction, is originally recorded as a binary categorical label with two distinct values, “Satisfied” and “Neutral or Dissatisfied.”
The dataset was pre-partitioned into two subsets: a training set comprising 103,904 records (80%) and a test set comprising 25,976 records (20%). The class distribution in the training set is 57% “Neutral or Dissatisfied” and 43% “Satisfied,” while the test set maintains a similar proportion, with 56% “Neutral or Dissatisfied” and 44% “Satisfied.” This consistent stratification across splits ensures that model evaluation reflects realistic performance expectations on unseen data.
Although the dataset exhibits a moderate class imbalance, the distribution remains relatively balanced (57% vs. 43%). Therefore, no synthetic oversampling techniques such as SMOTE were applied. Instead, stratified train–test splitting was preserved to maintain the original class proportions across both subsets, ensuring fair and reliable model evaluation. In addition, performance was assessed using multiple complementary metrics, including precision, recall, F1-score, area under the receiver operating characteristic curve (ROC-AUC), and area under the precision-recall curve (PR-AUC), to avoid biased conclusions based solely on accuracy.
Overall, this dataset enables a comprehensive exploration of the determinants of passenger satisfaction, offering both behavioral and perceptual insights across multiple service dimensions. A detailed summary of the dataset’s attributes is presented in Table I.
Table I. Dataset attributes summary
| Factor | Description | Value |
|---|---|---|
| Satisfaction | Customer satisfaction with airlines | “Satisfied,” “Neutral or Dissatisfied” |
| Age | Actual age of passengers | 7–85 |
| Gender | Passenger’s gender | Male, Female |
| Type of travel | Personal or business travel | Personal, Business |
| Flight class | Business, economy, or economy plus | Business, Economy, Economy plus |
| Customer type | Member or not | Member, Non-member |
| Flight distance | The flight distance of this journey | 250–5000 miles |
| Flight delays | Minutes delayed | 0–3176 min |
| Seat comfort | Satisfaction level of seat comfort | Rating 1–5 |
| Departure/Arrival time | Satisfaction level of departure/arrival convenience | Rating 1–5 |
| Food and drink | Satisfaction level of food and drink | Rating 1–5 |
| Gate location | Satisfaction level of the gate location | Rating 1–5 |
| In-flight Wi-Fi service | Satisfaction level of the in-flight Wi-Fi service | Rating 1–5 |
| In-flight entertainment | Satisfaction level of in-flight entertainment | Rating 1–5 |
| Online support | Satisfaction level of online support | Rating 1–5 |
| Ease of online booking | Satisfaction level of ease of online booking | Rating 1–5 |
| On-board service | Satisfaction level of on-board service | Rating 1–5 |
| Leg room service | Satisfaction level of leg room service | Rating 1–5 |
| Baggage handling | Satisfaction level of baggage handling | Rating 1–5 |
| Check-in service | Satisfaction level of check-in service | Rating 1–5 |
| Cleanliness | Satisfaction level of cleanliness | Rating 1–5 |
| Online boarding | Satisfaction level of online boarding | Rating 1–5 |
B.PREPROCESSING
A comprehensive preprocessing strategy was implemented to ensure that the dataset was clean, consistent, and suitable for predicting passenger satisfaction. All transformations were embedded within a unified pipeline, guaranteeing that the same procedures were applied consistently across both training and testing phases, thereby eliminating the risk of data leakage.
Numerical attributes, including age, flight distance, departure delay, and arrival delay, were handled using a two-stage approach. Missing values were imputed with K-nearest neighbors (KNN) employing distance-based weighting, which leverages the similarity structure in the data to generate robust estimates. After imputation, the variables were standardized through z-score normalization to ensure that features with different scales contributed proportionally to model estimation. Next, service-related variables reflecting passenger perceptions of seat comfort, in-flight entertainment, food quality, cleanliness, and other service dimensions were retained as ordinal integers. Their missing values were filled with the most frequent response for each attribute, preserving the underlying distribution of passenger evaluations without distorting the rating scale.
Finally, categorical attributes such as gender, type of travel, and flight class were first handled using mode imputation to address missing values by replacing them with the most frequent category. Afterward, one-hot encoding was applied to transform each categorical feature into multiple binary variables, each representing the presence or absence of a specific category. This approach allowed the models to effectively capture nonlinear relationships and interaction effects between categories, while avoiding any bias or unintended assumptions that might result from using arbitrary numerical labels.
By integrating all preprocessing steps into a unified pipeline, the framework ensured both reproducibility and consistency across the entire workflow, while safeguarding the integrity of the evaluation process. This systematic data preparation established a solid foundation for training reliable machine learning models to predict passenger satisfaction. Once the dataset was fully cleaned and transformed, the focus shifted to selecting and developing the predictive models.
C.MODELING
Building a robust modeling framework for predicting passenger satisfaction requires more than selecting a single high-performing algorithm. Each machine learning algorithm embodies a distinctive inductive bias that reflects a set of assumptions about the underlying data distribution. This bias governs how the algorithm learns from examples, the types of relationships it is able to capture, and the patterns it emphasizes during prediction. Linear models are constrained to global linear relationships, neighborhood-based learners rely on local similarity, while tree ensembles are capable of representing nonlinear interactions and higher-order dependencies. Restricting the analysis to a single family of algorithms risks overlooking important structures within the data and leads to an incomplete understanding of the predictive space. To address this, the study employed a broad spectrum of algorithms ranging from simple baselines to state-of-the-art gradient boosting ensembles. This design ensured a balance between predictive performance and explanatory depth, providing both accurate forecasts and meaningful insights into the drivers of passenger satisfaction.
The objective of the modeling framework was not limited to maximizing classification accuracy but extended to deriving meaningful insights into why passengers report satisfaction or dissatisfaction. This dual perspective of prediction and interpretation guided the methodological design. Models with different representational capacities were complemented with multiple feature attribution techniques, including permutation importance, gain-based measures, and SHAP values [24]. The integration of these complementary approaches ensured that the insights were validated across diverse learning paradigms, moving the analysis beyond the question of which model predicts best toward the more actionable question of which factors consistently shape passenger satisfaction.
Crucially, feature attribution in this context extends beyond methodological validation. For airline practitioners, identifying the most influential service attributes provides a data-driven basis for prioritizing operational improvements. By highlighting whether factors such as seat comfort, boarding convenience, or delay management consistently drive satisfaction, the analysis translates predictive modeling into actionable guidance for resource allocation and service design. Importantly, the diversity of algorithms was not intended only to improve accuracy but also to strengthen interpretability for practitioners. In the airline industry, where strategic and operational decisions must be justified to stakeholders, explainable models play a critical role. By including both simple interpretable learners and more complex ensembles, the framework ensured that insights could be communicated in a form accessible to decision-makers, thereby enhancing the practical value of the findings.
To achieve these objectives, the study adopted a comprehensive model zoo that encompassed both simple and advanced algorithms. This zoo functioned as a form of evidence triangulation. Rather than relying on a single inductive bias, multiple algorithms were deployed to cross-validate explanatory signals. In this way, the analysis moved beyond optimizing performance metrics and provided converging evidence on which features consistently drive satisfaction, reinforcing the robustness of the conclusions.
At the baseline level, a Dummy Classifier (DM) with stratified outputs was included to establish a reference point against random guessing, ensuring that all subsequent models were evaluated relative to a meaningful lower bound [25]. Among linear models, Logistic Regression (LR) with L2 regularization was adopted as the canonical statistical classifier. It has long been considered a benchmark in supervised learning due to its ability to provide well-calibrated probability estimates and interpretable coefficients that reveal the global direction and strength of feature effects [26,27]. Its inclusion enabled the evaluation of whether more complex models achieved genuine performance gains or merely overfit the data.
To extend beyond the assumptions of LR, the framework incorporated a Linear Support Vector Classifier (LinearSVC) with probability calibration. Unlike LR, which minimizes log loss, LinearSVC maximizes the geometric margin between classes, making it more robust in high-dimensional spaces and potentially more effective for imbalanced decision boundaries [28]. Calibration was necessary to transform its decision scores into probability estimates, ensuring comparability with probabilistic models. In addition, a Stochastic Gradient Descent (SGD) classifier optimized with log-loss was evaluated, offering scalable training through stochastic optimization and flexible regularization for large, high-dimensional datasets [29].
Beyond the linear paradigm, the study employed KNN to capture local similarity structures. KNN is a nonparametric algorithm that predicts outcomes based on the proximity of an instance to its nearest neighbors in the feature space [30]. This makes it particularly sensitive to fine-grained variations in passenger demographics, travel conditions, and service ratings, allowing the framework to assess whether passenger satisfaction can be explained through localized behavioral and perceptual similarities.
To capture nonlinear dependencies in a more interpretable form, Decision Trees (DTs) were included. These models recursively partition the feature space into a hierarchy of rule-based decisions, providing a transparent view of how combinations of service attributes and passenger characteristics influence satisfaction [31]. While single trees are prone to overfitting, their interpretability makes them valuable for uncovering hierarchical predictor interactions that are readily accessible to industry practitioners. Building on this foundation, Random Forests (RFs) aggregated multiple DTs using bootstrap aggregation (bagging). By reducing the variance associated with individual trees, RF provided more stable and generalizable predictions while retaining a degree of interpretability. This ensemble approach offered a balance between accuracy and transparency, enabling the identification of consistently influential features across the models [32].
To further enhance predictive precision and address bias reduction, Gradient Boosting (GB) was incorporated. Unlike bagging, which builds trees in parallel, boosting constructs trees sequentially, with each iteration focusing on correcting the errors of its predecessors. This iterative refinement enables the modeling of complex nonlinear interactions and subtle dependencies [33]. Finally, three state-of-the-art boosting algorithms were integrated to capture the strengths of modern ensemble learning. XGBoost is widely recognized for its strong regularization mechanisms, scalability, and ability to handle sparse, high-dimensional data efficiently [34]. LightGBM was selected for its computational efficiency and scalability, achieved through histogram-based learning and leaf-wise tree growth, making it highly suitable for large-scale survey data [35]. CatBoost was incorporated for its robust handling of categorical variables and its use of ordered boosting, which mitigates prediction shift and enhances generalization [33]. Together, these implementations represented the frontier of gradient boosting and provided the strongest test of predictive performance in the study.
All models were encapsulated within a unified pipeline alongside preprocessing transformations, ensuring strict consistency between training and testing phases and eliminating the risk of data leakage. This systematic design established a modeling framework in which predictive accuracy and interpretability were equally prioritized, enabling the study not only to forecast passenger satisfaction with high fidelity but also to uncover the underlying drivers of passenger satisfaction to guide strategic decision-making and targeted service enhancements.
IV.RESULTS & DISCUSSION
This section presents the results of our analysis, starting with the evaluation metrics used to measure model performance. After that, the performance of all machine learning models is reported and compared, followed by an in-depth feature importance analysis to identify the key factors influencing passenger satisfaction. Together, these results offer both technical validation and practical insights for improving airline service quality and customer loyalty.
A.Evaluation Metrics
The evaluation of predictive models for passenger satisfaction cannot rely on a single metric, as different measures capture different aspects of model behavior. To ensure a rigorous and well-rounded assessment, the study employed a set of complementary metrics that jointly evaluate correctness, discrimination power, probability calibration, and diagnostic transparency.
At the most basic level, accuracy, as defined in Equation 1, quantifies the overall proportion of correctly classified passengers, offering an intuitive measure of performance [28]. However, accuracy alone does not reveal whether models favor one outcome over another. To provide a more detailed view, precision and recall were included. Precision, as defined in Equation 2, represents the proportion of passengers predicted as satisfied who were indeed satisfied [26], while recall, as defined in Equation 3, measures the proportion of all satisfied passengers that the model successfully identified [30]. Their harmonic mean, the F1-score, given in Equation 4 [33], balances these two dimensions, ensuring that improvements are not achieved at the expense of one over the other.
To assess the ability of models to discriminate between satisfied and dissatisfied passengers across varying thresholds, the framework incorporated the ROC-AUC. This metric reflects the probability that a randomly chosen satisfied passenger will be ranked higher than a dissatisfied one. Complementing this, the PR-AUC was used, as it directly evaluates the trade-off between precision and recall across thresholds, providing additional sensitivity to cases where both measures are equally critical [36]. Finally, confusion matrices were examined to provide a diagnostic perspective on model errors. By breaking predictions into true positives (TP), false positives (FP), true negatives (TN), and false negatives (FN), confusion matrices reveal systematic tendencies in misclassification that may not be captured by aggregate metrics [34,37].
By integrating these complementary measures, the evaluation framework provides a multidimensional assessment of performance. This design ensures that the reported results reflect not only predictive accuracy but also the reliability, robustness, and interpretability of the models, thereby aligning with the study’s dual objective of prediction and explanation:
B.PREDICTIVE PERFORMANCE OF MODELS
The comparative evaluation revealed clear variation in performance across algorithms. Among linear classifiers, LR achieved an accuracy of 0.851, precision of 0.819, recall of 0.849, and an F1-score of 0.834, establishing a reliable but limited baseline. The calibrated LinearSVC performed slightly better in precision, 0.846, but attained a similar overall accuracy, 0.857, and F1-score, 0.835. The SGD classifier produced an accuracy of 0.854 and an F1-score of 0.832.
KNN and DT performed moderately. KNN obtained an accuracy of 0.925, precision of 0.943, and recall of 0.884, yielding an F1-score of 0.912. A single DT performed comparably, with an accuracy of 0.939, balanced precision of 0.930, and recall of 0.931, resulting in an F1-score of 0.931. While interpretable, both methods fell short of the top ensemble models.
Ensemble methods delivered markedly stronger results. RF achieved an accuracy of 0.957, precision of 0.965, recall of 0.937, and an F1-score of 0.951, highlighting the benefits of variance reduction through bagging. GB offered slightly lower overall accuracy, 0.935, but retained balanced precision, 0.935, and recall, 0.915, with an F1-score of 0.925.
The state-of-the-art boosting models outperformed all others. XGBoost achieved an accuracy of 0.959, precision of 0.966, recall of 0.941, and an F1-score of 0.953. CatBoost delivered almost identical results with an accuracy of 0.959, precision of 0.967, recall of 0.940, and an F1-score of 0.953. LightGBM emerged as the best-performing model, reaching the highest accuracy of 0.962 and F1-score of 0.956, supported by excellent precision of 0.969 and recall of 0.943.
Finally, as expected, the Dummy Classifier established the baseline at chance level, with an accuracy of 0.514 and an F1-score of 0.446, confirming the nontrivial predictive gains of all supervised approaches.
Table II presents a comparative summary of model performance. The results highlight the consistent superiority of gradient boosting ensembles, with LightGBM in particular achieving the most favorable balance across accuracy, precision, recall, and F1-score.
Table II. Comparative model performance
| Model | Accuracy | Precision | Recall | F1 | ROC-AUC | PR-AUC |
|---|---|---|---|---|---|---|
| Dummy Classifier | 0.514 | 0.446 | 0.445 | 0.446 | 0.506 | 0.442 |
| SGD | 0.854 | 0.844 | 0.820 | 0.832 | 0.916 | 0.917 |
| Logistic Regression | 0.851 | 0.819 | 0.849 | 0.834 | 0.917 | 0.918 |
| LinearSVC | 0.857 | 0.846 | 0.824 | 0.835 | 0.916 | 0.917 |
| KNN | 0.925 | 0.943 | 0.884 | 0.912 | 0.980 | 0.974 |
| Gradient boosting | 0.935 | 0.935 | 0.915 | 0.925 | 0.984 | 0.981 |
| Decision Tree | 0.939 | 0.930 | 0.931 | 0.931 | 0.938 | 0.896 |
| Random Forest | 0.957 | 0.965 | 0.937 | 0.951 | 0.993 | 0.992 |
| XGBoost | 0.959 | 0.966 | 0.941 | 0.953 | 0.994 | 0.993 |
| CatBoost | 0.959 | 0.967 | 0.940 | 0.953 | 0.994 | 0.993 |
| LightGBM | 0.962 | 0.969 | 0.943 | 0.956 | 0.994 | 0.994 |
Macro-level performance measures capture the overall effectiveness of a model but often conceal the underlying structure of its errors. Confusion matrices make these error dynamics explicit by distinguishing true and false predictions for each class. In the context of passenger satisfaction, this diagnostic view is particularly valuable. Misclassifying dissatisfied passengers as satisfied risks masking service deficiencies, while the opposite error may exaggerate operational problems. Evaluating models through their confusion matrices, therefore, provides a complementary lens to summary metrics, offering both methodological validation and practical insight into how predictions succeed and where they fail.
To illustrate these dynamics, confusion matrices are presented in Tables III and IV for the weakest-performing model (DM) and the strongest-performing model (LightGBM), respectively. This contrast highlights the gap between random baseline behavior and the structured predictive power of advanced ensembles.
Table III. Confusion matrix—Dummy Classifier (baseline)
| Pred. satisfied | Pred. not satisfied | |
|---|---|---|
| Actual satisfied | 5074 (TP) | 6329 (FN) |
| Actual not satisfied | 6300 (FP) | 8273 (TN) |
Table IV. Confusion matrix—LightGBM (best model)
| Pred. satisfied | Pred. not satisfied | |
|---|---|---|
| Actual satisfied | 10749 (TP) | 654 (FN) |
| Actual not satisfied | 343 (FP) | 14230 (TN) |
The comparison shows that while the DM generates many false positives and false negatives, LightGBM achieves much higher correctness with very few false positives. This reduction is especially important, as it lowers the risk of overlooking dissatisfied passengers misclassified as satisfied.
C.FEATURE IMPORTANCE ANALYSIS
The objective of this study extends beyond building an accurate predictive model; it is equally concerned with uncovering the key drivers of passenger satisfaction. For airlines, understanding which service attributes most strongly influence satisfaction is essential for guiding strategic improvements, enhancing customer loyalty, and ultimately increasing profitability. To ensure that such insights are valid and actionable, they must be derived from highly accurate models—only when predictive performance is reliable can the factors highlighted as influential be trusted as true reflections of passenger priorities.
Accordingly, the analysis of feature importance was conducted using multiple complementary techniques, including permutation importance, gain-based measures from tree ensembles, and SHAP values. These approaches provide different perspectives on how features contribute to model predictions, offering both methodological robustness and practical interpretability.
1).PERMUTATION IMPORTANCE
Permutation importance is a model-agnostic technique that evaluates the contribution of a feature by randomly shuffling its values and observing the resulting decline in model performance. If permuting a feature significantly reduces accuracy or other metrics, the feature is deemed important [38]. Its strength lies in its intuitive logic and applicability to any model type. For airline satisfaction analysis, this method highlights variables whose disruption most strongly impairs prediction, providing a direct measure of practical dependency between features and outcomes.
Figure 1a–1j present the permutation importance plots obtained across all models, with categorical variables represented using one-hot encoding. This transformation explains the presence of predictors such as Gender_Male, Gender_Female, and Type of Travel_Business travel as distinct features in the rankings.
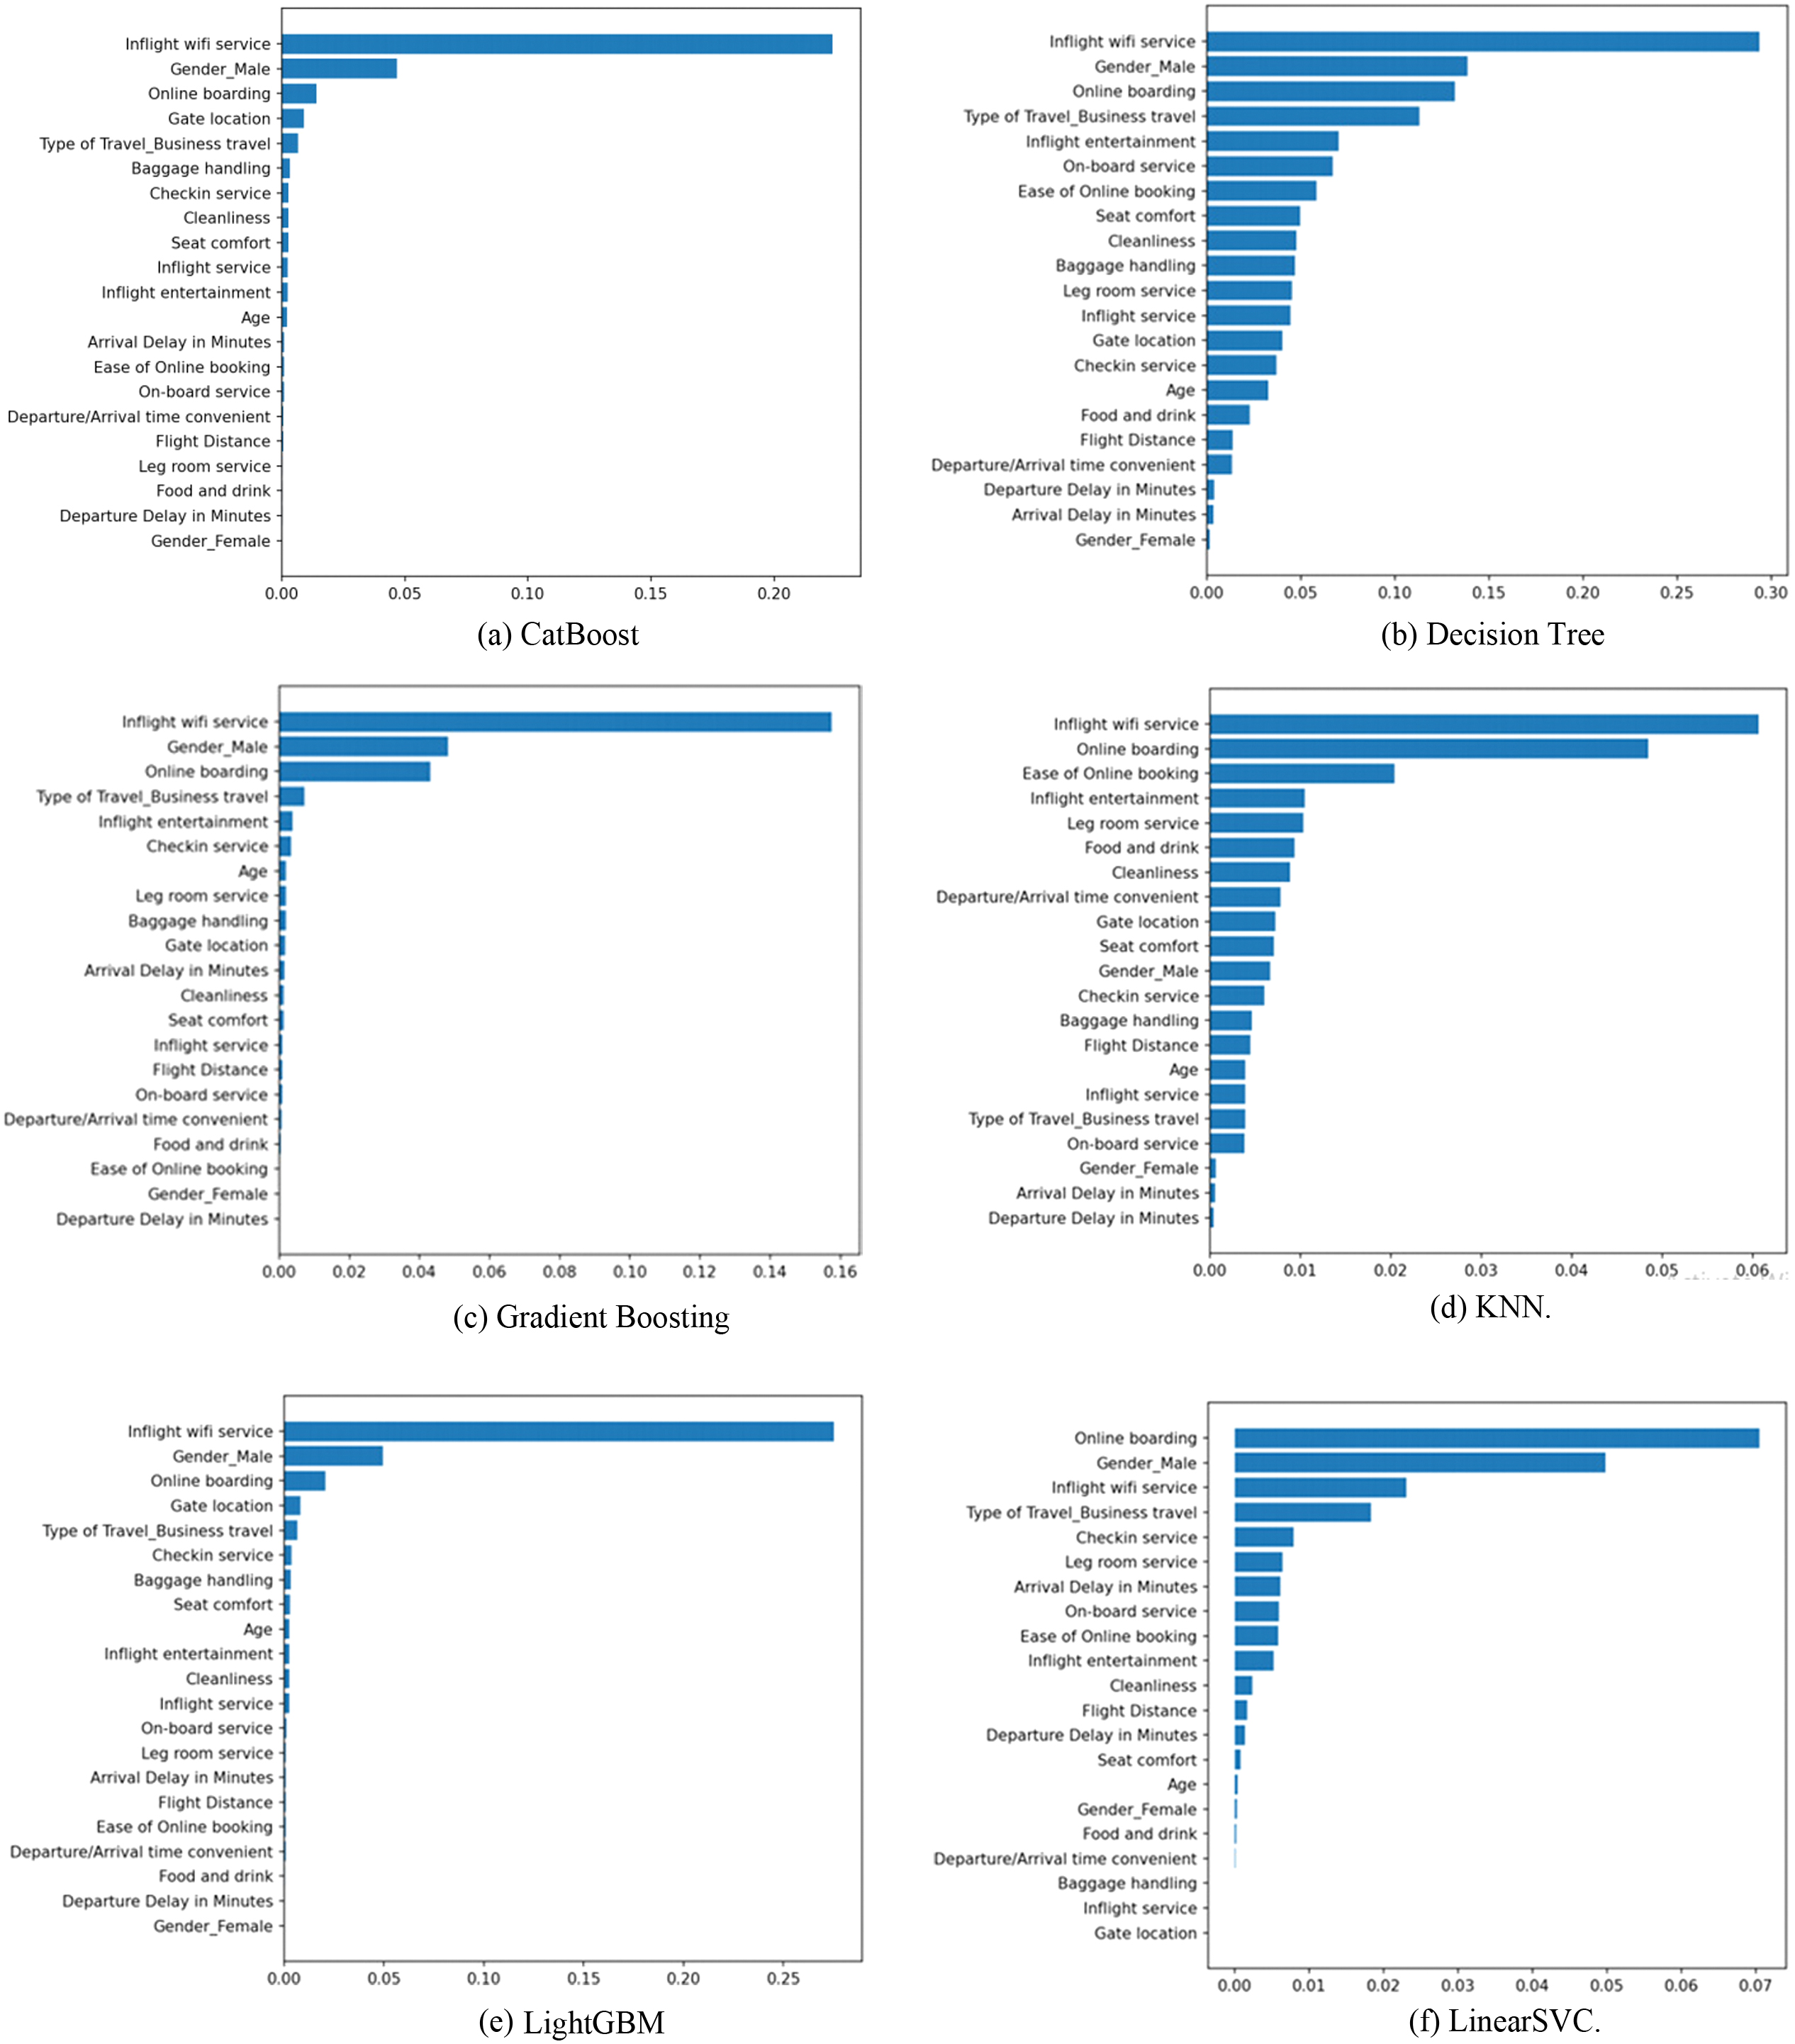 Fig. 1. Permutation importance across models (a–j): (a) CatBoost, (b) Decision Tree, (c) Gradient Boosting, (d) KNN, (e) LightGBM, (f) LinearSVC, (g) Logistic Regression, (h) Random Forest, (i) SGD, and (j) XGBoost.
Across tree-based ensembles (CatBoost, LightGBM, XGBoost, and RF) and gradient boosting methods, in-flight Wi-Fi service consistently dominated the rankings. Randomly permuting this feature led to the sharpest drop in predictive performance, underscoring its pivotal role in determining passenger satisfaction. The second most influential factor across multiple models was online boarding, especially in linear classifiers (LR, LinearSVC, ad SGD) and KNN, reflecting the operational importance of smooth and efficient boarding procedures in shaping customer experience. In addition, Gender_Male frequently appeared among the top predictors. While this highlights statistical associations captured during modeling, it should be interpreted cautiously, as it may represent interaction effects with other service-related variables rather than a direct determinant of satisfaction, including seat comfort, cleanliness, baggage handling, in-flight entertainment, and check-in service. These factors, although less dominant than Wi-Fi and boarding, capture traditional aspects of service quality that remain relevant to passenger perceptions.
Overall, the permutation importance analysis reveals that while digital connectivity and operational efficiency are the strongest drivers of satisfaction, complementary service dimensions related to comfort and cleanliness also contribute meaningfully and present opportunities for targeted improvement. The most influential features based on permutation importance are in-flight Wi-Fi service, online boarding, seat comfort, cleanliness, baggage handling, and in-flight entertainment.
2).GAIN-BASED IMPORTANCE
Gain-based importance, often used in tree-based ensembles such as RF, GB, XGBoost, LightGBM, and CatBoost, measures the cumulative improvement in the model’s loss function (or reduction in impurity) attributed to a feature across all splits where it is used. Features that frequently appear in high-impact splits contribute more to predictive accuracy and thus receive higher scores [39]. This approach offers a clear indication of which variables the trees prioritize when constructing decision boundaries, making it especially valuable for interpreting hierarchical relationships among service attributes.
Figure 2a–2f display the gain-based importance plots across the ensemble models. The results show a clear dominance of in-flight Wi-Fi service and Online boarding across most methods. In CatBoost and RF, Wi-Fi availability emerges as the single most important determinant of satisfaction, aligning with passenger expectations for digital connectivity during travel. Online boarding, on the other hand, is most emphasized in DT, GB, and XGBoost, where it consistently accounts for a large proportion of predictive power. This finding highlights the operational significance of seamless boarding procedures as a key driver of positive customer experience.
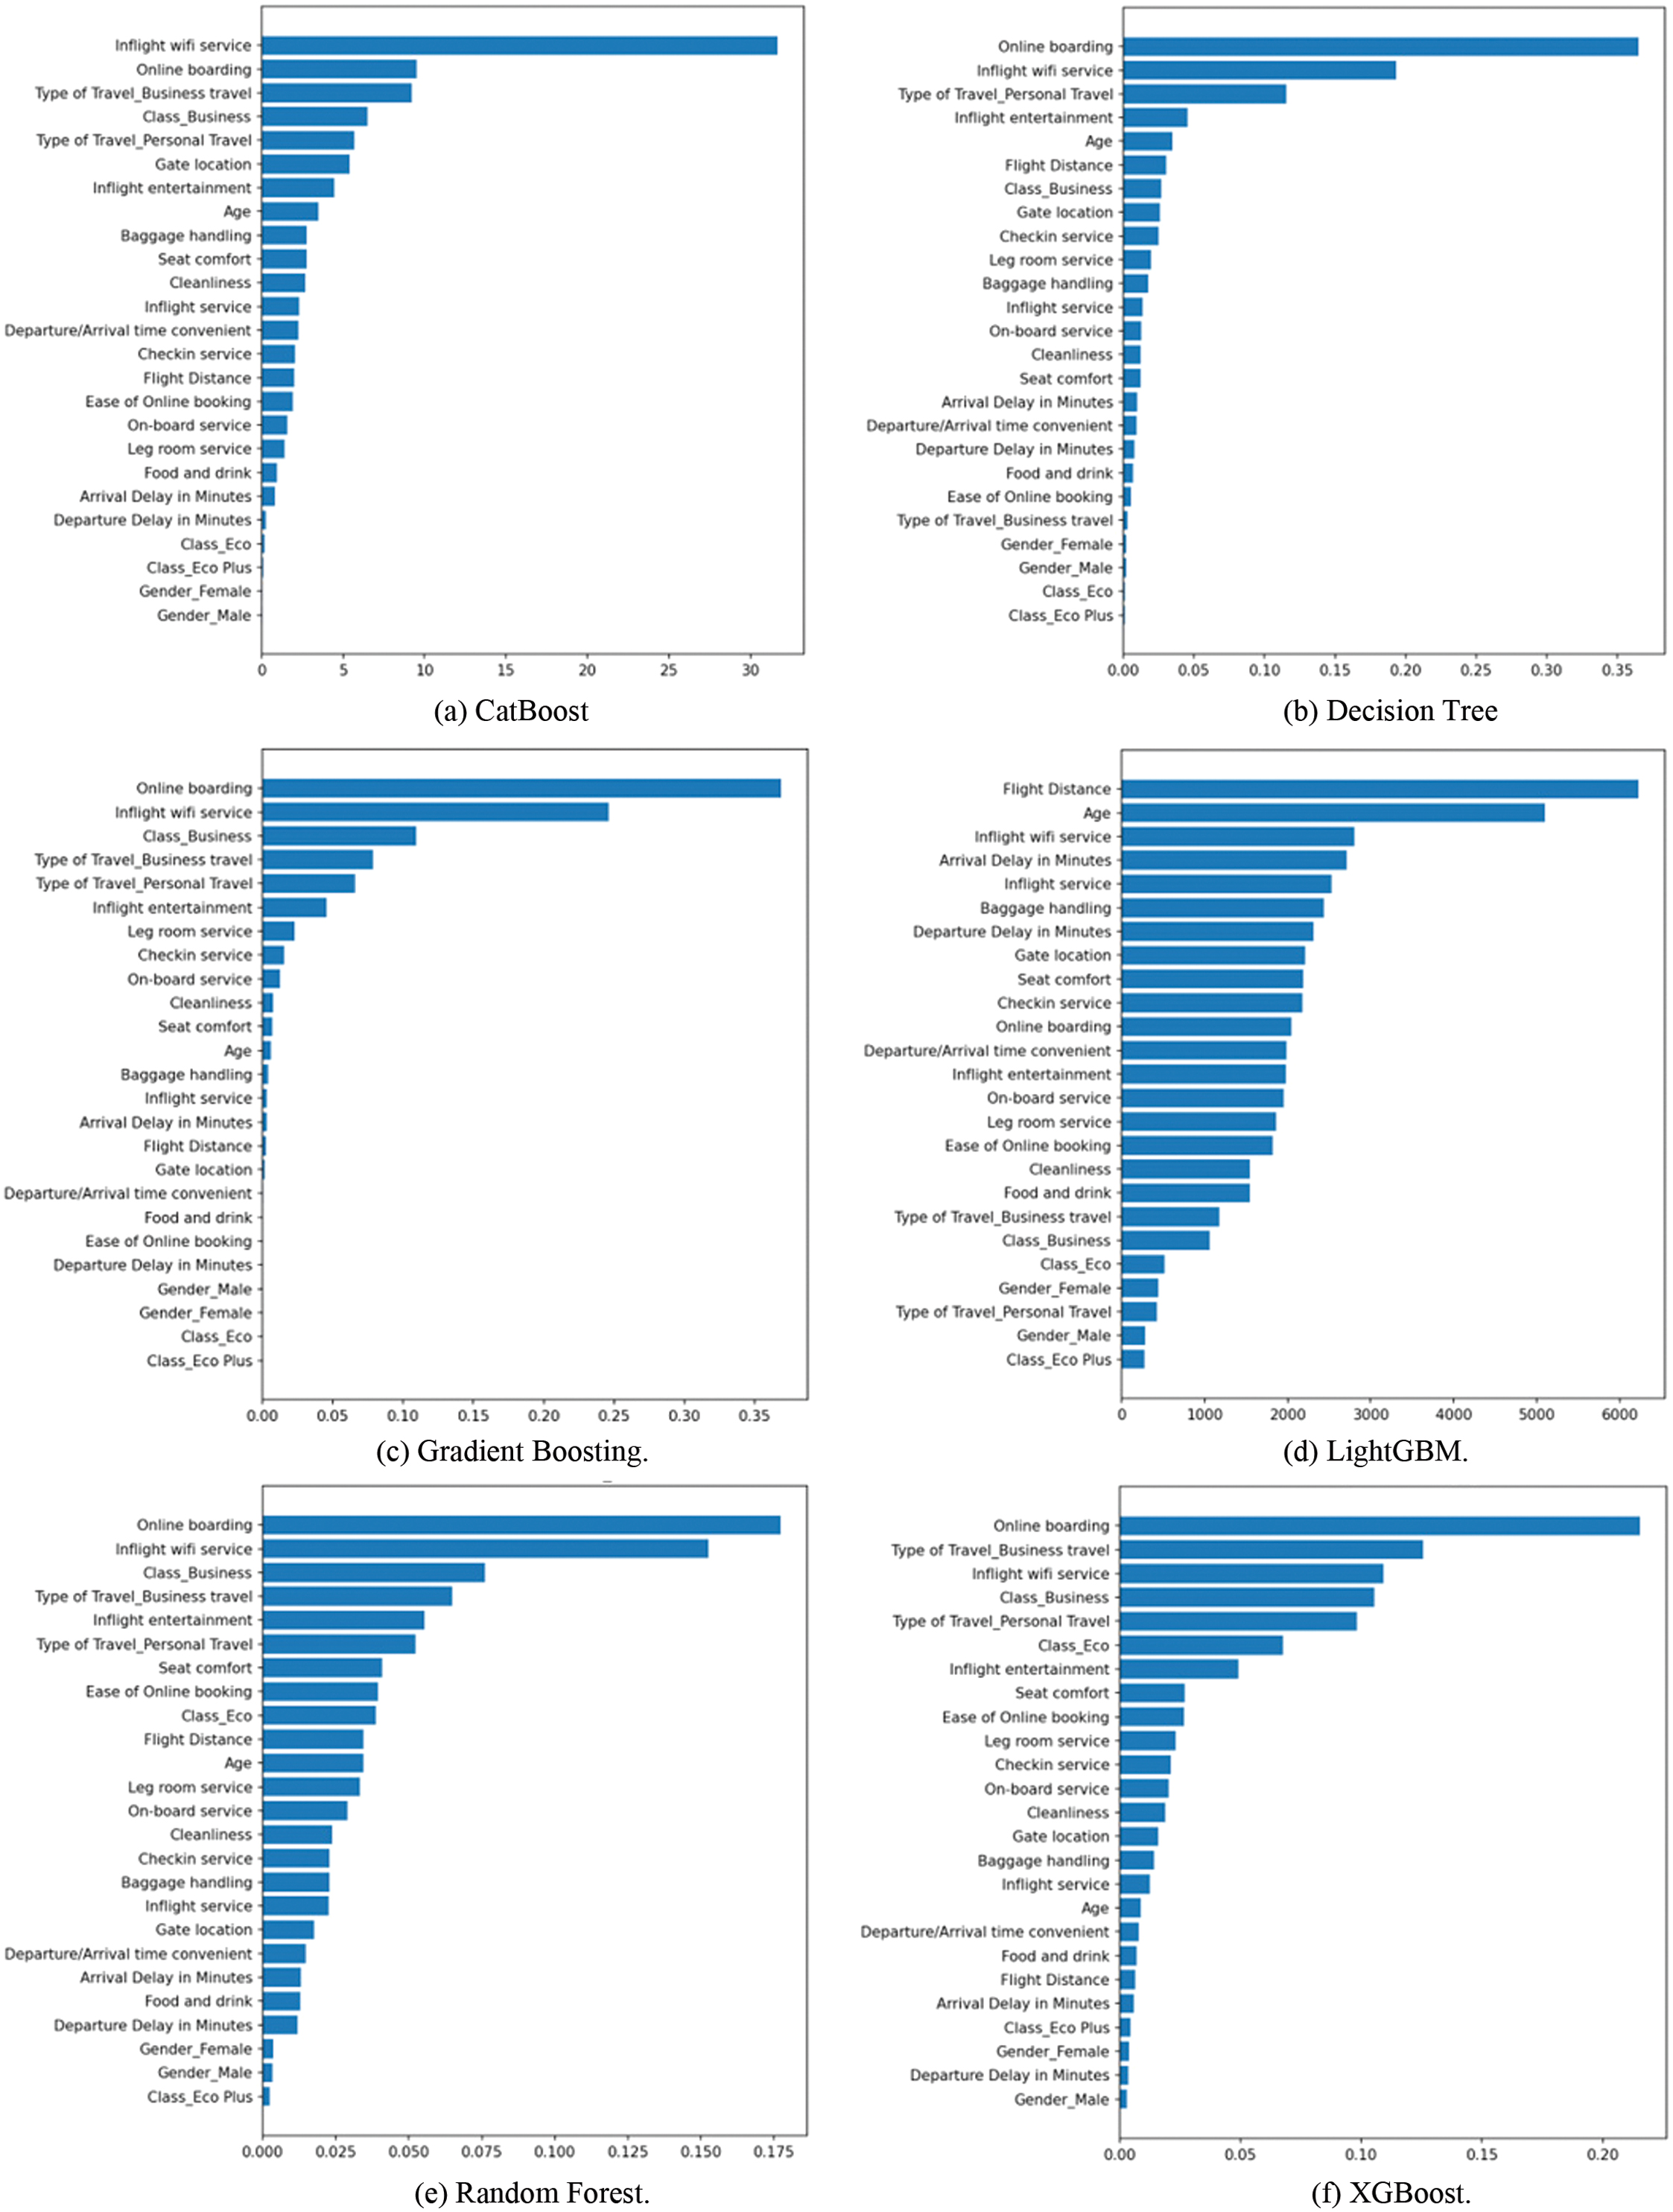 Fig. 2. Gain-based feature importance across models (a–f): (a) CatBoost, (b) Decision Tree, (c) Gradient Boosting, (d) LightGBM, (e) Random Forest, and (f) XGBoost.
Another consistent pattern is the strong influence of travel context and cabin class, particularly the features Type of Travel_Business and Class_Business. These variables capture the importance of travel purpose and seating class, showing that passengers on business trips or in higher service classes tend to exhibit distinct satisfaction dynamics. Meanwhile, service-related factors such as in-flight entertainment, seat comfort, cleanliness, and baggage handling appear repeatedly among the higher-ranked variables, though they contribute less relative to Wi-Fi and boarding. Their presence reflects traditional aspects of service quality that remain relevant to passenger perception, even if they do not dominate model decisions.
An interesting deviation is observed in LightGBM, which distributes importance more evenly across features compared to other ensemble models. In this case, flight distance and age rank at the top, suggesting that satisfaction is shaped not only by service touchpoints but also by contextual factors related to journey length and passenger demographics. Taken together, the gain-based analysis confirms that digital connectivity and operational efficiency remain the strongest drivers of satisfaction, but it also emphasizes the contextual role of passenger profile and journey characteristics. These findings suggest that while airlines must prioritize investments in Wi-Fi infrastructure and efficient boarding systems, sustained improvements in comfort, cleanliness, and service quality will remain essential to meeting diverse passenger expectations.
3).SHAP
SHAP values are grounded in cooperative game theory and provide a unified framework for feature attribution. Each prediction is decomposed into additive contributions from individual features, quantifying how much each variable pushes the prediction toward satisfaction or dissatisfaction [40]. Unlike global methods, SHAP provides both local interpretability (explanations for individual predictions) and global insights (average contributions across the dataset). This dual perspective makes SHAP particularly powerful for airline applications, as it not only identifies which features are most influential overall but also clarifies why specific passengers are classified in particular ways. By triangulating evidence across methods, the study ensures that the identified drivers of satisfaction are not artifacts of a single algorithm but represent consistent and meaningful patterns across models.
Figure 3a–3h summarize SHAP-based importances: bar charts (a–d) and beeswarm distributions (e–h) across gradient boosting ensembles (CatBoost, LightGBM, XGBoost, and Gradient Boosting). The bar plots provide a global ranking of features based on their average contribution (mean absolute SHAP value), while the beeswarm plots reveal the distribution of individual impacts, capturing both directionality (positive vs. negative influence) and variability across passengers.
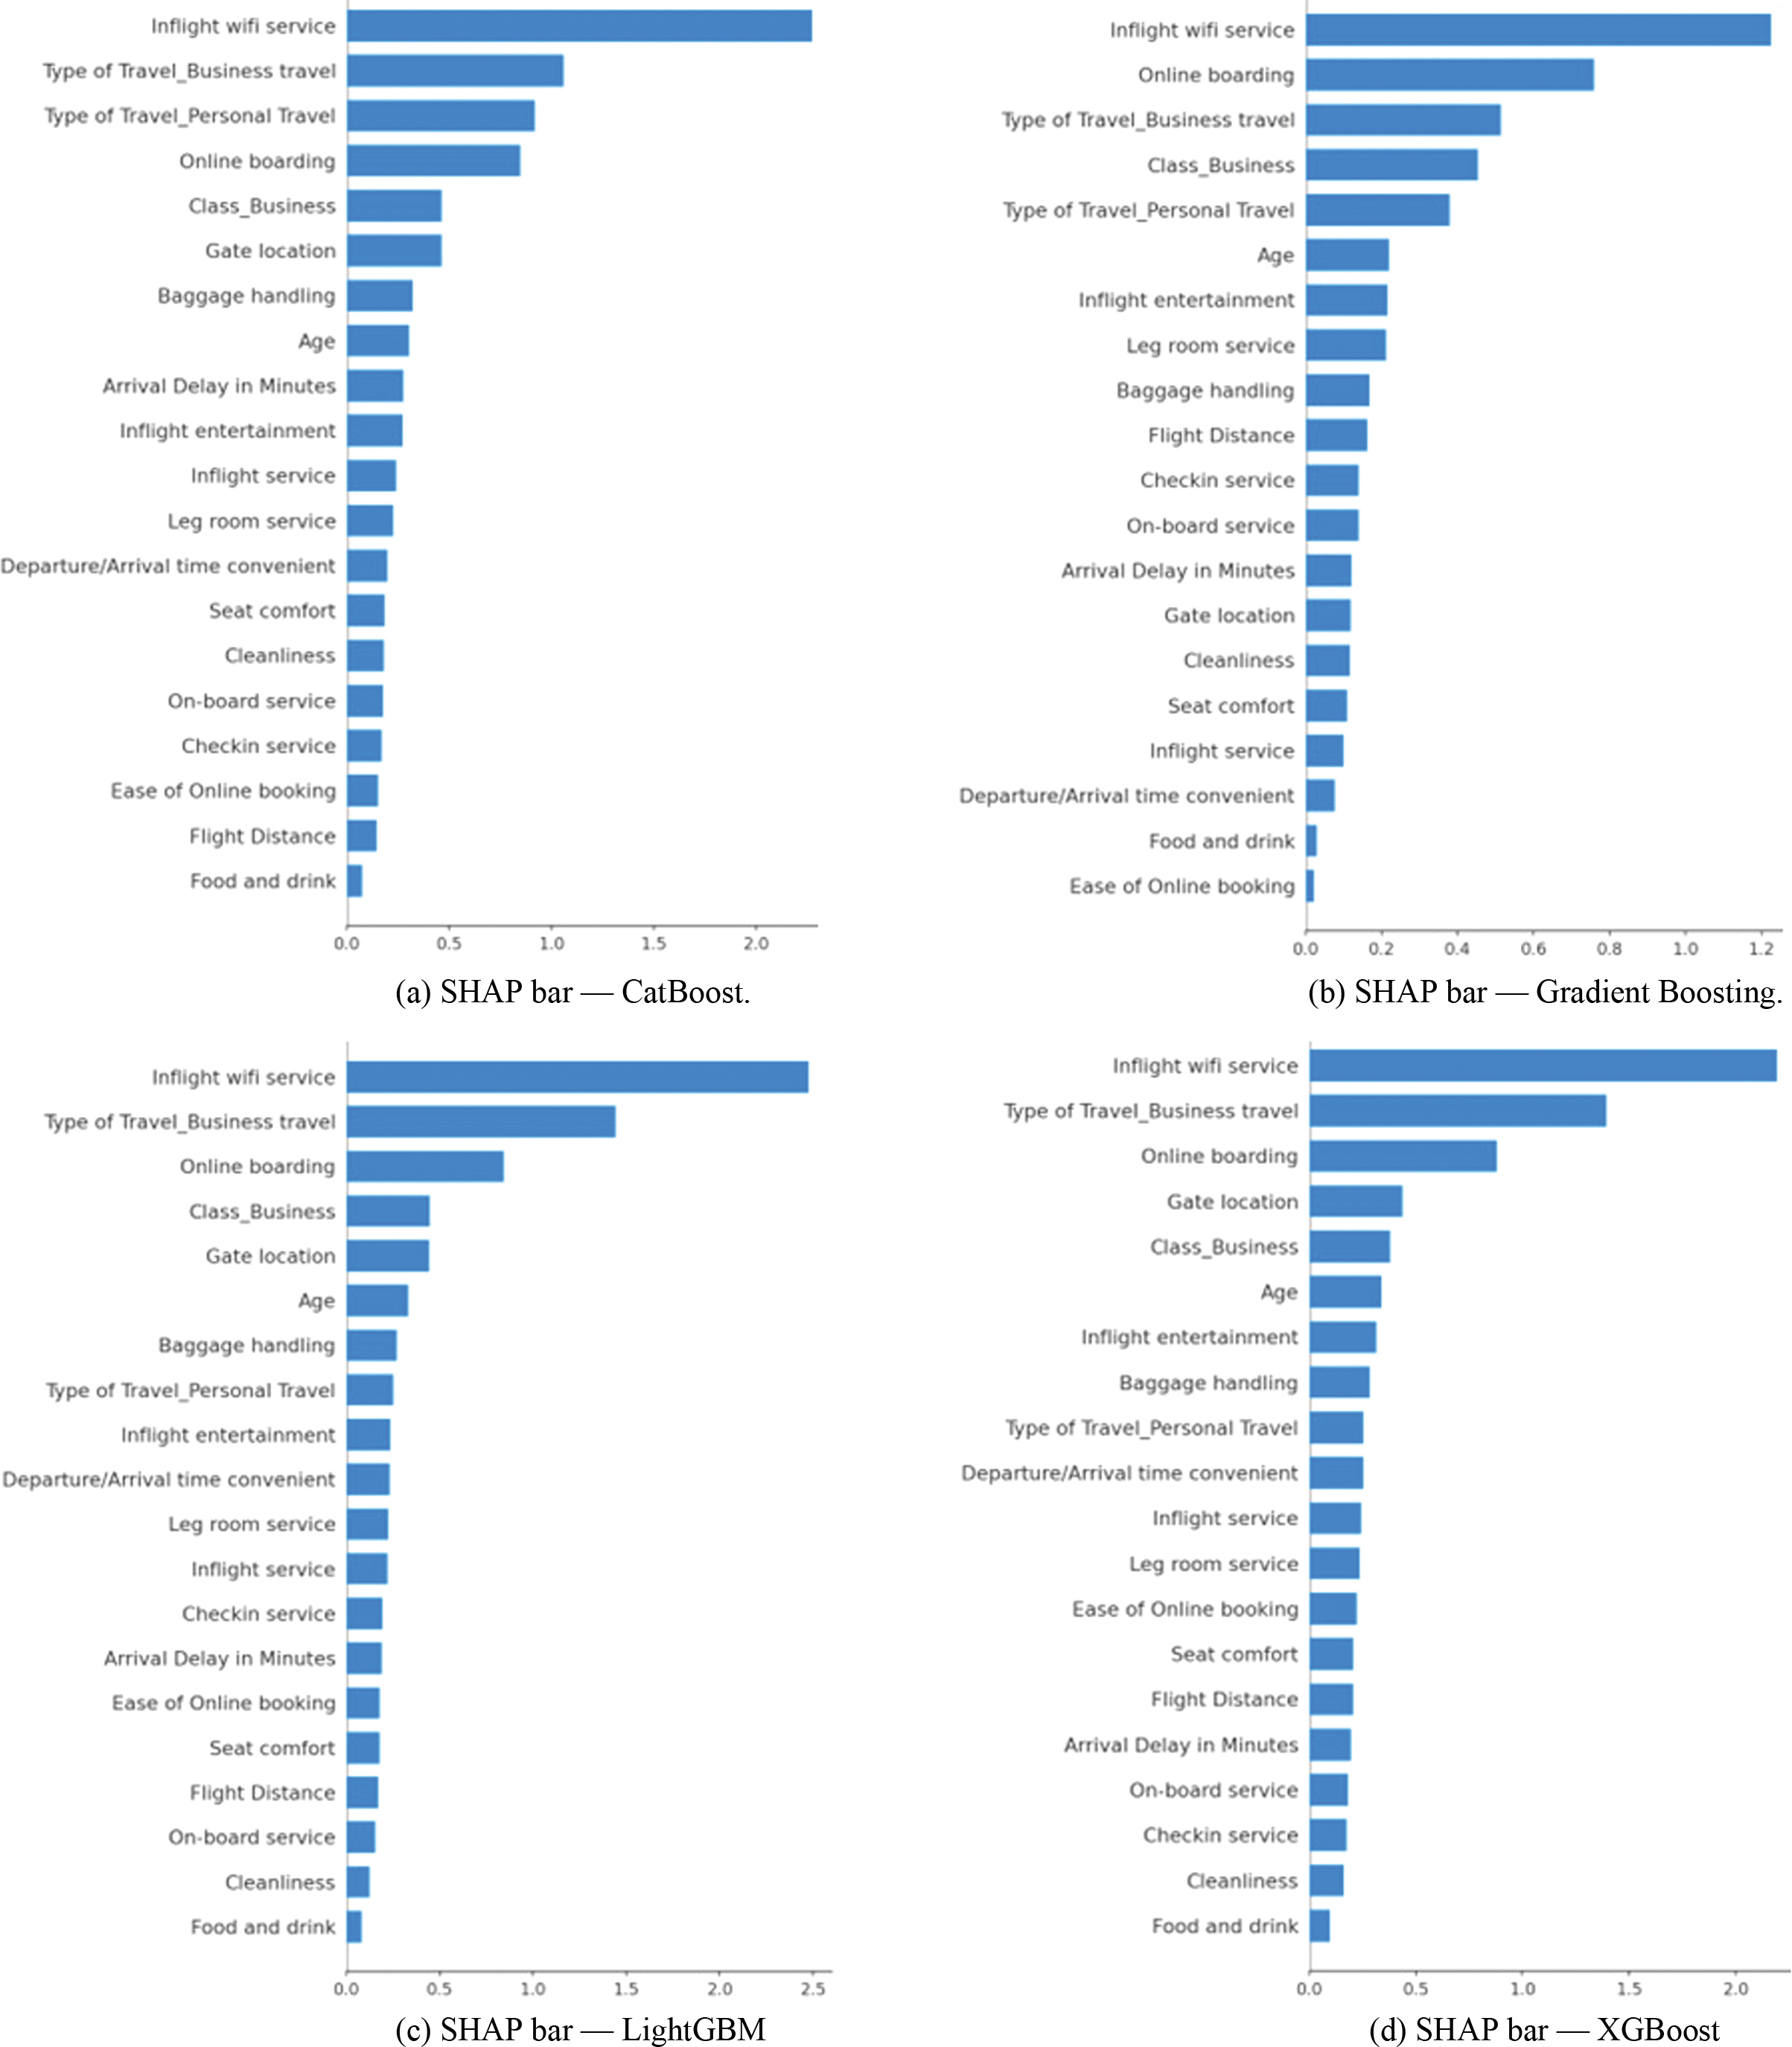 Fig. 3. SHAP-based feature importance across models (a–h): (a) SHAP bar—CatBoost; (b) SHAP bar—Gradient Boosting; (c) SHAP bar—LightGBM; (d) SHAP bar—XGBoost; (e) SHAP beeswarm—CatBoost; (f) SHAP beeswarm—Gradient Boosting; (g) SHAP beeswarm—LightGBM; and (h) SHAP beeswarm—XGBoost.
In the SHAP beeswarm plots, each point represents an individual passenger instance. The horizontal position indicates the magnitude and direction of the feature’s impact on the prediction, while colors represent the feature value ranging from low (blue) to high (red). Features appearing at the top have the greatest overall influence on passenger satisfaction predictions.
Across all models, in-flight Wi-Fi service emerged as the most influential predictor of satisfaction, consistently exhibiting the largest SHAP values. This indicates that passengers’ ratings of onboard connectivity strongly shift predictions toward satisfaction when high and toward dissatisfaction when low.
The second tier of importance is represented by online boarding and type of travel (business vs. personal), which together highlight the operational efficiency and travel purpose as key drivers of satisfaction. Specifically, smoother boarding experiences push predictions toward satisfaction, while challenges or delays lower the predicted likelihood of a positive outcome. Similarly, business travelers generally exhibit higher sensitivity to service quality, explaining their prominence in the rankings.
Other features that repeatedly appeared as influential across models include class (business vs. economy), age, and several service-related attributes such as in-flight entertainment, seat comfort, baggage handling, and gate location. These results emphasize that, beyond digital connectivity and boarding processes, passengers continue to value traditional service aspects and comfort-related features.
The beeswarm plots further clarify the directional influence of features. For example, high values of in-flight Wi-Fi ratings (in red) consistently push predictions toward satisfaction, while low ratings (in blue) drive predictions toward dissatisfaction. Similar patterns are observed for online boarding and in-flight entertainment, where positive evaluations markedly increase predicted satisfaction probabilities. In contrast, factors such as age and flight distance show more nuanced and scattered effects, indicating that their influence varies substantially across different passenger segments.
Taken together, the three techniques, permutation, gain-based, and SHAP, converge on a consistent conclusion: passenger satisfaction is predominantly driven by digital connectivity and the efficiency of operational processes. In-flight Wi-Fi service stands out as the most decisive factor, closely followed by online boarding, both of which strongly shape perceptions of convenience and service quality. Alongside these, traditional attributes such as seat comfort, cleanliness, baggage handling, and in-flight entertainment repeatedly emerge across models, underscoring their enduring importance in shaping the overall passenger experience.
V.CONCLUSION
This study demonstrated how machine learning could effectively unravel the drivers of airline passenger satisfaction, combining predictive accuracy with actionable business insights by leveraging a real-world dataset, applying a broad spectrum of machine learning models, and systematically comparing their predictive performance. Beyond benchmarking models through multiple evaluation metrics, the analysis emphasized the service attributes most strongly associated with passenger satisfaction. Across all methods, in-flight Wi-Fi service and online boarding consistently emerged as the most decisive factors, while traditional dimensions such as seat comfort, cleanliness, baggage handling, and in-flight entertainment maintained a critical role in shaping overall passenger experience. These results not only validate the power of machine learning for understanding customer perceptions but also offered actionable insights that airlines could directly translate into service improvements, customer loyalty, and profitability.
Future research will extend this framework by linking passenger satisfaction with churn prediction, exploring how service experiences influence not only immediate perceptions but also long-term loyalty and retention. Integrating satisfaction modeling with churn analysis will provide airlines with a more holistic perspective on customer behavior and support data-driven strategies for sustainable growth.
Despite the strong predictive performance achieved in this study, several limitations should be acknowledged. First, the dataset is limited to survey responses collected from US-based airlines, which may affect the generalizability of the findings to other cultural and regional aviation contexts. Second, the dataset represents passengers’ perceptions at a single point in time and does not capture longitudinal changes in satisfaction behavior. Third, although multiple explainable AI techniques were applied, the analysis remains dependent on the quality and completeness of the available survey attributes. Future research may extend this work by incorporating real-time behavioral data, multi-regional datasets, and longitudinal passenger feedback to enhance the robustness and generalizability of the findings.