I.INTRODUCTION
Childhood stunting remains a major global public health challenge because of its long-term impact on physical growth, cognitive development, and future socioeconomic well-being. The condition is commonly associated with chronic malnutrition and recurrent infections occurring during the first 1,000 days of life, often resulting in impaired child growth and developmental limitations [1]. Multiple biological, environmental, and socioeconomic factors contribute simultaneously to stunting risk, making early identification increasingly difficult in preventive healthcare systems [2,3].
Because these contributing factors frequently interact through complex nonlinear relationships, conventional statistical approaches often encounter limitations in identifying hidden predictive patterns. For this reason, machine learning has increasingly been applied to healthcare prediction problems, where data-driven computational approaches allow more effective identification of complex relationships among predictive variables [4].
Previous studies have reported promising results when machine learning algorithms were applied to childhood stunting prediction using anthropometric and demographic variables [5,6]. Machine learning-based prediction has become particularly attractive in healthcare applications because complex interactions among clinical variables often cannot be adequately represented using traditional statistical modeling approaches. In preventive child healthcare systems, early identification of children at high risk remains essential because delayed intervention may contribute to long-term developmental consequences.
Although strong predictive performance can be achieved using machine learning methods, classification performance remains highly dependent on methodological design. Conventional hyperparameter optimization approaches such as grid search and random search often become computationally inefficient when large parameter spaces must be explored systematically [7]. More recently, automated optimization frameworks such as Optuna have demonstrated improved search efficiency through adaptive Tree-structured Parzen Estimator (TPE) optimization while maintaining competitive predictive performance [8]. In parallel, ensemble learning approaches have been widely adopted to improve predictive reliability by combining multiple classifiers through probabilistic aggregation and weighted voting mechanisms [9,10].
Recent machine learning research increasingly emphasizes integrated predictive frameworks that combine automated optimization strategies, ensemble learning techniques, and evaluation protocols capable of measuring model stability under repeated experimental conditions. Despite these methodological advances, several limitations remain evident in existing childhood stunting prediction studies. Most previous studies primarily emphasize predictive accuracy improvement, while model robustness, performance stability, and evaluation reliability under repeated experimental conditions remain relatively underexplored. Model selection is also commonly determined using single-metric evaluation, despite the importance of balanced multi-metric assessment under imbalanced classification conditions. In addition, robustness analysis and formal statistical validation are still rarely incorporated during classifier selection and ensemble construction.
Reliable evaluation protocols are particularly important in healthcare-related machine learning applications because reported performance estimates may become overly optimistic when experimental procedures are not properly isolated. More reliable performance estimation can generally be obtained when repeated Monte Carlo evaluation is applied, particularly when dependence on a single train-test partition must be reduced during model evaluation [11]. In addition, methodological reliability has become increasingly important because performance reported under limited experimental settings may not adequately reflect true generalization capability when predictive systems are deployed under real-world healthcare conditions. Consequently, a more comprehensive predictive framework is needed to ensure not only strong predictive performance but also reliable model selection, performance robustness, and statistically validated experimental outcomes.
Based on the literature reviewed in this study, research integrating automated hyperparameter optimization, repeated Monte Carlo evaluation, composite score-based classifier selection, robustness analysis, weighted ensemble learning, and formal statistical validation remains relatively limited within childhood stunting prediction studies. Motivated by this gap, an integrated machine learning framework was developed in this work by combining Optuna-based TPE optimization, repeated Monte Carlo evaluation, composite score-based ranking, robustness analysis using standard deviation and confidence interval estimation, and weighted soft voting ensemble learning.
This study provides several methodological contributions. First, automated hyperparameter optimization using Optuna-TPE was applied across multiple candidate classifiers. Second, repeated Monte Carlo evaluation was incorporated to assess predictive consistency under varying data partitions. Third, a composite score framework consisting of multiple evaluation metrics was introduced to support balanced classifier selection. Fourth, robustness analysis based on standard deviation and 95% confidence interval estimation was incorporated to evaluate performance stability. Finally, weighted soft voting ensemble learning was implemented to improve predictive robustness and overall classification performance.
The remainder of this paper is organized as follows. Section II presents the proposed methodology. Section III discusses experimental results and analysis. The final section summarizes the conclusions and future research directions.
II.METHODOLOGY
A.DATASET DESCRIPTION
The dataset used in this study was obtained from a publicly accessible Kaggle repository developed for childhood stunting prediction. The dataset contains 10,000 observations consisting of demographic and anthropometric information related to child growth assessment. To support reproducibility, the dataset is publicly available at: https://www.kaggle.com/datasets/harnelia/faktor-stunting.
The prediction task was formulated as a binary classification problem consisting of two classes, namely stunted (Label = 1) and non-stunted (Label = 0), where the target variable represents the growth condition assigned to each child record.
Four predictor variables were utilized during model development, namely Body Weight (kg), Age (months), Birth Weight (kg), and Body Length (cm). These variables were selected because they represent clinically relevant anthropometric indicators associated with child growth conditions, while preliminary feature importance analysis was performed to identify the most relevant predictive attributes. Anthropometric measurements were prioritized because previous pediatric growth assessment studies consistently identify body weight, body length, and birth-related measurements as strong indicators associated with nutritional status and developmental outcomes. Age was additionally incorporated because child growth patterns naturally vary across developmental stages, making age-related information important for improving predictive discrimination.
Before model development, records containing missing values were removed using a Drop-NaN cleaning procedure. Additional screening was subsequently performed to identify invalid observations before the experimental process was initiated.
Since source-level metadata required for independent external validation was unavailable, repeated Monte Carlo evaluation was incorporated to improve reliability of internal performance estimation under multiple random data partitions [11].
B.DATA PREPROCESSING
The dataset used in this study was obtained from a publicly accessible Kaggle repository developed for childhood stunting prediction. The dataset consists of 10,000 observations containing demographic and anthropometric information related to child growth assessment. The prediction task was formulated as a binary classification problem in which the target variable “stunting” was defined according to World Health Organization (WHO) child growth standards. Children were categorized as stunted (Label = 1) when height-for-age Z-score was recorded below −2 standard deviations from the WHO reference median, whereas non-stunted children were assigned as normal (Label = 0).
Four anthropometric predictor variables were utilized during model development, namely Age (months), Body Length (cm), Body Weight (kg), and Birth Weight (kg). These variables were selected because standardized medical measurements are widely recognized as clinically relevant indicators associated with nutritional status and early childhood growth conditions.
Prior to model development, missing values contained in the original dataset were completely removed during data cleaning. Additional plausibility checks were subsequently applied to identify and eliminate biologically implausible observations and abnormal outlier values that could potentially introduce bias during model training. Since clinical prediction systems require reliable performance under imbalanced data conditions, class imbalance handling was incorporated using SMOTE implemented strictly within a leak-free imbalanced-learn pipeline [12].
Independent external validation was not feasible because institutional metadata and source-level information were unavailable in the secondary public dataset. To compensate for this limitation, model robustness was evaluated using repeated Monte Carlo experimentation involving 100 independent random splits performed on previously unseen test subsets. The resulting narrow 95% confidence intervals obtained from repeated large-scale simulations provided strong internal validation evidence, indicating stable and robust predictive behavior under repeated experimental conditions while supporting future prospective validation using hospital-based clinical data.
C.EXPERIMENTAL WORKFLOW
The overall experimental framework adopted in this study is presented in Fig. 1. The proposed methodology was organized into two sequential stages consisting of standalone model evaluation and weighted ensemble construction. The first stage focused on comparative evaluation of individual classifiers, whereas the second stage examined the effectiveness of the proposed ensemble framework. This design was intended to ensure reliable model selection while maintaining methodological consistency throughout the complete modeling process.
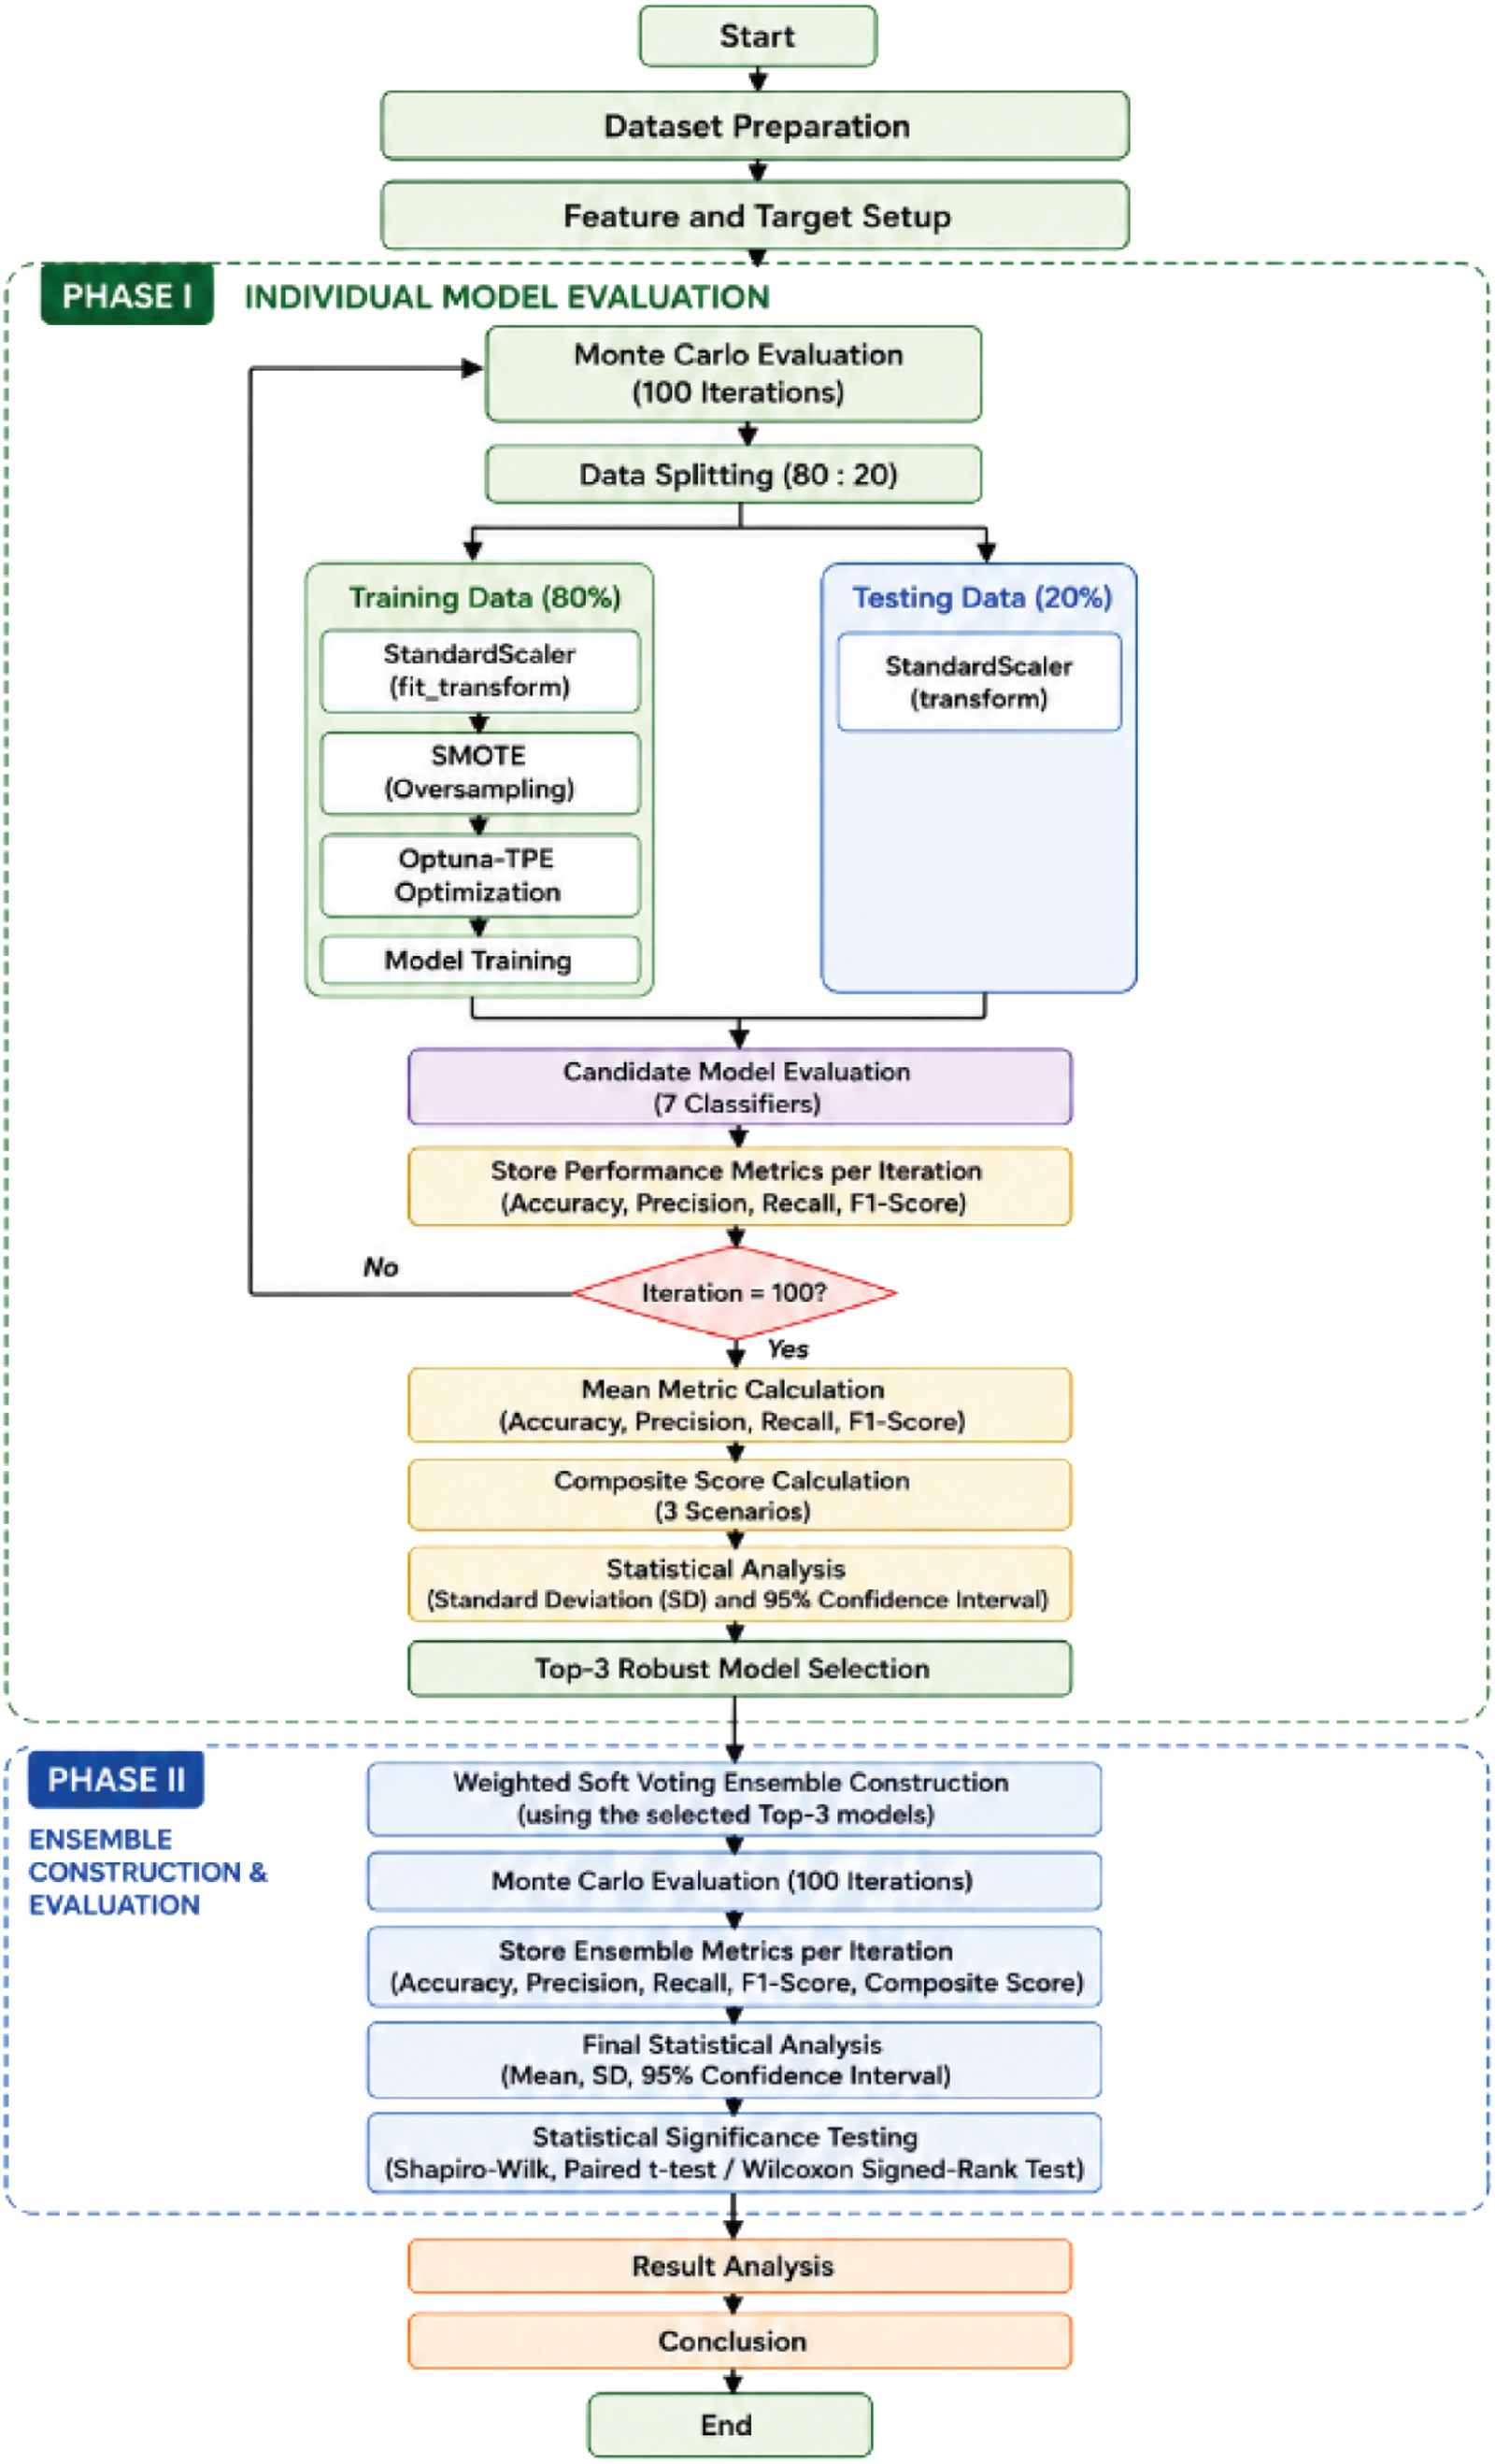 Fig. 1. Experimental workflow of the proposed Optuna-TPE and weighted soft voting framework.
A repeated Monte Carlo evaluation strategy involving 100 independent iterations was employed throughout experimentation [11]. During each iteration, the dataset was randomly divided into training (80%) and testing (20%) subsets. All preprocessing procedures described previously were subsequently applied, where data transformation parameters were learned exclusively from the training subset. Hyperparameter optimization using Optuna-TPE was then performed only on the training subset, while the testing subset was strictly reserved for final performance evaluation and remained completely unseen during the optimization process. After the optimal hyperparameter configuration had been obtained, model training was finalized and predictive performance was evaluated on the independent testing subset.
During the first experimental phase, seven candidate classifiers were optimized using the Optuna-based TPE algorithm [8]. Following hyperparameter optimization, model training and testing procedures were conducted under identical experimental conditions. Performance results obtained from each iteration were recorded using Accuracy, Precision, Recall, and F1-score.
The repeated evaluation results were subsequently aggregated to calculate mean values, standard deviation (SD), and 95% confidence interval (CI) for each performance metric. Composite scores were then calculated using three weighting scenarios to examine ranking consistency under different metric priorities. This robustness analysis was incorporated to ensure that model selection considered not only predictive capability but also statistical stability across repeated experimental conditions. Classifiers identified through this selection procedure were subsequently used for ensemble construction.
The second experimental phase focused on weighted soft voting ensemble evaluation using the top-performing classifiers selected during the previous phase. Voting weights were assigned proportionally according to the mean accuracy achieved by each standalone classifier [13]. The proposed ensemble model subsequently underwent an additional 100 Monte Carlo iterations under the same experimental protocol. Final ensemble performance was evaluated using Accuracy, Precision, Recall, F1-score, and composite score.
Finally, statistical significance testing was performed to determine whether the improvement achieved by the proposed ensemble framework represented genuine methodological advancement rather than random variation introduced during repeated experimentation. Statistical comparison was subsequently conducted between the ensemble results and the strongest standalone classifiers obtained during the first evaluation phase, ensuring reliable and reproducible experimental validation throughout the study.
D.HYPERPARAMETER OPTIMIZATION USING OPTUNA-TPE
Hyperparameter optimization was incorporated as an essential stage of model development because predictive performance in machine learning classification is strongly influenced by parameter configuration. Parameters such as tree depth, learning rate, number of estimators, neighborhood size, and network architecture directly affect classification capability and model generalization. Consequently, systematic optimization procedures were required to reduce dependence on manually defined parameter settings and improve overall model reliability [14].
To perform automated hyperparameter search, the Optuna optimization framework was adopted in this study. The TPE algorithm was utilized as the primary search strategy because parameter exploration can be guided adaptively using information obtained from previously evaluated trials. Compared with conventional search approaches, this strategy allows promising regions of the hyperparameter space to be explored more efficiently while maintaining competitive predictive performance [8]. Adaptive search mechanisms are particularly advantageous when optimization must be conducted across heterogeneous classifiers requiring substantially different parameter configurations.
The same optimization framework was consistently applied across all candidate classifiers to ensure fair methodological comparison. Through this approach, each classifier was allowed to identify its optimal parameter configuration under identical optimization conditions before subsequent model training and performance evaluation were conducted.
To improve methodological transparency, hyperparameter optimization was conducted using the Optuna framework based on the TPE search strategy. For each candidate classifier, a predefined search space was constructed prior to optimization. To improve methodological transparency, hyperparameter optimization was conducted using the Optuna framework based on the TPE search strategy. A predefined search configuration was prepared prior to optimization for each candidate classifier. As a representative example, the K-Nearest Neighbors classifier was optimized by exploring multiple hyperparameter configurations consisting of n_neighbors ranging from 3 to 25, neighborhood search algorithm options (auto, ball_tree, kd_tree, brute), leaf_size ranging from 10 to 100, and distance metric alternatives including euclidean, manhattan, and minkowski. This configuration illustrates the automated search strategy used during model optimization while reducing dependence on manually predefined parameter selection.
E.WEIGHTED SOFT VOTING ENSEMBLE FRAMEWORK
An ensemble learning framework based on weighted soft voting was adopted to combine the predictive capability of multiple classifiers within a unified decision-making system. Ensemble-based classification has been widely applied to improve predictive robustness by combining multiple machine learning models within a unified decision framework [15]. Unlike single-model classification, prediction outputs generated by different classifiers can be aggregated, thereby improving classification reliability while reducing dependence on individual model limitations [9].
The ensemble framework was constructed using classifiers obtained from the previous model evaluation stage. Voting weights were assigned proportionally according to the mean accuracy achieved by each selected classifier. Prior to ensemble construction, classifier ranking had been evaluated using composite score calculation under three weighting scenarios in order to examine ranking consistency under different metric priorities.
The weight assigned to each classifier was calculated using the ratio between its mean accuracy and the total mean accuracy obtained from all selected classifiers. The weight assignment procedure can be defined as in Equation 1). The weighting mechanism was incorporated to ensure that classifiers demonstrating stronger standalone predictive performance contributed proportionally more during final ensemble decision generation, while weaker classifiers retained complementary predictive contribution:
where () represents the voting weight assigned to classifier (), () denotes the mean accuracy obtained by classifier (), and () represents the total number of classifiers integrated into the ensemble framework [13].After weight assignment had been completed, class probability outputs generated by individual classifiers were aggregated using the weighted voting mechanism. Final class prediction was subsequently determined according to the class associated with the highest aggregated probability value [10]. Through this approach, stronger classifiers were allowed to contribute proportionally more during final prediction generation while preserving probabilistic information from heterogeneous learning models.
F.STATISTICAL SIGNIFICANCE ANALYSIS AND EXPERIMENTAL CONFIGURATION
Statistical significance analysis was performed to determine whether the performance improvement achieved by the proposed weighted soft voting ensemble represented genuine methodological advancement rather than variation introduced during repeated experimentation. Statistical comparison was conducted between performance results produced by the proposed ensemble framework and the corresponding standalone model results obtained under identical repeated evaluation conditions.
Paired performance values generated across repeated Monte Carlo evaluation were used during comparative analysis. Prior to statistical testing, normality assessment was performed on the distribution of paired performance differences using the Shapiro–Wilk normality test [16]. This preliminary analysis was required to determine whether the normality assumption necessary for parametric testing procedures was satisfied.
When the paired performance differences satisfied the normality assumption, statistical comparison was performed using the paired t-test. Conversely, when the normality assumption was not satisfied, the non-parametric Wilcoxon Signed-Rank test was applied as an alternative statistical procedure. Through this approach, observed performance differences were evaluated statistically to determine whether the improvement achieved by the proposed framework remained consistent across repeated experimental evaluation.
All experiments were implemented using Python 3.10 within the Google Colab Pro computational environment. The experimental environment consisted of an Intel Xeon processor, 16 GB RAM, NVIDIA T4 GPU, and Ubuntu 22.04 operating system. Scikit-learn (v1.2.2), Optuna (v3.1.0), XGBoost (v1.7.5), LightGBM (v3.3.5), and Imbalanced-learn (v0.10.1) were used throughout experimentation. To improve reproducibility, fixed random seeds ranging from 1 to 100 were consistently applied across all repeated Monte Carlo iterations while maintaining identical experimental conditions throughout the study.
The incorporation of formal statistical testing together with a controlled experimental environment strengthened methodological reliability by ensuring that reported performance improvement was supported by both numerical evaluation metrics and statistically validated experimental evidence.
III.RESULTS AND DISCUSSION
A.STANDALONE MODEL PERFORMANCE AND FEATURE ANALYSIS
The initial experimental phase focused on evaluating the predictive performance of seven candidate machine learning classifiers under repeated Monte Carlo experimentation. Each classifier was independently optimized using the Optuna-TPE framework and evaluated across 100 random iterations under identical experimental conditions. Performance was assessed using Accuracy, Precision, Recall, and F1-score to examine predictive consistency under varying data partitions.
The aggregated performance results are summarized in Table I. Among all candidate classifiers, KNN achieved the strongest overall predictive performance with mean accuracy of 0.9005, followed by Random Forest (RF) with 0.8834 and LightGBM (LGBM) with 0.8762. Similar performance patterns were consistently observed across Precision, Recall, and F1-score, indicating that these models demonstrated stronger classification capability compared with other candidate classifiers. In contrast, CNN1D produced the weakest performance with mean accuracy of 0.7955, suggesting that deep learning architecture may be less effective when applied to relatively low-dimensional structured healthcare datasets, where conventional machine learning models often demonstrate stronger predictive behavior [4].
Table I. Performance comparison of individual classifiers under repeated Monte Carlo evaluation
| Model | Accuracy | Precision | Recall | F1-Score |
|---|---|---|---|---|
| LightGBM | 0.9005 | 0.9063 | 0.9005 | 0.9026 |
| Random Forest | 0.8834 | 0.8789 | 0.8834 | 0.8802 |
| XGBoost | 0.8762 | 0.8698 | 0.8762 | 0.8705 |
| KNN | 0.8595 | 0.8528 | 0.8595 | 0.8549 |
| CNN | 0.8439 | 0.8492 | 0.8439 | 0.8462 |
| MLP | 0.8459 | 0.8332 | 0.8460 | 0.8285 |
| SVM-RBF | 0.7955 | 0.6328 | 0.7955 | 0.7049 |
In addition to predictive performance, model stability was evaluated through repeated experimentation. Relatively low variation was observed across conventional machine learning models, indicating stable predictive behavior under repeated random data partitioning. The consistently strong performance demonstrated by KNN, RF, and LGBM further justified their suitability for subsequent comparative evaluation and ensemble construction.
To improve interpretability and justify predictor selection during model development, feature importance analysis was performed using permutation feature importance based on RF evaluation, as illustrated in Fig. 2. The analysis showed that Body Weight contributed the strongest predictive influence, followed by Age, Birth Weight, and Body Length. These variables consistently demonstrated stronger predictive contribution compared with other candidate features, including Gender, Birth Length, and Breastfeeding History.
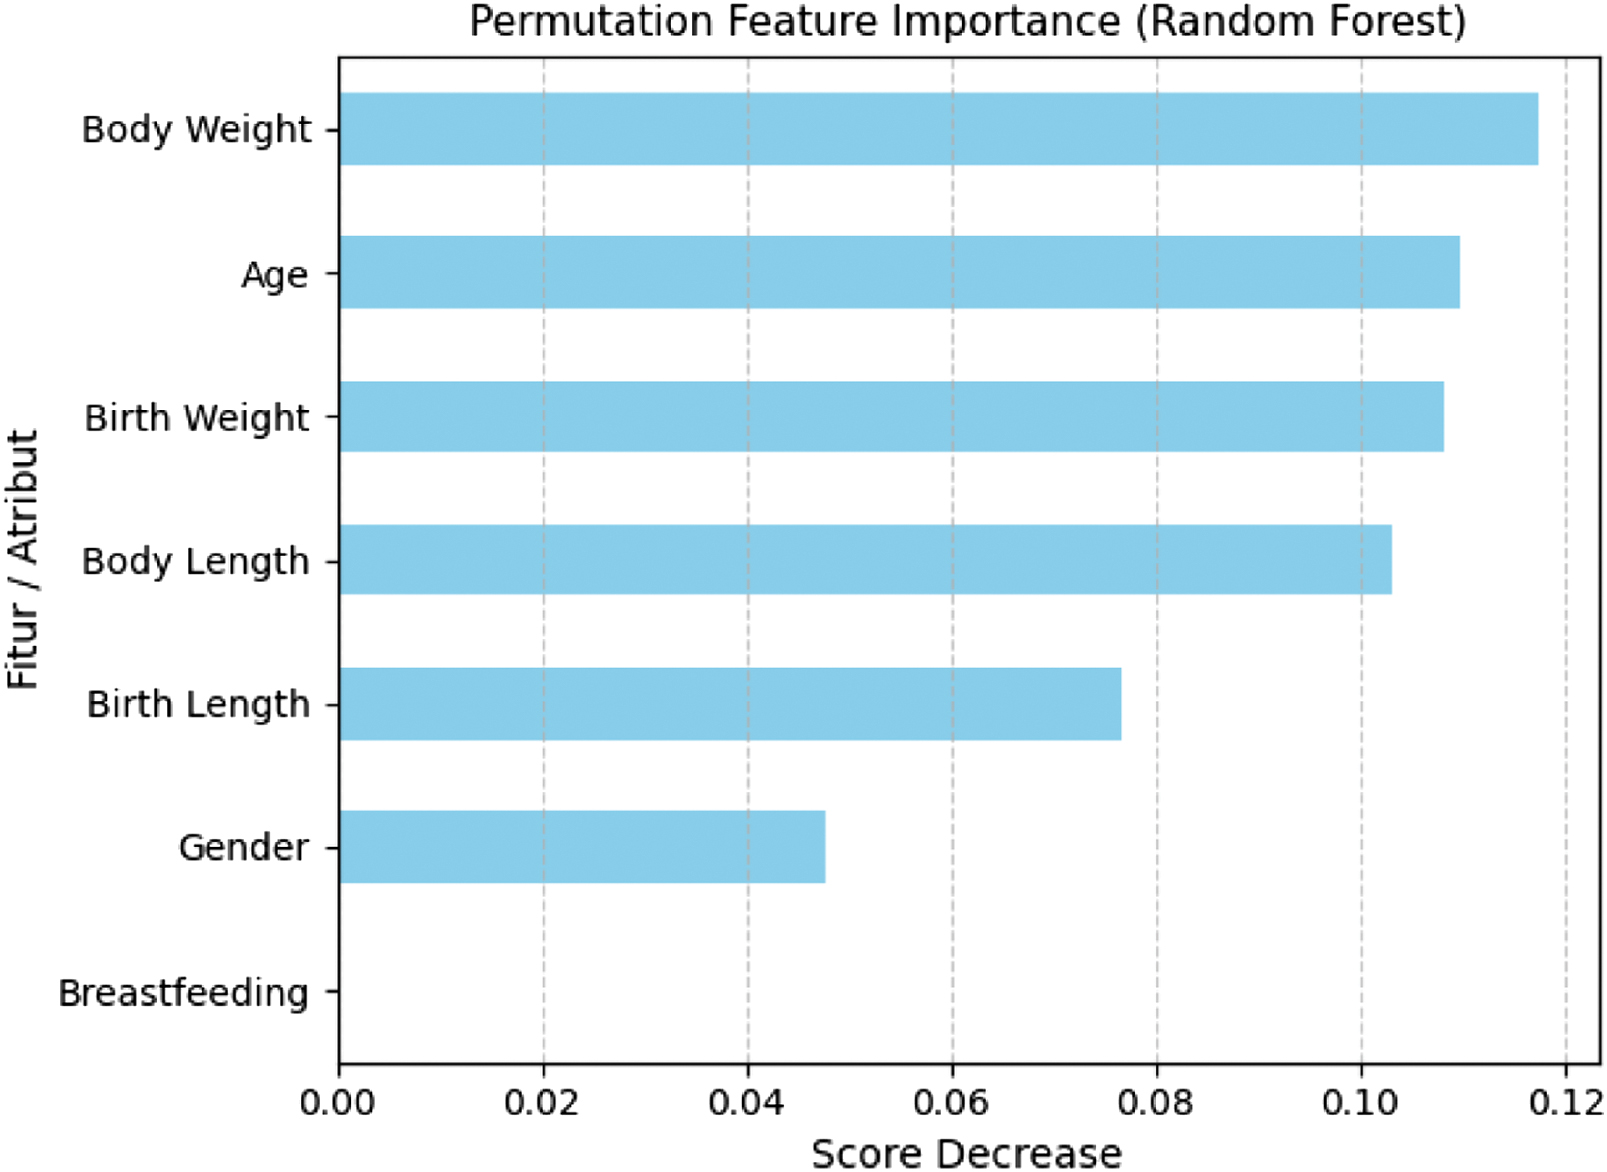 Fig. 2. Permutation feature importance ranking of predictor variables for stunting prediction.
Based on these observations, only four predictor variables were retained during subsequent modeling stages, namely Body Weight, Age, Birth Weight, and Body Length. This feature selection strategy was adopted to maintain model simplicity, improve interpretability, and support practical implementation in low-resource healthcare environments where rapid anthropometric screening is frequently required.
B.COMPOSITE SCORE ANALYSIS
To provide a more balanced evaluation framework, a composite score was introduced by aggregating Accuracy, Precision, Recall, and F1-score into a single performance indicator. This approach was adopted to reduce potential bias caused by relying exclusively on a single evaluation metric, particularly under imbalanced classification conditions where each metric reflects different predictive characteristics. All Precision, Recall, and F1-score values were calculated using weighted averaging to account for class distribution imbalance. The default composite score formulation is defined in Equation (2):
Equation (2) represents an equal-weight configuration in which all evaluation metrics contribute proportionally to the final composite score. Through this formulation, model performance can be evaluated more comprehensively by simultaneously considering classification correctness, prediction reliability, minority-class detection capability, and the balance between Precision and Recall.
The composite score results showed that KNN achieved the highest overall score, followed by RF and LGBM. This ranking pattern remained consistent with the standalone performance evaluation presented previously, indicating that these models maintained balanced predictive behavior across multiple classification metrics rather than performing strongly under only a single evaluation criterion.
To examine ranking consistency, sensitivity analysis was subsequently performed using two alternative weighting scenarios. Scenario A emphasized Recall and F1-score to prioritize minority-class detection capability, whereas Scenario B assigned dominant weighting to Accuracy to examine accuracy-oriented ranking behavior. These alternative weighting schemes were introduced exclusively to evaluate ranking stability and were not used during final model optimization. The alternative formulations are defined in Equations (3) and (4).
The comparative results under all weighting scenarios are illustrated in Fig. 3. Despite moderate changes in metric weighting composition, the overall ranking structure remained unchanged. KNN consistently maintained the highest composite score, while RF and LGBM continuously occupied the next strongest ranking positions.
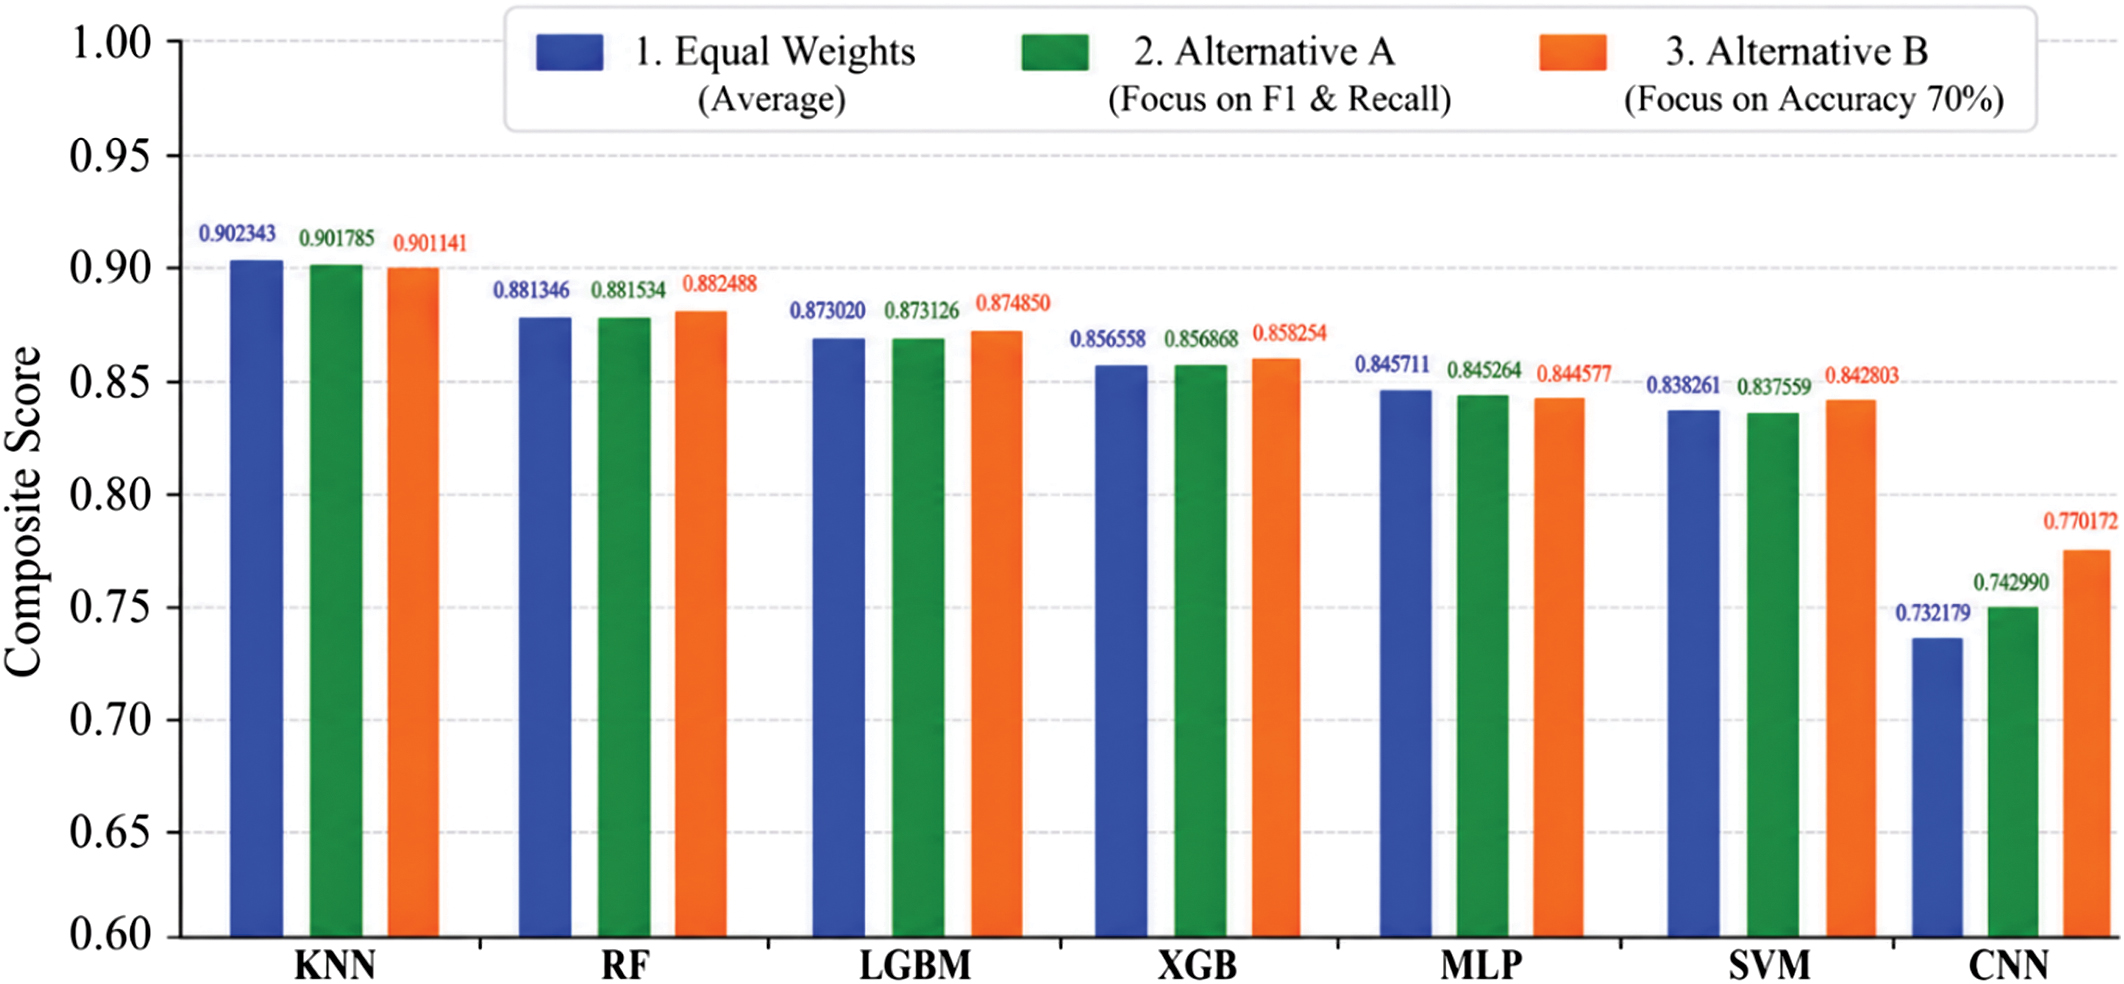 Fig. 3. Sensitivity analysis of composite score rankings under alternative weighting configurations.
The consistent ranking behavior observed across all weighting configurations indicates that the proposed model selection process remained robust against moderate changes in evaluation criteria, supporting previous studies emphasizing the importance of balanced multi-metric evaluation during model selection [17]. These findings demonstrate that classifier selection was determined by consistently strong predictive performance across multiple evaluation perspectives rather than being dominated by a single metric such as Accuracy alone.
C.WEIGHTED SOFT VOTING ENSEMBLE PERFORMANCE
After the strongest candidate classifiers had been identified through composite score evaluation and robustness analysis, a weighted soft voting ensemble framework was constructed using the selected models. Voting weights were assigned proportionally according to the mean accuracy achieved by each constituent classifier during the standalone evaluation phase. The ensemble model was subsequently evaluated using an additional 100 Monte Carlo iterations under the same experimental protocol applied previously.
The aggregated performance results obtained from repeated ensemble evaluation are summarized in Table II. The proposed weighted soft voting ensemble achieved a mean Accuracy of 0.9040, Precision of 0.8558, Recall of 0.8450, and F1-score of 0.8502. The resulting composite score reached 0.8637, indicating consistently strong predictive performance across multiple classification metrics.
Table II. Performance evaluation of the proposed weighted soft voting ensemble across repeated Monte Carlo iterations
| Metric | Mean | SD | 95% CI |
|---|---|---|---|
| Accuracy | 0.9040 | 0.0056 | [0.9029, 0.9051] |
| Precision | 0.8558 | 0.0092 | [0.8540, 0.8576] |
| Recall | 0.8450 | 0.0098 | [0.8431, 0.8469] |
| F1-Score | 0.8502 | 0.0089 | [0.8484, 0.8519] |
| Composite Score | 0.8637 | 0.0081 | [0.8621, 0.8653] |
Compared with the strongest standalone classifiers evaluated previously, the ensemble framework produced slightly higher predictive accuracy than KNN, which achieved mean accuracy of 0.9005 during standalone evaluation. Although the numerical improvement was relatively moderate, the ensemble model demonstrated consistently stable predictive behavior across repeated experiments, as reflected by relatively low standard deviation values and narrow confidence interval distributions.
Performance stability was further examined using standard deviation and 95% confidence interval estimation. The ensemble model produced an Accuracy standard deviation of 0.0056, indicating relatively low performance variability under repeated random data partitioning. **This result suggests that combining heterogeneous classifiers through weighted probability aggregation contributed not only to predictive improvement but also to stronger robustness during repeated evaluation, which is consistent with previous findings reported in healthcare-related ensemble learning studies [18].
Overall, the experimental results indicate that the proposed weighted soft voting strategy successfully improved predictive consistency while maintaining competitive classification performance across multiple evaluation metrics. These findings demonstrate that integrating complementary predictive patterns learned by heterogeneous classifiers can provide more reliable classification behavior compared with relying exclusively on a single standalone model.
D.STATISTICAL VALIDATION AND DISCUSSION
To determine whether the performance improvement achieved by the proposed weighted soft voting ensemble reflected genuine methodological improvement rather than experimental variation, formal statistical significance analysis was performed. Comparative testing was conducted between the proposed ensemble framework and the three strongest standalone classifiers identified during the previous evaluation phase, namely KNN, RF, and LGBM.
Before significance testing, normality analysis was first conducted on the paired accuracy differences obtained from repeated Monte Carlo evaluation using the Shapiro–Wilk normality test. This preliminary analysis was required to determine whether parametric or non-parametric statistical testing procedures should be applied. When the paired differences satisfied the normality assumption, the paired t-test was used. Otherwise, the Wilcoxon Signed-Rank test was applied as a non-parametric alternative.
The statistical comparison results are summarized in Table III. For comparisons between the ensemble model and both KNN and RF, the Shapiro–Wilk test indicated non-normal distribution of paired differences. Consequently, Wilcoxon Signed-Rank testing was applied, and both comparisons produced extremely small p-values indicating statistically significant performance differences. In contrast, the comparison between the ensemble model and LGBM satisfied the normality assumption, and therefore the paired t-test was applied. The resulting p-value also remained substantially below the significance threshold of 0.05.
Table III. Statistical significance analysis between the proposed ensemble and top performing standalone classifiers
| Metric | Ensemble vs KNN | Ensemble vs RF | Ensemble vs LGBM |
|---|---|---|---|
| Shapiro–Wilk p-value | 0.5022 | ||
| Statistical test | Wilcoxon Signed-Rank | Wilcoxon Signed-Rank | Paired t-Test |
| Test p-value | |||
| Result | Significant | Significant | Significant |
These findings confirm that the performance improvement achieved by the proposed weighted soft voting ensemble cannot be interpreted as random variation introduced during repeated experimentation. Instead, the observed improvement reflects a genuine methodological advantage obtained through integrating heterogeneous classifiers using weighted probability aggregation.
From a practical perspective, the results demonstrate that combining repeated Monte Carlo evaluation, multi-metric composite score-based model selection, and weighted ensemble learning can provide a reliable predictive framework for healthcare-related classification problems. The incorporation of formal statistical validation further strengthens experimental reliability and confirms the robustness of the proposed framework under repeated data partitioning conditions, which is increasingly emphasized in recent healthcare-oriented machine learning studies [19].
IV.CONCLUSION
This study proposed an integrated machine learning framework for childhood stunting prediction by combining Optuna-based hyperparameter optimization, repeated Monte Carlo evaluation, composite score-based model selection, and weighted soft voting ensemble learning. The proposed framework was designed to improve predictive performance while maintaining model stability and methodological reliability under repeated experimental conditions.
Experimental results showed that KNN, RF, and LightGBM consistently emerged as the strongest standalone classifiers, achieving mean accuracies of 0.9005, 0.8834, and 0.8762, respectively. After integration through weighted soft voting, the proposed ensemble model achieved the best overall performance with mean accuracy of 0.9040 and demonstrated relatively stable prediction behavior with standard deviation of 0.0056 across repeated evaluations. Statistical significance analysis further confirmed that the performance improvement achieved by the ensemble model was statistically significant when compared with the strongest standalone classifiers.
Overall, the proposed framework demonstrated that integrating automated optimization, multi-metric model selection, robustness analysis, and ensemble learning can provide a reliable predictive approach for early childhood stunting identification. Future research may incorporate larger clinical datasets and external validation to further improve model generalization and practical deployment in real-world healthcare environments.