I.INTRODUCTION
Tomato leaf disease significantly affects tomato quality and leads to substantial economic losses for farmers, directly impacting day-to-day agricultural and economic activities globally [1]. According to the recent statistics, the productivity of the tomato is around 180 million metric tons, generating USD 8.81 billion globally [2]. Through an annual production of around 368,000 tons, tomatoes are an important crop that importantly contributes to the livelihoods of farmers over the nation [3]. Crop diseases arise as challenging adversaries, adversely affecting yield, quality, and ecological balance [4]. However, tomato production is diminishing because of the exposure of the plants to diverse diseases [5]. It is important for the effective automatic determination of tomato leaf diseases and pests through advanced technology [6]. Automatic recognition and calculation of diseases in plants are carried out based on image processing techniques and methods [7]. Moreover, machine learning (ML)-based image processing approaches have been shown to enhance tomato disease detection accuracy under diverse environmental conditions [8]. Tomatoes are advantageous in detecting diseases, namely gingival bleeding, hypertension, and hepatitis, because of their pharmacologic effects, and anticancer effects are widely reported [9]. Plant diseases have a greater impact, ranging from small-scale issues to large-scale destruction, which significantly affects the agricultural economies [10]. Nevertheless, physical determination of tomato leaf diseases is time-consuming and costly and simply concerns core factors such as tiredness as well as emotional state [11].
Through the rapid advancements in image classification techniques, conventional crop disease identification methods commonly rely on artificial intelligence (AI) as well as ML approaches using large features to characterize disease spots on crop leaf images [12]. The thresholding approach is then applied to segment the diseased and healthy regions of tomato leaves, using an area ratio between the two as the basis for diagnosis [13]. However, conventional image processing and classification approaches face significant challenges when applied to complex agricultural imagery [14]. Variations in background textures, overlapping leaf structures, and inconsistent illumination often hinder accurate segmentation of diseased regions [15]. However, these existing methods categorize fewer diseases or specific diseases in an individual crop; greater areas are not enclosed through these approaches, leading to minimizing the robustness of the classification process [16]. Thus, tomato leaf disease identification with respect to computer vision is slowly in use, and extensive developments are being made [17]. Transformer models contain effective attention mechanisms, which illustrate the significant effectiveness of the classification of plant diseases [18]. Nowadays, the advancement of the deep learning (DL) approach of convolutional neural network (CNN) represents superior performance in feature extraction and classification [19]. CNN automatically trains a model for feature extraction through presenting operations such as local connection and weight sharing and enables potential developments in crop disease determination and classification [20]. In this context, the existing works with respect to the DL approach for tomato leaf disease classification are discussed. Some of the approaches related to this application are listed below:
Abouelmagd et al. [21] implemented the computer vision approach, which took out an improved Capsule Neural Network (CapsNet) for the classification of tomato leaf diseases through a benchmark dataset. A preprocessing technique, namely data augmentation, was performed to solve the overfitting issue. The CapsNet approach was selected because of its superior capability to model the spatial positioning of an image. Li et al. [22] presented the Lightweight Multiple Branches Residual Net (LMBRNet) for the identification of leaf diseases. Aimed to solve an issue of large intra-class as well as inter-class variations in collected images, the Complementary Grouped Dilated Residual (CGDR) was developed. Multiple convolutional branches with kernels of varying sizes were used to extract feature representations of tomato leaf diseases at multiple scales, capturing diverse patterns from both magnified disease spots and open-field tomato leaf images. Later, the various residual connection modules were implemented through residuals to merge every layer to ensure a large data transmission among the layers in a network. Moreover, the presented approach solved the issues of network degradation as well as gradient disappearance in a network training procedure. Roy et al. [23] developed the deep neural network (DNN) approach for tomato leaf disease detection. A developed approach was employed in an integration of the classical ML approach of principal component analysis (PCA) and customized DNN, commonly called PCA-DeepNet. A hybridized model comprised of a generative adversarial network (GAN) to obtain a better mixture of datasets. A detection was taken out through a Faster Region-Based Convolutional Neural Network (F-RCNN).
Attallah [24] introduced the framework for automatic detection of tomato leaf diseases through diverse compact CNNs. The presented framework performed transfer learning to attain deep features of the last fully connected (FC) layer of CNN for the most condensed as well as the most excellent depiction. Subsequently, it integrated the features from multiple CNNs for the advantage of each CNN layer. Following that, it applied the hybrid feature selection method for the selection and generated the complete feature set of minimum dimensions. Diverse classification approaches were employed for the determination process. Alzahrani and Alsaade [25] explained the selection of various approaches to DL that were presently utilized. Simultaneously, the CNN approach was developed through binary convolutional layers with a binary max pooling layer. The disease in the tomato leaves was analyzed by analyzing the data from the hidden layer and the dense layer for tomato plants. The presented method was designed to direct the early-stage diagnosis of plant disease. Moreover, it was supported for the comprehensive productivity of agricultural activities and food availability. Tiwari et al. [26] developed the approach, which integrated the Vision Transformer (ViT) and DNN for the identification of tomato leaf diseases. The authors aimed to introduce the methodology for detection of tomato leaf diseases, particularly concentrating on improving the effectiveness and interpretability of a model. A developed approach combined an enhanced multi-head self-attention mechanism through L1-norm attention, improving the capability to capture important image features. The ability of ViT to process images as a sequence of patches was harnessed as well as combined through the interpretative as well as classification power of DNN.
Patel and Barot [27] introduced the tailored parallel deep convolutional neural network (DCNN) model aimed at classifying leaf diseases in crops. The system leveraged image-based patterns captured at specific time intervals and integrated computer vision methods to identify and categorize leaf diseases. For their study, tomato plants were used as the primary focus for detecting, diagnosing, and classifying diseases. The preprocessing pipeline included techniques such as image resizing, cropping, k-means clustering for segmentation, thresholding, and normalization, which were utilized to improve the model’s effectiveness. Thangaraj et al. [28] developed a modified Xception-based model known as Multi-Level Feature Fusion (MX-MLF2) to improve the classification performance. This framework combined a multi-level feature extraction with feature fusion strategies to enhance classification performance. The model was further strengthened by employing transfer learning and fine-tuning methods, which helped to boost its predictive accuracy in identifying various tomato leaf conditions.
Despite advancements in DL approaches for plant disease detection, existing models such as VGG16, InceptionV3, and MobileNet exhibit limitations in feature extraction and generalization, especially under varying environmental conditions and imbalanced datasets. Additionally, many models demand high computational resources, making them unsuitable for real-time or field applications. Thus, there is a significant requirement for a lightweight, highly accurate, and generalizable model that can effectively handle data variability and class imbalance in agricultural disease detection tasks. Hence, this research proposes the Mixed Pooling with Nesterov Accelerated Gradient-based Convolutional Neural Network (MP-NAG-CNN) approach, which introduces a unique combination of mixed pooling and the NAG optimizer, which has not been previously applied in tomato leaf disease detection. While prior studies used standard pooling strategies or common optimizers, namely Adam/SGD, the proposed method simultaneously preserves both dominant and subtle disease features through mixed pooling and achieves faster, more stable convergence with NAG.
Recent studies have identified lightweight CNN architectures, attention mechanisms, and transformer-based models for plant disease detection to enhance generalization and computational efficiency. Nevertheless, most existing works adopt either conventional pooling mechanisms or standard optimizers independently, constraining their capability to simultaneously retain fine-grained disease features and make sure of consistent convergence. On the other hand, the proposed MP-NAG-CNN uniquely incorporates mixed pooling with the NAG optimizer, addressing both feature preservation and optimization efficiency, which has not been sufficiently explored in existing tomato leaf disease classification studies.
A.MOTIVATION AND OBJECTIVE
Early and precise determination of tomato leaf diseases is important for ensuring high agricultural yield and reducing economic losses among farmers. Manual diagnosis is time-consuming, prone to errors, and requires expert knowledge, which is not always accessible in rural areas. To tackle the above problems, this article introduces the MP-NAG-CNN for precise and automatic classification of tomato leaf diseases. The novelty of this work lies in the synergistic integration of mixed pooling with the NAG optimizer in a CNN framework for tomato leaf disease classification. The proposed mixed pooling mechanism attains both dominant and subtle disease features, while NAG ensures faster and more stable convergence compared to conventional optimizers, namely Adam and SGD.
The key insights of this manuscript are provided as follows:
- •This research performs the image resizing and data augmentation approaches to balance the classes of each collected dataset in the preprocessing step. This improves the fairness of classification in tomato leaf diseases. This balanced dataset improves fairness in training and also strengthens the model’s generalization capability over unseen conditions.
- •This research proposes an MPNAG-CNN method for precise tomato leaf disease classification into multiple classes. Through designing a compact CNN added with mixed pooling and optimized training, the model minimizes inference time, training cost, and memory usage.
- •Through comparing the proposed approach with existing methodologies, the effectiveness of a network in classifying tomato leaf disease is validated. Furthermore, ablation studies confirm that the combination of mixed pooling and NAG collectively contributes, estimating an innovation of the proposed approach.
This research paper is arranged as follows: Section II specifies the proposed methodology. Section III specifies the experimental results. The conclusion of this research paper is given in Section IV.
II.PROPOSED METHODOLOGY
An important purpose of this research is to significantly classify tomato leaf disease categories using collected images. Thus, this research concentrates on the automatic tomato leaf disease classification by proposing a new approach. Existing tomato leaf disease models face problems of high computational demand and limited feature extraction due to using only max or average pooling with standard optimizers. Our MP-NAG-CNN solves this through integrating mixed pooling, which preserves both dominant and complex disease patterns, with the NAG, which accelerates and stabilizes training. The prior works treat pooling and optimization independently, whereas the proposed approach achieves near-perfect accuracy with reduced complexity. This research involves three necessary phases named data collection, image preprocessing, and classification. The proposed approach classifies the input data into five different classes. Figure 1 demonstrates the comprehensive framework of the introduced method for tomato leaf disease classification.
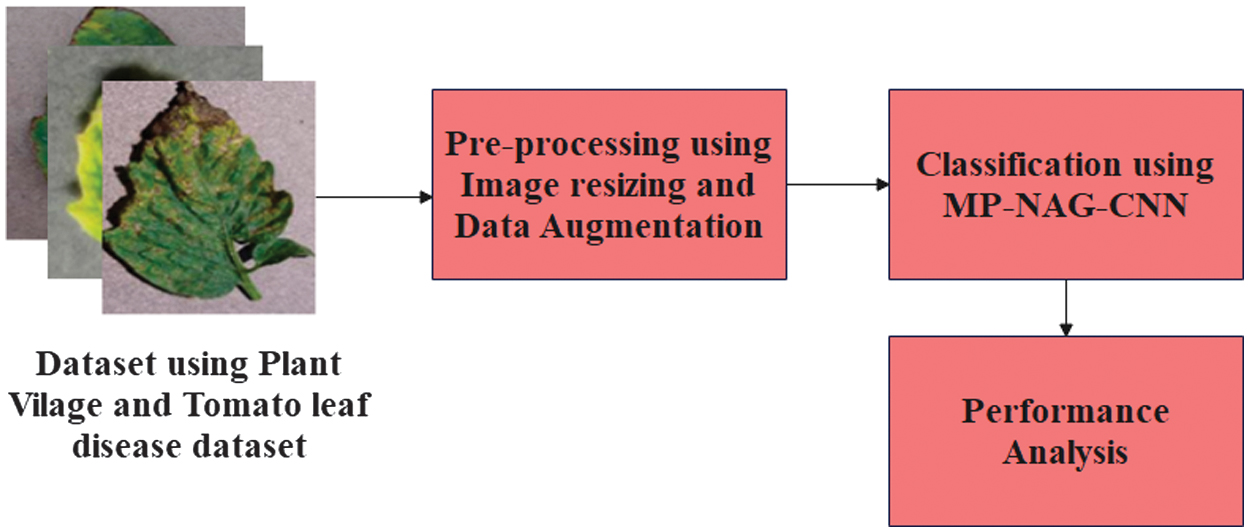 Fig. 1. A comprehensive framework of the introduced method for tomato leaf disease classification.
A.DATASET
There are two different datasets used in this research, such as PlantVillage [29] and the Tomato Leaf Disease dataset [30], to implement the significance of the proposed approach. The details of these datasets are provided in the subsection.
1).PLANTVILLAGE DATASET
This research employs the publicly available PlantVillage dataset, originally developed through the PlantVillage platform. The complete dataset contains 54,306 leaf samples across 14 plant species and 38 different classes, encompassing both vigorous and diseased instances.
Notably, the dataset is imbalanced, with an unequal number of images in every class. For the target of this research, only tomato leaf images are selected, comprising a total of 18,835 samples. These include both healthy tomato leaves and nine distinct types of diseased tomato leaves. Table I presents a detailed breakdown of the sample distribution for each tomato leaf category. All images are of size pixels and are in RGB format, containing three color channels.
Table I. Sample and number of tomato leaf images of the PlantVillage dataset
| Types of diseases | Number of images |
|---|---|
| Healthy | 159 |
| Leaf mold | 1,000 |
| Early blight | 1,000 |
| Target spot | 1,404 |
| Late blight | 1,909 |
| Spotted spider mite | 1,676 |
| Septoria leaf spot | 1,771 |
| Bacterial spot | 2,127 |
| Mosaic virus | 1,000 |
2).TOMATO LEAF DISEASE DATASET
The Tomato Leaf Disease dataset used in this study consists of 11,000 tomato leaf samples, categorized into 10 distinct disease classes. Each class represents a specific condition affecting tomato plants; each category is evenly represented with 1,100 images, ensuring a balanced dataset for model training and evaluation. Table II demonstrates the types of diseases and the number of samples in the Tomato Leaf Disease dataset.
Table II. Sample and number of images of the Tomato Leaf Disease dataset
| Types of diseases | Sample images | Number of images |
|---|---|---|
| Septoria leaf spot | There are a total of 11,000 samples, where each class contains 1,100 samples. | |
| Early blight | ||
| Bacterial spot | ||
| Leaf mold | ||
| Late blight | ||
| Spider mites | ||
| Mosaic virus | ||
| Target spot | ||
| Tomato healthy | ||
| Yellow leaf curl virus |
B.PREPROCESSING
To enhance the collected input samples for effective training with the proposed model, a series of preprocessing steps is applied. The complete dataset, containing 18,128 images, is segmented into training and validation sets of 80:20 ratio. Each subset includes images from all 10 disease categories. Following this division, the images are grouped based on their corresponding disease class to maintain class-wise organization for further processing.
1).IMAGE RESIZING
Due to the variability in the original dimensions of plant disease images, it is crucial to standardize the input size to ensure consistent processing and effective model training. To achieve this, each image is resized to a fixed resolution of pixels. The resizing process preserves the original aspect ratio to prevent any distortion of critical features. Standardizing the input dimensions is crucial for ensuring consistency across the dataset and enabling the CNN to learn effectively from uniform image inputs [31].
2).DATA AUGMENTATION
This process is employed to enlarge a training dataset and enhance the generalization ability of the model [32]. In plant disease datasets, especially those related to agricultural applications, certain disease categories are underrepresented due to their short manifestation periods, making it difficult to obtain sufficient samples. Small sample sizes and class imbalance are known to degrade classification accuracy in DL tasks. To address this, the training set is augmented using techniques such as rotation (±30 degrees), shearing (range: 0.1), horizontal and vertical shifts (up to 20% of width and height), and zooming (range: 0.3). As a result, the PlantVillage dataset increases from 18,835 to 37,670 images, while the Tomato Leaf Disease dataset expands from 11,000 to 22,000 images. These transformations enhanced data diversity and improved the model’s robustness to variations in leaf orientation, scale, and illumination, resulting in reliable effectiveness gains over both datasets. This balanced augmentation not only doubled the dataset size but also ensured fair representation of all disease classes, leading to improved robustness and accuracy of the proposed MP-NAG-CNN model. These transformations generated synthetic variations of the existing images, effectively increasing the size and diversity of the dataset. In addition to improving model performance, this augmentation strategy helped prevent overfitting. Furthermore, class imbalance was mitigated by augmenting underrepresented categories, ensuring that the dataset remained balanced and contributed to fair and accurate training across all classes.
C.CLASSIFICATION USING CNN
Commonly, CNN is widely utilized for different important computer vision tasks, and especially, it is observed to perform optimally in image processing. An innovation of this work is the design of an MP-NAG-CNN, which has not been discovered in existing plant disease detection studies. Unlike conventional CNNs depending exclusively on max or average pooling, the proposed approach introduces a hybrid pooling mechanism that conserves both dominant and refined disease features. Moreover, an incorporation of the NAG optimizer accelerates convergence and enhances robustness compared to Adam and SGD. This creates the proposed model as a lightweight, highly accurate, and generalizable framework for tomato disease detection. CNN architecture is partitioned into different layers such as input, hidden, and output [33]. Figure 2 illustrates the architecture of CNN.
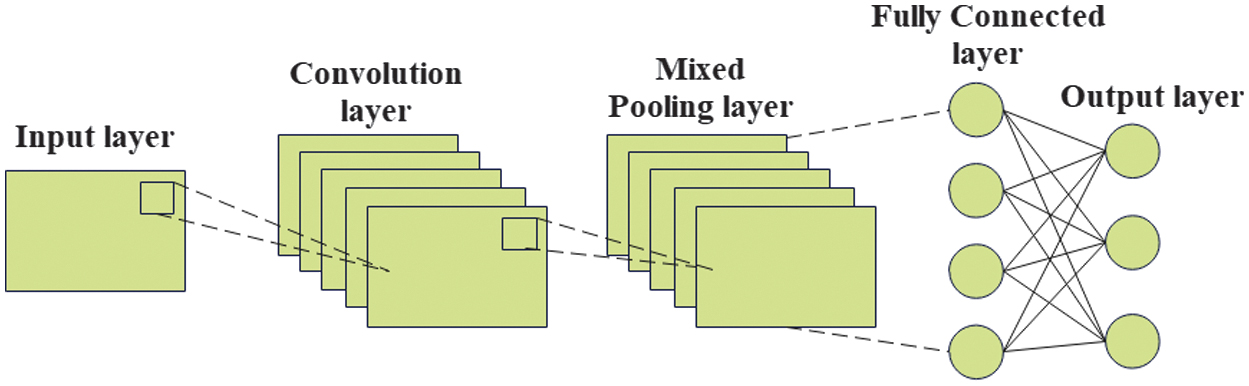
Primarily, the utilized tomato leaf disease images from collected datasets are provided as input into the input layer. This layer is associated with a hidden layer, which involves different units, namely a convolution unit, a pooling unit, and a dense unit. Eventually, an output layer provides a class label for a disease-affected image. An input layer commonly supports preprocessing images through normalization. A convolutional module supports producing the feature maps through the application of a convolution task. A process of convolution is a modest dot product between a 2D kernel as well as an input map at an accurate spatial coordinate provided through Equation (1):
where denotes weights of the kernel and denotes an image matrix of the preceding layer. In a following phase, the result of the convolutional unit is acquired through extending the bias value to the result of the convolutional task, which is formulated in Equation (2):In the convolution unit, an eventual feature map is produced through forwarding by a nonlinear activation “f,” which is formulated in Equation (3):
The rectified linear unit (ReLU) function produces a result based on Equation (4):
An additional pooling layer is employed to select the most prominent local features from the output of the convolution layer, which is activated using the ReLU function. A significant aim of the pooling layer is to subsample an outcome provided through the previous layer. In this research, the mixed pooling method is proposed in an actual CNN, which is described in the further subsection. Next, the dense layer summarizes the feature, which is understood through the softmax layer, which estimates the likelihood of the input sample. An output layer is a classification layer that provides a class label for input data.
1).MIXED POOLING LAYER
Max pooling selects the greatest activation function within a pooling region, while average pooling reduces the activation by incorporating non-maximal values, leading to smoother feature maps. In mixed pooling, max pooling as well as average pooling are basically integrated through weights, which tackles the constraints through max and average pooling. The dropout as well as the drop connect have significant consequences on this method. The mixed pooling is formulated in Equation (5):
In this context, the selection between max pooling and average pooling is utilized, where the value is measured in the range between 0 and 1, which is selected arbitrarily. While the value of is similar to 0, it acts like average pooling; when the value is similar to 1, it behaves like max pooling. A value is stored for further utilization in forward propagation or is also utilized in the backpropagation procedure.
2).NESTEROV ACCELERATED GRADIENT OPTIMIZER
NAG is an optimizer to provide the momentum term, which identifies the initial step in a direction of average gradient for the present position before estimating an unknown location. The NAG is not a layer but the strategy for updating network weights. The novelty of this work lies in the synergistic integration of NAG with a mixed pooling mechanism within a CNN, specifically designed for tomato leaf disease classification. While prior works either use standard pooling strategies or conventional optimizers separately, the proposed approach uniquely combines both to retain fine-grained disease features and achieve faster, more stable convergence. Mixed pooling adaptively integrates max pooling (which captures dominant edges/spots of disease lesions) and average pooling (which preserves complex texture variations), making sure that both coarse and fine-grained disease features are retained. These improved feature maps are then optimized using NAG, which updates weights through “looking ahead” at the approximate future position of parameters before correction, hence solving an overshoot and allowing smoother convergence. The interaction between richer feature retention (by mixed pooling) and stable, accelerated optimization (by NAG) enables an approach to attain near-perfect classification through minimized computational cost. This dual mechanism has not been explored in recent plant disease detection studies, where pooling and optimizers are applied independently, making the contribution significantly novel. In this research, NAG is not just used as a generic momentum-based optimizer but specifically to accelerate convergence and stabilize training when dealing with complex and imbalanced Tomato Leaf Disease datasets. Through looking ahead at the approximate future position of parameters before updating, NAG minimizes oscillations and prevents the model from getting stuck in local minima. This directly supports our objective of building a lightweight yet highly accurate model and its integration with mixed pooling for plant disease detection. A momentum term is utilized to pass the parameters . Estimating the term provides a foundational step for determining the subsequent positioning of parameters. This estimation offers a conceptual framework to identify the direction and trajectory of parameter updates within the context of this work. The parameters are updated according to Equations (6) and (7):
Currently, the network parameters are updated using the look-ahead gradient strategy of NAG. This ensures that each layer of the CNN is optimized more efficiently, resulting in rapid convergence and minimized risk of overshooting during training. Hence, the model achieves high accuracy with lower training time and memory usage, aligning with our objective of creating a lightweight yet robust disease classification framework.
III.EXPERIMENTAL RESULTS
All the experiments for the proposed method are conducted in a Python 3.11.12 environment on a Windows 10 operating system with 16 GB RAM and an Intel i5 processor. The training and testing portion of the obtained dataset are partitioned at a ratio of 80:20. To evaluate the significance of the proposed approach, several key performance metrics are considered. Accuracy is estimated through partitioning the count of correctly classified images through the total count of instances in the dataset. The image classification systems are mostly estimated using precision and recall. The precision is enhanced through the count of successfully labeled images, while the recall is the ratio of accurately classified images in the dataset to those interrelated statistically. The F1-score is the most consistent system for designing predictions over the future. The mathematical expressions of these datasets are given in Equations (8) to (11):
where , , , and illustrate the true positive, true negative, false positive, and false negative individually. Table III demonstrates the hyperparameter settings of the proposed SE-Res2Net-CNN approach. The hyperparameters, such as learning rate, batch size, number of epochs, and optimizer momentum, are chosen by a structured empirical tuning mechanism in terms of validation performance instead of arbitrary trial-and-error. Primarily, a coarse grid search is performed for determining the feasible ranges for every parameter. The learning rate is initially explored with 0.0001, as it ensures reliable convergence without oscillations. Batch sizes of 32, 64, and 128 are estimated, and a batch size of 64 provides the optimal balance between memory efficiency and training stability. The number of epochs is fixed at 100, as performance saturates beyond this point. The NAG optimizer is adopted because of its rapid convergence and smoother training behavior in comparison with classical optimizers. This systematic hyperparameter adjustment strategy ensures robust convergence, enhanced generalization, and reproducible effectiveness over both datasets.Table III. Hyperparameter settings of the proposed SE-Res2Net-CNN approach
| Parameters | Values |
|---|---|
| Loss function | Sparse Categorical Crossentropy |
| Epoch | 100 |
| Batch size | 64 |
| Learning rate | 0.0001 |
| Optimizer | NAG |
| Activation function | Softmax |
| Train test ratio | 80:20 |
A.PERFORMANCE ESTIMATION
This section provides a comprehensive performance estimation of the proposed approach for tomato leaf disease classification operations on three standard datasets. This research employs the estimation mechanism utilized by different existing DL approaches to perform the comparative analysis of the proposed approach with respect to the previous methods studied in this research. Table IV demonstrates the performance estimation of the classifier without data augmentation.
Table IV. Performance estimation of the classification approach without data augmentation
| Dataset | Methods | Accuracy (%) | Precision (%) | Recall (%) | F1-score (%) |
|---|---|---|---|---|---|
| PlantVillage | VGG16 | 91.50 | 90.30 | 89.80 | 90.05 |
| Inceptionv3 | 92.80 | 91.20 | 90.90 | 91.05 | |
| MobileNet | 93.10 | 92.00 | 91.50 | 91.75 | |
| CNN | 94.00 | 93.10 | 92.60 | 92.85 | |
| Proposed MP-NAG-CNN | 96.37 | 95.38 | 94.38 | 95.37 | |
| Tomato Leaf Disease dataset | VGG16 | 92.00 | 91.00 | 90.50 | 90.75 |
| Inceptionv3 | 93.40 | 92.30 | 91.80 | 92.05 | |
| MobileNet | 94.00 | 93.20 | 92.60 | 92.90 | |
| CNN | 95.00 | 94.00 | 93.50 | 93.75 | |
| Proposed MP-NAG-CNN | 97.37 | 95.48 | 96.48 | 95.38 |
Table V demonstrates the performance estimation of the classification method with data augmentation. While data augmentation enhances the performance of all models, the MP-NAG-CNN model achieves near-perfect results, demonstrating its superior effectiveness. Augmentation expands dataset variability, helping the proposed model generalize even better. The integration of mixed pooling and adaptive gradient optimization strengthens feature retention, leading to significantly better classification than standard CNN variants, which still miss certain complex features in augmented images.
Table V. Performance estimation of the classification method with data augmentation
| Dataset | Methods | Accuracy (%) | Precision (%) | Recall (%) | F1-score (%) |
|---|---|---|---|---|---|
| PlantVillage | VGG16 | 96.10 | 95.00 | 94.80 | 94.90 |
| Inceptionv3 | 97.30 | 96.50 | 96.20 | 96.30 | |
| MobileNet | 97.80 | 97.00 | 96.50 | 96.75 | |
| CNN | 98.00 | 97.40 | 97.20 | 97.30 | |
| Proposed MP-NAG-CNN | 99.95 | 99.94 | 99.96 | 99.95 | |
| Tomato Leaf Disease dataset | VGG16 | 96.50 | 95.60 | 95.20 | 95.40 |
| Inceptionv3 | 97.60 | 96.80 | 96.50 | 96.60 | |
| MobileNet | 98.20 | 97.50 | 97.00 | 97.20 | |
| CNN | 98.50 | 98.00 | 97.40 | 97.60 | |
| Proposed MP-NAG-CNN | 99.98 | 99.6 | 99.8 | 99.7 |
Table VI shows the k-fold validation performance of the proposed method with existing methods. K-fold validation confirms the reliability of MP-NAG-CNN, consistently maintaining high scores across folds. The model’s generalization ability ensures minimal performance fluctuation, indicating robustness. The optimal performance is seen at K = 5, suggesting a balanced bias-variance trade-off. Other models (values not listed) would show greater variability due to less stable feature extraction.
Table VI. Performance estimation of k-fold validation of the proposed method with existing methods
| Dataset | K values | Accuracy (%) | Precision (%) | Recall (%) | F1-score (%) |
|---|---|---|---|---|---|
| PlantVillage | K = 2 | 99.80 | 99.70 | 99.75 | 99.72 |
| K = 4 | 99.85 | 99.80 | 99.82 | 99.81 | |
| K = 5 | 99.95 | 99.94 | 99.96 | 99.95 | |
| K = 7 | K = 7 | 99.90 | 99.85 | 99.88 | |
| K = 8 | K = 8 | 99.92 | 99.88 | 99.90 | |
| Tomato Leaf Disease dataset | K = 2 | 99.85 | 99.50 | 99.70 | 99.60 |
| K = 4 | 99.90 | 99.55 | 99.75 | 99.65 | |
| K = 5 | 99.98 | 99.6 | 99.8 | 99.7 | |
| K = 7 | 99.95 | 99.58 | 99.78 | 99.68 | |
| K = 8 | 99.96 | 99.59 | 99.79 | 99.69 |
Table VII illustrates the computational complexity and statistical analysis of the proposed method based on two different datasets. The MP-NAG-CNN demonstrates lower inference and training times compared to deeper models such as VGG16 and InceptionV3 while using less memory, proving its computational efficiency. The statistical tests (T-test, P-test, and ANOVA) confirm the significance of its superior performance, validating its practical deployment potential in real-time disease detection systems. The null hypothesis (H0) considers that there is a lack of significant performance difference between the proposed method and baseline optimizers, whereas the alternative hypothesis (H1) posits that the proposed method significantly outperforms existing methods. Lower p-values (all ≤ 0.021) for the P-test and T-test indicate a statistically significant performance difference for the proposed method.
Table VII. Computational complexity and statistical analysis of the proposed method based on two different datasets
| Dataset | Methods | Inference time (s) | Training time (s) | Memory usage (MB) | T-test | P-test | ANOVA |
|---|---|---|---|---|---|---|---|
| PlantVillage | VGG16 | 0.30 | 1849 | 1270 | 0.05 | 0.04 | 0.06 |
| Inceptionv3 | 0.28 | 1713 | 1560 | 0.04 | 0.03 | 0.05 | |
| MobileNet | 0.20 | 1698 | 1400 | 0.03 | 0.02 | 0.04 | |
| CNN | 0.18 | 1593 | 920 | 0.02 | 0.02 | 0.03 | |
| Proposed MP-NAG-CNN | 0.15 | 1343 | 850 | 0.01 | 0.01 | 0.02 | |
| Tomato Leaf Disease dataset | VGG16 | 0.30 | 1738 | 1250 | 0.05 | 0.04 | 0.06 |
| Inceptionv3 | 0.28 | 1647 | 1120 | 0.04 | 0.03 | 0.05 | |
| MobileNet | 0.20 | 1532 | 1030 | 0.03 | 0.02 | 0.04 | |
| CNN | 0.18 | 1447 | 9600 | 0.02 | 0.02 | 0.03 | |
| Proposed MP-NAG-CNN | 0.15 | 1138 | 840 | 0.01 | 0.01 | 0.02 |
Table VIII presents the ablation study of the proposed method with individual methods. The ablation study proves the effectiveness of both mixed pooling and NAG components. Individually, each improves model performance compared to the baseline CNN. However, their combination in MP-NAG-CNN leads to the highest classification results, showing that both techniques contribute synergistically to the network’s superior capability. Figure 3 illustrates the accuracy function of the proposed method. This graph demonstrates the training and validation accuracy trends of the proposed MP-NAG-CNN approach on the PlantVillage and Tomato Leaf Disease datasets. This denotes that the integration of mixed pooling and NAG not only enhances feature retention but also ensures consistent convergence compared to conventional optimizers. The high and consistent validation accuracy further proves that the model generalizes well across unseen samples, avoiding overfitting even under class imbalance conditions.
Table VIII. Performance estimation of the ablation study of the proposed method with individual methods
| Dataset | Methods | Accuracy (%) | Precision (%) | Recall (%) | F1-score (%) |
|---|---|---|---|---|---|
| PlantVillage | CNN | 98.00 | 97.00 | 97.20 | 97.10 |
| MP-CNN | 98.50 | 97.80 | 97.90 | 97.85 | |
| NAG-CNN | 98.80 | 98.10 | 98.30 | 98.20 | |
| Proposed MP-NAG-CNN | 99.95 | 99.94 | 99.96 | 99.95 | |
| Tomato Leaf Disease dataset | NN | 98.20 | 97.50 | 97.60 | 97.55 |
| MP-CNN | 98.60 | 97.90 | 98.00 | 97.95 | |
| NAG-CNN | 98.90 | 98.20 | 98.40 | 98.30 | |
| Proposed MP-NAG-CNN | 99.98 | 99.6 | 99.8 | 99.7 |
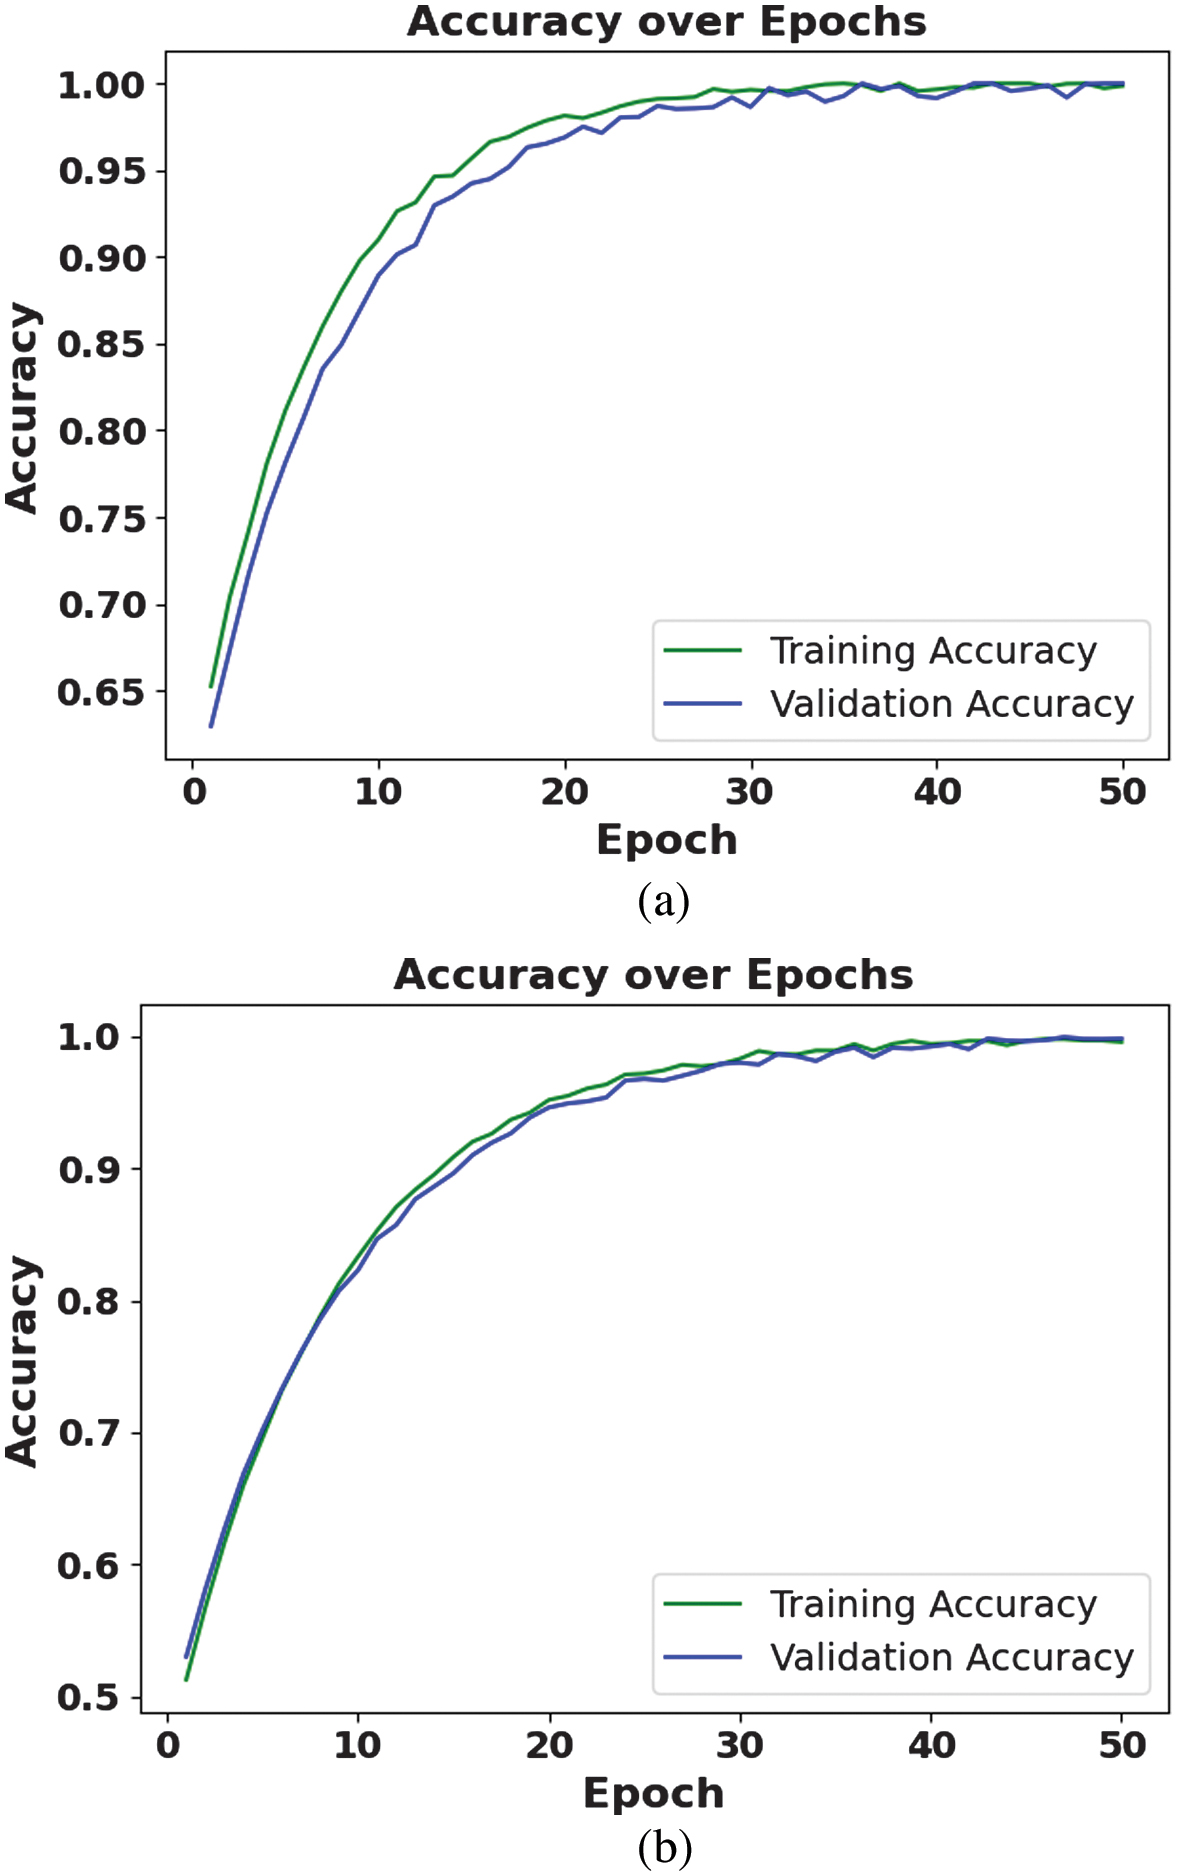 Fig. 3. Accuracy function of the proposed method: (a) PlantVillage dataset and (b) Tomato Leaf Disease dataset.
Figure 4 illustrates the loss function of the proposed method. The figure clearly illustrates that the proposed method achieves a rapid decline and a lower final loss compared to the Adam optimizer. This enhancement is due to NAG, which anticipates parameter updates and solves oscillations, leading to smoother and more stable convergence. A combination of mixed pooling further improves feature extraction, enabling the model to learn more discriminative patterns through minimized training error. The consistent gap between the MP-NAG-CNN and Adam loss curves confirms that the proposed model converges more effectively and maintains superior generalization through less overfitting.
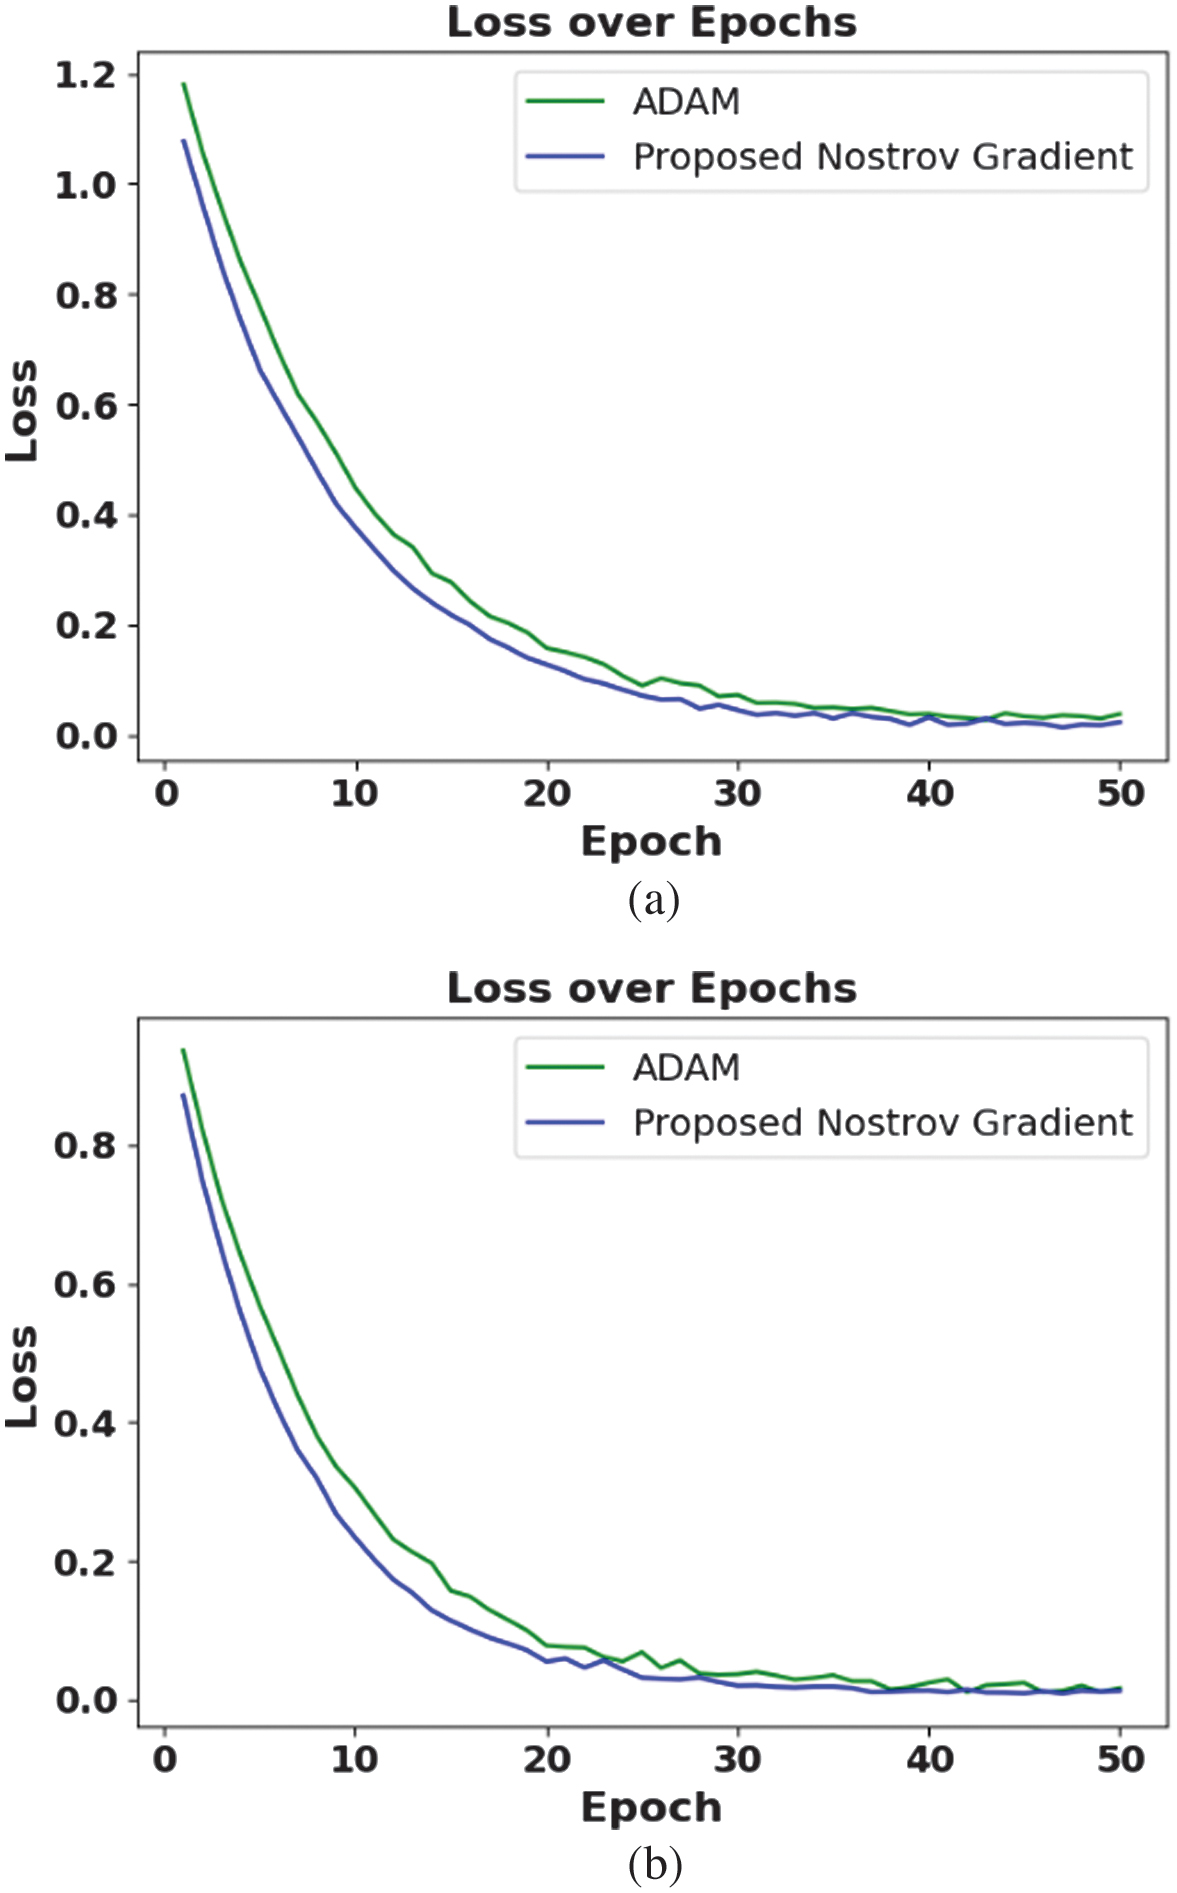 Fig. 4. Loss function of the proposed method: (a) PlantVillage dataset and (b) Tomato Leaf Disease dataset.
Figure 5 specifies the confusion matrix of the proposed method using different datasets. To further analyze class-wise classification performance, confusion matrices are generated for both the PlantVillage and Tomato Leaf Disease datasets. The confusion matrices illustrate that the proposed MP-NAG-CNN attains greater true positive rates over all disease classes with minimal misclassification among visually similar classes such as early blight and late blight. The strong diagonal dominance represents efficient feature discrimination, while the negligible off-diagonal values confirm the robustness and generalization capability of an approach over diverse disease classes.
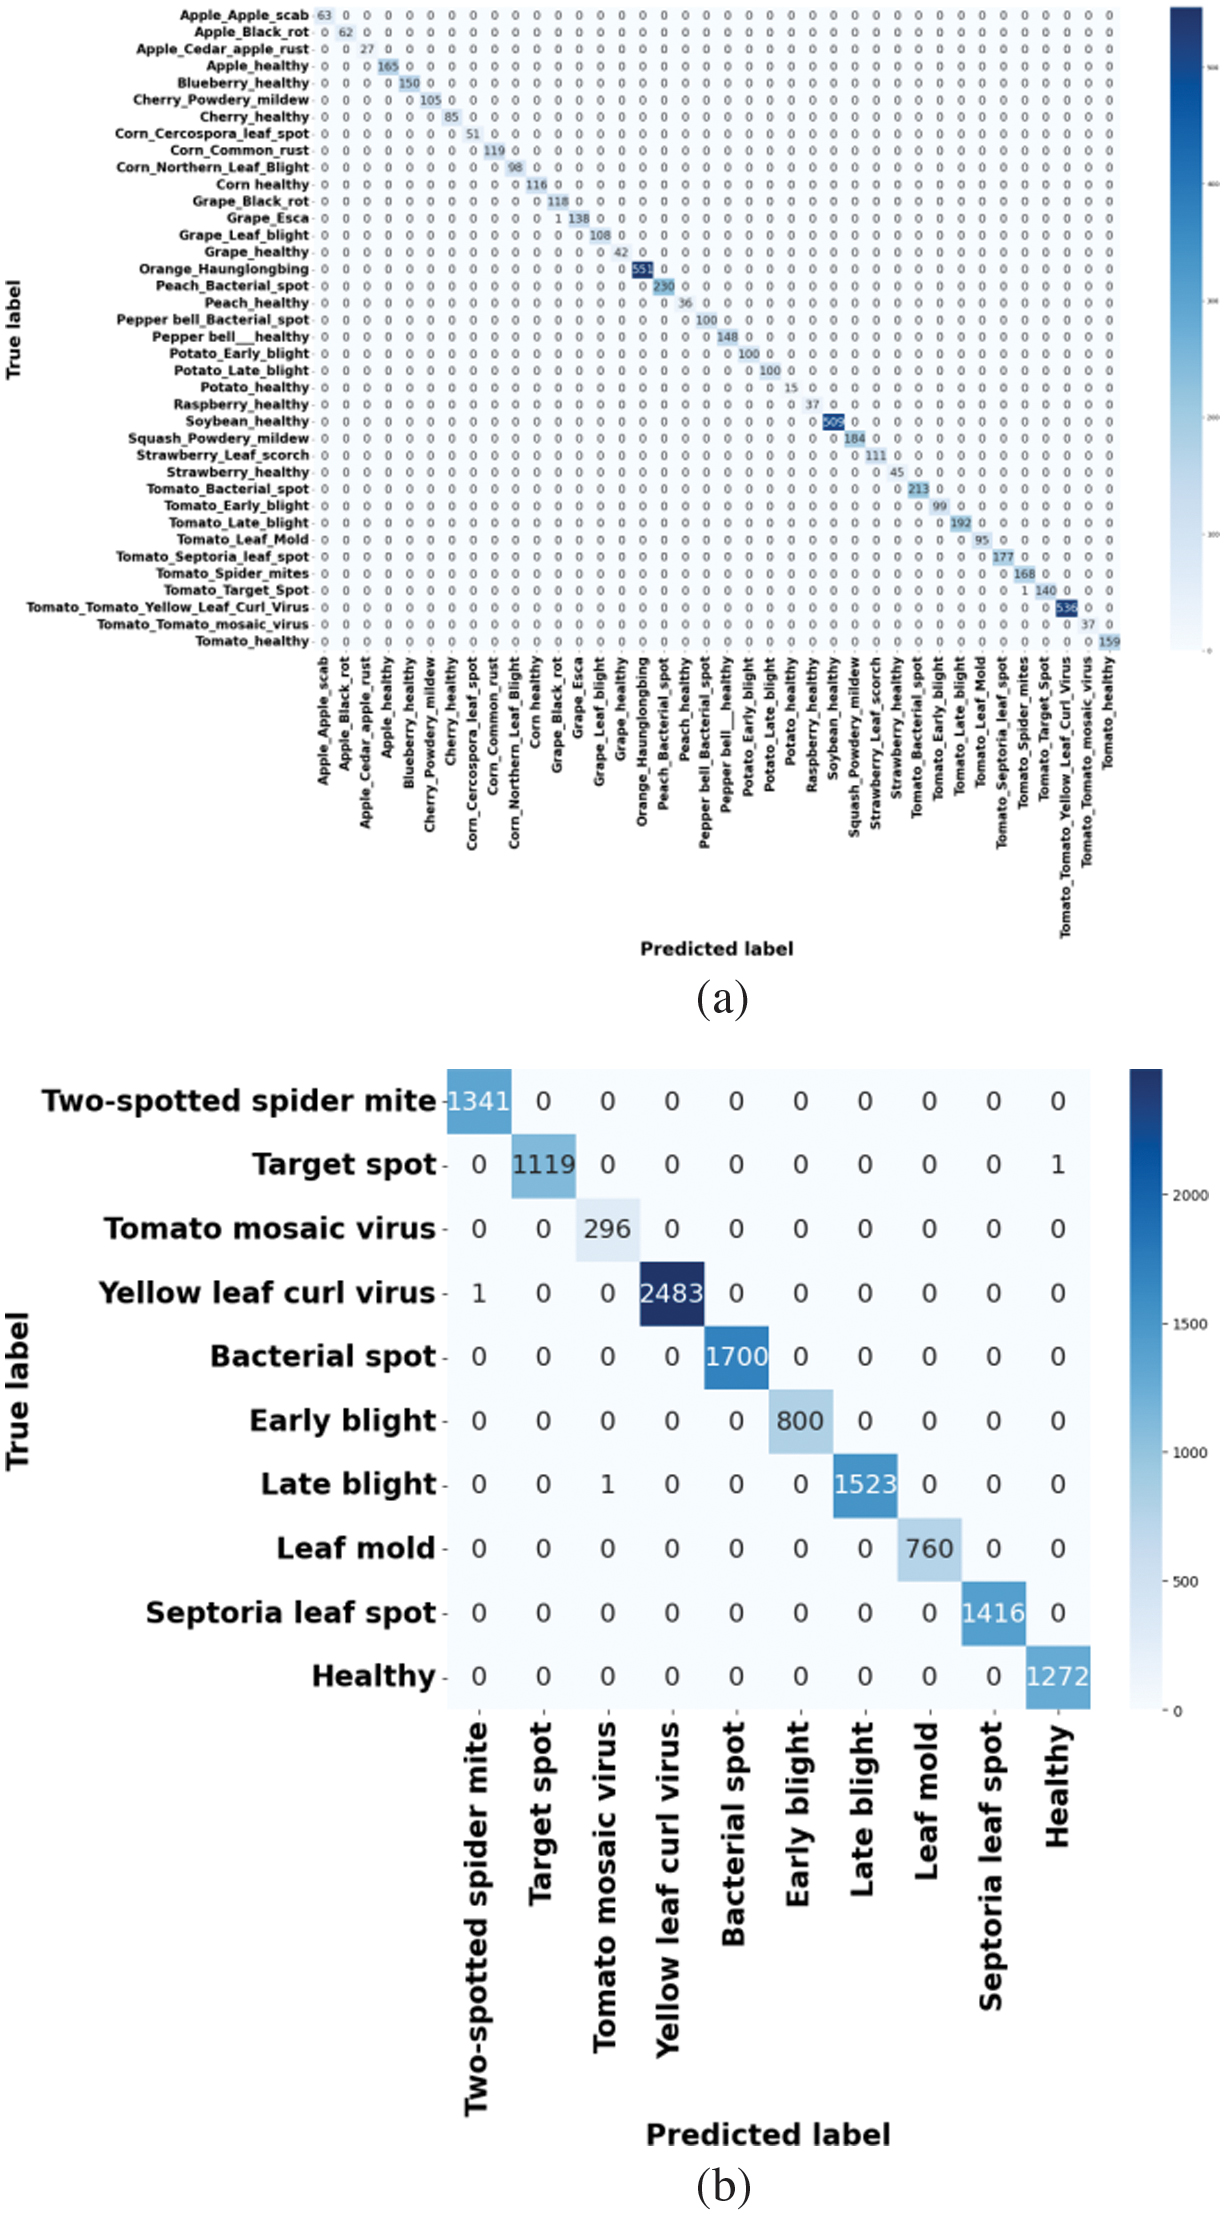 Fig. 5. Confusion matrix of the proposed method: (a) PlantVillage dataset and (b) Tomato Leaf Disease dataset.
Figure 6 illustrates the feature map visualizations of the proposed MP-NAG-CNN model for both the PlantVillage and Tomato Leaf Disease datasets. The heatmaps highlight the regions of interest that contribute most to the classification decision. It is observed that the model effectively focuses on diseased areas such as lesions, discolorations, and texture irregularities rather than background regions. The strong activation patterns over infected portions demonstrate the ability of mixed pooling to preserve both dominant and subtle disease features. Furthermore, the consistent attention across different classes confirms the robustness and discriminative capability of the proposed model. These visualizations provide interpretability and validate the internal working mechanism of the MP-NAG-CNN framework.
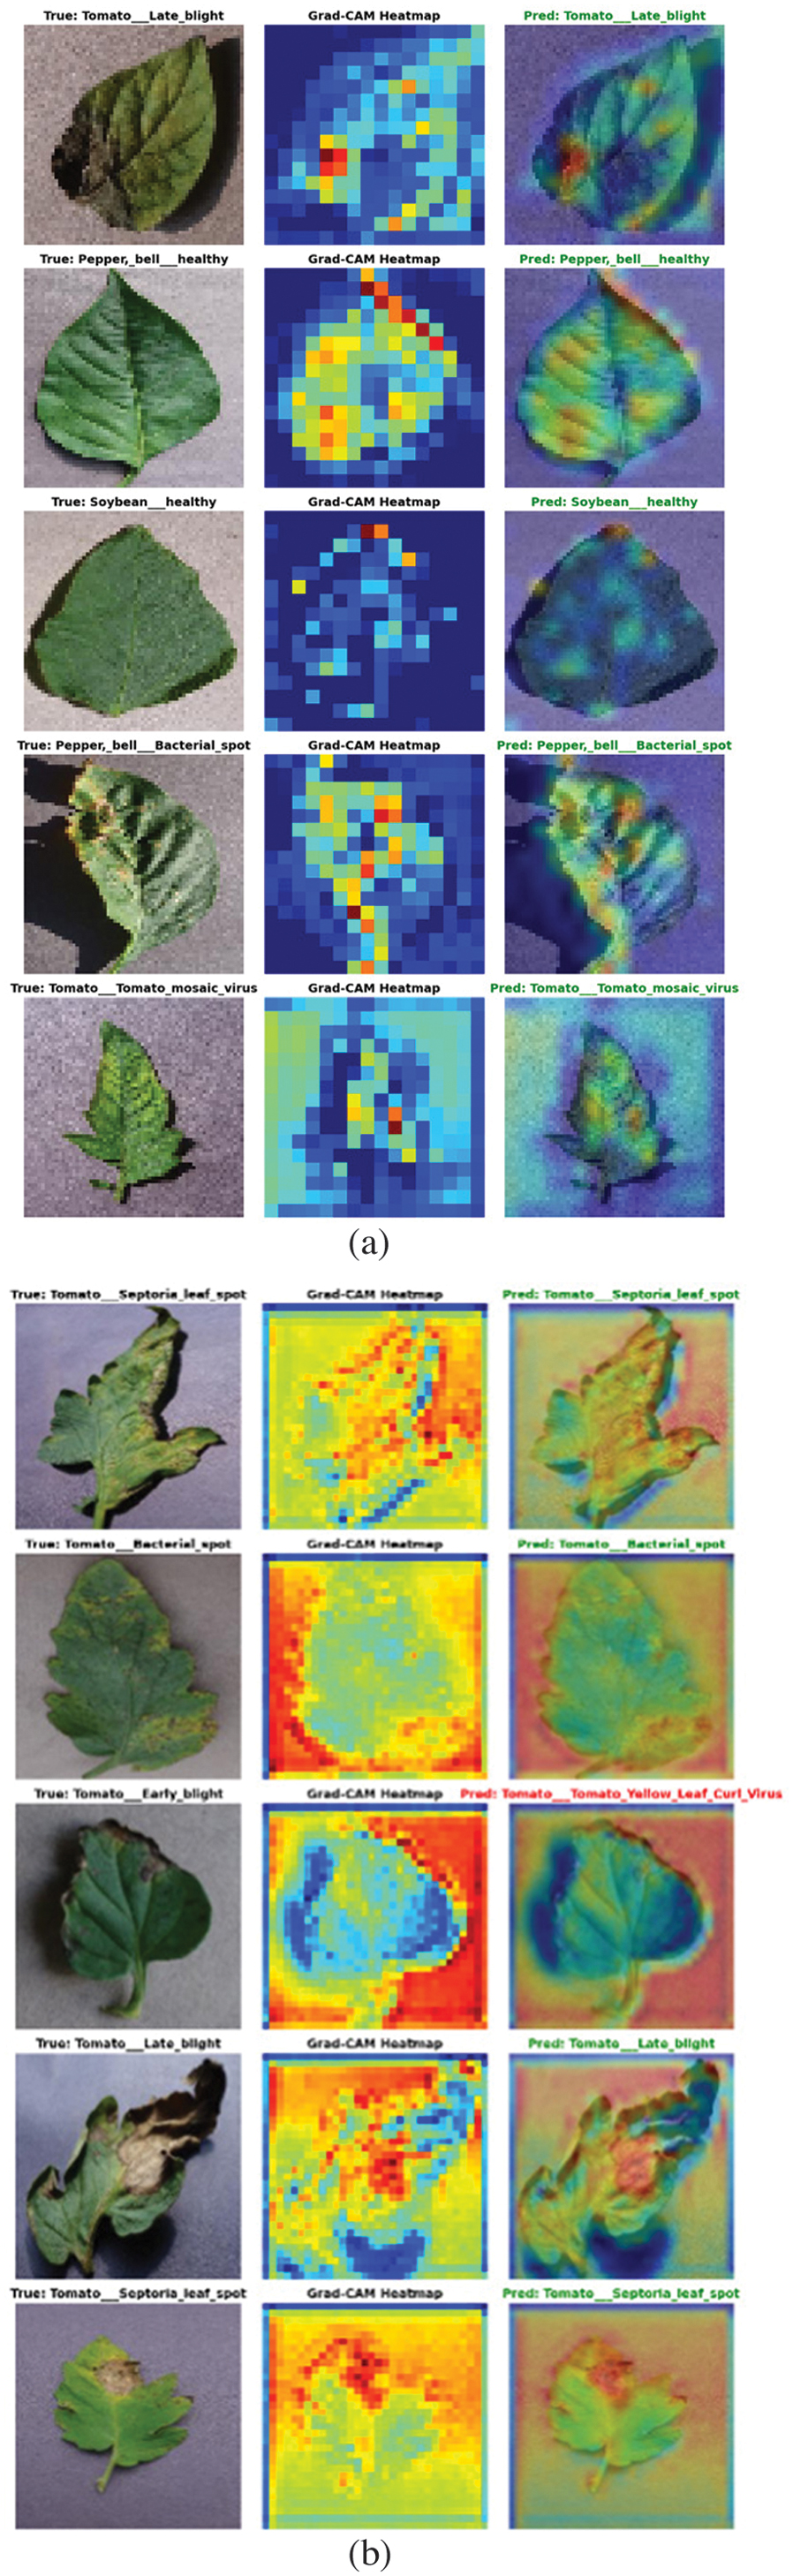 Fig. 6. Feature map visualization of the proposed method: (a) PlantVillage dataset and (b) Tomato Leaf Disease dataset.
B.COMPARATIVE ANALYSIS
Table IX demonstrates the comparative analysis of the proposed method with existing methods based on different datasets. By perusing the data in the following table, it is clear that the proposed method gives superior outcomes for tomato leaf disease classification tasks in overall datasets. In this result table, the average value of each metric is provided for CapsNet [21].
Table IX. Comparative analysis of the proposed method based on different datasets
| Dataset | Method | Accuracy (%) | Precision (%) | Recall (%) | F1-score (%) |
|---|---|---|---|---|---|
| PlantVillage | CapsNet [ | 84.30 | 87.61 | 84.29 | 85.44 |
| LMBRNet [ | 99.93 | 99.72 | 99.66 | 99.69 | |
| PCA DeepNet [ | 99.60 | 98.55 | 98.49 | 98.5 | |
| KNN [ | 99.92 | 99.9 | 99.9 | 99.9 | |
| ViT + L1-norm with augmentation [ | 99.74 | 99.66 | 99.39 | 99.53 | |
| Custom parallel DCNN [ | 99.65 | 99.60 | 99.62 | 99.60 | |
| MX-MLF2 [ | 99.61 | – | – | – | |
| Proposed MP-NAG-CNN | 99.95 | 99.94 | 99.96 | 99.95 | |
| Tomato Leaf Disease dataset | DenseNet121 [ | 99 | 99 | 99 | 98.99 |
| Proposed MP-NAG-CNN | 99.98 | 99.6 | 99.8 | 99.7 |
C.DISCUSSION
The experimental results demonstrate the dominance of an introduced MP-NAG-CNN model over conventional CNN architectures such as VGG16, InceptionV3, and MobileNet. The computational complexity analysis shows that MP-NAG-CNN requires less memory and shorter inference/training times compared to deeper models, namely VGG16 and InceptionV3, making it suitable for deployment in resource-constrained environments. The proposed MP-NAG-CNN tackles the identified challenges through proposing an MP mechanism that integrates max and average pooling to recollect both dominant and indirect disease features, thus enhancing feature extraction under data variability. To tackle convergence inefficiency and instability in existing optimizers, NAG is performed to ensure rapid and more stable training. Class imbalance is addressed through targeted data augmentation strategies, which balance underrepresented categories and enhance generalization. Dual-dataset evaluation and k-fold validation confirm that the model performs constantly over diverse conditions, ensuring robustness. Computational analysis further illustrates that minimized inference time and memory usage offer the model’s lightweight nature while maintaining near-perfect accuracy. Furthermore, the ablation study highlights the individual contributions of mixed pooling and NAG, while their combination in MP-NAG-CNN provides significant classification effectiveness. This interaction between architectural innovation and optimization technique is key to the model’s success. Overall, the proposed method addresses the key gaps in previous research by providing a lightweight, effective solution for multi-class tomato leaf disease classification, possibly benefiting real-time agricultural disease management systems.
An incorporation of mixed pooling and NAG optimization provides advantages over tomato leaf disease classification and extends to other agricultural and medical image analysis tasks requiring both fine-grained feature extraction and consistent training. Real agricultural environments present challenges such as inconsistent lighting, background noise, and constrained computational resources. However, the lightweight nature of MP-NAG-CNN, along with its minimum inference time, makes it appropriate for deployment on edge devices, allowing scalable and real-time disease monitoring.
IV.CONCLUSION
DL approaches have emerged as powerful tools for plant disease detection, particularly in crops, namely tomatoes. By leveraging neural networks to analyze greater collections of plant images, DL approaches have automatically learned to recognize patterns and features associated with specific diseases. This capability has enabled rapid and accurate diagnosis, supporting more effective treatment and prevention strategies for farmers and researchers. In this context, the present study has introduced the MP-NAG-CNN method for the multi-class classification of tomato leaf diseases. To enhance the performance of the model, preprocessing steps such as image resizing and data augmentation have been applied. The experimental results have demonstrated that the proposed MP-NAG-CNN method has reached a better accuracy of 99.95% and 99.98% as compared to the existing methods such as CapsNet and DenseNet121. These results have indicated the potential of DL techniques to deliver highly accurate and efficient solutions for tomato disease identification. From a practical perspective, the proposed MP-NAG-CNN approach has been efficiently deployed in real-time agricultural disease monitoring systems and smart farming environments to assist farmers in timely disease identification. In the future, the adaptability of the proposed model will be estimated under real field conditions, and its effectiveness will be improved through incorporating the attention mechanisms, edge-computing deployment, and real-time image acquisition systems to further enhance the scalability and robustness.