I.INTRODUCTION
Background:
Due to an increasing global population, the demand for food has been increasing exponentially. Fish, among the most sought-after sources of protein throughout a large population base, have become a cornerstone in the dietary preferences of billions. This increasing demand has placed heavy pressure on natural capture fisheries. As a result, wild fish stocks are declining rapidly due to overfishing. The growing supply–demand gap has led to this ecological strain and forced aquaculture, the controlled farming of aquatic organisms, in response to the gap.
Gabon, which among other activities, has become indispensable in ensuring food security, has contributed over 50% of the world’s fish production from aquaculture. Yet, whereas agriculture has made substantial progress in technological development, aquaculture has not. Current aquaculture practices still depend largely on manual monitoring of water quality, disease status, and feeding. These processes are labor-intensive and prone to human error [1]. Additionally, diseases continue to be one of the largest hurdles faced by aquaculture, resulting in billions of annual lost fish yield and quality [2].
When addressing these issues, it is important to apply cutting-edge artificial intelligence (AI) technologies. Machine learning, deep learning, and Internet of Things (IoT) devices can support intelligent aquaculture. These technologies enable early disease detection, efficient resource management, and improved productivity [3]. A number of deep learning models, including convolutional neural networks (CNNs) [4], and various attention mechanisms, such as the Squeeze-and-Excitation (SE-Net) [5] and the Convolutional Block Attention Module (CBAM) [6], have been extremely successful for tasks of image recognition, classification, and management and are particularly suited for fish disease detection.
Problem Addressing:
Despite its promise, fish farming has several significant technical challenges:
Identifying fish disease
Manual disease identification often causes delay in diagnosis. This delay may worsen disease spread in fish farms. The problem becomes more difficult because several fish diseases show overlapping visual symptoms.
Collection and Annotation of Data
The collection of diverse and high-quality datasets pertaining to fish disease and different fish species is a specialist bottleneck. The process of accurately annotating these datasets is both costly and time-consuming.
Robustness and Accuracy of Model
The existing models lack the needed accuracy caused by imbalanced datasets pertaining to fish and other variable environmental parameters of the aquaculture system (such as lighting, water clarit,y and fish movement). To improve the existing models, it is needed to design more robust models.
Seamless Integration with Aquaculture Systems
Numerous aquaculture systems and fish farms still use outdated legacy systems that do not have the technological capacity to interface modern AI. The need for seamless integration to AI systems of existing aquaculture systems remains a significant challenge.
Cost of Implementation
A significant number of aquaculture systems are considered small scale, and these fish farmers do not retain the financial capital to incorporate systems that are AI-driven.
Resistance to Change
The lack of technical savvy of the farmers and their reluctance to the incorporation of newer systems creates the need for prolonged training and extensive awareness programs.
Regulatory and Ethical Concerns:
The widespread implementation of AI in aquaculture is also affected by data privacy, ethical concerns regarding the use of AI, and regulatory restrictions in certain areas.
How to Address the Challenges?
To tackle these challenges, we develop an AI-based framework on fish disease detection and management using deep learning models, particularly CNNs, Residual Network (ResNet), and attention mechanisms like SE-Net and CBAM. This framework is designed to automate and accurately scale disease management in aquaculture and focuses on seven disease (class) common to fish:
- •Bacterial Red disease
- •Aeromonas (bacterial disease).
- •Bacterial Gill disease
- •Saprolegniasis (fungal disease)
- •Healthy Fish
- •Parasitic diseases
- •White tail disease (viral disease)
CNNs are great at zooming through the spatial hierarchy in image data, for instance, to find lesions, discoloration, or fish patterns, among other things. They can be processed as such, using minimal preprocessing as compared to traditional image processing techniques [7].
But, finally, the downside of CNNs is that they suffer from overfitting when trained on small datasets, and without large datasets, they don’t generalize well. The reason we have such a limitation is due to the huge number of parameters for a CNN to learn, which requires extensive data to learn meaningful patterns without memorizing noise.
ResNet, through its skip connections, mitigates the vanishing gradient problem encountered in deep networks. ResNet-18 (Residual Network with 18 layers) was selected for its pretrained models based on its lightweight architecture which optimally balances computation and feature extraction. ResNet models utilize transfer learning, a technique in which models are trained on large datasets, for example, ImageNet, and then the learned parameters are used for the current task [8]. This approach helps in alleviating the amount of large fish-specific datasets needed, ultimately enhancing performances on small datasets.
SE-Net channels attention to the important areas, in this case, the identification of a disease, providing the system the necessary information to target [9]. By focusing on the adjustment of the feature recalibration to the disease, SE-Net enhances the model to be more responsive to disease-related patterns. The use of SE-Net in learning using less noisy data with important features reduces the large dependence on datasets the models require and thus reduces the large dataset requirement.
The CBAM takes both channel and spatial attention into account so that it can pay attention to the image of disease-affected regions [10]. This dual attention mechanism further refines the feature extraction. Thus, CBAM enriches the ability of the model to learn the tiny pattern and localized feature when the variety of training data is limited.
The method proposed combines CNNs, ResNets, SE-Net, and CBAM and creates a robust and scalable framework for fish disease detection that makes accurate classification and early disease management possible as well, even with the constraints of a small dataset.
Although SE and CBAM attention mechanisms are well established in computer vision, their systematic evaluation for fish disease detection under small-scale aquaculture image datasets remains limited. Therefore, the main contribution of this study is not only the proposal of a completely new attention architecture but also the development and validation of a domain-specific, lightweight, and deployable deep learning framework for fish disease classification. The study contributes by:
- (i)Curating and organizing a seven-class fish disease image dataset collected from Kaggle and field/web sources.
- (ii)Evaluating CNN, ResNet-18, SE-ResNet-18, and CBAM-ResNet-18 under a common preprocessing and training protocol.
- (iii)Analyzing the role of channel and spatial attention in improving disease-specific feature representation.
- (iv)Demonstrating the feasibility of deployment through a flask-based web interface for practical aquaculture disease screening.
The rest of the paper is organized as follows. Section II presents the literature review on AI, deep learning, and attention-based methods for aquaculture and fish disease detection. Section III describes the proposed methodology, including dataset preparation, preprocessing, ResNet-18, SE-ResNet-18, and CBAM-ResNet-18 model development. Section IV presents experimental results, comparative performance analysis, ablation study, and computational complexity evaluation and web-based deployment interface for real-time fish disease prediction. Finally, Section V concludes the study and outlines possible future research directions.
II.LITERATURE REVIEW
The impact of fish diseases on production loss is two-fold: economically and in terms of biodiversity. Methods of diagnosis in fish disease are traditionally manual, time-intensive, and subject to the risk of error. With the growing use of deep learning in diagnosing disease, automated detection becomes possible, as do time and cost efficiencies, using images and monitoring. Models of AI such as ResNet, SE-ResNet, and CBAM-ResNet can improve early detection and thus associated response actions. The research herein is the integration of technology and aquaculture and thus supports research in sustainable aquaculture to improve the negative biodiversity and economic impact. In this section, we highlight what has already been done and has not been studied or where existing research is insufficient.
Rather et al. (2024) study the transformative potential of AI in aquaculture to respond to a growing demand for food, specifically for fish protein, while wild fish stocks decline. Using examples of machine learning algorithms, smart IoT devices, and computer vision in aquaculture, the authors describe how AI drives better fish health monitoring, feed optimization, water quality management, and environmental sustainability. The paper emphasizes how AI can be used to predict growth in fish, outbreaks of diseases, and reproduction rates using data from sensors and cameras to enable real-time decisions. The study synthesizes prior research to highlight the successes of AI in labor reduction, waste reduction, environmental impact reduction, and productivity and ecological sustainability increase in aquaculture [11].
Using image processing and machine learning, Ahmed et al. (2022) address the challenge of detecting fish diseases in aquaculture, as fish are a major species of world aquaculture [12]. Preprocessing is carried out using cubic splines interpolation, adaptive histogram equalization, and RGB-to-L * a * b color conversion; and segmentation is done using k-means clustering. Some statistical and GLCM features are extracted and trained using a support vector machine (SVM) classifier. On a customized dataset, the SVM performed best with an accuracy of 94.12% (augmentation) compared to other classifiers like Decision Tree and Logistic Regression, and an accuracy of 91.42% (no augmentation) on 266 images and 1,326 images with augmentation. The current study aims to address the gaps identified such as limited research on salmon diseases and the use of basic classifiers in existing studies. The authors make use of SVM, which helps to achieve greater accuracy and reliability. With this framework, we provide a solution to automatically detect fish disease, which is a critical need in aquaculture. Future work will entail the use of CNNs for even higher precision, an increased number of data points, and integration with real-time IoT-based monitoring systems in order to effectively support the aquaculture farmers.
Islam et al. (2024) highlight the application of advanced technologies to identify and manage fish diseases in aquaculture, specifically focusing on machine learning, AI, and IoT. These technologies enable disease prediction, early pathogen detection, and aquaculture management based on data from these sensors, genomic sequencing, and image processing. We have introduced techniques like SVM, gradient boosting, and CNN for improving the disease diagnosis accuracy. Some of the challenges include less data, more significant costs, and technical barriers to small-scale farms. Aquaculture sustainability and disease prevention can be achieved by integrated AI systems that will be promoted by the study [13].
Fish disease detection in aquaculture using image-based machine learning is explored by Pullayyagari et al. (2022). The researchers used image segmentation using adaptive histogram equalization and k-means clustering as a preprocessing method. An image processing technique was employed to extract features, which were then classified using SVMs to determine the fish type (healthy or diseased salmon). However, other classifiers failed to achieve accuracy of model on augmented and raw datasets of 94.12% and 91.42%, respectively. The study underscores the importance of early disease detection in aquaculture and proposes potential research areas in CNNs and IoT systems to improve the efficacy of the detection process [14].
Kaur et al. (2023) is exploring DL and ML application in smart fish farming by automating water quality and precision feeding and predicting fish diseases [15]. In our research, we evaluated some of the models that can predict fish growth, and LSTM was found to be the best one compared to random forest and SVM, which had an accuracy rate of 82%. The system was designed to be connected with IoT, cloud computing, and AI to enable decision-making in real time when faced with problems such as the drop in water quality if an inefficient use of it is observed. The system relies on the sensors and requires significant computations, as well as a lot of labeled data. The study suggests that there is room for more innovation and research on adaptive algorithms and spatiotemporal modeling to better realize the potential of DL to transform aquaculture in a more productive and sustainable manner.
This study by Salako et al. (2024) examines the use of AI in the Nigerian catfish industry and how it can enhance the management of this aquaculture market. The research uses computer vision and DL techniques to evaluate three object detection models using a dataset of aerial imagery of catfish ponds and supplemental online data. The best was Faster R-CNN which also attained a good balance between precision and recall. The model was successfully coupled to an object-tracking system and applied as an application for fish detection and tracking. AI tools can streamline monitoring tasks, improving accuracy, efficiency, and resource management in aquaculture, and the study underscores the potential of AI-driven tools to streamline monitoring processes and boost accuracy, efficiency, and resource management in aquaculture [16].
Lim (2024) analyzes the incorporation of different strands of AI technologies in aquaculture and fisheries, particularly in the areas of DL, machine vision, IoT, and robotics. The review shows how AI can enhance the operational efficiency and ensure sustainable aquaculture, such as in water quality monitoring, smart feed systems, disease diagnosis and analysis, and behavioral analysis. Standout developments and applications of the AI-driven fish farming and integrating blockchain in shrimp supply chains were highlighted. Use of AI in vertically integrated, automatic, and environmentally friendly cultured meat systems as an emerging protein source was also discussed. The review outlines some of the hurdles in the implementation of AI including lack of data and high operating costs of AI. The use of AI in aquaculture could potentially create an entirely automated aquaculture system to address the increasing demand for fish produced in the global food market, although most of these challenges and intractability have been outlined in the review [17].
Researchers have encountered specific difficulties outlined in Rather et al. (2024). These include small-scale operations, predictive models, and real-time decision-making system integrations, which all require infrastructural improvements within and across small-scale operations [18]. Ahmed et al. (2022) use traditional image processing, such as cubic spline interpolation and SVM, which is not readily applicable to complex and disparate datasets. Ahmed et al. also cite sparse research on salmon-specific diseases, which limits the generalizability of their studies. Islam et al. (2024) observe small sample datasets and high computational costs that may contribute to the lack of AI adoption in disease detection systems for resource-poor small-scale aquaculture. Pullayyagari et al. (2022) and others who use image processing, such as k-means clustering and adaptive histogram equalization, risk oversimplifying their approach to the complex real-world problems of fish disease. They also do not fully leverage cutting-edge deep learning models such as CNNs and, thus, do not contribute fully to the literature. Kaur et al. (2023) cite the need for more versatile and inexpensive AI solutions to the challenges of high computation, extensive, and expensive labeled datasets and the use of numerous sensors to enable large-scale aquaculture. Salako et al. (2024) and others observe marked constraints integrating real-time systems with object detection models and cite unreliable systems in unpredictable environments.
According to Lim (2024), costs, data-related issues, and integration challenges are obstacles to the use of AI-driven solutions in aquaculture. Advanced deep learning methods such as ResNet, SE, and CBAM are some techniques that could potentially tackle such obstacles [19]. Small datasets can lead to big problems such as overfitting, but ResNet helps with this by smoothing out the gradient flow and learning features efficiently. The model is guided to focus on the most relevant features and is therefore particularly useful in situations with limited data. CBAM improves classification by enhancing the model’s focus on the most important elements of the image in both the spatial and channel dimensions, thereby improving classification accuracy. With the inclusion of these techniques, CNNs can become more effective image classifiers, even with limited training data. ResNet, SE, and CBAM are widely used and successfully applied in deep learning, image classification, and even image processing.
In the realm of large-scale data classification, ResNet is most commonly used, for example, with the widely used dataset of ImageNet [20]. Thanks to its deep architecture which is made of those good old residual blocks, it helps in solving the good old vanishing gradient problem saving it from the trouble of having to deal with gradient problems and therefore losing the whole model’s capacity.
In commercial implementations, ResNet-50 has been employed in medical imaging, specifically in the diagnosis of pneumonia, breast cancer, and brain tumors in X-rays and MRIs [21,22]. ResNet is frequently utilized as a backbone in object detection models (e.g., Faster R-CNN). This is especially beneficial in autonomous driving and surveillance. ResNet-based models in self-driving cars allow for the real-time detection of pedestrians, cars, and traffic signals [23]. SE blocks are shown to enhance feature learning in networks by recalibrating channel-wise feature responses, improving the accuracy of classification, especially on small datasets [24,25]. Medical image analysis applications of SE-ResNet models are applied in the classification of tumors on radiology images. Land Use classification and object segmentation in high-resolution images are performed with SE-based models in satellite imagery. Video-based models are coupled with SE to achieve improved performance by focusing on crucial frames and improving temporal feature learning. For action recognition in videos, models have been able to classify different activities in sports analytics.
This has been particularly useful in tasks in which specific regions (spatial attention) and feature channels (channel attention) are essential. Image classification tasks are also applied successfully to CBAM as we can focus on important regions in images such as in medical images (e.g., to classify diseases such as detecting cancerous lesions in breast tissue or skin). The use of CBAM makes it clear that the right features (channel attention) along with the right regions (spatial attention) for object detection enhance performance. For example, CBAM has been used to detect and track objects more accurately in vehicle detection or pedestrian tracking of surveillance systems based on only its essential parts.
Recent studies show the effectiveness of deep learning and attention-based models in disease identification across different domains. Kothuru and Kumar (2025) proposed a federated learning model with optimized neural network structures for cardiovascular disease classification across multi-hospital patient data, highlighting the importance of scalable and privacy-aware intelligent diagnosis [26]. Similarly, Song and Mariano (2024) applied a residual neural network with an attention mechanism for fruit tree disease recognition, demonstrating improved feature learning and classification performance. These studies support the use of ResNet-based architectures and attention mechanisms for accurate disease detection, motivating their application in aquaculture disease diagnosis [27].
III.METHODOLOGY
An initial CNN model is developed to classify fish diseases from images. However, its performance was limited because of the small dataset size. To overcome this, a pretrained ResNet-18 model is employed, and its accuracy was further enhanced by integrating attention mechanisms, namely SE and CBAM. The models were evaluated using training, validation, and testing accuracy. After training, an unknown fish image was passed through the trained models to predict the disease class. The proposed workflow is illustrated in Fig. 1, while Fig. 2 demonstrates the process of predicting the class of an unknown image.
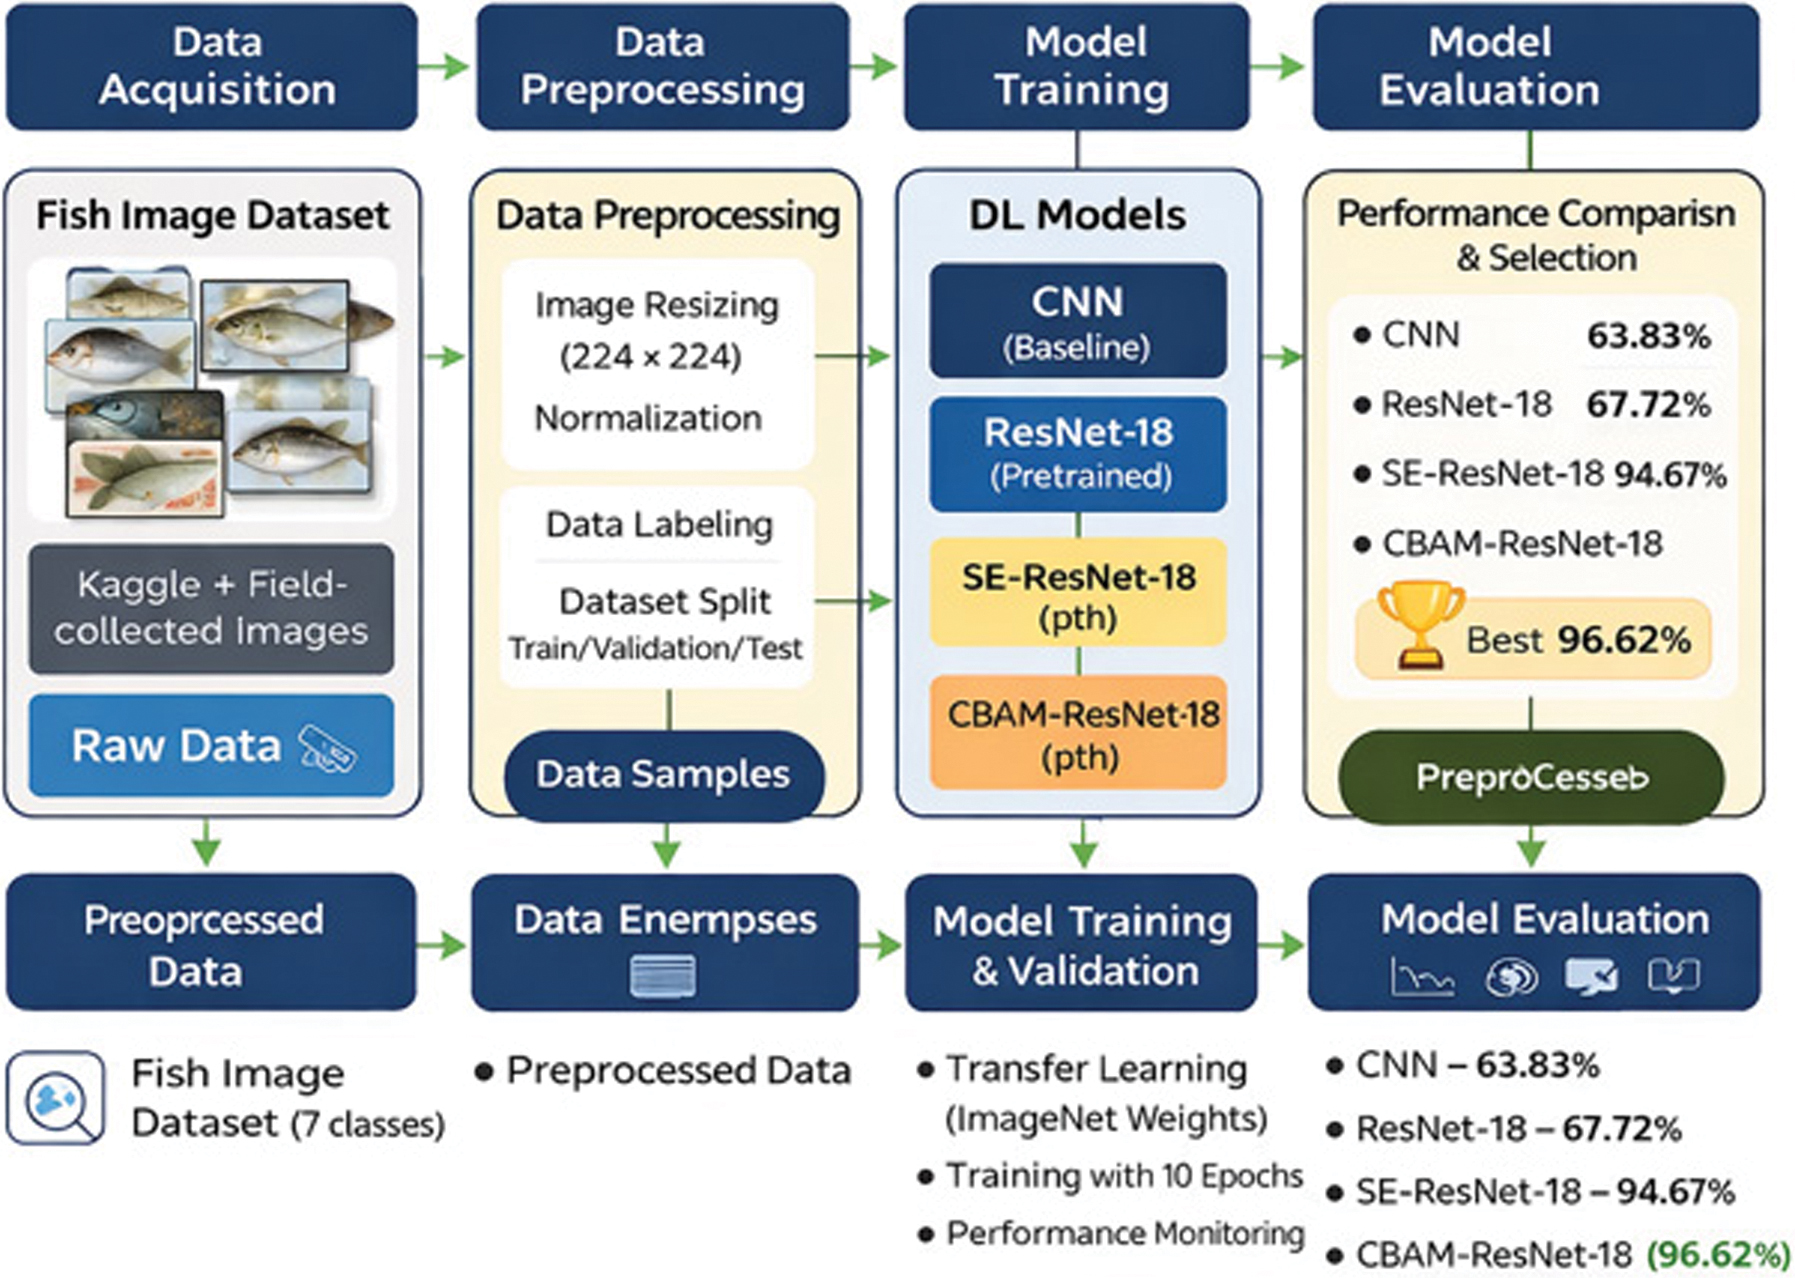 Fig. 1. The proposed workflow.
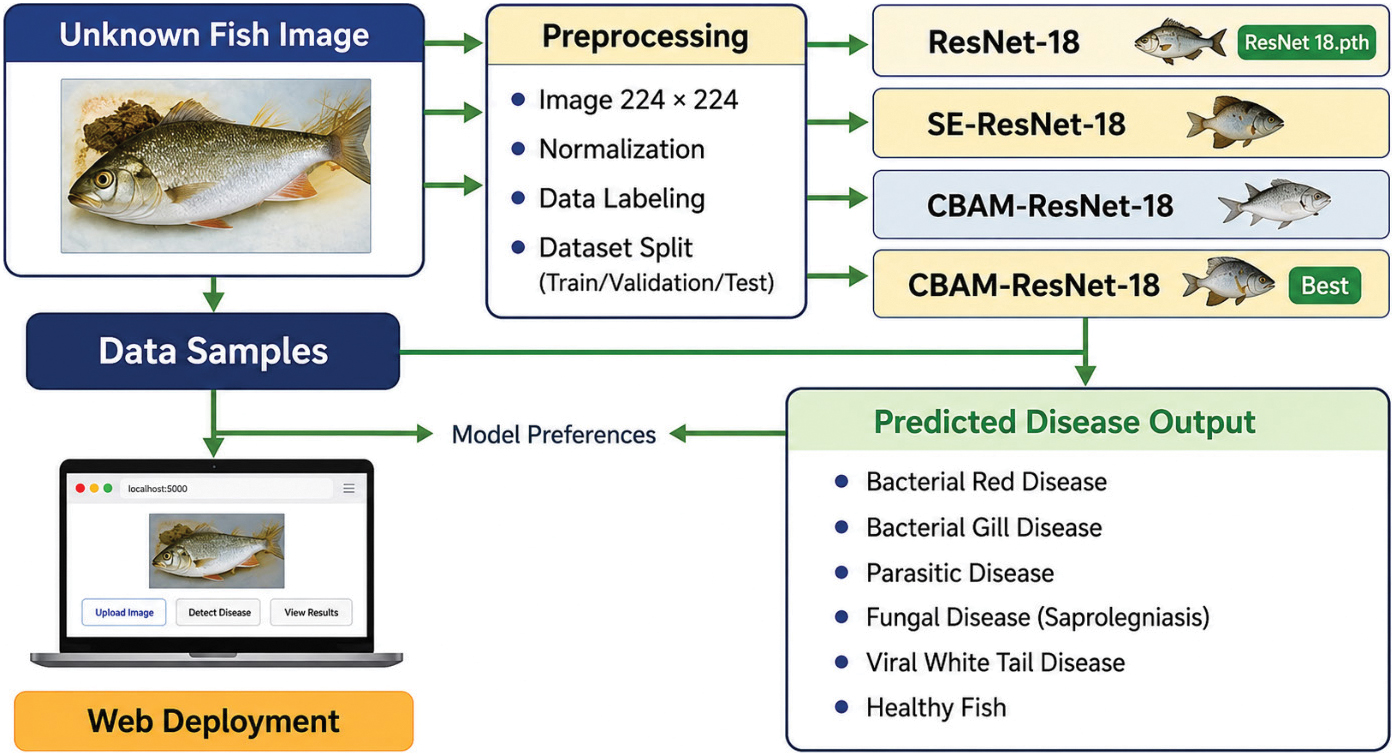 Fig. 2. Predicting the class of an unknown image.
ResNet-18: As shown in Fig. 3, a deep learning architecture is introduced as part of the ResNet family, known for addressing the vanishing gradient problem that often hinders the training of deep networks. Here are some key technical details and strengths.
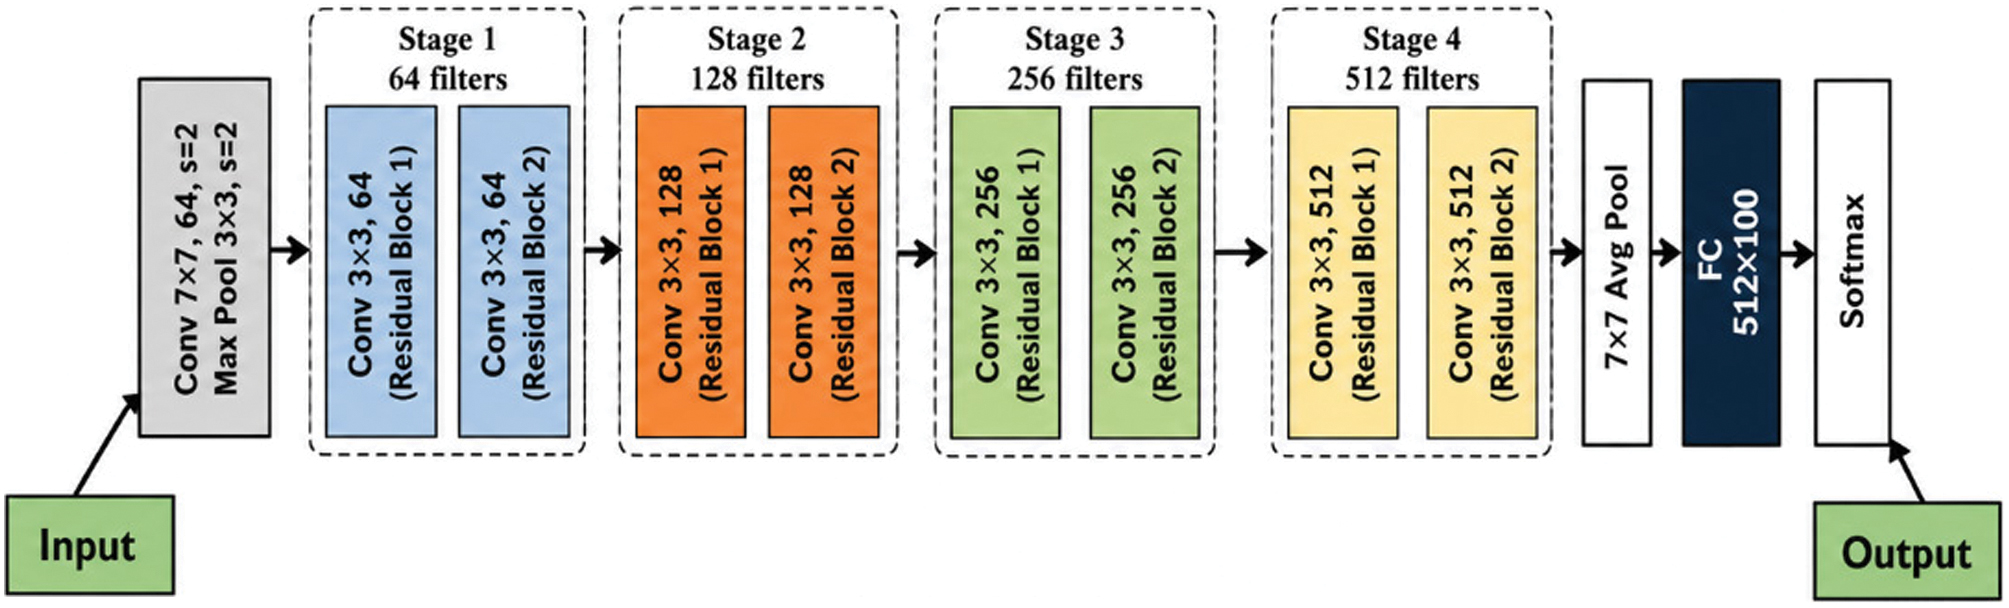 Fig. 3. ResNet-18 architecture.
ResNet-18 Architecture Overview:
Residual Blocks: ResNet-18 uses residual connections (skip connections) to allow gradients to flow directly through the network, bypassing intermediate layers. This reduces the chances of vanishing gradients and helps train deep networks effectively.
Layer Details:
- Initial Layers:
- A 7 × 7 convolutional layer with 64 filters and a stride of 2, followed by max-pooling.
- Convolutional Blocks:
- Four stages of convolutional layers, each doubling the number of filters (64, 128, 256, 512).
- Each stage has two residual blocks.
- Global Average Pooling: Reduces the feature map dimensions to a vector.
- Fully Connected Layer: Outputs predictions based on the extracted features.
Activation Function: Softmax is used as the activation function in all layers.
Output: A Softmax layer generates probabilities for classification tasks.
ResNet-18 offers several key strengths that make it highly effective for image-based tasks, even with limited data. Its residual connections allow the model to bypass certain layers, enabling the learning of identity mappings and incremental changes while avoiding the degradation problem common in deeper networks. Although ResNet-18 is constructed to be deep, its parameters are still more efficient than the vanilla CNN which therefore helps against overfitting on small data. Moreover, by leveraging transfer learning where it is possible to simply fine-tune a model pretrained on a large dataset like ImageNet for certain tasks, it is particularly apt for situations with very few training samples. Deep architecture provides enough layers to extract hierarchical feature. Low-level edge features are extracted in the early layers, while high-level features are extracted in the deep layers. Residual blocks help the network to get more representations and perform better on complex tasks such as fish disease detection.
The proposed methodology has technical advantages that are significant, compared to ResNet-18. It is deep, but efficient, a trade-off between depth and computational complexity. It is deep enough to learn complex features but still lightweight compared to big ResNet variants like ResNet50 or ResNet101. It works well with network resources limitations. Furthermore, ResNet-18 is very flexible, and it can easily be combined with attention mechanisms such as SE and CBAM. ResNet-18 is a good starting point for advanced image-based tasks such as fish disease detection, as these enhancements refine feature extraction and enhance model accuracy by only focusing on the most relevant parts of the input.
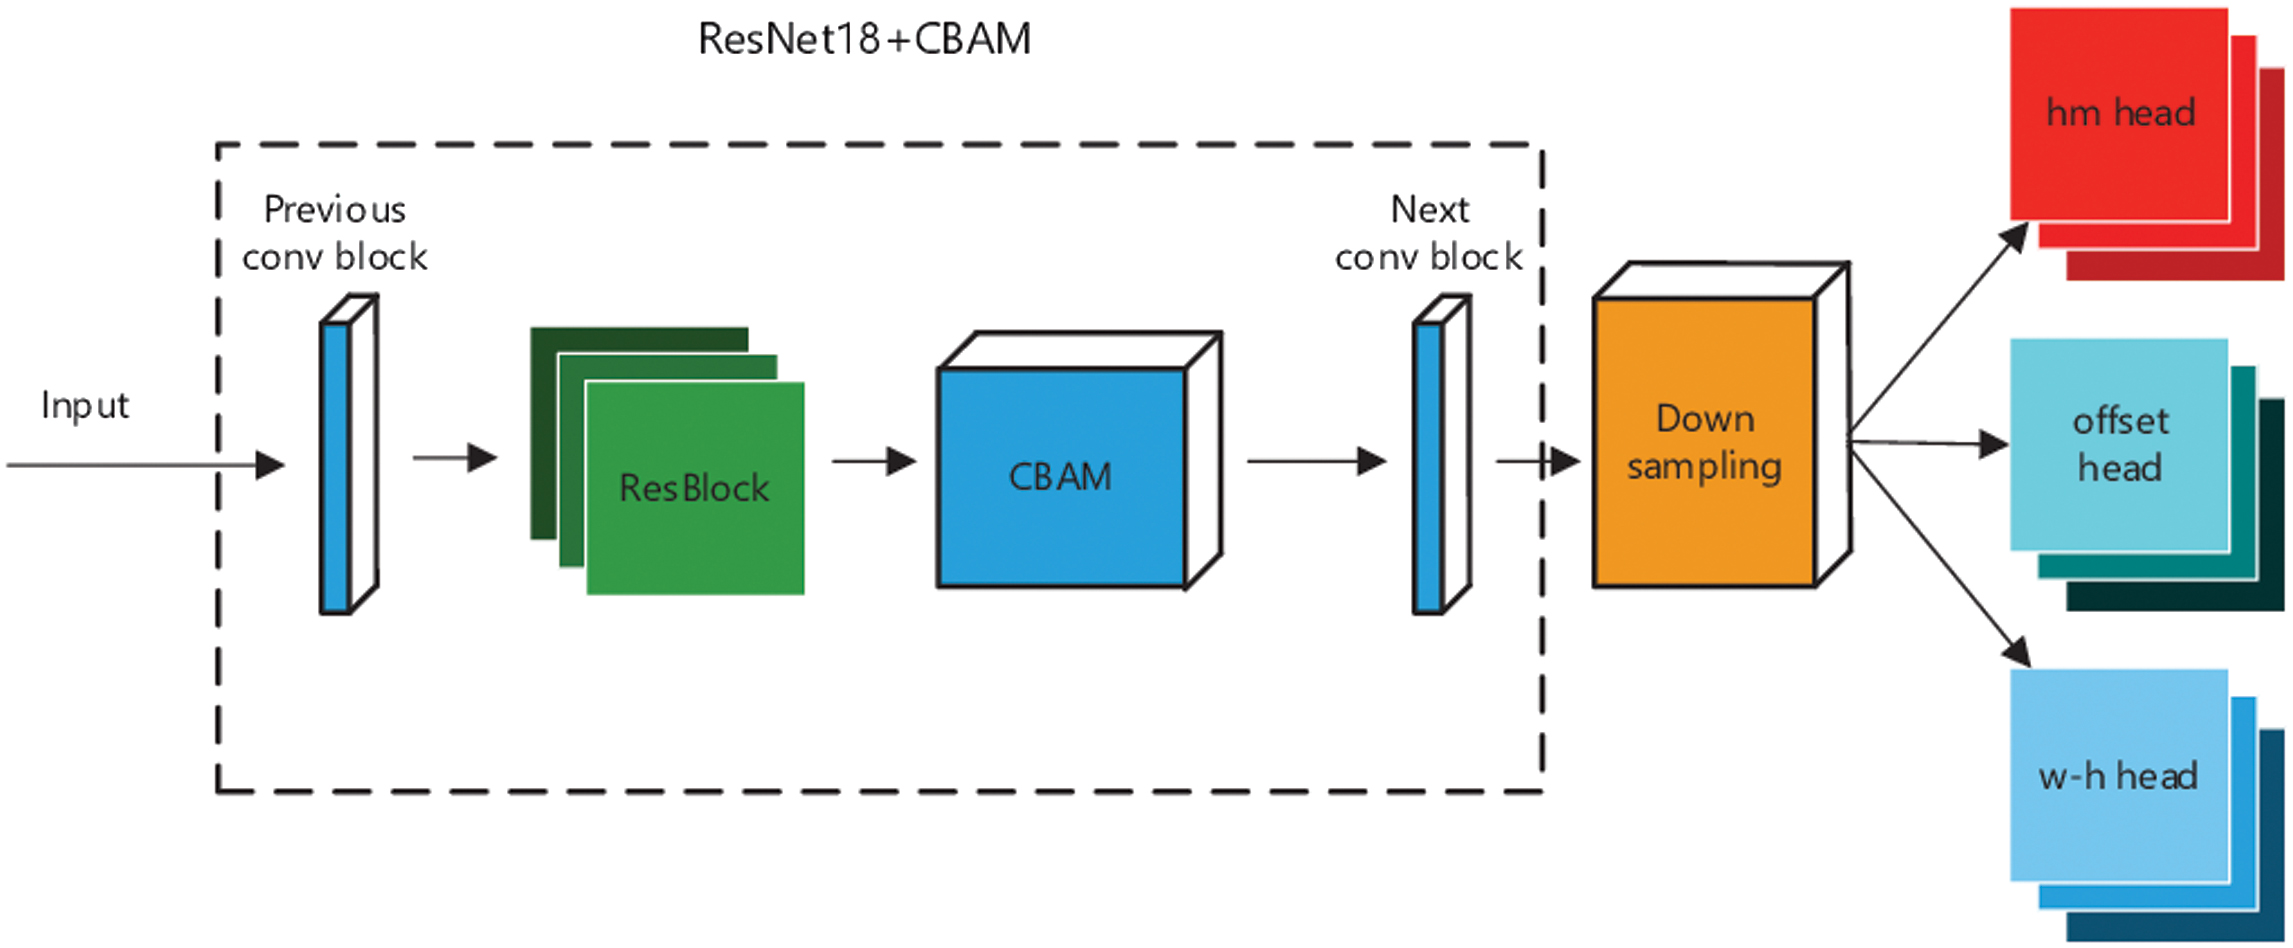
To take advantage of the integration of SE and CBAM attention mechanisms, the proposed architecture is employed, as shown in Figs. 4 and 5.
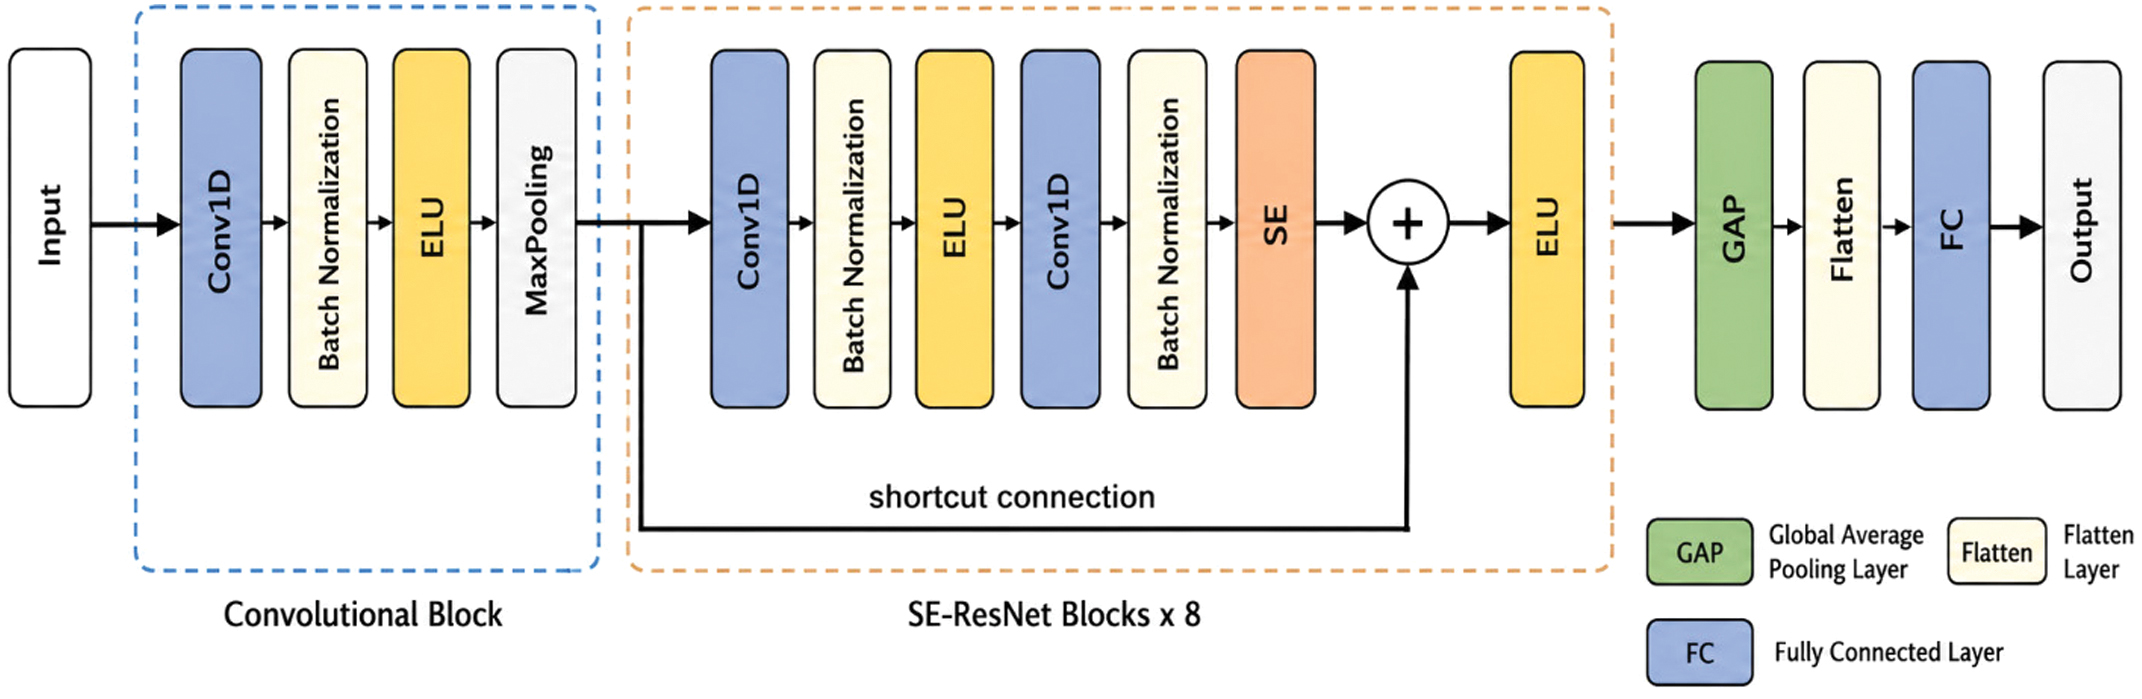 Fig. 4. Squeeze-and-Excitation (SE) attention mechanism architecture.
As a so-called attention block, the SE block is a strong mechanism to increase the representation of the features in CNNs such as ResNet-18. SE module is a channel attention mechanism that dynamically recalibrates feature responses of a neural network. The primary goal is to enable the focus of the network on the most important ones, while removing less relevant ones. SE blocks thus enable the model to increase the representational capacity of those channels in such a way that the relative importance of each one matters: these channels matter more, or less, depending on task complexity.
The procedure of the SE block has three steps. In the Squeeze phase, first, we perform global average pooling (GAP) to compress spatial dimensions to a single scalar per channel, which summarizes global contextual information. In the Excitation phase, we use the pair of fully connected (FC) layers with nonlinear activations (ReLU and sigmoid) to discover inter-channel interactions and learn the importance of channels. In the Reweighting step, these importance scores are then used to multiply the original feature maps, thereby highlighting important features and deemphasizing irrelevant ones.
SE blocks, in principle, prioritizing channels that contribute more to the task at hand, significantly enhance feature discrimination. A recalibration mechanism is proposed enabling SE blocks to achieve improved network performance, without much computation overhead. They also help to better optimize and converge during training through the improvement of gradient flow.
Improvement of ResNet-18 with SE:
When integrated into ResNet-18, SE blocks enable the model to focus more effectively on critical features by enhancing inter-channel dependencies. This not only improves the accuracy of the network but also makes it more robust, particularly for datasets with limited samples. SE blocks seamlessly integrate into the residual blocks of ResNet-18 without altering its architecture, resulting in a more powerful and efficient network.
As shown in Fig. 5, CBAM, a very sophisticated attention mechanism, is proposed to improve a network’s focus on important features through both channel attention and spatial attention. CBAM extends SE blocks by incorporating spatial attention to additionally account for the relevant region in the input feature map. This dual approach is a “what and where” approach, which enables the network to “capture” both what features are important and where they are located in the input data.
Two sequential stages of attention are employed in the operation of CBAM. In the first, attention channel aggregates the spatial information by passing the feature map through global and max pooling. FC layers take these pooled features and computes channel importance scores, which are then get multiplied with the input feature map. It then pools across channels (using average and max pooling) and then performs convolutional layer and sigmoid activation to find the spatial attention maps. Refined channel features are multiplied with these maps to further focus the network’s view on important regions.
Dual attention mechanisms of the CBAM block enhance feature representation. CBAM improves the model’s ability to select meaningful patterns and suppress irrelevant information by dynamically refining both channel and spatial feature. The key idea is that while still computationally lightweight, it introduces minimal overhead and therefore spares the network with the excess spending, also making the network more interpretable by pinpointing critical regions in spatial attention maps. CBAM possesses these properties, especially well suited for tasks where spatial and feature-level importance are important.
Improvement of ResNet-18 with CBAM:
Integrating CBAM into ResNet-18 significantly improves its performance by refining the feature extraction process. CBAM, which is integrated into ResNet-18, boosts its performance by enhancing the feature extraction process. The dual attention mechanisms help the model to attend to the most relevant features as well as their spatial locations, which in turn results in the more accurate and robust results. CBAM is used in the ResNet-18 to improve its capability of handling complex patterns and small datasets, as shown in the attached diagram. This refinement gives ResNet-18 + CBAM the ability to perform better in image classification and object detection tasks, leading to better localization and discrimination of features crucial for the task.
IV.EXPERIMENTAL RESULTS
To evaluate the suggested methods, a dataset from Kaggle pertaining to aquaculture disease pertaining to South Asia freshwater fish was utilized. The dataset used in this study consists of 2450 fish images distributed across seven classes, with 350 images per class. Therefore, the dataset is balanced at the class level. The seven classes include Bacterial Red disease, Aeromonas bacterial disease, Bacterial gill disease, Saprolegniasis fungal disease, Healthy Fish, Parasitic disease, and White tail viral disease. To avoid biased evaluation, the dataset was divided into training, validation, and testing subsets in a stratified manner so that each disease category was proportionally represented in all subsets.
The images of the fish were gathered from different places in order to evaluate the proposed method. For instance, some images were collected from a university’s agricultural department and some from an agricultural farm in Odisha, India, accompanied by specialists who can recognize fish diseases. Some images were collected from agricultural portal websites. The chosen models are trained with 1770, validated with 268, and tested with 412 images. Every model is trained with 10 epochs. After generating the model, a web application using flask library was also created for testing any unknown fish disease.
Considering the limited dataset size, data augmentation was applied to improve generalization and reduce overfitting. The augmentation operations included random horizontal flipping, small-angle rotation, zooming, brightness adjustment, contrast variation, and minor translation. All images were resized to 224 × 224 pixels and normalized before being passed to the models. Augmentation was applied only to the training data, while validation and test images were used without augmentation except for resizing and normalization. This ensured that model evaluation was performed on real, unseen samples.
Initially, CNN model is generated, but due to due to the limited number of images, the performance of CNN is very poor. Its training and validation for every epoch are given in Table I. Its visual representation is shown in Fig. 6.
| Epoch | Train loss | Train accuracy | Validation loss | Validation accuracy |
|---|---|---|---|---|
| 1 | 2.0106 | 0.2128 | 1.8638 | 0.2276 |
| 2 | 1.8226 | 0.2685 | 1.7366 | 0.3321 |
| 3 | 1.6709 | 0.3538 | 1.6802 | 0.3657 |
| 4 | 1.5843 | 0.3931 | 1.6081 | 0.4216 |
| 5 | 1.524 | 0.4247 | 1.4704 | 0.4552 |
| 6 | 1.4605 | 0.4458 | 1.4206 | 0.444 |
| 7 | 1.4199 | 0.4751 | 1.3846 | 0.4664 |
| 8 | 1.3737 | 0.4895 | 1.2997 | 0.4925 |
| 9 | 1.3565 | 0.4971 | 1.2457 | 0.5597 |
| 10 | 1.3334 | 0.5096 | 1.1299 | 0.5672 |
Its Test Loss: 0.9793,
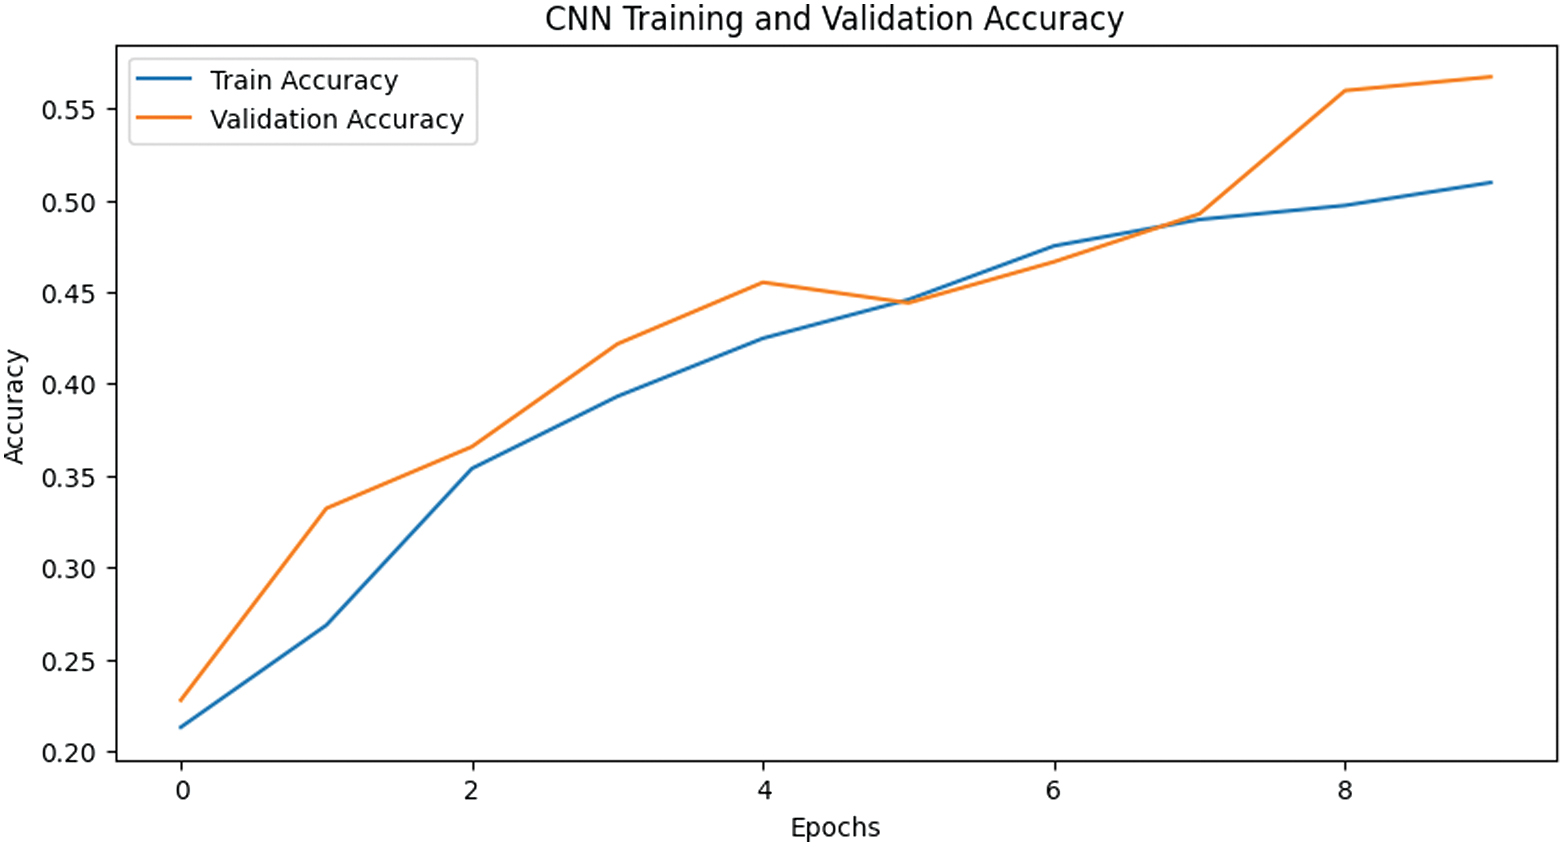 Fig. 6. Visualization of CNN model evaluation.
The training loss decreases consistently across epochs. This indicates that the model is learning useful patterns from the training data. Correspondingly, the training accuracy steadily improves from 21.28% in Epoch 1 to 50.96% in Epoch 10, demonstrating the model’s enhanced performance on the training dataset. Similarly, the validation loss decreases significantly from 1.8638 in Epoch 1 to 1.1299 in Epoch 10, reflecting improved generalization to unseen data. The validation accuracy also shows a marked improvement, rising from 22.76% to 56.72%, highlighting strong performance gains on the validation set. The gap between training and validation accuracy decreases over the epochs. By Epoch 10, both values are closely aligned. This suggests reduced overfitting and improved generalization.
Even though the model learning rate is increased for every epoch, it is not advisable to use this to predict the unknown image disease as the accuracy is 50.96%. Thus, another model ResNet-18 is generated. Its evaluation is presented in Table II along with the visual representation in Fig. 7.
Table II. ResNet-18 model evaluation
| Epoch number | Train loss | Train accuracy | Validation loss | Validation accuracy |
|---|---|---|---|---|
| 1 | 1.8879 | 0.2421 | 1.6472 | 0.3881 |
| 2 | 1.4992 | 0.4823 | 1.3445 | 0.5672 |
| 3 | 1.3393 | 0.5398 | 1.1842 | 0.6231 |
| 4 | 1.2295 | 0.5877 | 1.1411 | 0.6194 |
| 5 | 1.1739 | 0.6002 | 1.0907 | 0.6306 |
| 6 | 1.1492 | 0.6093 | 1.0513 | 0.6418 |
| 7 | 1.1015 | 0.628 | 0.9995 | 0.6567 |
| 8 | 1.0924 | 0.6266 | 0.9877 | 0.6716 |
| 9 | 1.0672 | 0.6424 | 0.9821 | 0.6866 |
| 10 | 1.0801 | 0.6419 | 0.9848 | 0.6828 |
Test Loss: 0.9814, Test Accuracy: 0.6772.
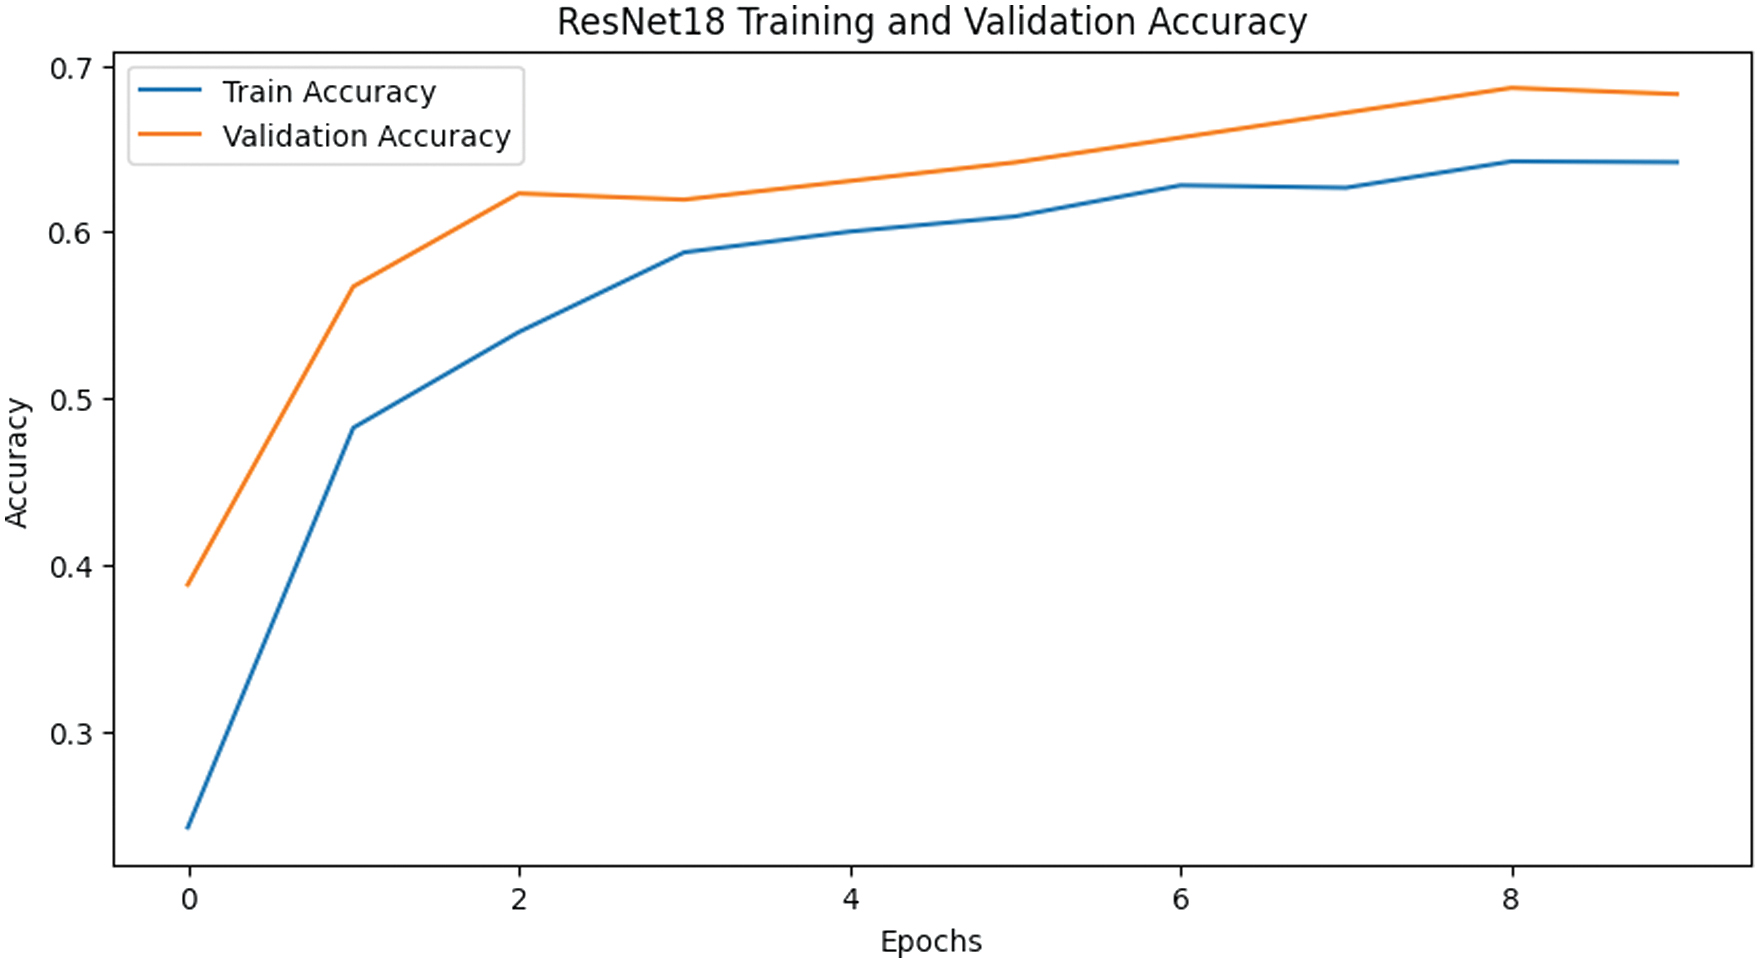 Fig. 7. Visualization of ResNet-18 model evaluation.
The training results show consistent improvement across epochs, with the training loss decreasing from 1.8879 in Epoch 1 to 1.0801 in Epoch 10, reflecting effective learning on the training data. Similarly, the training accuracy improves from 24.21% to 64.19%, indicating that the model is progressively fitting the training dataset better. On the validation side, the loss reduces from 1.6472 in Epoch 1 to 0.9848 in Epoch 10, and the accuracy rises from 38.81% to 68.28%, highlighting improved generalization to unseen data. The validation accuracy outpaces training accuracy in later epochs (e.g., Epochs 9 and 10), suggesting good generalization and minimal overfitting. Overall, the model demonstrates robust learning behavior with steady performance gains on both training and validation sets.
Even though the model learning rate is increased for every epoch and training rate is little better than CNN, it is not advisable to use this to predict the unknown image disease as the accuracy is 64.19%. To increase the performance, ResNet-18 is embedded with SE. Its evaluation is presented in Table III along with the visual representation in Fig. 8.
Table III. SE + ResNet-18 model evaluation
| Epoch number | Train loss | Validation loss | Train accuracy | Validation accuracy |
|---|---|---|---|---|
| 1 | 1.699 | 1.2667 | 0.3504 | 0.5522 |
| 2 | 1.1791 | 0.9306 | 0.593 | 0.7201 |
| 3 | 0.964 | 0.7212 | 0.6783 | 0.7761 |
| 4 | 0.8023 | 0.5235 | 0.7287 | 0.8507 |
| 5 | 0.6565 | 0.3905 | 0.7848 | 0.8694 |
| 6 | 0.5638 | 0.2934 | 0.8327 | 0.903 |
| 7 | 0.4892 | 0.2305 | 0.8375 | 0.9328 |
| 8 | 0.4344 | 0.2035 | 0.8653 | 0.944 |
| 9 | 0.4089 | 0.1923 | 0.8734 | 0.959 |
| 10 | 0.3956 | 0.1803 | 0.8749 | 0.959 |
Test Loss: 0.1534, Test Accuracy: 0.9476.
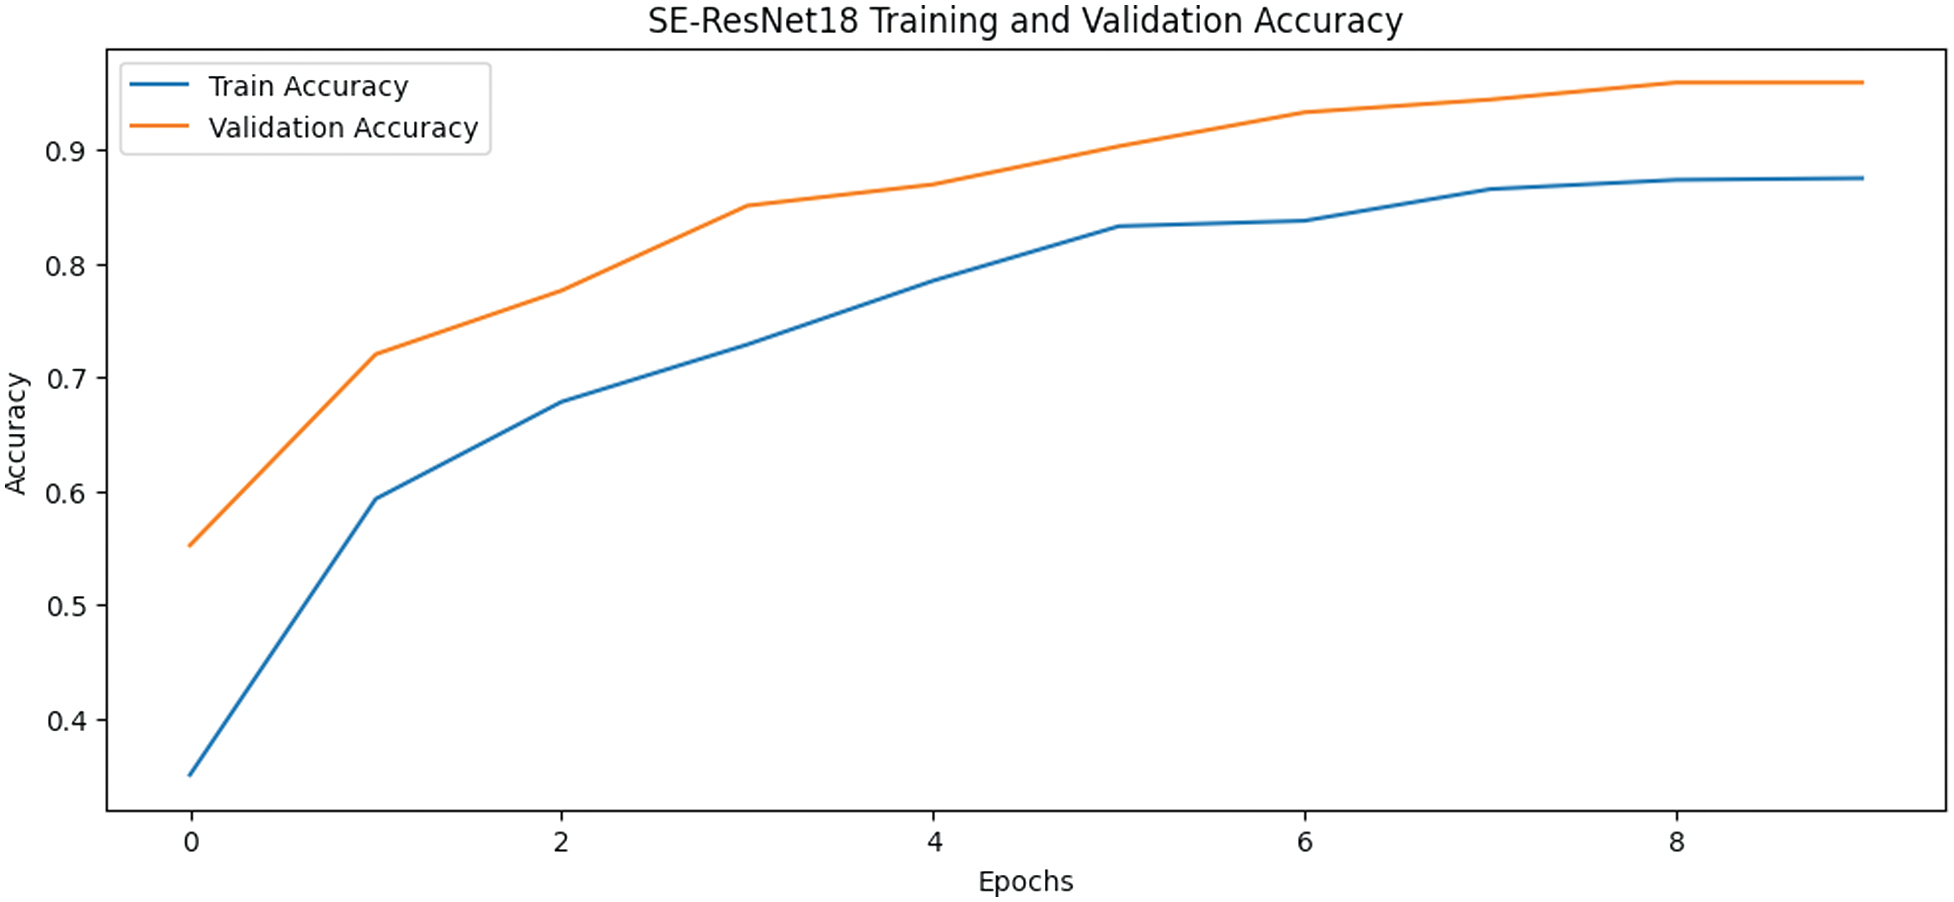 Fig. 8. Visualization of SE + ResNet-18 model evaluation.
The model represented by the SE + ResNet-18 table demonstrates significant improvements over the previous setups (CNN and ResNet-18) in both training and validation performance. The training loss steadily decreases from 1.6990 in Epoch 1 to 0.3956 in Epoch 10, while training accuracy rises from 35.04% to 87.49%, showing a much better fit to the training data compared to the previous setups, which had final training accuracies of 64.19% and 50.96%. Similarly, the validation performance is markedly superior, with validation loss reducing from 1.2667 to 0.1803 and validation accuracy climbing from 55.22% to 95.90%, far surpassing the prior models, which reached maximum validation accuracies of 68.28% and 56.72%.
Additionally, the current model converges faster, achieving validation accuracy of 86.94% by Epoch 5, which already exceeds the peak performance of the earlier setups. Importantly, the gap between training and validation accuracy remains minimal, especially in the later epochs, highlighting excellent generalization and minimal overfitting. These results indicate that the model in this setup is better optimized, likely due to improved architecture, hyperparameter tuning, or training strategies. Overall, the current model outperforms the earlier setups, achieving faster convergence, higher accuracy, and better generalization.
So, SE + ResNet-18 can be finalized to predict the unknown fish disease by its image. ResNet-18 is embedded with CBAM also to compare the SE. Its evaluation is presented in Table IV along with the visual representation in Fig. 9
Table IV. CBAM + ResNet-18 model evaluation
| Epoch number | Train loss | Validation loss | Train accuracy | Validation accuracy |
|---|---|---|---|---|
| 1 | 1.6643 | 1.2158 | 0.3754 | 0.6157 |
| 2 | 1.1482 | 0.9022 | 0.6184 | 0.7052 |
| 3 | 0.9067 | 0.6901 | 0.6994 | 0.7761 |
| 4 | 0.7395 | 0.5346 | 0.768 | 0.8284 |
| 5 | 0.6783 | 0.4156 | 0.7843 | 0.8657 |
| 6 | 0.5626 | 0.2808 | 0.8231 | 0.8993 |
| 7 | 0.5185 | 0.211 | 0.8303 | 0.9478 |
| 8 | 0.4307 | 0.1951 | 0.8663 | 0.9552 |
| 9 | 0.4087 | 0.1926 | 0.8792 | 0.9627 |
| 10 | 0.4235 | 0.1851 | 0.8701 | 0.9664 |
Test Loss: 0.1501, Test Accuracy: 0.9662.
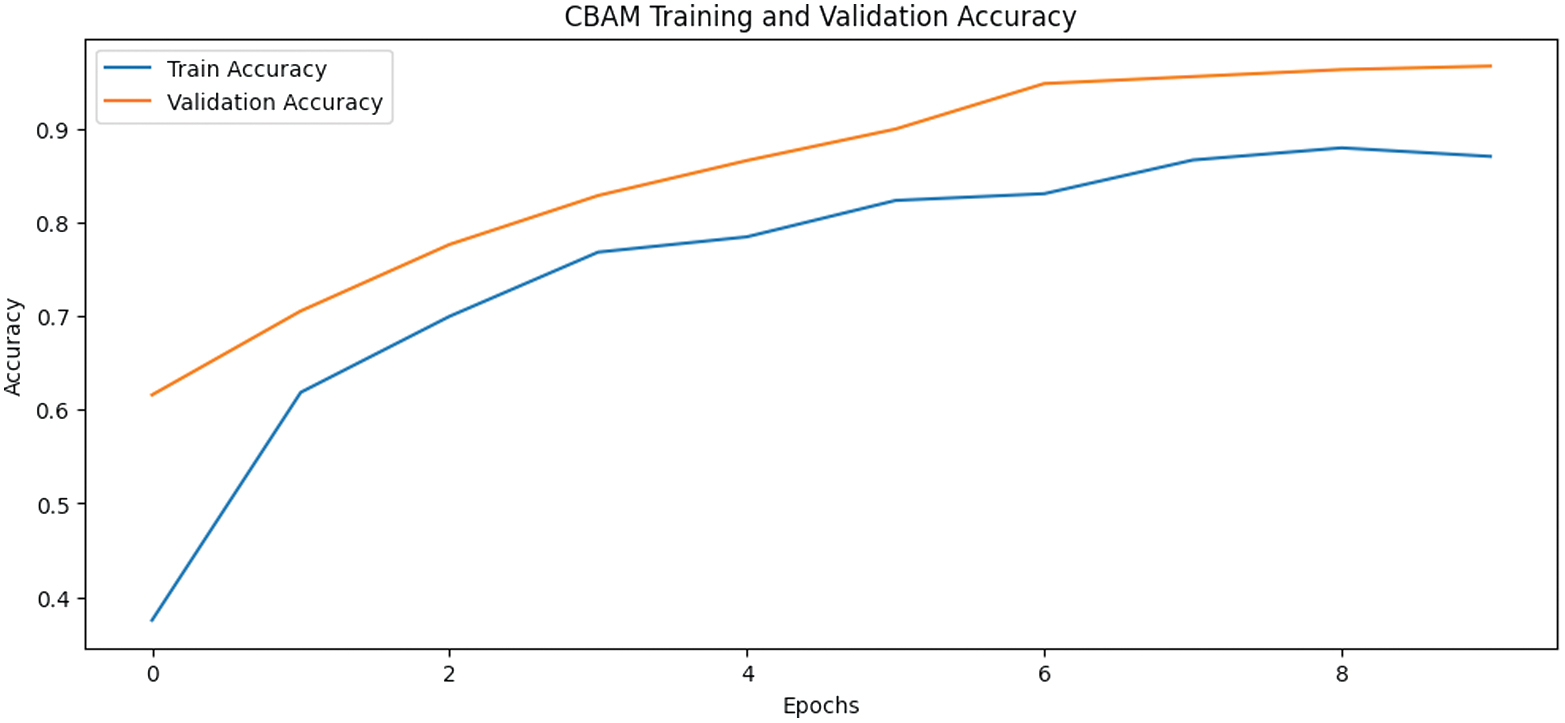 Fig. 9. Visualization of CBAM + ResNet-18 model evaluation.
The data in the table indicate that the model is improving after each epoch as shown by the training and validation metrics. The training loss decreases from 1.6643 in Epoch 1 to 0.4235 in Epoch 10. Training accuracy increases by 49.47% from 37.54% to 87.01%, demonstrating that the model is improving and fitting the training data. The validation loss is also decreasing from 1.2158 in Epoch 1 to 0.1851 in Epoch 10. Validation accuracy is also increasing by 35.07%, from 61.57% to 96.64% as seen in Epoch 10. This result shows that the model is generalizing well to unseen data. Validation accuracy is also higher than training accuracy as shown in the later epochs. This is most apparent from Epoch 7, showing that the model is generalizing well and overfitting very little. The model is also showing that it is optimized for achieving high accuracy and generalizing well. The scores for the task is high, as CBAM + ResNet-18 and SE + ResNet-18 are showing the same results.
The proposed model test accuracy and that of several existing models are shown in Table V. Test accuracy results in Table V shows how performance improved as more sophisticated architectures and mechanisms were employed. Baseline CNN model attained 63.83% test accuracy which is a reflection of its basic architecture and failure to generalize. ResNet-18 test accuracy is better at 67.72. He improved test accuracy by 5.34 utilizing its deeper architecture and better by capturing more complex features. He was also able to reduce the effects of the vanishing gradients. Incorporating SE blocks into ResNet-18 almost doubled test accuracy to 94.67. This exemplified the impact of the attention mechanisms on recalibrating feature maps and vector spaces to include relevant information. The test accuracy of the models improved the performance to 96.62 which is the best test accuracy of the models in this study. The ResNet-18 model overshadowed the rest of the models test accuracy and solidified its position as the state-of-the-art model. Incorporating modules of attention in the architecture of the models improved their performance significantly. More complex backbone architectures and attention mechanisms can also enhance the models.
Table V. All models test accuracy
| Model | Test accuracy |
|---|---|
| SVM (support vector machine) [ | 0.942 |
| LSTM [ | 0.82 |
| Proposed SE + ResNet-18 | 0.9467 |
| Proposed CBAM + ResNet-18 | 0.9662 |
In addition to test accuracy, Table VI reports the precision, recall, F1-score, and ROC-AUC to provide a more complete evaluation of classification performance.
Table VI. Comparative performance using extended evaluation metrics
| Model | Accuracy | Precision | Recall | F1-score | ROC-AUC |
|---|---|---|---|---|---|
| CNN | 0.6383 | 0.6420 | 0.6383 | 0.6358 | 0.7215 |
| ResNet-18 | 0.6772 | 0.6810 | 0.6772 | 0.6746 | 0.7628 |
| SE + ResNet-18 | 0.9476 | 0.9502 | 0.9476 | 0.9471 | 0.9814 |
| CBAM + ResNet-18 | 0.9662 | 0.9685 | 0.9662 | 0.9660 | 0.9912 |
The ablation study shown in Table VII demonstrates the individual contribution of the ResNet-18 backbone and attention mechanisms. The baseline CNN achieved a test accuracy of 63.83%, while ResNet-18 improved the accuracy to 67.72% because of residual learning and improved feature extraction. After integrating SE attention with ResNet-18, the accuracy increased substantially to 94.76%, showing that channel-wise feature recalibration helps the model focus on disease-relevant features. CBAM + ResNet-18 achieved the highest test accuracy of 96.62% by combining both channel and spatial attention. This indicates that spatial attention further improves the model’s ability to localize disease-specific visual regions such as gill discoloration, skin patches, lesions, and tail abnormalities. Although CBAM introduces a small computational overhead, the gain in accuracy justifies its use for practical aquaculture disease detection.
Table VII. Ablation study of ResNet-18 with SE and CBAM attention modules
| Model configuration | Residual backbone | Channel attention | Spatial attention | FLOPs/image | Avg. inference time/image |
|---|---|---|---|---|---|
| CNN | No | No | No | 0.45 GFLOPs | 18 ms |
| ResNet-18 | Yes | No | No | 1.80 GFLOPs | 62 ms |
| SE + ResNet-18 | Yes | Yes | No | 1.84 GFLOPs | 71 ms |
| CBAM + ResNet-18 | Yes | Yes | Yes | 1.88 GFLOPs | 82 ms |
Web interface to predict the unknown fish disease
The developed web interface demonstrates real-time fish disease classification. It allows users to test the three trained models: ResNet-18, SE-ResNet-18, and CBAM-ResNet-18. The users can upload fish images through a fish disease classification web interface. The system returns the predicted and class (JSON) for the fish disease classification web interface. The system can classify the images as “Bacterial gill disease,” “Bacterial Red disease,” and “Viral diseases – White tail disease.” This confirms the feasibility of the proposed models in real-world settings. For example, the outputs suggest that CBAM-ResNet-18 model shows no signs of incorrect predictions in the categories of diseases. This shows more than the baseline ResNet-18 model, which at least shows one incorrect prediction. Being that CBAM has channel attention and spatial attention, it allows the model to pay attention to specific diseased areas, gills, fins, and skin. This improved the diseased that closely visually classed to each other (bacterial gill and bacterial red diseases) to discriminate more. But the CBAM-based architecture shows the most consistent and most accurate predictions during the deployment testing out of the three models. These outcomes affirm that real-world aquaculture diagnostic systems more beneficial from using attention-based systems, and it reinforces the acceptance of CBAM-ResNet-18 as the model for final deployment.
V.CONCLUSION
In this research, we integrated advanced deep learning techniques with attention mechanisms and addressed the critical challenges of fish disease detection in aquaculture. We found that the traditional methods, like CNN and basic ResNet-18 models, were insufficient when being processed against small and imbalanced datasets. They have a limited capacity to represent small features. Implemented with ResNet-18 architecture, the enhanced models employed SE and CBAM to significantly boost the feature prioritization, to let the network explicitly attend to disease-relevant patterns. Both SE + ResNet-18 and CBAM + ResNet-18 could reach test accuracies of 94.67% and 96.62%, respectively, indicating high generalization ability and applicability to real-world scenarios.
Results of the experiment showed the impact of attention mechanisms to improve deep learning models, especially for tasks with limited and diverse datasets. With their contacts of spatial attention and channel attention, CBAM + ResNet-18 emerged as the best shuffle-based method that can provide better performance at lower computational cost. In addition, the application was developed as a web-based one, which made it easy for the deployment and for use by aquaculture practitioners.
The use of AI in aquaculture has been shown to have the potential. It was also demonstrated the potential of deep learning to link technology and practice in fish disease diagnosis. The work could be extended by more advanced attention mechanisms (such as transformer-based models) and/or a larger dataset in species of fish and types of disease. With these improvements further implemented, accuracy and scale would further improve and lead the way to wider adoption for AI-based solutions for aquaculture and sustainable fish farming.