I.GENERAL BACKGROUND
This study focuses specifically on demand forecasting using artificial intelligence (AI) models, rather than providing a general overview of AI applications. Since first being developed in the 1950s, AI has undergone considerable development. One of the most notable figures responsible for laying the groundwork for AI was Alan Turing, who theorized about how machines might mimic how humans think and behave when solving problems [1,2]. At this time, however, there were many limitations on AI development, including insufficient computational resources and numerous data limitations. The 21st century has brought about another huge resurgence in AI usage, and this time, it has been driven mainly by machine learning (ML) [3,4] and deep learning techniques [5]. Originally, AI was limited in terms of its functionality, but today, it can automatically identify ordered data from a very large dataset, which has been the reason behind the rapid rise of AI as a viable, data-oriented means of performing better than humans in a variety of tasks, such as image classification, natural language understanding, and playing strategy games [6]. The different types of learning available within ML are known as the different types of learning paradigms. The main paradigms within ML include supervised learning, unsupervised learning, semi-supervised learning, and reinforcement learning [7]. Supervised learning involves learning to correlate input with output by using labeled data. Unsupervised learning involves discovering hidden patterns within unlabeled data by clustering or reducing dimensionality. Reinforcement learning involves developing heuristics for how to maximize reward through trial and error within an agent-based setting through interaction with their environment [8]. When you combine these learning paradigms together, you get a very versatile way to implement ML for solving many practical business problems, such as healthcare diagnostics, predictive maintenance, fraud detection, and recommendation systems. Today, AI and ML are being incorporated into many industries and sectors. In healthcare, they are used to help with diagnostic imaging and predictive modeling [9]; in finance, they assist with algorithmic trading and risk assessment [10]; and in education, they assist in adaptive learning [11]. And while industries like manufacturing and supply chain management (SCM) are taking advantage of the ability of ML to provide automation and predictive analytics, they are also being utilized by those outside these sectors, including sustainability initiatives, cybersecurity initiatives, and government service delivery, making AI an integral part of the digital economy. For all the progress made in AI, several significant challenges still exist. Problems with data quality, model interpretability, and ethical considerations including bias, fairness, and privacy issues are preventing the full-scale application of AI [12]. Deep learning models’ “black-box” feature raises concerns about transparency/accountability, especially in high-stakes fields such as criminal justice/healthcare [13]. As a result, there is an increasing need for explainable AI (XAI) frameworks to help improve trust and interpretability. [14]. Model generalization for dynamic, data-scarce environments is another challenge. New methodologies such as transfer learning, federated learning, and self-supervised learning have been developed to overcome these challenges [15]. Additionally, connecting AI to IoT and cloud-edge architectures creates real-time intelligent systems [16]. This article provides an overview of the foundations of AI and ML, assesses current applications, considers the ethical and interpretability challenges associated with AI and ML, and proposes methods to develop trustworthy, human-centric AI systems.
This study contributes beyond conventional model comparison by proposing and empirically validating a hybrid analytical framework that integrates supervised prediction with unsupervised structural pattern discovery. Unlike prior work, the contribution lies not in comparing algorithms in isolation but in evaluating their complementary roles in improving adaptability, interpretability, and decision support under dynamic market conditions.
The rest of the paper is organized as follows. Section II presents the literature review. Section III describes the research methodology, section IV explains in detail the solution approach, section V analyzes and evaluates the results, section VI concludes the work, and section VII will identify the limitations and future works.
II.LITERATURE REVIEW
The state of the art in demand forecasting using AI and ML has evolved significantly in recent years, moving from theoretical frameworks to practical, data-driven implementations across multiple industrial domains. The contemporary research landscape reveals that AI-based forecasting approaches have transitioned from experimental models to fully integrated business systems that influence decision-making, operational efficiency, and cost reduction. This section critically reviews and discusses the latest developments in AI-driven demand forecasting across three main sectors, namely manufacturing, retail, and healthcare, based on selected and highly cited studies, while maintaining the original sources as cited in the original text. The comparative analysis underscores both technological advances and the persistent challenges that define the current state of the art.
A.DEMAND FORECASTING IN THE MANUFACTURING SECTOR
Demand forecasting has a big impact on all aspects of manufacturing since it affects how many goods have to be ordered, when they should be ordered, how much product can be produced, and where to allocate resources (i.e., labor and warehouse space). A comprehensive review by [17] points out that AI, ML, and especially Scientific Machine Learning (SciML) are now proving to be increasingly important in predicting demand because they can use hybrid forecasting methods to perform much quicker and with greater precision than traditional methods. This type of forecasting is enhanced through automated workflows, including ETL pipelines and AutoML, as well as through using reinforcement learning and hybrid algorithms to develop more effective scheduling and logistics systems in constantly changing environments. According to [18], traditional statistical methods often do not adequately reflect the complexities of industrial processes. ML techniques including regression, classification, and clustering can provide adaptive and continuously updated forecasting models. Furthermore, algorithms such as random forests (RFs) and artificial neural networks (ANNs) have demonstrated exceptional predictive performance. Research by [19] shows that AI models (e.g., support vector regression) have consistently outperformed traditional demand forecasting methods in complex environments (e.g., forecasting demand of spare parts). As a result of these emerging trends, AI has emerged as a critical success factor for efficient, adaptive, and Industry 4.0-compliant manufacturing systems.
B.AI-DRIVEN DEMAND FORECASTING IN THE RETAIL SECTOR
Recent advancements in retail, e-commerce, and big data have led to a paradigm shift for the industry toward the implementation of demand forecasting techniques. The use of traditional statistical tools has become less useful in generating accurate demand forecasts due to their ability to model nonlinear relationships. Therefore, businesses are now looking to take advantage of AI technologies to assist with demand forecasting. ML algorithms, such as ANNs, long short-term memory (LSTM), and recurrent neural networks (RNN) within the fast-moving consumer goods (FMCG) sector, have proven to be more predictive than traditional demand forecasting methods as they effectively reflect how consumers’ behavior will change over time. While hybrid ARIMA and ML modeling techniques can enhance accuracy, their higher costs and need for the organization’s internal expertise limit their implementation [20]. As shown in [21], the success of using hybrid ensemble methods to forecast demand can be demonstrated through the efforts made in creating a hybrid RF–extreme gradient boosting–linear regression (RF-XGBoost-LR) model that has a high level of predictive accuracy (R2 = 0.9551). The ability of these models to produce highly generalized results and scale well across multiple different datasets has demonstrated the effectiveness of hybrid ensemble methods. Reference [22] also looked at various methods of forecasting by converting them to a classification method to help produce probabilistic forecasts with a lower incidence of forecast error than traditional forecasting methods, particularly during instances of irregular demands. In summary, many of the studies reviewed indicate a shift toward the use of hybrid and adaptive probabilistic AI-based techniques for demand forecasting. However, significant organizational and infrastructural barriers still exist which will limit widespread use of these techniques. Despite strong predictive performance reported by hybrid and deep learning models, most studies prioritize accuracy over interpretability and operational integration. Additionally, these models often assume stable demand distributions, limiting their effectiveness in volatile retail environments. This reveals a key limitation in current research: the lack of frameworks that balance predictive performance with adaptability and managerial usability.
C.AI-ENHANCED DEMAND FORECASTING IN THE HEALTHCARE SECTOR
Due to their multifaceted and unpredictable nature, it is inherently difficult to forecast healthcare demand because of the diversity and randomness of patient needs; therefore, healthcare demand forecasting must include clinical, behavioral, environmental, and genomic data. AI and ML are among the best solutions to address these issues. In [23], the authors compiled a list of key data sources to support this solution and proposed a six-step predictive analytics framework that included the need for big-data infrastructures such as Hadoop and NoSQL databases, along with a means of managing heterogeneous datasets to be used for suitable forecasting. Practical work on this approach includes the use of ML models, including RF models, to predict the demand for essential medicines, with very high levels of accuracy and utilization of the information to develop a chain of supply to hospitals and other health facilities and to demonstrate project regional variances in demand [24]. A separate study by [25] demonstrates the use of hybrid deep learning techniques to create a multi-source time-series fusion model that combined both environmental data and clinical data, thus greatly enhancing predictive robustness. These works illustrate how AI is changing the focus of healthcare systems from being reactive to being proactive, thus improving the allocation of resources in the healthcare system, as well as improving patient care outcomes. Nonetheless, there are still significant challenges to be addressed in the areas of data privacy, interoperability, and the transparency of the models that will continue to be of interest in future research.
D.CROSS-SECTORAL DISCUSSION AND EMERGING TRENDS
Comparing the three sectors, namely manufacturing, retail, and healthcare, reveals both shared advances and distinct challenges. Across all domains, AI-driven demand forecasting has evolved from isolated analytical tools to integrated decision support systems. Manufacturing emphasizes production optimization and process control, retail focuses on demand variability and hybrid model adoption, while healthcare prioritizes data integration and predictive accuracy for service delivery. Despite contextual differences, three overarching trends define the current state of the art. First, hybridization has become the cornerstone of advanced forecasting. The convergence of statistical, ML, and domain-specific models as demonstrated by [21,25] enhances adaptability and precision across diverse data environments. Second, **data fusion and feature engineering** are critical enablers, allowing the synthesis of structured, semi-structured, and unstructured datasets for richer predictive insights. Finally, the **shift toward explainable and ethical AI** reflects growing awareness of trust and accountability, especially in sensitive sectors like healthcare. While AI and ML have demonstrated immense potential, the journey toward full-scale industrial adoption remains ongoing. Future research must focus on developing interpretable, energy-efficient, and context-aware forecasting systems that not only predict but also prescribe optimal actions. By aligning technological innovation with ethical governance and domain-specific needs, AI-driven demand forecasting can continue to redefine efficiency, resilience, and sustainability across all sectors.
E.DISCUSSION AND ANALYSIS
There has been an increasing trend in using AI for demand forecasting. However, much of the current research on this topic has been primarily focused on either supervised models that are aimed toward improving prediction accuracy or unsupervised models that focus on identifying patterns within datasets rather than combining the strengths of both. This lack of comprehensive studies is problematic, as there is currently little data available to show how these two methods could successfully work together within a single framework to achieve both greater predictive accuracy and better identify the hidden demand structures within the dynamic nature of the retail industry. Furthermore, many of the current demand forecasting models do not provide generalizable results due to their inability to handle this type of heterogeneous, high-dimensional data that incorporates external factors such as oil price fluctuations, seasonal adjustability, and holiday schedules. Many current studies fail to validate their models properly by not sufficiently applying validation techniques, optimizing hyperparameters, and/or using weak generalizability techniques, which further limits their practical applications in real-world supply chain systems. Thus, a need for a complete, robust, and scientifically validated framework exists that integrates multiple AI methodologies to overcome the limitations previously discussed.
Accordingly, the objective of this study is to develop and evaluate a conceptual framework that integrates supervised (RF) and unsupervised (clustering) models to improve demand forecasting performance under dynamic market conditions. This study aims to assess how these AI models adapt to changing consumer behaviors and external factors, thereby addressing the critical gap in existing research regarding the efficiency of AI-driven demand forecasting. Creating an RF supervised model and unsupervised clusters provides insights into which model performs better in handling the complexity and variability of data in SCM, ultimately aiding organizations in making more informed and timely decisions.
III.METHODOLOGY
This study adopts the Design Science Research (DSR) approach for developing and evaluating an intelligent demand forecasting framework [29,30]. Applying five distinct phases, the DSR approach phases for this research include 1) problem identification which identifies the limitations of traditional forecasting and articulates the need for adaptive AI-driven models in rapidly changing retail environments; 2) defining objectives which defines the objective of developing a framework to improve forecasting accuracy by identifying and utilizing hidden demand patterns through a variety of hybrid AI techniques; 3) analysis of existing research related to demand forecasting in SCM, 40 designing and developing artifacts (conceptual model), where there was development of the artifacts, which involved the integration of RF for prediction, Keras-based neural networks (KNNs) for nonlinear learning, and K-means clustering for the discovery of patterns; 5) implementing and deploying the prototype for the proposed model using a case study that involved a dataset consisting of sales transactions, store attributes, product categories, oil prices, and holidays; and lastly, 6) evaluating the artifacts based on a variety of performance metrics (R-square, root mean square error (RMSE), and mean absolute percentage error, or MAPES) and cross-validation, to establish that the artifacts are both robust and generalizable. This structured/repeatable approach will ensure that the intelligent demand forecasting framework developed through this research article is scientifically rigorous as well as practically relevant.
Although qualitative analysis is discussed conceptually, this study primarily relies on quantitative methods and does not include interviews or qualitative data collection. Reference [26] argues that qualitative methods offer rich insights into real-world behaviors, motives, and experiences that quantitative approaches may overlook. These insights allow researchers to explore underlying factors shaping the problem. Complementing qualitative methods, data science methodologies are employed to process and analyze large modern datasets. Reference [27] defines data science as a blend of statistical, ML, and computational techniques used to extract meaningful patterns from large or unstructured data. This is vital for producing actionable insights in technologically advanced research environments. Quantitative research methods also play a major role by applying structured, mathematical, and statistical tools to test hypotheses and measure observable phenomena. Reference [28] underscores that quantitative approaches provide precision and help evaluate theoretical models objectively.
IV.SOLUTION APPROACH
In this section, a comprehensive approach is outlined to tackle the challenges of demand forecasting in SCM using AI and ML techniques. Employing the DSR methodology, this study progresses through stages including problem identification, model conceptualization, prototype development, and evaluation. The core aim is to develop AI-driven solutions tailored to the dynamic nature of modern supply chains. In addition, a conceptual model where a theoretical framework is established to guide the development of AI models and define the key variables and the expected interactions between them based on existing literature and new hypotheses about the behavior of supervised and unsupervised models in varying contexts will be produced. This model will focus on the implementation of the Cross-Industry Standard Process for Data Mining (CRISP-DM) model and specifically the three phases: data understanding, data preparation, and modeling. It will also outline the criteria for evaluating model performance such as accuracy, adaptability, and computational efficiency. The next step involves developing prototypes for the AI models. These prototypes will be designed to process and analyze large datasets reflective of real-world supply chain dynamics. The development process will emphasize flexibility and scalability to ensure that the models can be adapted for different sectors and conditions. In the evaluation phase of this paper, the focus will be on quantitatively measuring the effectiveness of supervised and unsupervised techniques in forecasting demand and also their efficiency in adapting to sudden market shifts. These models will be tested against various datasets to determine their performance under dynamic market conditions, providing a foundational comparison of supervised and unsupervised methods in handling the complexities of supply chain data. The dataset used in this study is derived from the publicly available Corporación Favorita Grocery Sales dataset (Kaggle), comprising over 125 million transaction records across multiple stores and product categories.
A.PROBLEM IDENTIFICATION
Despite extensive research and advancements, a common theme emerges from the literature review indicating that the effectiveness of demand forecasting varies considerably across different sectors influenced by the rapid evolution of market conditions. This variability can be due to differing market dynamics, consumer behaviors, and the specific nature of products within each sector. While some sectors experience slow and predictable changes, others face rapid shifts that demand quicker responsiveness from forecasting models. A major challenge frequently discussed is that current AI models are not quick enough to accurately forecast demand in these fast-changing markets. Both supervised and unsupervised models often fail to keep up with sudden changes in consumer preferences and market trends, making their forecasts outdated soon after they are generated. Moreover, there isn’t a single AI model capable of effectively forecasting demand across a wide range of products and industries. Each model has its strengths and weaknesses and is usually optimized for specific types of data or market conditions, limiting their usefulness across the broad spectrum of global industries. The identified research gap is the “lack of evaluation of the capability of AI models to efficiently forecast demand concerning changing market conditions, consumer behavior, and external factors.” This gap underscores the need for a study that not only tests the adaptability of these models to dynamic environments but also evaluates their effectiveness across a broad spectrum of scenarios. The primary objective of this paper, therefore, is to develop and assess models that enhance the predictive accuracy and operational efficiency of demand forecasting in SCM under varying market conditions. This will involve the design and development of an RF supervised model and the application of unsupervised clustering techniques. These models will be rigorously tested to determine how well they can adapt to changing consumer behaviors and external factors.
B.OBJECTIVE REQUIREMENT
This study has employed the DSR method to develop and evaluate AI demand forecasting models in the supply chain. We first gathered information from various sources, including sales history, promotions, and other variables that impacted demand (such as economic conditions and holidays), to develop a better grasp of the changes in demand. After determining how to gather demand-related information, we characterized forecasting challenges, especially surrounding the inability of current models to adapt quickly to changes in the marketplace. During model development, we created various models (e.g., RF, neural networks based on Keras, and unsupervised clustering) with the objective of providing greater accuracy and versatility in predicting future demand. A functional prototype was then developed, providing a demonstration of the practical usability and feasibility of integrating the models into supply chain systems. Through the use of scenario-based testing to simulate real-world settings, the models were tested to allow researchers to evaluate their robustness to variations in the input data. Each mode was evaluated through a combination of quantitative measures (e.g., accuracy, precision, recall, F1-score, mean squared error (MSE), and coefficient of determination (R2)) and qualitative assessments from industry experts on how well each mode performed. The system is intended to meet key attributes, including scalability, usability, reliability, and seamless ERP integration. At the conclusion of the project, we anticipate that our findings will provide practical, efficient, and versatile demand forecasting solutions for SCM while at the same time producing useful insights to advance both academic research and practical applications in the supply chain arena.
C.ANALYSIS
The analysis phase of this paper focuses on improving demand forecasting in SCM by evaluating advanced AI and ML techniques. Existing research highlights that traditional forecasting methods are limited in handling complex, dynamic market environments. Studies demonstrate that ML models including ANNs, RNNs, and support vector machines (SVMs) offer improved accuracy compared to conventional techniques. However, these models also present notable challenges. SVMs handle linear and nonlinear data well but require extensive parameter tuning, which increases computational cost and complexity. ANNs are capable of learning deep nonlinear patterns but can become trapped in local minima during training and require substantial computational power. Both models also struggle with optimal feature selection, risking overfitting or loss of critical information.
RF provides a more robust alternative by constructing multiple decision trees and aggregating their predictions. This reduces variance, prevents overfitting, and enhances generalization, making RF highly suitable for large and complex forecasting tasks. Research also shows the complementary value of KNNs, which enable fast experimentation through a structured pipeline of model definition, compilation, training, evaluation, and prediction. To enrich predictive modeling, the analysis integrates unsupervised clustering techniques, recognizing that supervised methods alone may overlook hidden market structures. K-means clustering assists in identifying natural groupings among stores or products based on sales patterns, demographics, or purchasing behaviors. These insights support targeted strategies such as inventory optimization and market segmentation.
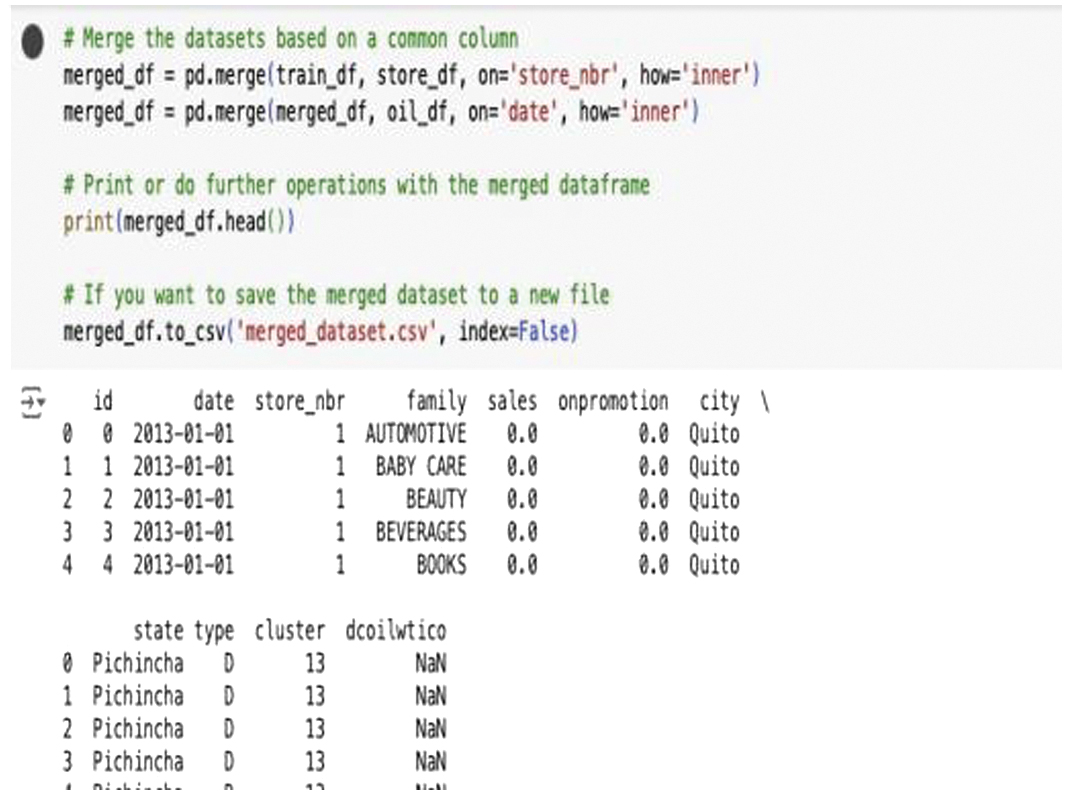
The analytical process begins with compiling diverse datasets essential for understanding demand drivers, including store attributes, item characteristics, over 125 million transaction records, oil price fluctuations, and holiday calendars. These datasets undergo cleaning and integration to ensure quality and consistency. Exploratory data analysis then identifies trends, anomalies, and external influences such as oil price shifts or seasonal patterns that impact purchasing behavior. This comprehensive analysis strengthens the foundation for building accurate, adaptive forecasting models capable of supporting data-driven decision-making in SCM. Tables I, II, and III give a detailed view of the datasets and their attributes. During initial clustering experiments, noninformative identifiers such as “id” and “store_nbr” were inadvertently included. These variables were removed in the refined model, as they do not carry meaningful analytical information and can distort clustering outcomes.
Table I. Store dataset summary
| The store identifier and primary key used to identify each store in the dataset. | |
| Represents the city in which the store is located. | |
| Represents the state in which the store is located. | |
| Represents the categorization of the store. | |
| Represents the clustering of the store. | |
| Store_nb | The store identifier and primary key used to identify each store in the dataset. |
Table II. Item dataset summary
| Primary key and uniquely identifies each item | |
| Categorizes the item into its family | |
| Item’s class | |
| Indicates whether an item will go bad or not (1 for perishable, 0 for not) |
Table III. Train dataset summary
| Identifies each record | |
| Sales date | |
| Identifies each store | |
| Identifies each item | |
| Shows number of units sold | |
| Shows if an item was on sale or not (true or false) |
D.CONCEPTUAL MODEL
Figure 1 shows a conceptual model that involves a dataset merged from different databases and systems such as ERP, TPS, and SCM. The data obtained from these systems alongside the merged dataset obtained from combining all those are used to train and test the model using the supervised methods and the hidden layer where the implementation of the artifact occurs. The conceptual model displayed represents the framework for business analytics, focusing on demand forecasting through a structured process that integrates ML techniques and data from various business systems. This process is presented in layers, illustrating the flow from data input to business decision-making.
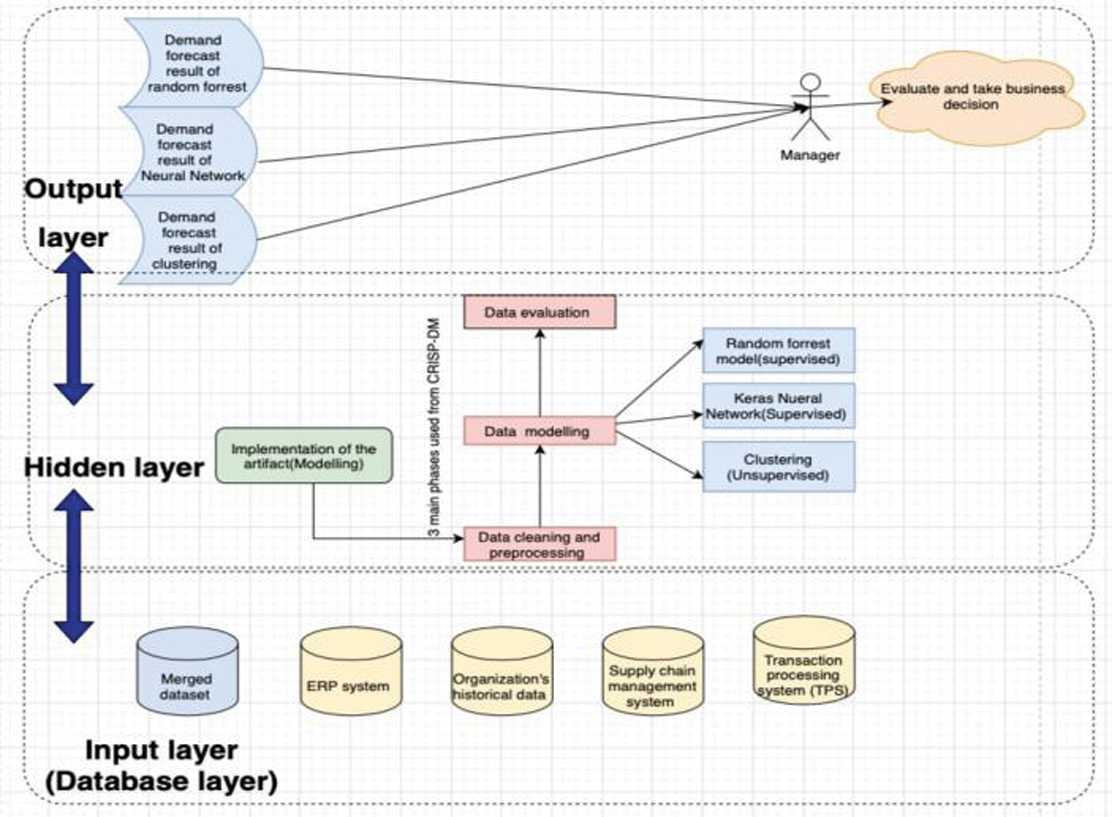 Fig. 1. Demand forecasting system architecture flowchart.
At the foundational level (input layer), various data sources feed into the system. These include merged datasets, an ERP system, organizational historical data, an SCM system, and a transaction processing system. These diverse data sources provide a comprehensive input base ensuring that the forecasting models have access to all relevant data sources necessary for accurate analysis.
The hidden layer represents the core analytical engine of the architecture where data are transformed and insights are generated. It acts as a bridge between raw data inputs and the outputs that inform decision-making. The primary activities in this layer include data cleaning and preprocessing which is crucial as it prepares the raw data for modeling by cleaning and structuring it, ensuring that the data modeling techniques can be effectively applied. The next step is data modeling where three various modeling techniques are employed to analyze the data such as the RF model. This supervised technique uses multiple decision trees to output a forecast that improves accuracy by reducing the risk of overfitting typical of single decision tree models. The second model is KNN which is a deep learning approach where data are processed through layers of neurons adapting and improving accuracy through iterative training on the input data. The third and final unsupervised model is clustering where it groups data into clusters based on similarity, which can be particularly useful for identifying patterns or behaviors in data that are not explicitly labeled. The results from the data modeling are compiled into forecasts, such as demand forecasts obtained from different models (RF, neural network, and clustering). These forecasts are then presented in a manner that allows straightforward interpretation and application in business contexts.
Finally, a managerial figure evaluates the outputs. This evaluation is presumably based on the comparative insights drawn from the forecasts provided by different models. The manager’s role is to interpret these forecasts, considering the business context and strategic objectives, and make informed decisions that will impact the organization’s operational or strategic directions. The manager reviews the outputs provided by the system to make informed business decisions. The decision-making is based on the analytical insights provided by the models. Data flow from the database layer up to the hidden layer where it is processed and modeled. The results then flow to the output layer where they are consolidated and presented in a form useful for managerial decision-making. The manager evaluates these outputs to make strategic business decisions, effectively closing the loop of the decision support system. This model illustrates the use of data-driven decision-making using a combination of traditional and advanced data analysis techniques in a business environment. The goal is to integrate data across various functions to provide a comprehensive view that supports strategic and operational decisions. Overall, the architecture effectively integrates data from a broad spectrum of internal systems, applies advanced analytical techniques, and outputs actionable insights. This enables a data-driven approach to decision-making, which is critical in modern business environments where efficiency and accuracy in forecasting can provide a significant competitive advantage.
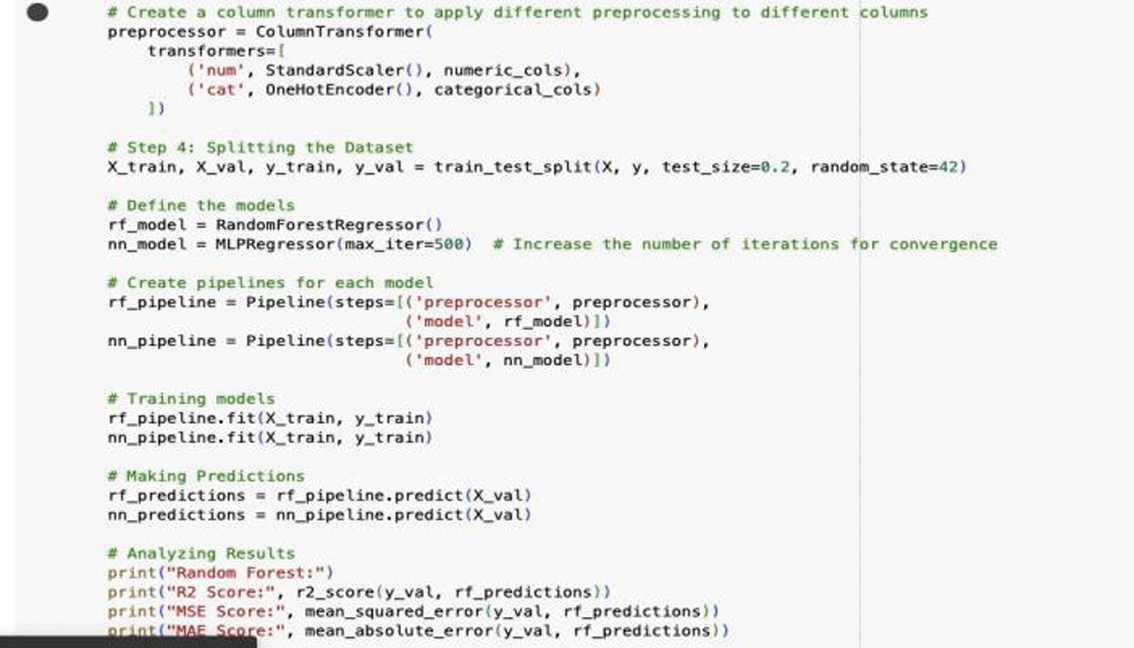
1).RF ARCHITECTURE
- •Data Collection and Preparation: The dataset is loaded, cleaned, and preprocessed to ensure that all necessary information is available and in the correct format.
- •Feature Engineering: Relevant features are selected and transformed. Categorical variables are encoded using One-Hot Encoding, and numerical variables are scaled to standardize their ranges.
- •Data Splitting: The data are split into training and validation sets to allow for model training and subsequent evaluation.
- •Model Pipeline Creation: A pipeline is created to integrate the preprocessing steps and the RF model. This ensures a streamlined and efficient process from raw data to model predictions.
- •Model Training: The RF model is trained on the training data, learning patterns and relationships that are crucial for accurate demand forecasting.
- •Prediction and Evaluation: The trained model makes predictions on the validation set, and its performance is evaluated using R2 Score, MSE, and MAE. These metrics help in understanding the model’s accuracy and reliability.
2).KNN LIFECYCLE
- •Figure 2 gives an overview of the KNN lifecycle:
- •Define Network: This first step is to define the architecture of the neural network, that is, specifying the number of layers in the model, the number of nodes in each layer, the activation functions to be used, and any regularization techniques. The decisions on architecture depend on the specific application and kind of data. Common layers used in neural networks include dense (fully connected) layers, convolutional layers, and recurrent layers.
- •Compile Network: After the architecture of the network is defined, the next step is compiling the model. This includes mentioning the loss function and the optimizer that shall be used for training the model. The loss function indicates the performance of the model during training by comparing the model’s predictions with the actual target values. The optimizer is an algorithm that updates the weights of the network based on the data it sees and the loss function. The specified metrics that need to be monitored during training are mentioned in 8.2 objective requirement chapter.
- •Fit Network: This step involves the training of the model on the provided dataset. In this case, the model will be provided with the dataset used for input. During the training process, predictions will be made using the provided model regarding the dataset used. In this regard, the loss (or how far the predictions are from the target data) will have to be determined. This process typically happens in an iterative manner. During this process, the dataset is often divided into batches independently during training iterations.
- •Evaluate Network: After training the model, the evaluation of its performance is done using a separate dataset, known as the validation or test set. This helps in checking how well the model is likely to perform on new unseen data. Evaluation will give metrics like loss and accuracy, which help in assessing the model’s effectiveness. It is crucial for detecting issues like overfitting, where the model performs well on training data but poorly on new data.
- •Make Predictions: Once the model is trained and evaluated, it is used to make predictions on new data. This is the step where the model is actually utilized to achieve whatever task it was designed for, such as demand forecasting. The output depends on the type of model and the nature of the problem.
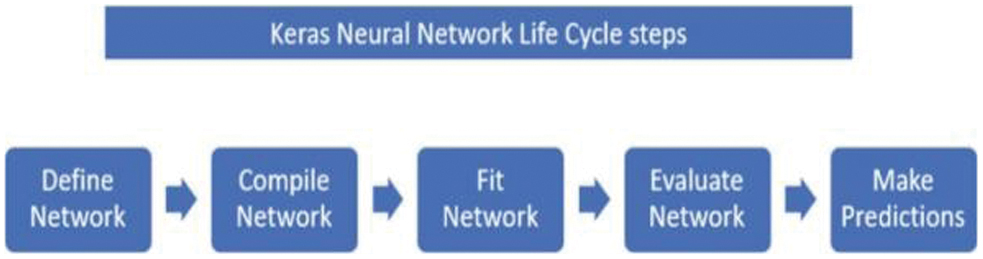 Fig. 2. Keras neural network lifecycle.
This workflow provides a structured approach to developing neural networks with Keras, ensuring that each critical aspect of ML model development is addressed.
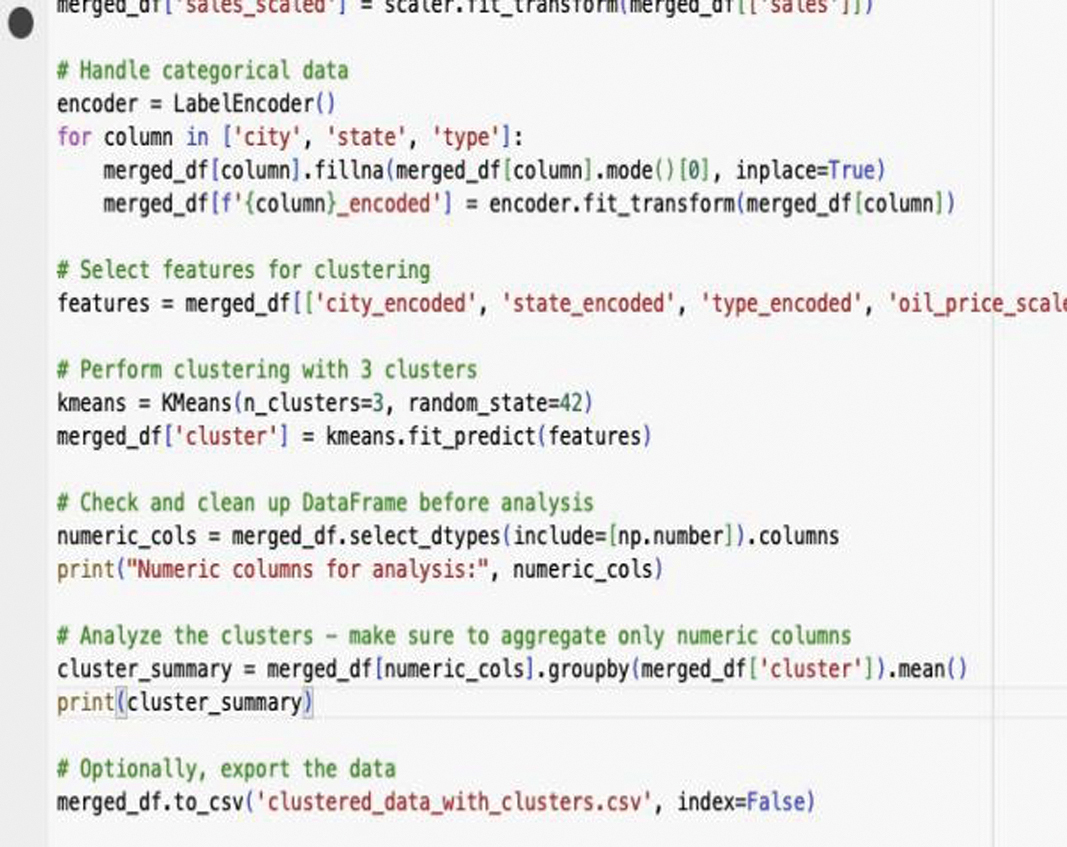
3).CLUSTERING ARCHITECTURE
- •Data Collection and Preparation: The initial step involves loading the dataset and ensuring it is ready for analysis. This includes handling missing values, converting date columns to a standardized datetime format, and extracting relevant temporal features such as month, day of the week, and year. These steps are crucial to make the dataset comprehensive and consistent for subsequent processing.
- •Feature Engineering: In this phase, the dataset is transformed to highlight key characteristics that will aid in clustering. Categorical variables, such as city, state, and type, are encoded into numerical values. Numerical features, including oil price and sales data, are standardized to ensure they are on a similar scale. Temporal features are also included to capture seasonal and weekly variations, which are important for understanding demand patterns.
- •Feature Selection: A subset of relevant features is selected for clustering. These features include encoded categorical variables, scaled numerical variables, and temporal features. This selection ensures that the clustering algorithm receives a comprehensive set of inputs that capture the multifaceted nature of the data.
- •Model Initialization: The K-means clustering model is initialized with a predefined number of clusters. This step involves setting up the algorithm to partition the dataset into a specified number of groups. The choice of the number of clusters depends on the specific application and the desired granularity of the analysis.
- •Model Fitting: The clustering algorithm processes the selected features, iteratively assigning data points to clusters and recalculating the cluster centers. This process continues until the cluster centers stabilize, ensuring that data points within each cluster are as similar as possible to each other and distinct from those in other clusters.
- •Cluster Assignment: Once the model fitting is complete, each data point in the dataset is assigned to a cluster based on its feature values. This assignment is added to the dataset as a new column, allowing for easy identification and analysis of the clusters.
- •Cluster Analysis and Evaluation: The characteristics of each cluster are analyzed by calculating summary statistics, such as mean values of numerical features. This analysis helps in understanding the typical attributes of each cluster and identifying patterns. Evaluation metrics, like the within-cluster sum of squares, are used to assess the quality and compactness of the clusters.
- •Data Export and Utilization: The final clustered dataset is exported for further analysis and practical application. This step ensures that the clustering results can be easily accessed and integrated into other models or decision-making processes, particularly in demand forecasting and SCM. The clustered data can be used to inform strategic decisions and optimize various aspects of the supply chain.
This workflow provides a structured approach to developing clusters ensuring that each critical aspect of ML model development is addressed.
E.DEMAND FORECASTING MODELS PROTOTYPE
According to [31], one example of a model design framework is the CRISP-DM model. Additionally, an addition to this model is the data mining methodology referred to as the CRISP-DM model, which consists of six phases. These phases in data mining include Business Understanding, Data Understanding, Data Preparation, Modeling, Evaluation, and Deployment, as shown in Fig. 3.
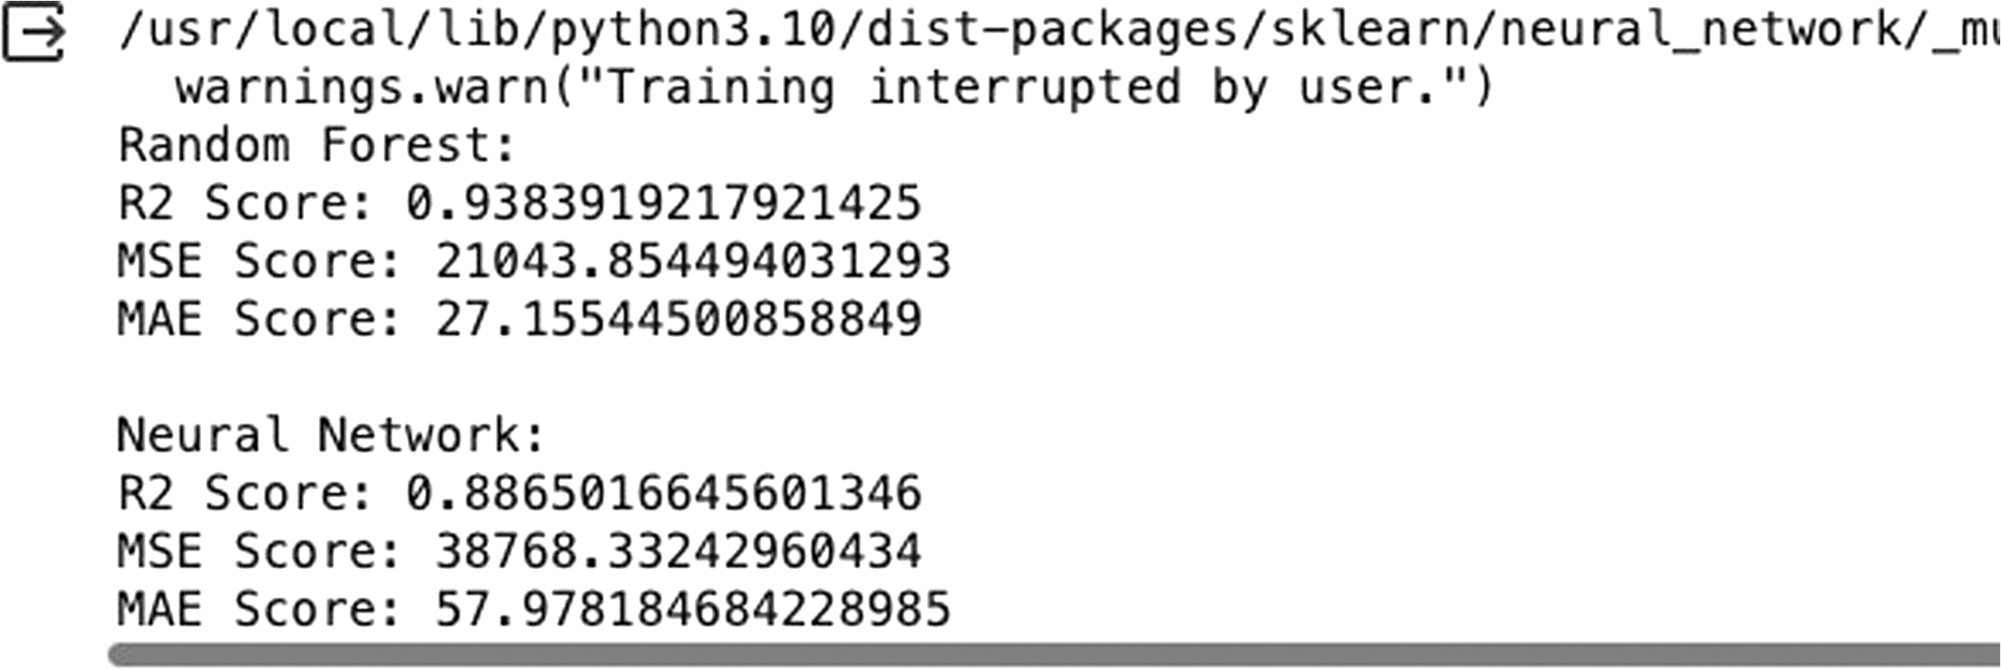 Fig. 3. Modeling output of random forest and KNN models.
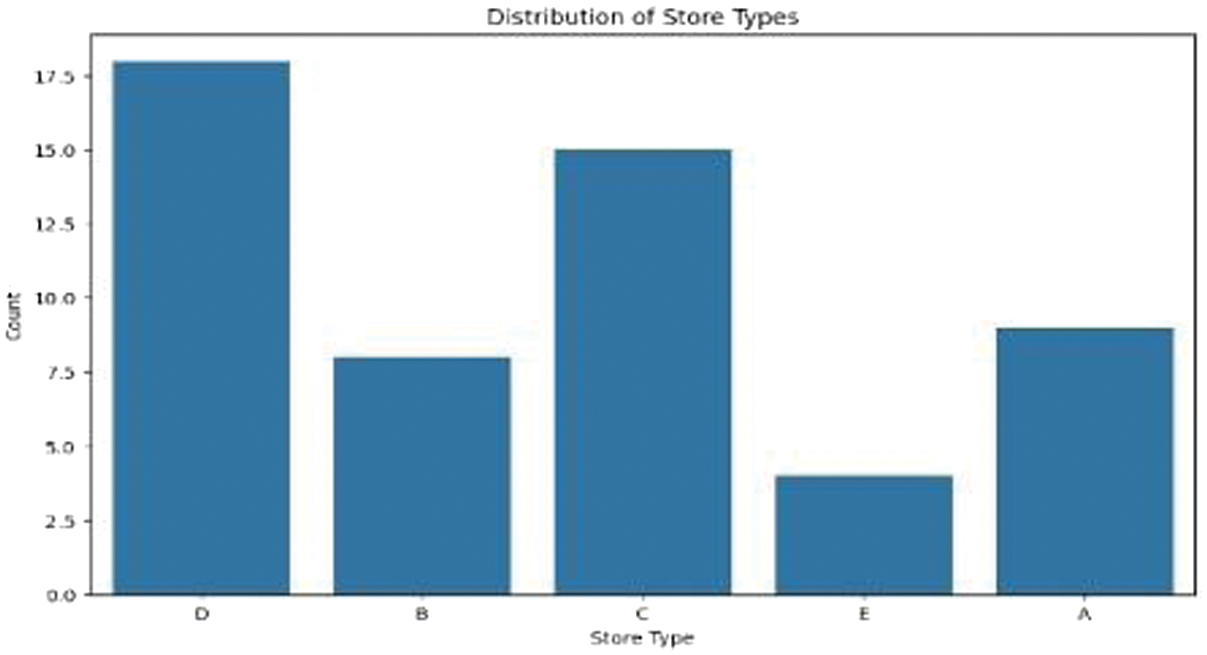
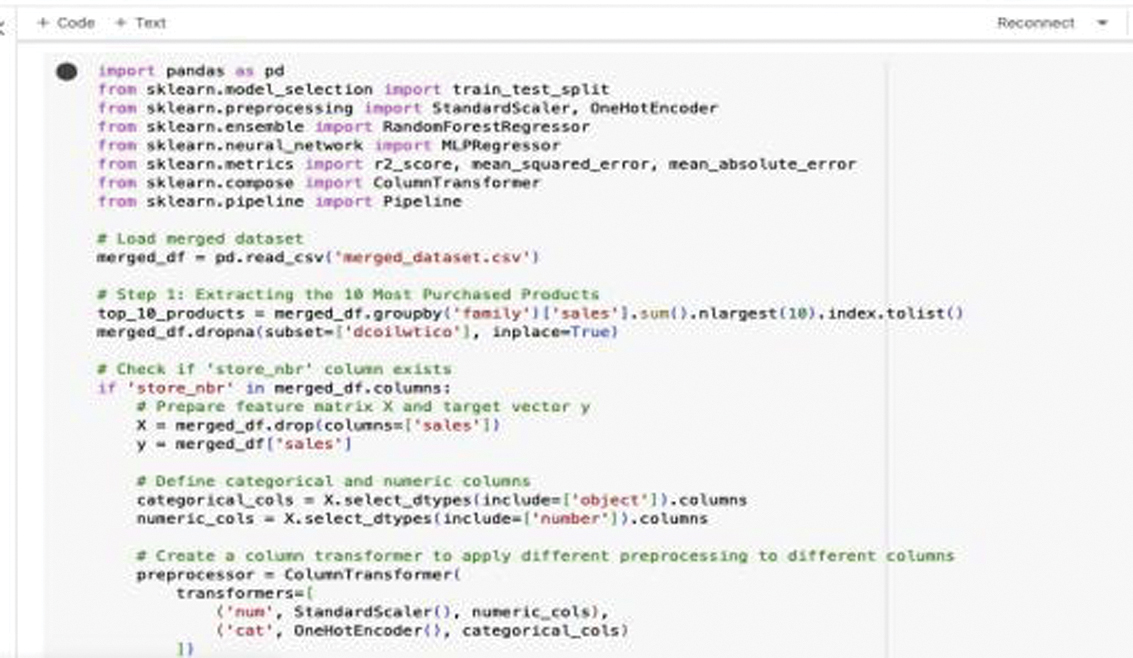
The focus of this paper is on demand forecasting through three different stages: data understanding, data preparation, and modeling implementing in Google Colab with the use of Python. The way that the exploratory data analysis and visualization methods (bar plots) were used during the data understanding stage of the process was to help to identify the distributions of the data (e.g., store type) as well as to help to identify any imbalances and assist in selecting the models that provided the most amount of noise reduction. If it were not for the data preparation process, much of the model accuracy and reliability would not have been able to improve at all. For this reason, I wanted to handle any missing values in the dataset (such as oil prices) through the use of mean imputation as this would help to keep the data consistent across the board as well as to help select only the top 10 best-selling products to simplify the dataset further and increase the efficiency of the forecasting model (the validity/generalizability of the resulting prediction would be somewhat limited). Furthermore, the categorical data have been transformed using one-hot and label encoding, and the numerical data have also been normalized so that the model does not tend toward one data type or another during the learning of the predictions.
Feature engineering techniques were used to create new variables, such as time-series variables and interaction terms, that capture seasonal/behavioral patterns. The analysis involved merging multiple datasets, including sales, store, product, oil price, and holidays, so as to add additional context to the models. Dimensionality reduction was performed with principal component analysis (PCA) to improve processing speed and retain as much of the most important data as possible. The final step in the overall model development effort was to split the final dataset into training and testing sets and conduct model development with RFs and neural networks. The overall outcome of the analysis is that, without thorough preprocessing of the data and undertaking feature engineering, it is not possible to develop accurate, reliable, and scalable demand forecasting models.
(All the developing steps have been added as Figs. A1 to A6 in Appendix).
The two models are implemented on the dataset for all the records to create Fig. 3.
The final unsupervised algorithm (clustering) was then performed where the data were partitioned into three clusters grouping similar data points together based on the selected features. The resulting cluster assignments are added to the Data Frame, allowing for further analysis of the clustered data. To summarize and analyze the clusters, the code identifies numeric columns and calculates the mean values of these columns for each cluster. This provides a detailed summary of the characteristics of each cluster, highlighting the differences and similarities between them. The cluster analysis helps in understanding the underlying patterns within the data, such as distinct store types or sales behaviors. The data were segmented into three clusters based on their sales demand and with consideration to other factors such as holidays or store location, for example. This unsupervised model ensured that the data do not need to be trained in order to provide the forecast and can take into consideration several other factors which also make it more efficient and advanced. The number of clusters (K = 3) was selected based on the elbow method and supported by silhouette analysis. Figure 4 shows the clustering model.
The model produced different clusters based on different attributes and showed how those attributes affected the sales demand. In the next chapter, the interpretation and evaluation of the results will be further discussed. To improve experimental robustness, k-fold cross-validation was applied, and hyperparameter tuning was conducted using grid search techniques. This ensures model stability and reduces overfitting.
V.EVALUATION
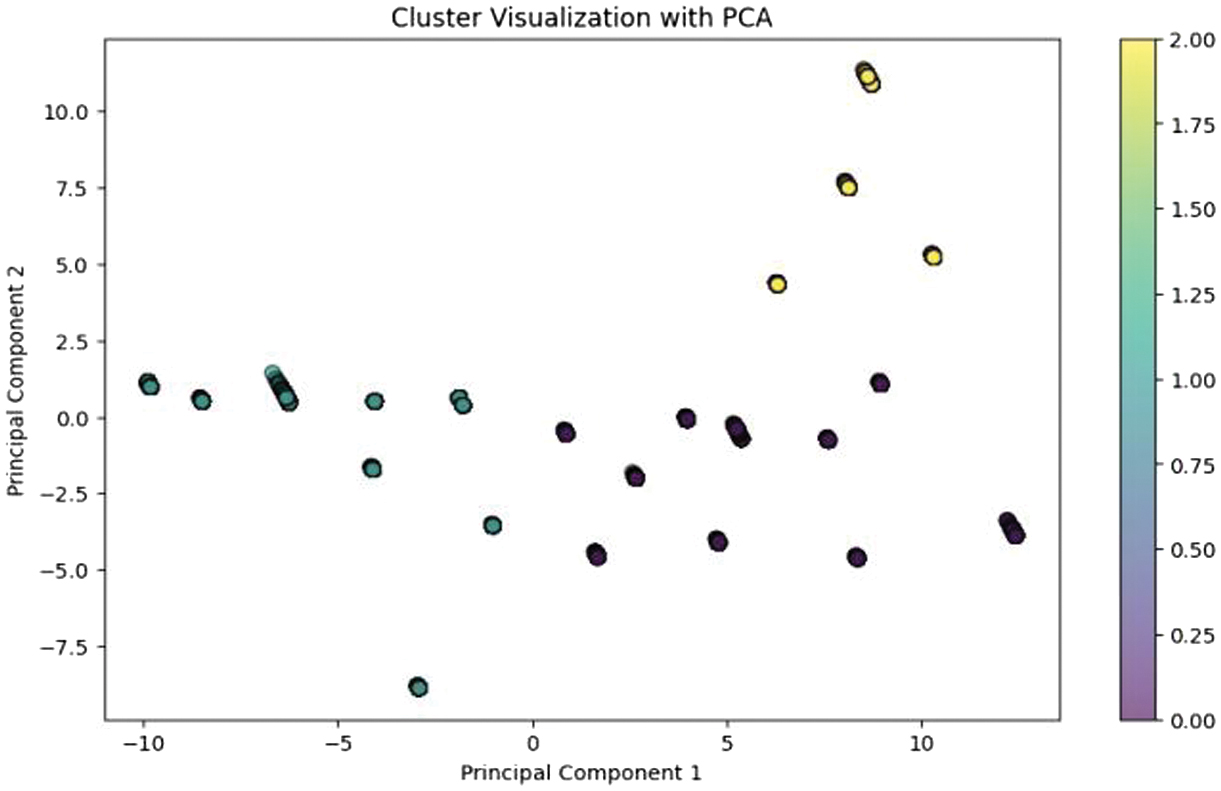
Additionally, PCA is applied to reduce dataset dimensionality, facilitating a clearer visual assessment of the clustering. The scatter plot generated from PCA visually differentiates the clusters, aiding in the intuitive understanding of data segmentation and supporting strategic decisions based on the clustering results (see Fig. 6). These models are rigorously tested on the validation dataset to evaluate their predictive accuracy and efficacy, using several key metrics:
- •R2 Score or Coefficient of Determination: This measure evaluates the proportion of the variance explained by the dependent variable, which can be predicted by the independent variables, ranging from 0 to 1, with higher values reflecting better model performance.
- •RF R2 Score: Achieving a score of 0.9384 indicates a strong predictive capability, explaining approximately 93.84% of the variance in sales data.
- •Neural Network R2 Score: With a score of 0.8865, it demonstrates robust performance, albeit slightly lower than the RF model.
- •MSE: This statistic calculates the average squared difference between the predicted values and actual data, where lower numbers indicate closer accuracy to true data points.
- •RF MSE: The score of 21,043.8545 suggests the model’s predictions deviate from actual sales figures by about the square root of this value, which might be significant depending on the sales context.
- •Neural Network MSE: At 38,768.3324, this higher score indicates greater prediction errors than those of the RF, pointing to reduced forecasting accuracy.
- •Mean Absolute Error (MAE): This value measures the average magnitude of the errors in predictions, disregarding their direction. Lower MAE values signify a closer alignment with actual data.
- •RF MAE: At 27.1554, this suggests that on average, predictions by the RF are about 27 units from true sales figures.
- •Neural Network MAE: Recorded at 57.9782, indicating that predictions are on average about 58 units from actual sales figures, higher than the RF model.
This thorough evaluation compares two modeling approaches, RF and neural network, highlighting their strengths and differences in accurately forecasting demand. Two distinct techniques were employed: an RF model and a KNN. Each model’s setup was meticulously detailed, including training methods, algorithms, and specific design choices. The RF model used decision trees for its predictions, while the neural network utilized layers of neurons to process the data and forecast demand. Additionally, results provided various performance metrics showcasing the practical performance of each model.
- •RF: An R2 Score of 0.9384, with MSE at 21043.8545 and MAE at 27.1554 indicating a highly effective model that properly forecasts demand.
- •Neural Network: An R2 Score of 0.8865, MSE at 38768.3324, and MAE at 57.9782, which, although lower than the RF, still reflects great predictive capability.
Additionally, an unsupervised ML technique, the K-means clustering algorithm, was employed to dive deeper into the demand patterns present in the dataset. This approach proves particularly useful in distinguishing groups of stores or products based on their sales patterns, demographic profiles, and characteristics. Implementing K-means allowed for the identification of distinct clusters, revealing natural groupings that can be strategically targeted with customized marketing or inventory adjustments. This clustering provides critical insights into the underlying data structures, fostering more refined and data-driven decision-making in SCM.
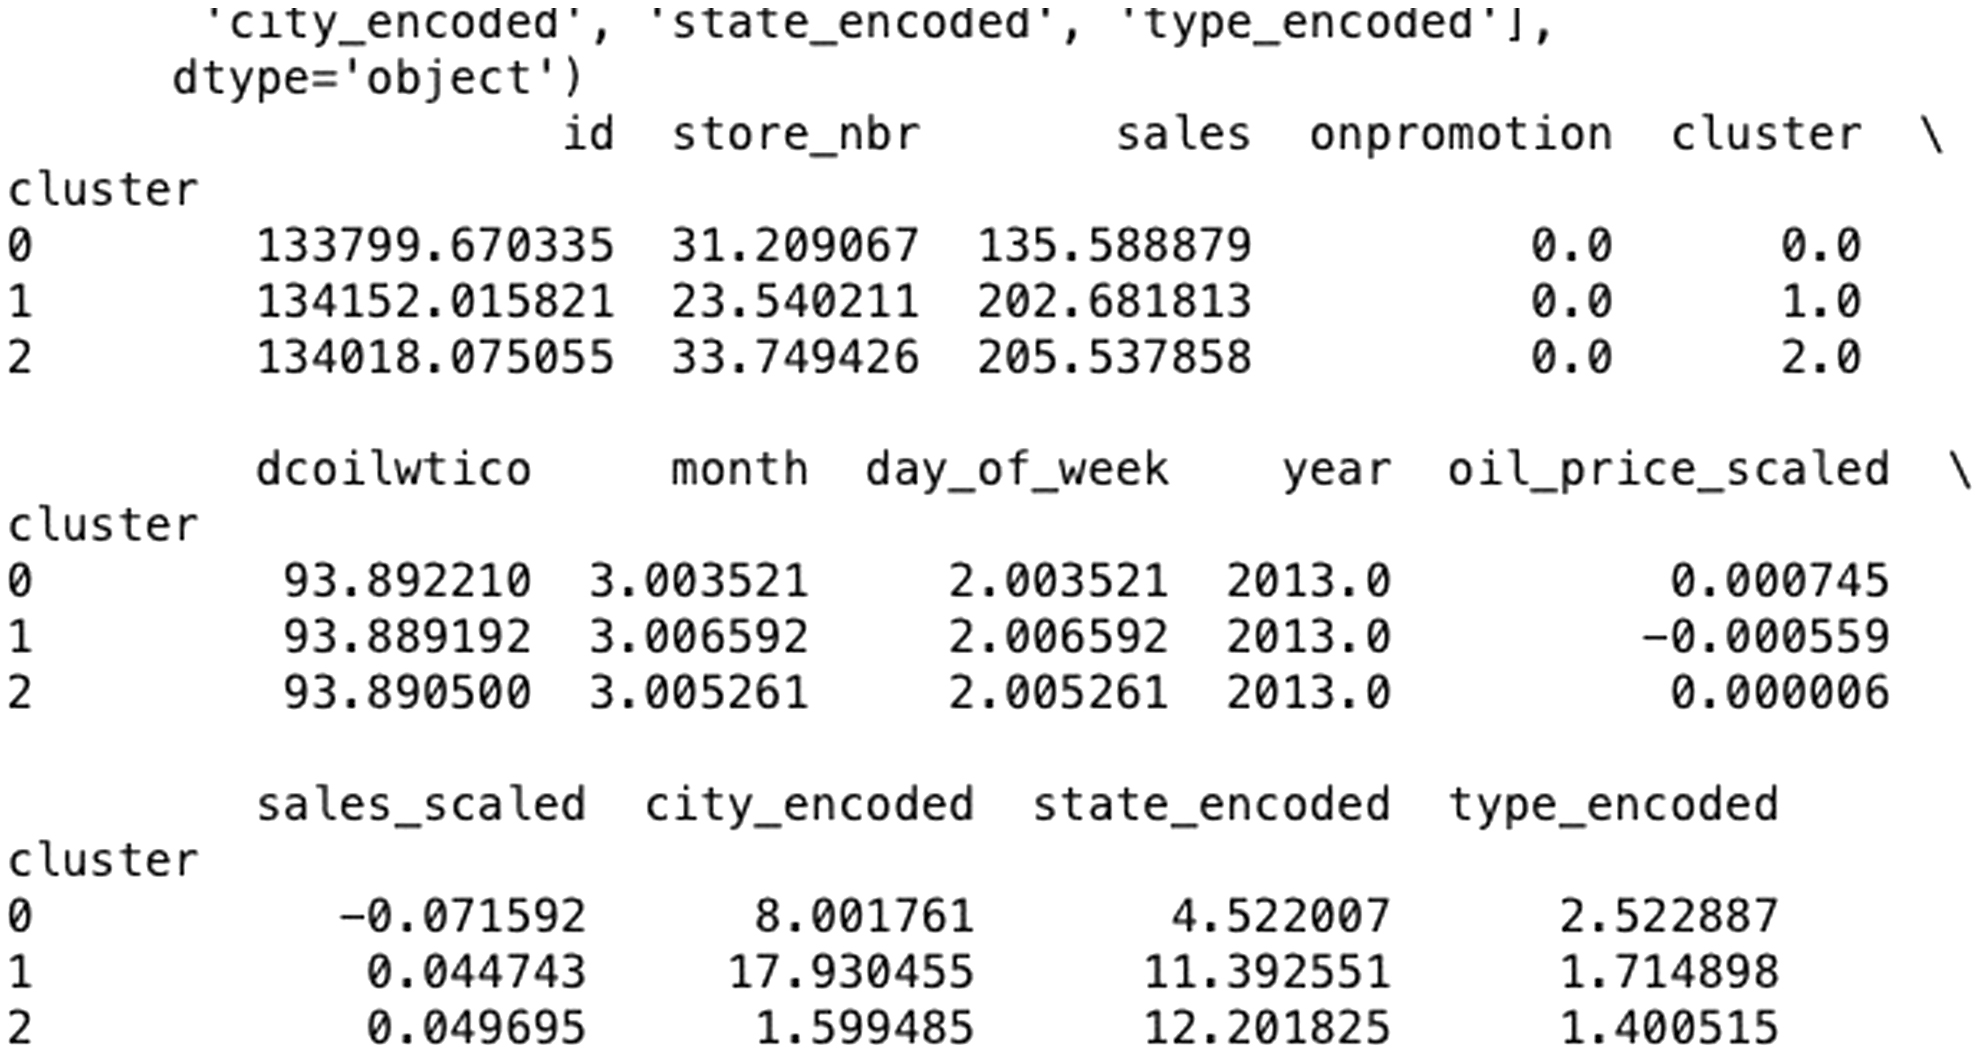
During the data analysis phase, the sales dataset underwent extensive preprocessing and was segmented by the K-means clustering algorithm to uncover patterns in store performance and market dynamics. Key steps included converting the “date” column into a datetime format and deriving new temporal features such as month, day of the week, and year to account for sales fluctuations over time. Missing values, particularly in critical variables like oil prices and sales figures, were addressed through mean imputation to maintain data integrity and uniformity. Categorical variables such as city, state, and store type were transformed using label encoding, while numerical data were normalized using the StandardScaler, ensuring an unbiased contribution to the clustering process. The clusters were then analyzed by computing the average of each cluster’s characteristics, which helped delineate distinct behavioral and market trends among different store types, providing valuable insights for targeted strategic planning. The entire process underscores the significance of unsupervised learning in identifying and leveraging patterns critical for effective retail management strategy development.
Clustering was conducted using the K-means algorithm, designating three distinct clusters based on feature similarities. This segmentation aids in understanding the core characteristics that define each group by analyzing the average of each feature within the clusters. The results, presented with labels for clusters 0, 1, and 2, include averages for various attributes like oil prices, sales, and encoded categorical features, indicating minor economic variations and potential geographical or store-type similarities among the clusters. Notably, numeric identifiers such as “id” and “store_nbr” were included in these calculations, though such metrics typically don’t hold significant analytical value. The detailed averages help discern the economic influences and performance metrics specific to each cluster, providing insights that are crucial for strategic decision-making in demand forecasting. To further analyze cluster utility, one might examine the statistical significance of differences between clusters or consider adjustments based on cluster size to refine the clustering strategy. Such analysis can guide resource allocation, like adjusting inventory or marketing strategies to match the demand patterns of each cluster, and inform strategic planning such as where to expand or reduce operations. Understanding the dynamics within each cluster such as how sales patterns vary by time or location enables tailored approaches to marketing and stock management, ensuring that strategies are aligned with specific cluster characteristics and market demands. In employing clustering techniques for demand forecasting, the K-means algorithm was utilized, specifying three distinct clusters. This method helps assign each dataset entry to a cluster based on feature similarities, thereby organizing the data into manageable groups that reflect underlying patterns in sales, location, and other relevant factors. The subsequent analysis of these clusters involves calculating the average values of various features for each group, which illuminates the central tendencies and unique characteristics of each cluster. For example, in the analysis, numeric identifiers like “id,” “store_nbr,” “sales,” “onpromotion,” and “cluster” were included in the calculation. These numbers, while typically not useful for analytical purposes, ended up in the dataset, illustrating a need for careful data handling. The results of the clustering reveal distinct profiles for each cluster based on scaled and encoded features such as oil prices and sales data, which provide insights into economic conditions and store performance. Notably, oil price variations and sales metrics were recorded for each cluster, helping to understand economic impacts on sales across different clusters. Further, the encoded features such as city, state, and store type offer a glimpse into the geographical and operational characteristics of the stores within each cluster. These insights allow for strategic decision-making in resource allocation and marketing, tailoring approaches to fit the unique attributes of each cluster. For instance, clusters with higher average sales might receive increased inventory and more aggressive promotional campaigns, especially during peak periods identified in the cluster analysis. Strategic planning based on cluster insights involves making informed decisions about opening new stores, targeting specific markets for expansion, or reducing presence in underperforming areas. Operational adjustments are also guided by cluster analysis, aligning logistics, inventory management, and staff allocation with the demand patterns of each cluster. Marketing strategies are customized to address the demographics and buying behaviors of customers in different clusters, with promotions timed to coincide with peak demand periods identified through clustering. The analysis also involves continuous monitoring and iteration. Clustering results are visualized using tools such as heatmaps or bar charts, which clearly present the findings to stakeholders and assist in ongoing strategy adjustments. Regular updates to the clustering analysis ensure that the insights remain relevant and actionable, adapting to new data and significant market changes. The silhouette score, used as a metric to evaluate the clustering model’s effectiveness, indicated a moderately good separation between the clusters, suggesting that each cluster has distinct characteristics. However, there is room for improvement in model parameters or feature selection to achieve clearer distinctions among the clusters. Figure 5 shows the silhouette score:
 Fig. 5. Clustering silhouette score.
Additionally, PCA is applied to reduce dataset dimensionality, facilitating a clearer visual assessment of the clustering. The scatter plot generated from PCA visually differentiates the clusters, aiding in the intuitive understanding of data segmentation and supporting strategic decisions based on the clustering results (see Fig. 6).
Managerial Implications: The results indicate that RF provides superior predictive accuracy, making it suitable for operational forecasting. However, clustering reveals hidden demand patterns across stores, enabling segmentation-based strategies such as targeted promotions and inventory optimization. The integration of both approaches supports hybrid decision-making, where prediction accuracy is complemented by structural insights.
VI.CONCLUSION
This research set out to develop a comprehensive framework to enhance demand forecasting in SCM by integrating advanced AI technologies, specifically focusing on supervised (RF) and unsupervised (clustering) models. The research was successful in not only developing these models but also in rigorously evaluating them under varying market conditions to determine their efficacy and adaptability.
The study conclusively demonstrated that the supervised RF model excelled in accuracy and reliability across different datasets, making it a dependable choice for dynamic and complex supply chain environments. In contrast, the unsupervised clustering approach offered valuable insights into market segmentation, which could be crucial for strategic planning and decision-making processes within SCM. Throughout the research, several challenges were encountered, including data variability and model sensitivity to hyperparameters. These challenges were addressed through systematic model tuning and rigorous validation processes, enhancing the robustness and applicability of the forecasting models.
These findings represent a significant contribution to both the academic and practitioner aspects of SCM. They will also form a concrete base for further research and development in more sophisticated and fine AI-driven forecasting models that will open up new avenues for supply chain dynamics management. The study’s methodologies and results have been well received in academic circles, as demonstrated by the feedback from industry experts and academics during several high-level presentations. This not only advances the field of SCM but also opens up new pathways for future research, particularly in the integration of hybrid AI models that could potentially offer even greater insights and efficiencies.
VII.LIMITATIONS AND FUTURE WORK
While the study provides comprehensive insights into AI-driven demand forecasting, the models’ performance may still be contingent on the specific characteristics of the data and the precise configuration of each model. Additionally, the generalizability of the results across different industries and global markets requires further validation.
Future research could also be done on how the models can be customized further using other AI models such as deep learning models or reinforcement models. Making the models applicable to other sectors of the global supply chain could also be an added impetus for further research into the possibilities of adaptability of these models. The use of real-time data to update the models could also greatly promote the models’ level of adaptability to market dynamics.