I.INTRODUCTION
Plants play an essential role in providing food on a global scale, and various environmental factors contribute to plant leaf diseases [1]. Agricultural biodiversity is important for human civilization, providing the original materials for survival [2]. Plant leaf diseases are caused by pathogens such as fungi, bacteria, and nematodes. Their development affects environmental conditions, such as excessive moisture and high humidity, which create a habitat for these harmful organisms [3]. Plant diseases affect the growth, function, and structure of crops, which directly impacts human livelihoods [4]. Most farmers rely on manual methods to detect and classify diseases; however, these approaches reduce productivity, and early identification is challenging [5]. Existing classification methods based on physical observations are inaccurate, leading to decreased agricultural production [6]. Conventional methods fail to provide the early and precise diagnosis necessary for efficient crop production, creating a burden for managing high-quality yields [7]. Artificial intelligence (AI)-based leaf disease identification helps address potential issues, such as a more diverse and larger dataset and more interpretable and robust models [8]. Biomass estimation, crop monitoring, plant population counts, field mapping, weed management, and spraying have advantages in agriculture [9].
The traditional convolution approaches of disease diagnosis based on manpower-intensive, time-consuming, ineffective visual inspection, and large-scale fields are also impractical and inaccurate, with substantial monitoring costs [10]. Color-based characteristics, shape, and texture are focused on plant leaf disease classification [11]. Manual examination by inexperienced individuals makes it difficult to differentiate among symptoms, and identifying these distinct indicators is important for accurate classification and precise disease management [12]. Due to a lack of expert guidance, farmers used standard protection techniques during sudden crop infestations [13]. The long-term sustainability and safeguarding of the agricultural sector heavily depends on the early detection of crop diseases, which plays a significant role in preventing from disease spread [14]. This symptom variability necessitates more sophisticated approaches to solve complicated manual diagnoses for effective disease management [15]. Plants are impacted by rain, temperature, and sunlight and change at all phases of growth and development, and soil characteristics such as nutrients, pH, and moisture content are important [16]. The identification of leaf diseases involves diagnosing infections that impair the leaves, which is inherently a complex and challenging process. Because leaves are the primary sites for photosynthesis, any impairment directly affects the plant’s ability to produce energy, impacting its pollination and reproduction [17]. The traditional methods have problems in categorizing diverse leaf diseases with overlapping symptoms, which present a challenge for accurate classification [18]. Existing convolutional approaches depend mostly on visual observation of technicians and agricultural experts, where human error in diagnosis reduces the precision of identification [19]. The differentiation between diseased and non-diseased leaves is challenging for the existing models [20]. The key contributions of this work are outlined below:
- •The autoencoder components use nonlinear mapping to compress high-dimensional hyperspectral data into a lower-dimensional latent space that efficiently filters spectral redundancy.
- •The Kolmogorov–Arnold network (KAN) mechanism captures complex, high-dimensional relationships using learnable activation functions rather than fixed weights, which helps the model achieve a higher nonlinear representation capability with lower computational overhead and fewer parameters.
- •The multiscale pyramid structure captures both coarse-grained context and fine-grained local details by processing images at multiple spectral and spatial scales.
II.RELATED WORKS
This section presents a detailed review of the literature on plant leaf disease classification, along with an analysis of its advantages and limitations.
Falaschetti et al. [21] developed a convolutional neural network (CNN)-based image detector for plant leaf disease classification. In the preprocessing stage, a normalization technique was utilized to normalize the data range, thereby improving the image quality. Once the model was trained, it was easily scaled to various types of plant leaf disease classifications by retraining with new data. However, the CNN method faced overfitting issues because the data were not sufficiently diverse, which led to poor model performance.
Shafik et al. [22] developed a Plant Disease Detection Network (PDDNet) method that utilized Arithmetic Ensemble (AE) and Lead Voting Ensemble (LVE) techniques combined with CNN to extract features for the plant leaf disease classification efficiently. The PDDNet model helped localize the critical spots of leaves of a species in a complex background. However, diseases and plant pests, caused by fungi, protozoa, and bacteria, depending on environmental factors, severely affect plant structure, health, and quality.
Hussein Ali et al. [23] presented EfficientNetB0, DenseNet201, EfficientNetB3, and InceptionResNetV2 methods that were utilized to enhance plant leaf disease classification. The image resizing preprocessing technique was used to resize the images to improve model efficiency. Data balancing was performed using a class-weighted algorithm, which helped solve the data imbalance problem. However, the proposed method faced difficulties during training, which increased the computational cost.
Thanjaivadivel et al. [24] developed an enhanced CNN model for leaf disease detection, which is featuring with inverted residual blocks and depth-wise separable convolution. The developed model considers the characteristics and morphological properties of plant leaves by including size, color, and intensity to classify the data. The flattened layer was placed to increase the model accuracy by incorporating global average pooling. However, the model was not validated on real-time data and failed to extract features efficiently.
Bao et al. [25] implemented a deep neural network (DNN) for sugarcane disease detection. The DNN model extracted both simple and complex features, significantly enhancing overall performance. The sliding window strategy was utilized for preprocessing to convert raw data into filtered data. The integrating spatial information was critical to identifying sugarcane diseases in their early stages. However, the DNN model struggled to capture discriminative spectral information which limited its overall performance.
Zhang et al. [26] developed a relief algorithm with Competitive Adaptive Reweighted Sampling (CARS) for spectral fingerprint feature extraction. Random Forest (RF), Support Vector Machine (SVM), and Backpropagation Neural Network (BPNN) were utilized for early identification of anthracnose and strawberry gray mold. However, the BPNN model had a more complicated network structure that required a longer operating time, which affects the system performance.
Ruby et al. [27] introduced a Residual Network with 50 layers (ResNet50), which was used to classify wheat leaf diseases. The batch normalization, convolution, and activation leaky rectified linear unit layers were included for modification. The model generator and discriminator networks helped fill in the missing data to improve the model’s efficiency. However, the similarities in color and texture across different disease classes increase the difficulty in leaf disease classification.
Wu et al. [28] implemented an SVM, and an extreme learning machine (ELM) was utilized for the fusion of vegetation indices (VIs), efficient texture features (TFs), and optimal wavelengths (OWs). The gray-level co-occurrence matrix was used to extract the VIs and spectral features. Spearman’s correlation coefficient was used to correlate sample categories and all TFs to improve the classification accuracy. However, integrated features such as VIs, TFs, and OWs for strawberry disease detection also caused inefficient performance.
III.PROPOSED METHODOLOGY
In this research, a Multiscale Pyramid Autoencoder with a Kolmogorov-Arnold Network (MPA-KAN) for plant leaf disease classification is proposed. Both the PlantVillage dataset and the hyperspectral image dataset are utilized for training and validation for proposed disease detection model. The preprocessing technique, namely image resizing, maintains uniformity, improves image quality, and enhances model performance. Figure 1 proposed MPA-KAN architecture for automated plant leaf disease identification and classification.
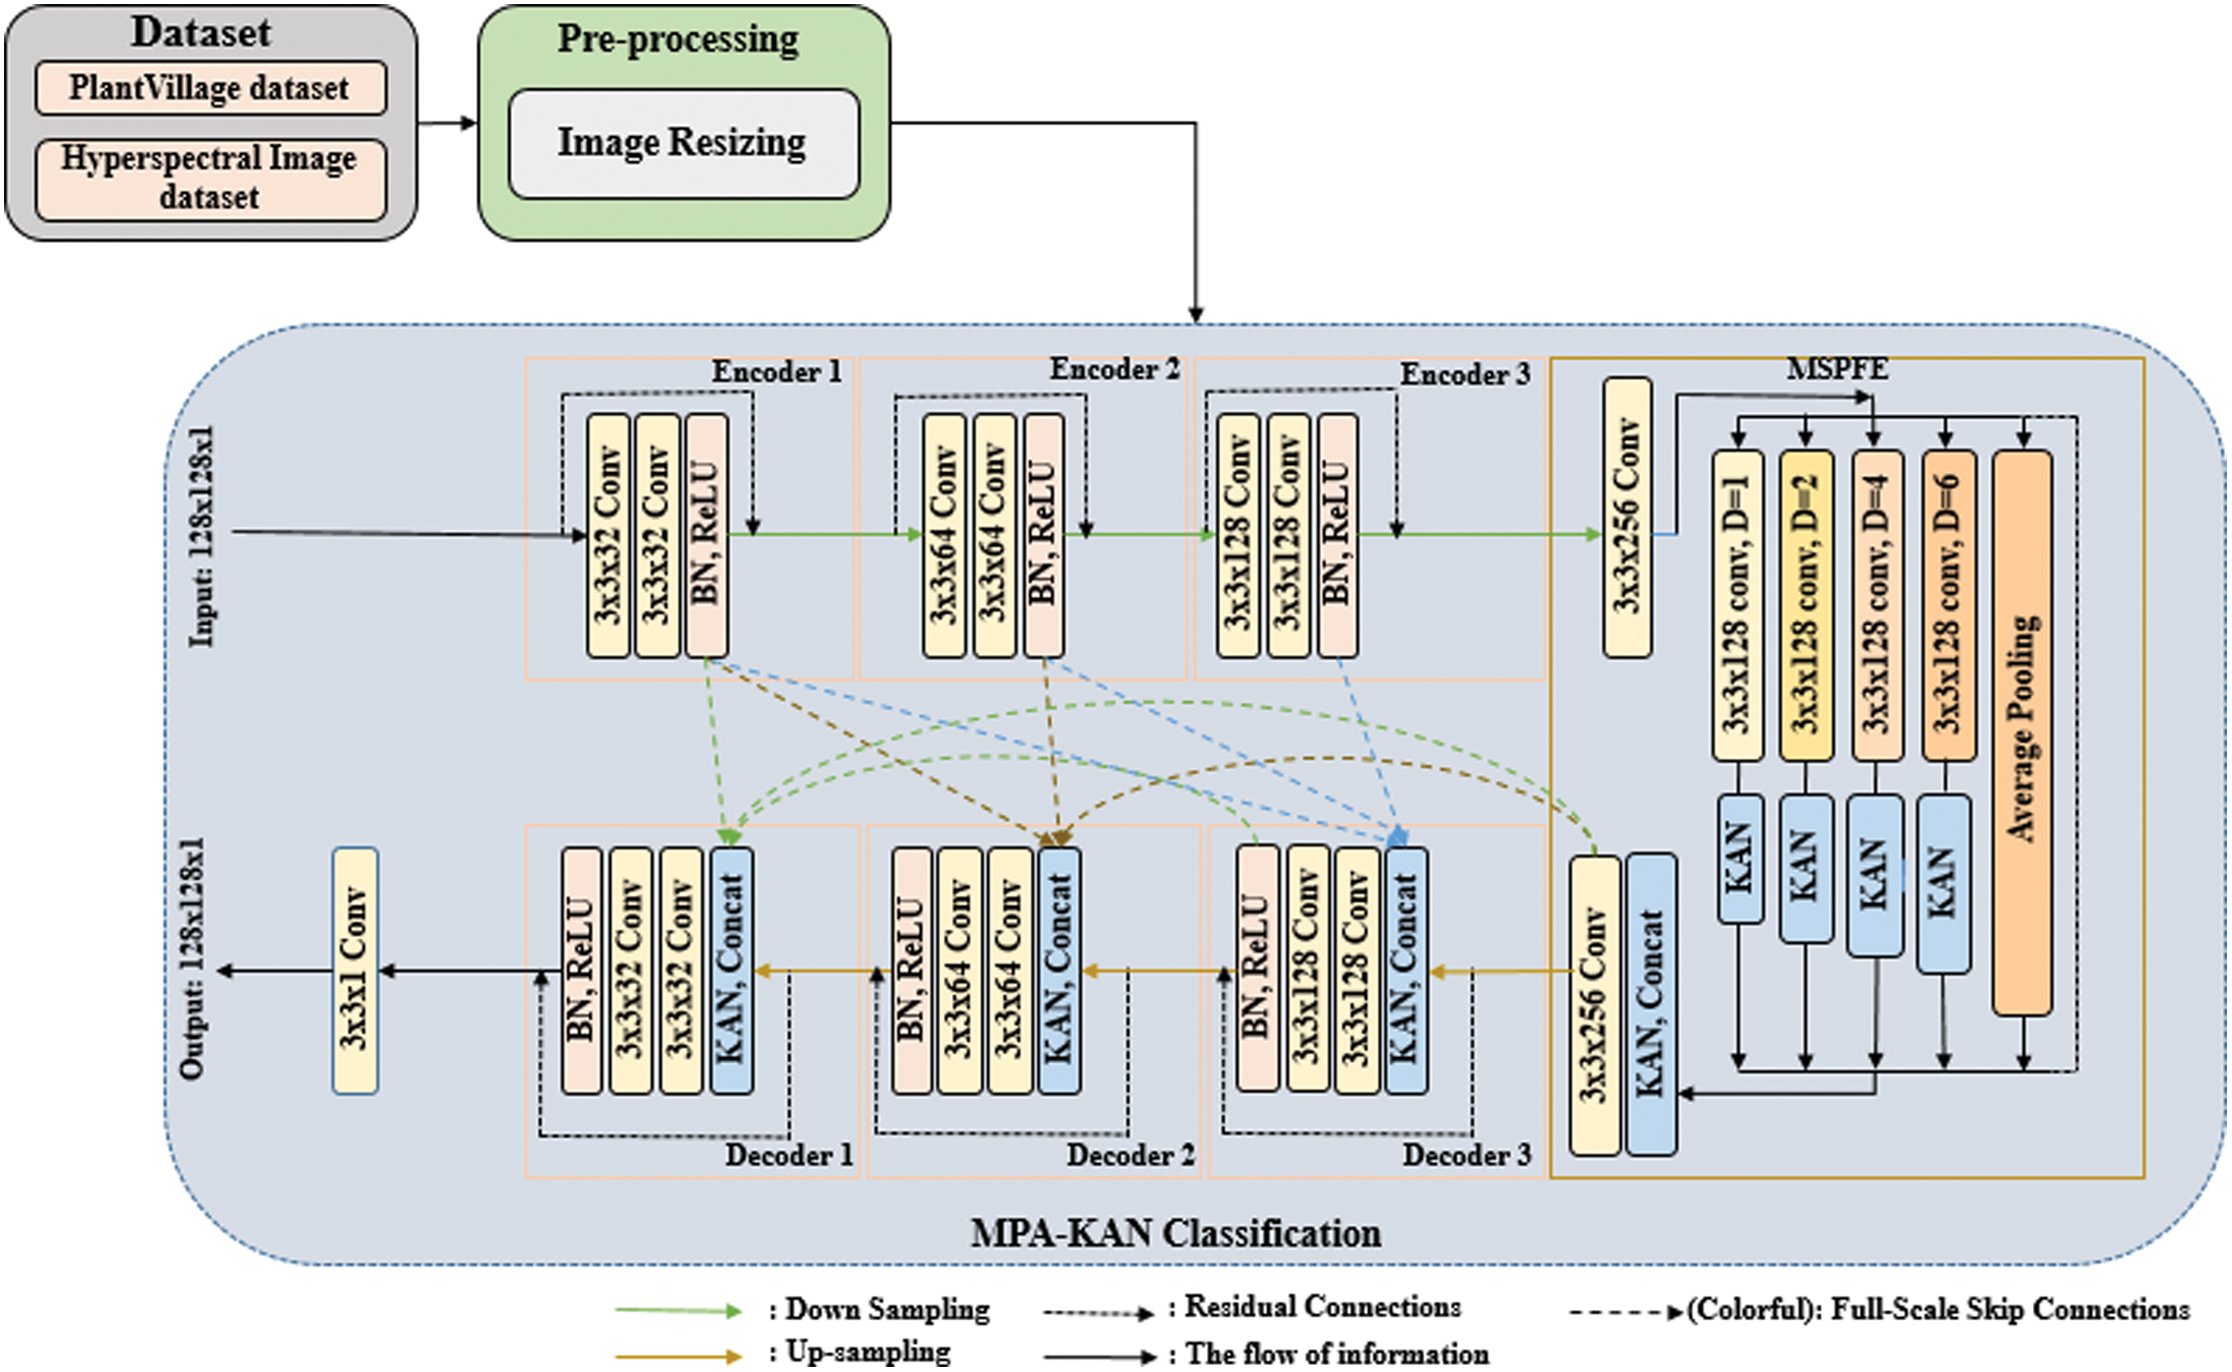 Fig. 1. Architecture of proposed MPA-KAN for classification of plant leaf disease.
A.DATASET DESCRIPTION
The PlantVillage [29] dataset is a broadly applied and popular dataset for the detection of plant diseases due to its comprehensive and accessible image collection. The dataset contains 20,798 color images of leaves, all of which are captured against a uniform background. The dataset is partitioned in a 70:10:20 ratio which results in 14,558 images for training, 2,080 for validation, and 4,160 for testing. Tomato plant features have a larger range of disease types, including leaf mold, mosaic virus, blight, target spot, yellow leaf curl virus, spider mite damage, and Septoria leaf spot, along with healthy samples.
The hyperspectral image dataset [30] is a large dataset, mainly because multiple plants are imaged for several days. A single plant scan could easily be approximately a gigabyte in size. Full spectral analysis is more time-consuming than selecting a subset of key wavelengths for diagnostic processes.
B.PREPROCESSING
In this section, the image resizing technique is important for pixel values, which differ when the training and testing dimensions of the images are varied. The ‘resize()’ is a symbol for image resizing. Subsequently, plant leaf images are fed to the Gaussian filters as an input to remove the noise by improving the quality of the image. Two-dimensional (2D) convolution uses a Gaussian operator to smooth and eliminate noise in the image, which is expressed in Equation (1):
where the horizontal distance from the origin is , vertical distance is , and denotes the Gaussian distribution standard deviation, while represents the Gaussian kernel.C.CLASSIFICATION USING A MPA-KAN
In this phase, the proposed MPA-KAN is employed to classify plant leaf diseases and enhance overall accuracy. The inputs are a hyperspectral image and a PlantVillage dataset, which are expressed in Equation (2):
where the original hyperspectral image is represented by , smoothed data is denoted as , and the noise component is represented as , respectively. The estimated noise-free data is generated by the model ; here the model operates on the input image using the learnable parameter , which consists of weights and biases given in Equation (3): where encompasses the learnable parameters of the model, represents bias, and denotes weight. The refers to model-estimated value; the mapping function is , and then the is the network parameter.During network training, the w weights and B bias are continually updated to optimize the model. A clear optimization objective is provided by the loss function for network parameter updating. L1 loss excels at preserving signal amplitude; therefore, this loss function is adopted to restore signal structure and preserve signal amplitude as defined in Equation (4):
The cross-entropy loss is , the labeled data is , where indicates predicted probability and denotes the total number of classes. This cross-entropy function represented in Equation (4) is used for multi-class leaf disease classification, whereas binary classification uses a different logarithmic structure. The proposed model identifies specific disease types simultaneously, making the summation across c classes important for accurate mapping. Using a binary approach fails to differentiate among multiple co-existing symptoms on a single leaf. Therefore, the multi-class formulation helps handle the diverse label set of the PlantVillage dataset. This ensures that the MPA-KAN model optimizes the weights for each specific disease category instead of a simple binary classification outcome.
1).KOLMOGOROV–ARNOLD NETWORK
The KAN mechanism is utilized to improve the model performance and interpretability by substituting standard weights with learnable univariate functions. The KAN activation function is located and learned at the network edges instead of the major portion of the network. The KAN function provides an efficient advantage in terms of adaptability and accuracy, which is used by the representation of the Kolmogorov–Arnold theorem. The theorem states that any multivariate continuous function can be represented as a superposition of two types of simpler functions; a total sum of univariate functions is given in Equation (5):
where internal functions are , and then external functions are .The combination of KAN attention with feature attention and the MPA module enables the model to selectively weight and aggregate the most spectral features and informative spatial information from the input data. The proposed model components are preserved, and their positions manage the original distribution of leaf lesions. This approach allows for a deeper exploration of detailed edge features, underlying defect patterns, and their distribution.
The MPA-KAN model compresses the image feature matrix into a one-dimensional vector using global averaging pooling (GAP). These compression embeddings are generated in a lower-dimensional space before being projected back to their original dimensions, as shown in Equation (6):
where the KAN network nonlinear projections are and and p represents different channels containing information from various image features.The KAN replaces linear transformations with functional mappings, as given in Equations (7) and (8):
whereHere, the B-spline basis function is and the learnable coefficients are , respectively, and the model includes two KAN layers with ∼5.6 M parameters.
| ALGORITHM: MPA-KAN model for plant leaf disease classification |
| INPUT: Red, green, and blue/hyperspectral images, target size = (224, 224), num_classes |
| OUTPUT: Trained model, classification results |
| 1. PREPROCESSING: |
| FOR each image IN dataset: |
| resized ← resize (image, target_size) |
| RETURN processed_images, labels |
| 2. MULTISCALE PYRAMID ENCODER: |
| FOR level = 0 to 4: |
| Pyramid_img ← down sample (input, 2^level) |
| features[level] ← Conv2D → Batch Norm → ReLU → Max Pool → Flatten |
| RETURN concatenate (all features) |
| 3. KAN ATTENTION: |
| FOR each feature e_dim: |
| attention_score ← B_spline_function (feature, learnable_params) |
| attention_weights ← softmax (attention_scores) |
| attended_features ← attention_weights × features |
| RETURN attended_features |
| 4. KAN CLASSIFIER: |
| FOR each KAN_layer: |
| FOR each input-output pair: |
| output ← spline_function(input, learnable_splines) |
| predictions ← softmax (final_layer_output) |
| RETURN predictions |
| 5. TRAINING: |
| FOR epoch = 1 to max_epochs: |
| # Forward pass |
| encoded ← pyramid_encoder (images) |
| attended ← KAN_attention (encoded) |
| predictions ← KAN_classifier (attended) |
| # Loss computation |
| loss ← cross_entropy (predictions, labels) + λ*reconstruction_loss |
| # Backward pass |
| Update_parameters (gradients) |
| # Validation |
| IF val_accuracy > best: save_model () |
| 6. EVALUATION: |
| accuracy ← correct_predictions/total |
| RETURN accuracy, precision, recall, f1_score |
| MAIN: |
| data ← load_and_preprocess_datasets () |
| model ← MPA-KAN_Model (num_classes, pyramid levels=4) |
| train_model (data, epochs=100) |
| evaluate_model (test_data) |
IV.EXPERIMENTAL RESULTS AND DISCUSSION
The performance of MPA-KAN is determined based on dataset training and testing. The MPA-KAN is implemented in the MATLAB environment. The system used is Windows 10, a 64-bit OS, with 16 GB RAM, an Intel Core i7-4200U CPU, and an NVIDIA RTX 3050 GPU (4–6 GB GDDR6). The proposed MPA-KAN method uses performance metrics such as precision, accuracy, F1-score, and recall.
A.DATASET SPLITTING
To ensure robust training and reliable evaluation, the dataset is partitioned into a 70:10:20 ratio for training, validation, and testing. The PlantVillage contains 20,798 images, and the hyperspectral dataset contains 1,447 scans, ensuring model reliability across both spectral and visual domains. PlantVillage contains 14,558 training images, 2,080 validation images, and 4,160 test images to classify seven tomato disease types. Focusing on early-stage disease diagnosis, a total of 1,013 training scans are used to learn spectral features in the hyperspectral dataset, 145 for validation, and 289 for testing. Table I demonstrates the dataset splitting.
Table I. Represents the dataset splitting
| Dataset | Total images | Training (70%) | Validation (10%) | Testing (20%) |
|---|---|---|---|---|
| PlantVillage | 20,798 | 14,558 | 2,080 | 4,160 |
| Hyperspectral image | 1,447 | 1,013 | 145 | 289 |
B.CROSS-DATASET VALIDATION
This cross-dataset validation demonstrates that the proposed MPA-KAN model achieves higher accuracy even when tested on another dataset. The initial model is trained on the PlantVillage dataset and tested on the hyperspectral image dataset, and vice versa, which shows the efficient performance of the model. Table II represents the cross-dataset validation.
Table II. Represents the cross-dataset validation
| Training dataset | Testing dataset | Precision (%) | F1-score (%) | Accuracy (%) | Recall (%) |
|---|---|---|---|---|---|
| PlantVillage | Hyperspectral image | 96.88 | 96.70 | 97.45 | 96.52 |
| Hyperspectral image | PlantVillage | 97.90 | 97.67 | 98.12 | 97.44 |
C.PERFORMANCE ANALYSIS FOR HYPERSPECTRAL IMAGE DATASETS
Qualitative and quantitative analyses of MPA-KAN are performed using a hyperspectral image dataset. The MPA-KAN method achieves higher accuracy than conventional methods. Table III represents performance evaluation of the MPA-KAN with existing techniques for hyperspectral datasets.
Table III. Evaluation of the MPA-KAN performance in plant leaf disease detection with traditional techniques with respect to the hyperspectral dataset
| Method | Method | Precision (%) | Accuracy (%) | Specificity (%) | F1-score (%) | Recall (%) | FOR |
|---|---|---|---|---|---|---|---|
| Hyperspectral image dataset | CNN | 88.82 | 86.39 | 93.24 | 87.43 | 86.09 | 5.82 |
| DNN | 90.75 | 90.65 | 90.65 | 90.46 | 90.54 | 90.87 | |
| Autoencoder | 94.97 | 94.60 | 94.87 | 94.73 | 94.48 | 2.53 | |
| Proposed | 99.01 | 98.99 | 99.49 | 98.99 | 98.98 | 0.49 |
The developed approach is evaluated with various existing DL approaches such as CNN, DNN, and autoencoder, which help enhance the classification accuracy. The MPA-KAN model attains 98.99% of accuracy with respect to the hyperspectral image dataset.
K-fold validation: It evaluates the classification of plant leaf diseases using a hyperspectral dataset. K-fold cross-validation was applied to validate the model’s robustness and ensure its performance generalizes well to unseen data. Here, the data are splitted into k equal subsets, each retaining high-dimensional spectral features. The hyperspectral dataset is divided into K non-overlapping folds, and in every iteration, a different fold provides a test set, whereas the rest of K-1 folds are considered for training. Table IV summarizes the K-fold validation for a hyperspectral dataset.
Table IV. K-fold validation for plant leaf disease classification with respect to the hyperspectral dataset
| K value | Precision (%) | Specificity (%) | Recall (%) | Accuracy (%) | F1-score (%) | FOR |
|---|---|---|---|---|---|---|
| K = 3 | 96.462 | 96.587 | 96.437 | 96.648 | 96.449 | 1.346 |
| K = 5 | 99.012 | 99.497 | 98.982 | 98.997 | 98.997 | 0.496 |
| K = 7 | 97.765 | 97.834 | 97.432 | 97.875 | 97.598 | 0.935 |
| K = 9 | 96.543 | 96.765 | 96.765 | 96.879 | 96.654 | 1.024 |
| Mean ± Std. | 97.45 ± 1.20 | 97.67 ± 1.34 | 97.40 ± 1.13 | 97.60 ± 1.07 | 97.42 ± 1.16 | 0.95 ± 0.35 |
Computational complexity: The proposed approach is compared with existing techniques that represent higher complexity across all metrics. The proposed model achieves an inference time of 1543.65 ms and 3.08 s of training time. Table V highlights the proposed model’s computational complexity for the hyperspectral dataset.
Table V. Computational complexity of the proposed method for the hyperspectral image dataset
| Methods | Run time | Memory in MB | Training time seconds | Inference time (ms) | Params (M) | FLOPs (G) | Inference time (ms) |
|---|---|---|---|---|---|---|---|
| CNN | 0.356 | 4.750 | Elapsed time is 0.514430 seconds. | 166.600 | 1.20 | 0.54 | 166.60 |
| DNN | 0.657 | 4.567 | Elapsed time is 0.553198 seconds. | 181.927 | 0.80 | 0.32 | 181.93 |
| Autoencoder | 1.267 | 5.276 | Elapsed time is 2.036737 seconds. | 1118.101 | 3.50 | 1.5 | 1118.10 |
| Proposed | 1.435 | 5.976 | Elapsed time is 3.0847678 seconds. | 1543.655 | 4.20 | 1.85 | 1543.66 |
This integration enhances the model accuracy, which is efficiently compared with conventional approaches such as DNN, CNN, and other DL models that enhance the performance of the model.
Class-wise performance: This analysis demonstrates higher accuracy, which represents the effectiveness of the model that adapts to unique spectral features, such as olive, avocado, and vineyard foliage. False positives are minimized in the vineyard class, which is important for the targeted pesticides. Olive images show minimal missed detections, which capture early-stage biochemical stress across various multispectral bands. Table VI displays the class-wise performance of the hyperspectral image dataset.
Table VI. Class-wise performance for the hyperspectral image dataset
| Class | Precision (%) | Accuracy (%) | F1-score(%) | Recall (%) |
|---|---|---|---|---|
| {‘Avocado multispectral images’} | 98.290 | 99.180 | 98.760 | 99.230 |
| {‘Olive multispectral images’} | 98.750 | 99.440 | 99.190 | 99.640 |
| {‘Vineyard multispectral images’} | 100.000 | 99.370 | 99.030 | 98.080 |
| {‘Mean’} | 99.010 | 99.330 | 98.990 | 98.980 |
The proposed method attains 98.99% of accuracy by efficiently distinguishing subtle spectral signatures across diverse crop varieties. This balance improves disease monitoring, thereby allowing early-stage intervention in a complex multispectral agricultural environment.
Spectral samples for olive images: The drying process causes a spectral shift because of water loss, which is a characteristic of plant diseases. Differentiating between general water stress and specific diseases caused by pathogens is challenging, as pathogen effects are localized and distinct from simple dehydration. Figure 2 depicts changes in hyperspectral reflectance spectra during the drying process.
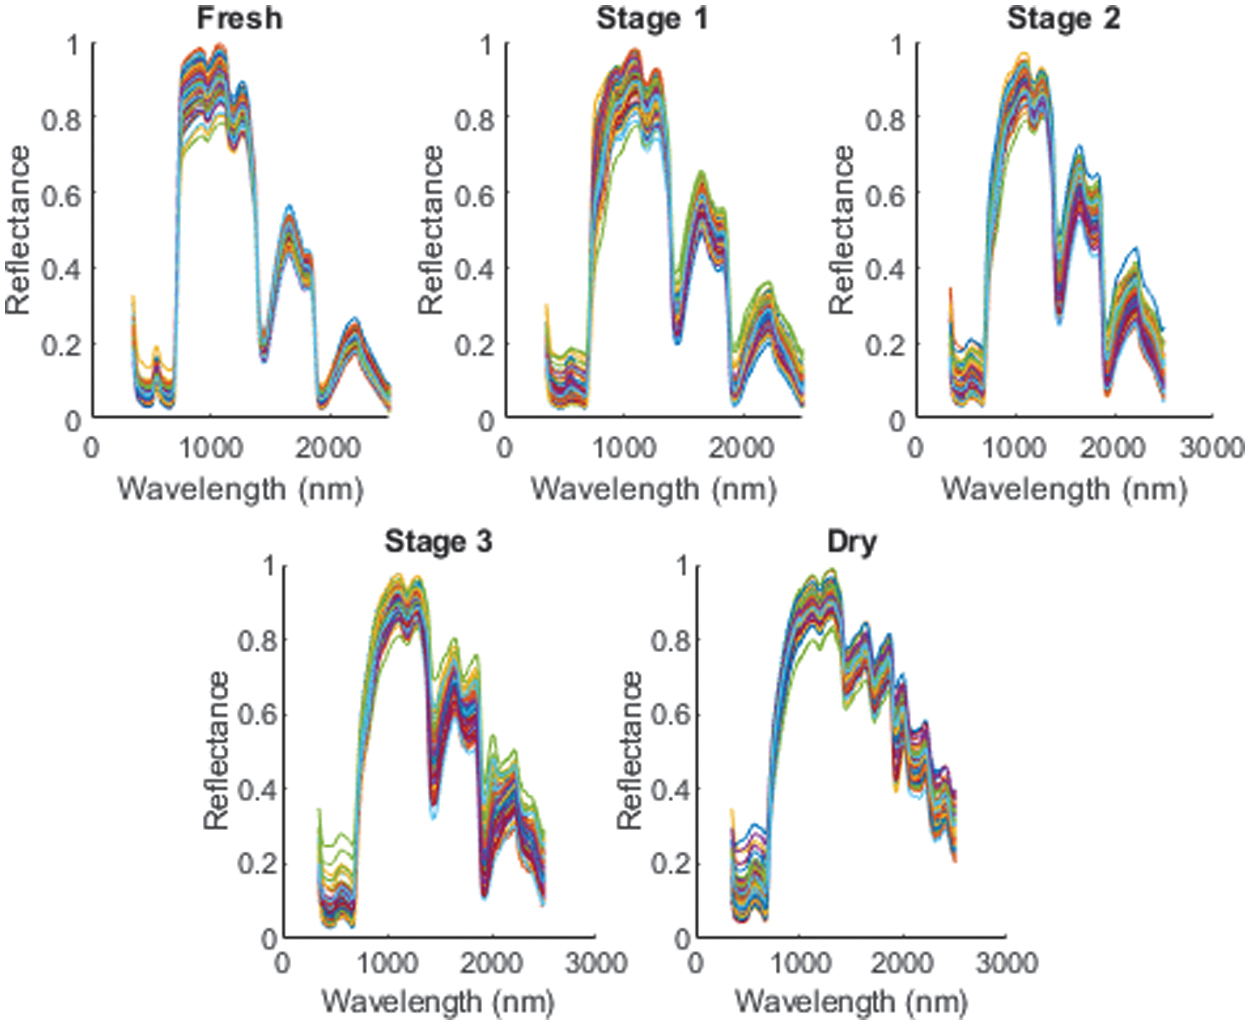 Fig. 2. Process of changes in hyperspectral reflectance spectra during drying.
Relationship between Leaf Water Index (LWI) and Live Fuel Moisture Content (LFMC): A strong positive correlation exists between the Live Fuel Moisture Content (LFMC) and Leaf Water Index (LWI). The relationship between these two is challenging in the classification of plant leaf diseases because diseases cause water stress within leaf tissues before the appearance of visible symptoms. This strong correlation allows for the use of nondestructive LWI as a reliable method for rapid estimation of actual plant water status. Figure 3 illustrates the relationship among Disease Detection Index (DDI), LWI, and Normalized Difference Water Index (NDWI) for a hyperspectral image dataset.
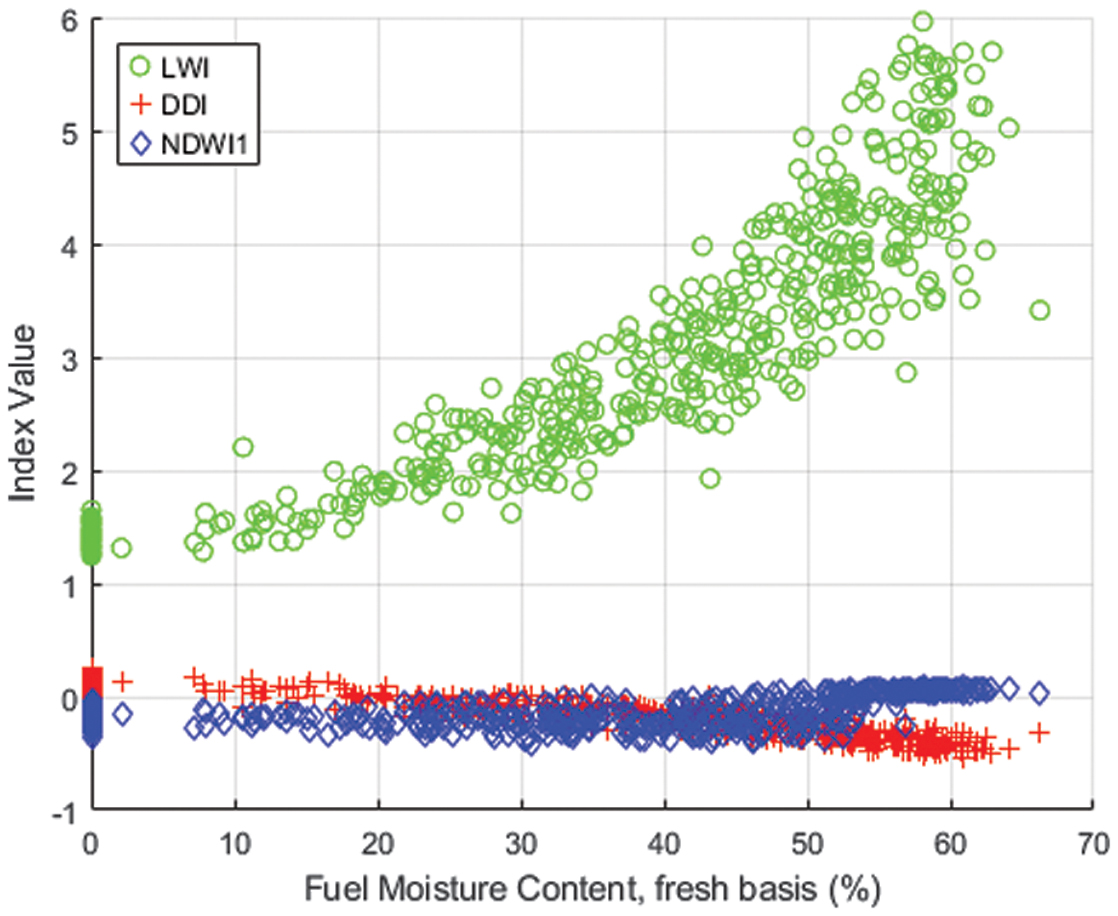 Fig. 3. Comparison of LWI, DDI, and NDWI1 indices in relation to fuel moisture content.
The nondestructive estimation of LWI from hyperspectral images allows the model to differentiate generalized water deficits from specific pathogens. The inverse linear relationship between FMC and LWI is displayed in the image; as the fresh leaf fuel moisture content increases, the corresponding LWI value decreases.
Leaf weight: Plant leaf disease classification has key indicators, such as leaf weight and near-infrared reflectance (NIR). High NIR reflectance is observed in healthy leaves because of a robust internal cell structure. Disease causes structural breakdown, which efficiently reduces reflectance. Also, the changes in the leaf weights provides essential features for the accurate detection of plant disease. Figure 4 presents leaf weight distribution in the classification of plant leaf diseases.
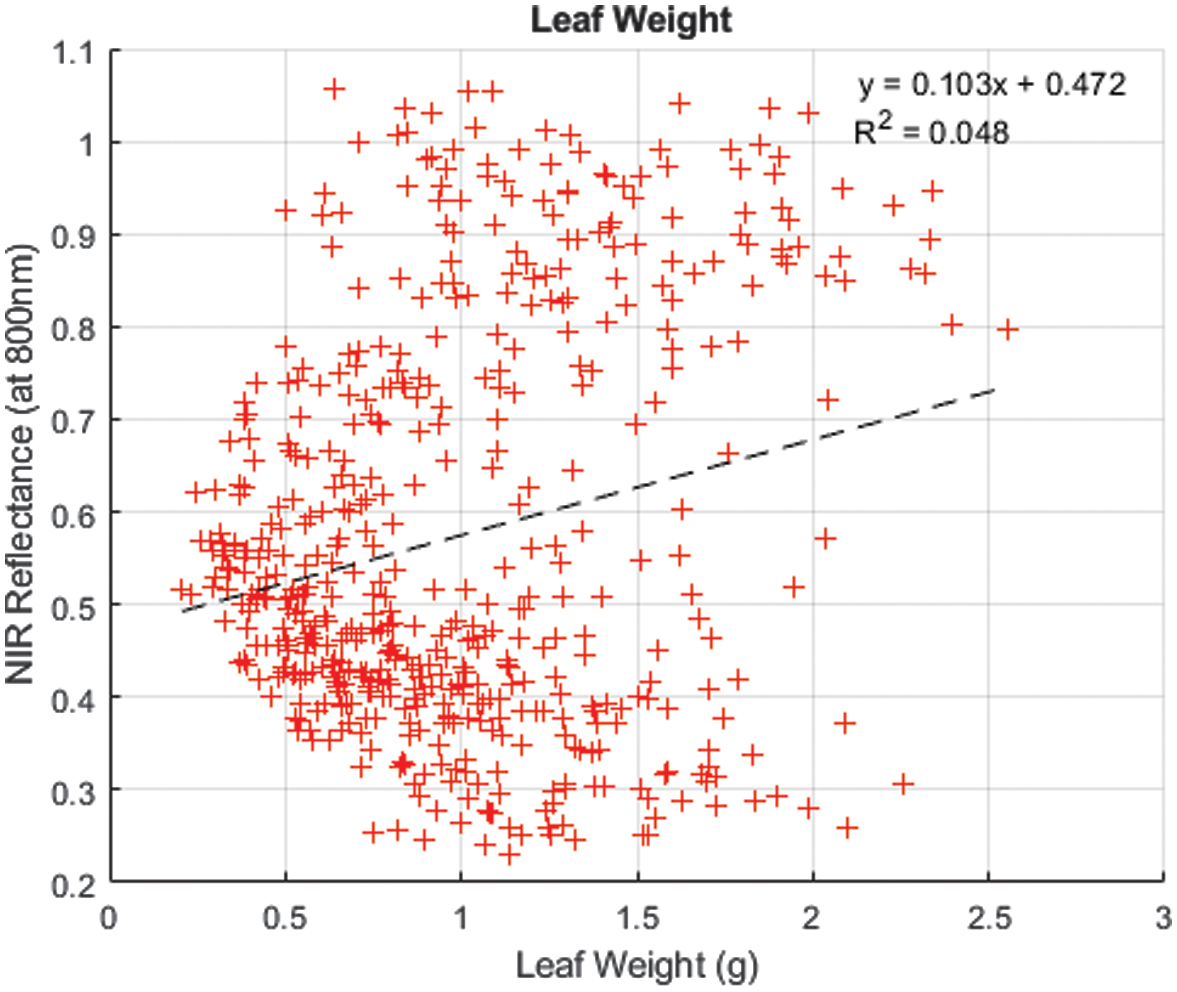 Fig. 4. Leaf weight content with hyperspectral image dataset for plant leaf disease categorization.
Nitrogen content: A strong positive correlation exists between nitrogen content and the Greedy Normalized Difference Vegetation Index (GNDVI), making the index a reliable indicator for plant nutrition. Chlorophyll content and plant greenness are measured using GNDVI, which is directly related to nitrogen levels. Figure 5 illustrates a very weak negative correlation between the two variables, mainly regarding plant leaf disease and nitrogen content.
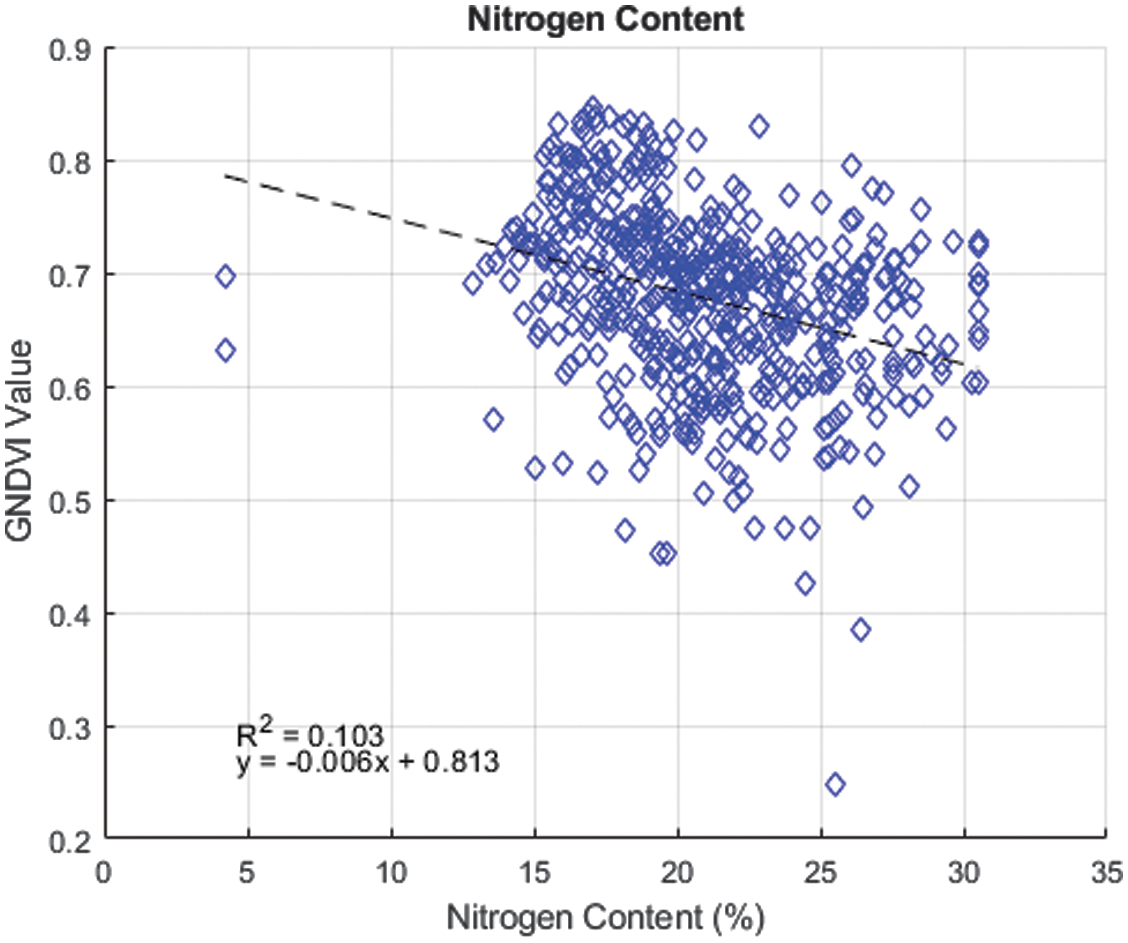 Fig. 5. Plant leaf disease classification of nitrogen content with the hyperspectral image dataset.
In the classification of plant diseases, both efficient health indicators and nitrogen deficiency are included. These factors impact the GNDVI value and spectral properties, which serve as features in the model for early detection.
Chlorophyll content: The relationship between value and chlorophyll content is derived from the spectral reflectance used for plant health assessment. A weak negative correlation is observed, indicating that variations in chlorophyll content account for only 4.1% of the variance in the values within this dataset. The common symptoms of plant diseases are chlorosis, the loss of chlorophyll, which is an essential component of photosynthesis. Measuring chlorophyll level and distribution provides important features for accurately classifying plant leaf diseases. Figure 6 visualizes chlorophyll content for plant leaf disease classification.
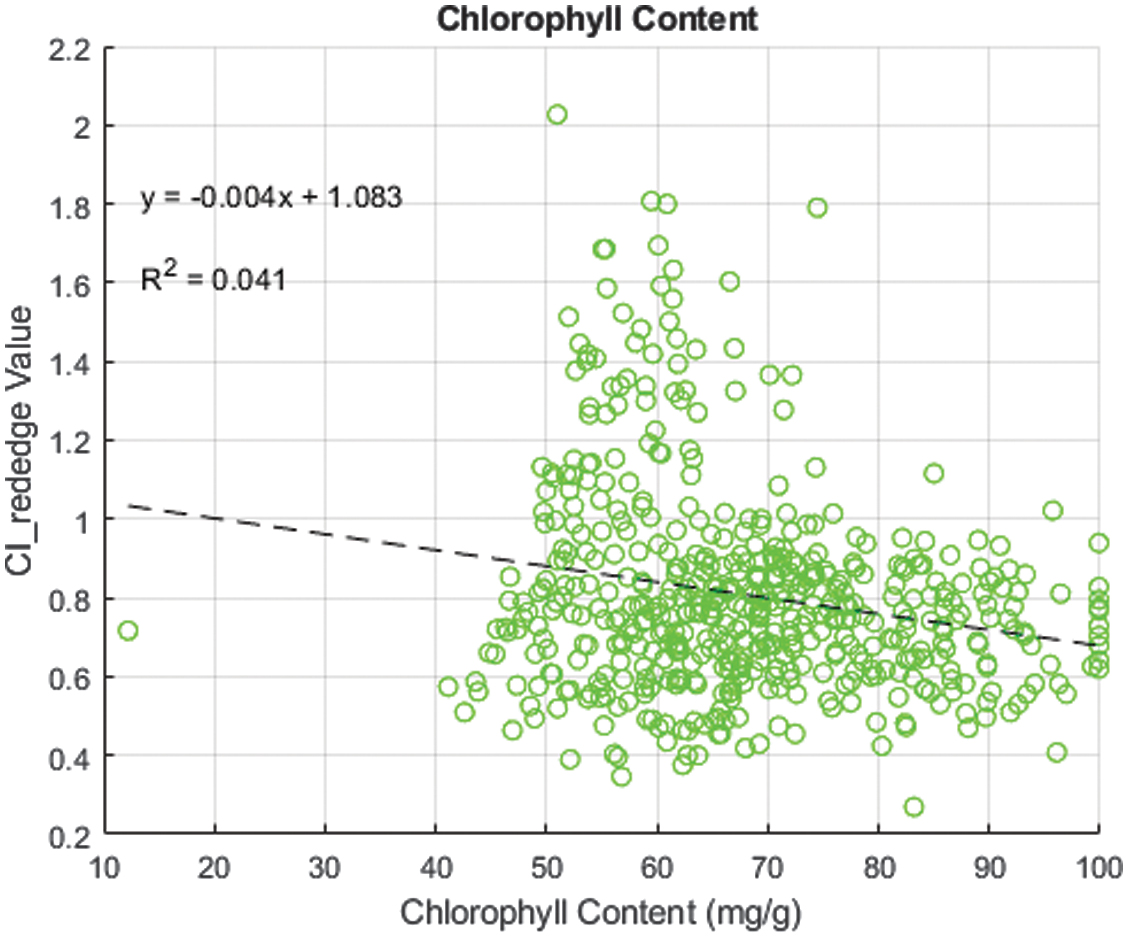 Fig. 6. Plant leaf disease classification of chlorophyll content with a hyperspectral image dataset.
Due to the influence of water content and leaf structure on spectral properties, a single relationship is insufficient for robust disease detection.
Confusion matrix: Figure 7 illustrates confusion matrix of the MPAKAN evaluated on the hyperspectral image dataset. The plotted graph exhibits a better comparison between the true and predicted labels for various classes. In the confusion matrix, the diagonal elements show correctly classified samples, whereas off-diagonal elements represent misclassified instances.
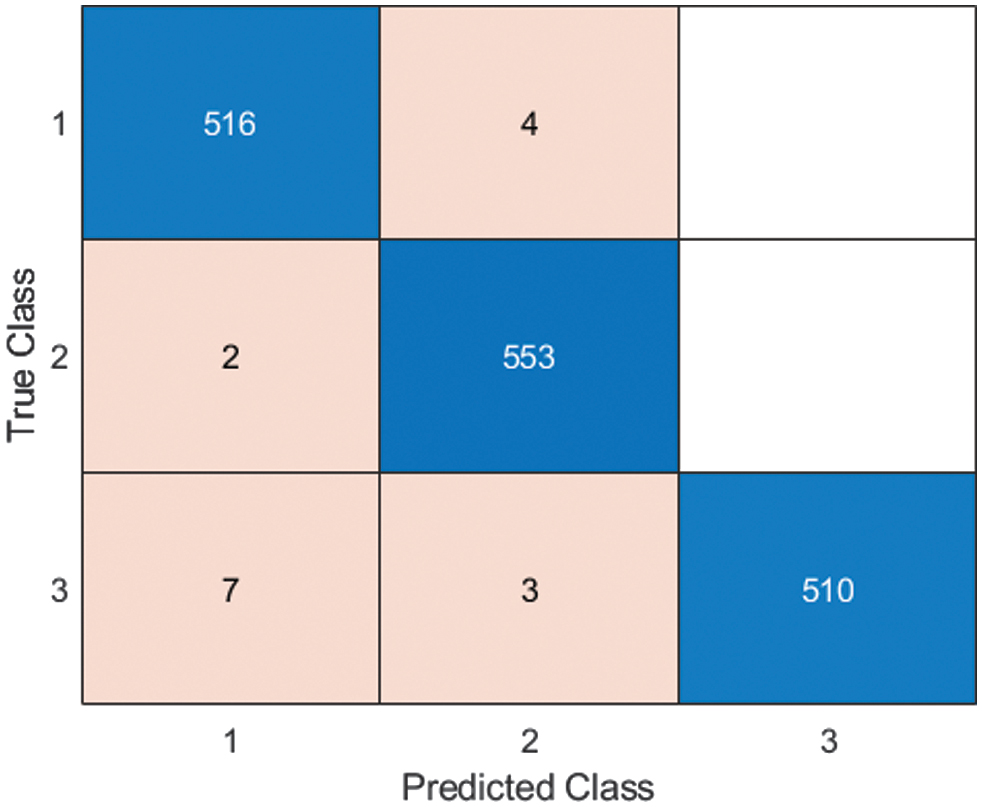 Fig. 7. Hyperspectral image dataset confusion matrix for plant leaf disease classification.
ROC curve: Figure 8 demonstrates receiver operating characteristic (ROC) curve for the HSI dataset classification model. The curve plots the true positive rate (TPR) against the false positive rate (FPR) across various threshold settings.
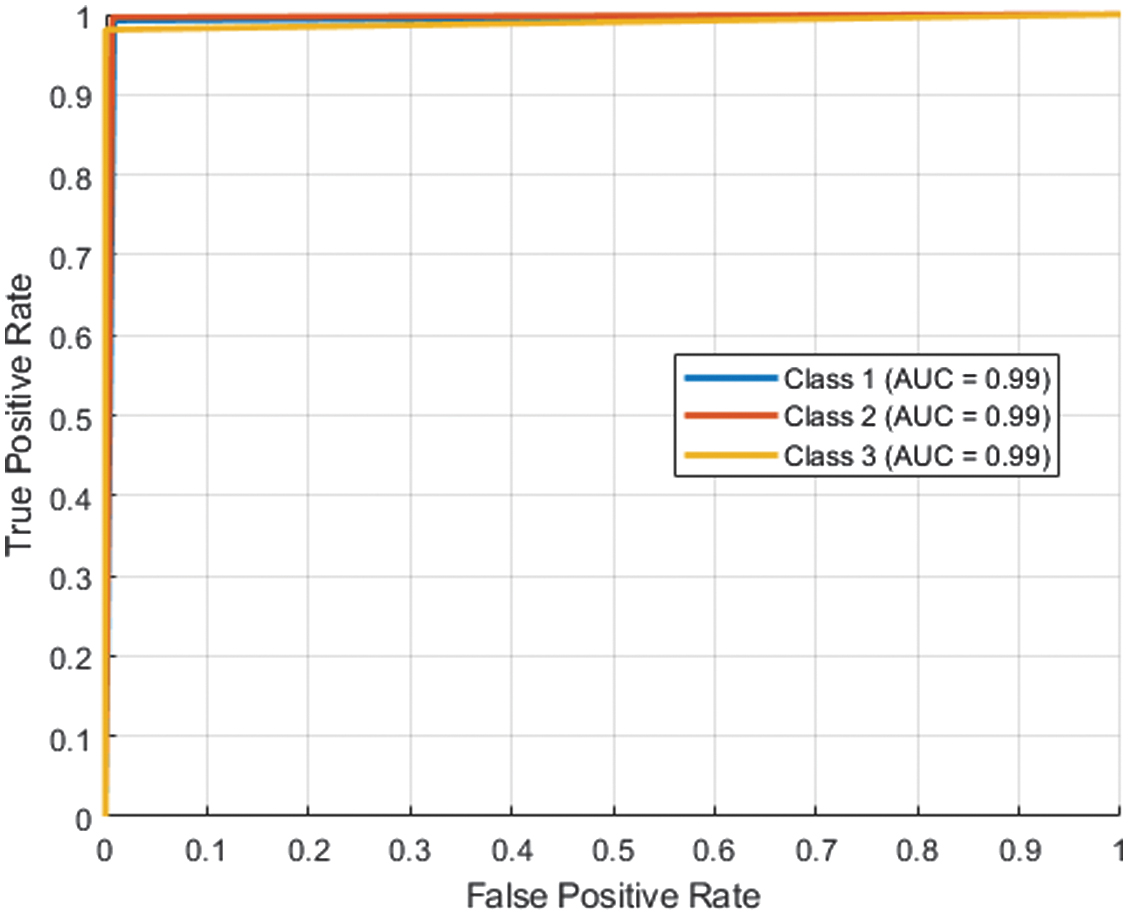 Fig. 8. ROC curve for MPA-KAN in plant leaf disease classification using hyperspectral image dataset.
Standard deviation: The proposed model demonstrates better efficiency when identifying plant leaf diseases within hyperspectral image datasets. The variability of the individual data points around the average value is called the standard deviation, which provides important information about the reliability and consistency of the proposed model. Figure 9 presents the hyperspectral image dataset standard deviation.
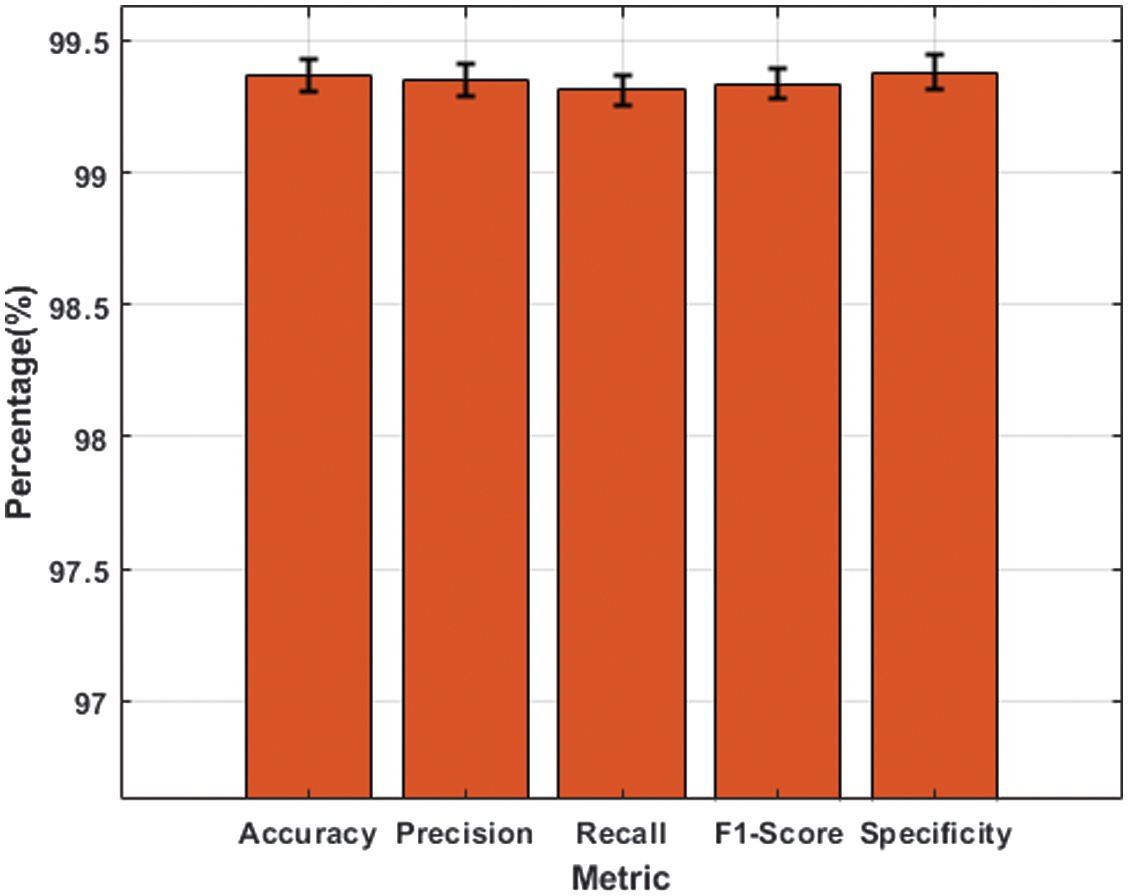 Fig. 9. Standard deviation for the hyperspectral image dataset in plant leaf disease classification.
Statistical analysis: The proposed method identifies outliers, compares data distributions between groups via statistical analysis, and visualizes variability. The proposed approach attains a higher accuracy than traditional methods. Figure 10 illustrates statistical analysis of plant leaf diseases with respect to the hyperspectral image dataset.
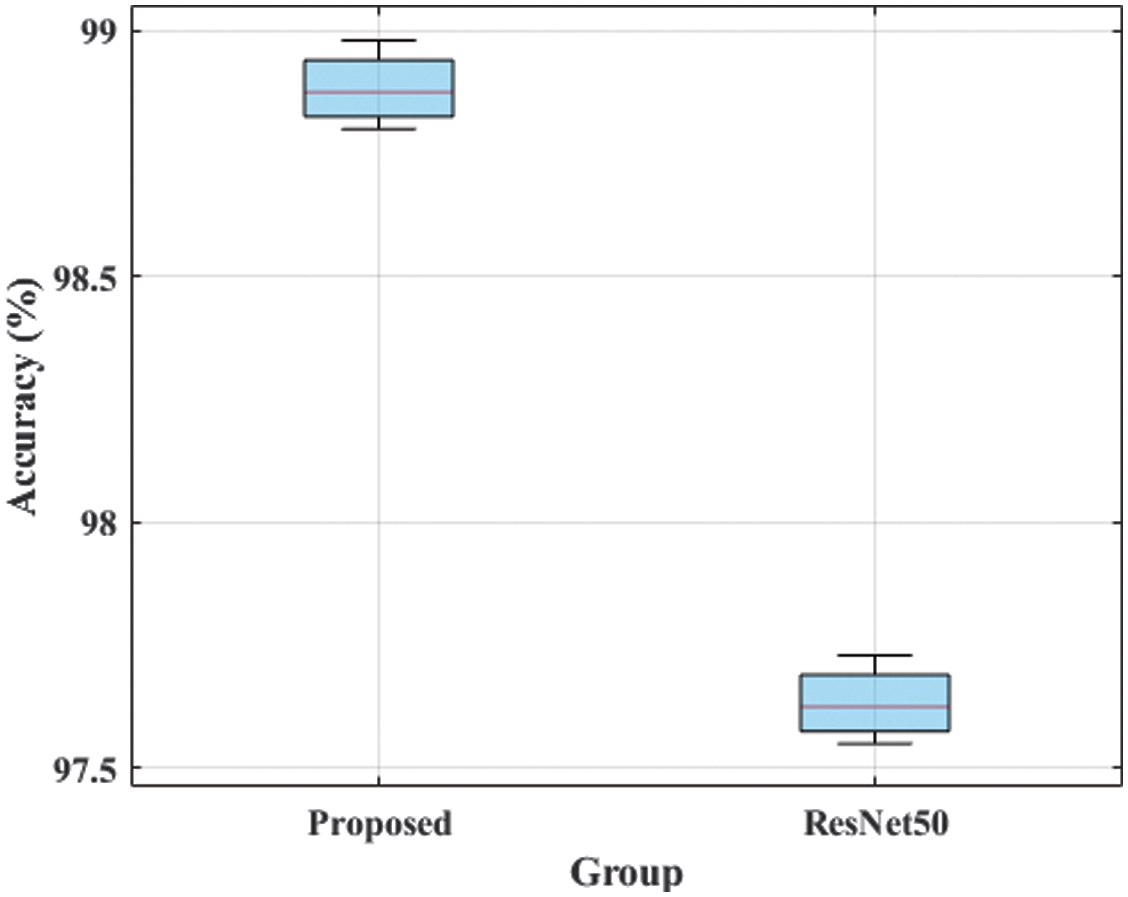 Fig. 10. Statistical analysis for the hyperspectral image dataset in plant leaf disease classification.
Performance analysis for PlantVillage dataset results: Qualitative and quantitative analyses of the proposed MPA-KAN are used to evaluate the PlantVillage datasets. The significance of the proposed model is validated by considering various performance metrics. Table VII depicts the evaluation of the MAP-KAN model performance in leaf disease classification with the traditional methods.
Table VII. Evaluation of classification performance between the MPA-KAN and state-of-the-art approaches for based on PlantVillage dataset
| Method | Precision (%) | Accuracy (%) | Specificity (%) | F1-score (%) | Recall (%) | FOR (%) | FDR (%) |
|---|---|---|---|---|---|---|---|
| CNN | 84.36 | 85.32 | 99.59 | 81.00 | 77.90 | 0.39 | 15.63 |
| DNN | 97.56 | 97.87 | 97.34 | 97.55 | 97.54 | 0.76 | 2.89 |
| Autoencoder | 98.16 | 98.24 | 98.72 | 98.16 | 98.25 | 0.54 | 0.41 |
| MPA-KAN | 99.14 | 99.98 | 99.32 | 99.21 | 99.10 | 0.42 | 0.34 |
K-fold validation: This validation helps avoid overfitting issues by enhancing the reliability of the model. Various fold configurations, such as 2, 3, 5, and 7, are used to evaluate the proposed MPA-KAN. The MPA-KAN attains higher accuracy for the 5-fold configuration, which helps improve performance. Existing CNNs, DNNs, and autoencoders demonstrate performance fluctuations in accuracy. Across various folds, strong generalizability and stability highlight the capacity of MPA-KAN for complex images. Table VIII K-fold validation of the PlantVillage dataset.
Table VIII. K-fold validation with the PlantVillage dataset
| K-folds | Precision | Accuracy | F1-score | Specificity | Recall | FOR | FDR |
|---|---|---|---|---|---|---|---|
| K = 3 | 96.84 | 96.96 | 96.79 | 96.93 | 96.75 | 1.04 | 4.98 |
| K = 5 | 99.14 | 99.23 | 99.21 | 99.32 | 99.10 | 0.42 | 0.34 |
| K = 7 | 98.76 | 98.96 | 98.61 | 98.97 | 98.46 | 0.64 | 1.75 |
| K = 9 | 97.97 | 97.76 | 97.97 | 97.76 | 97.97 | 0.96 | 2.86 |
| Mean ± Std. | 98.18 ± 0.99 | 98.23 ± 1.05 | 98.15 ± 1.04 | 98.25 ± 1.07 | 98.07 ± 0.99 | 0.77 ± 0.28 | 2.48 ± 1.96 |
Computational complexity: The MAP-KAN-based classification method is compared to conventional approaches using the PlantVillage dataset. The MPA-KAN approach requires more memory, and the number of instances is also high compared to existing methods. Table IX summarizes the computational complexity of plant leaf disease classification with the PlantVillage dataset.
Table IX. Computational complexity for the PlantVillage dataset in plant leaf disease classification
| Methods | Run time | Memory in MB | Training time seconds | Inference time (ms) | Params (M) | FLOPs (G) | Inference time (ms) |
|---|---|---|---|---|---|---|---|
| CNN | 0.186 | 0.640 | Elapsed time is 0.312638 seconds. | 152.790 | 0.45 | 0.12 | 152.79 |
| DNN | 0.216 | 0.070 | Elapsed time is 0.343500 seconds. | 90.084 | 0.18 | 0.05 | 90.08 |
| Autoencoder | 1.044 | 3.857 | Elapsed time is 1.204686 seconds. | 134.765 | 1.12 | 0.48 | 134.77 |
| Proposed | 1.312 | 4.130 | Elapsed time is 1.4632867 seconds. | 356.876 | 1.85 | 0.86 | 356.88 |
PlantVillage dataset class-wise results: The class-wise analysis validates the model’s efficiency across 10 distinct disease categories within the PlantVillage dataset. Each class attains better accuracy with higher performance, ranging from 99.55% to 99.9%. The MPA-KAN method obtained 99.8% accuracy on the PlantVillage dataset which demonstrates its high precision in classifying diverse diseases, including bacterial spot, yellow leaf curl virus, mosaic virus, and late blight. The minimal intra-class variance further demonstrates the model’s robustness across complex multi-class classification tasks. Table X demonstrates the class-wise results for the PlantVillage dataset.
Table X. PlantVillage dataset class-wise results
| Class | Accuracy (%) | Precision (%) | Recall (%) | F1-score (%) | |
|---|---|---|---|---|---|
| Apple | Black_rot | 99.79 | 99.78 | 99.98 | 99.88 |
| Scab | 99.87 | 99.95 | 99.87 | 99.91 | |
| healthy | 99.87 | 99.78 | 99.34 | 99.56 | |
| Cedar_apple_rust | 99.87 | 99.83 | 99.87 | 99.85 | |
| Blueberry | healthy | 99.95 | 99.87 | 99.35 | 99.60 |
| Cherry | (including_sour)_healthy | 99.72 | 99.89 | 99.82 | 99.85 |
| (including_sour)_Powdery_mildew | 99.76 | 99.82 | 99.54 | 99.68 | |
| Corn_(maize) | Common_rust | 99.74 | 99.35 | 99.26 | 99.30 |
| Cercospora_leaf_spot Gray_leaf_spot | 99.64 | 99.71 | 99.02 | 99.36 | |
| Northern_Leaf_Blight | 99.76 | 99.24 | 99.21 | 99.22 | |
| Grape | Black_rot | 99.98 | 99.16 | 99.31 | 99.22 |
| _(maize)___healthy | 99.13 | 99.03 | 99.32 | 99.17 | |
| Esca_(Black_Measles) | 99.98 | 99.21 | 99.28 | 99.24 | |
| healthy | 99.23 | 99.56 | 99.54 | 99.55 | |
| Leaf_blight_(Isariopsis_Leaf_Spot) | 99.76 | 99.13 | 99.01 | 99.07 | |
| Peach | Bacterial_spot | 99.34 | 99.14 | 99.31 | 99.22 |
| Peach___ | healthy | 99.23 | 99.22 | 99.01 | 99.11 |
| Orange | Haunglongbing_(Citrus_greening) | 99.86 | 99.82 | 99.75 | 99.78 |
| Pepper,_ bel | Bell___healthy | 99.66 | 99.65 | 99.54 | 99.59 |
| Bacterial_spot | 99.56 | 99.32 | 99.21 | 99.26 | |
| Potato | Early_blight | 99.53 | 99.32 | 99.14 | 99.23 |
| healthy | 99.26 | 99.02 | 98.23 | 98.62 | |
| Late_blight | 99.56 | 99.43 | 99.23 | 99.33 | |
| Soybean_ | healthy | 99.86 | 99.56 | 99.47 | 99.51 |
| Raspberry | healthy | 99.43 | 99.21 | 99.04 | 99.12 |
| Strawberry | Leaf_scorch | 99.65 | 99.65 | 99.65 | 99.65 |
| healthy | 99.44 | 99.24 | 99.23 | 99.23 | |
| Squash | Powdery_mildew | 99.21 | 99.02 | 99.14 | 99.08 |
| Tomato | Bacterial_spot | 99.54 | 99.14 | 99.01 | 99.07 |
| Early_blight | 99.58 | 99.32 | 99.31 | 99.31 | |
| Late_blight | 99.23 | 99.04 | 99.21 | 99.12 | |
| Septoria_leaf_spot | 99.67 | 99.43 | 99.21 | 99.32 | |
| Leaf_Mold | 99.84 | 99.73 | 99.32 | 99.52 | |
| Target_Spot | 99.25 | 99.12 | 99.31 | 99.21 | |
| Spider_mites | 99.65 | 99.43 | 99.35 | 99.39 | |
| Tomato_mosaic_virus | 99.15 | 99.13 | 99.13 | 99.13 | |
| Tomato_Yellow_Leaf_Curl_Virus | 99.33 | 99.26 | 99.05 | 99.15 | |
| Healthy | 99.21 | 99.20 | 99.02 | 99.11 | |
Confusion matrix: Figure 11 represents the classification performance of MPA-KAN in terms of confusion matrix by focusing on various leaf diseases in the PlantVillage dataset. A comparison between the predicted labels generated by the model and the ground-truth labels represents the classification accuracy of each disease type.
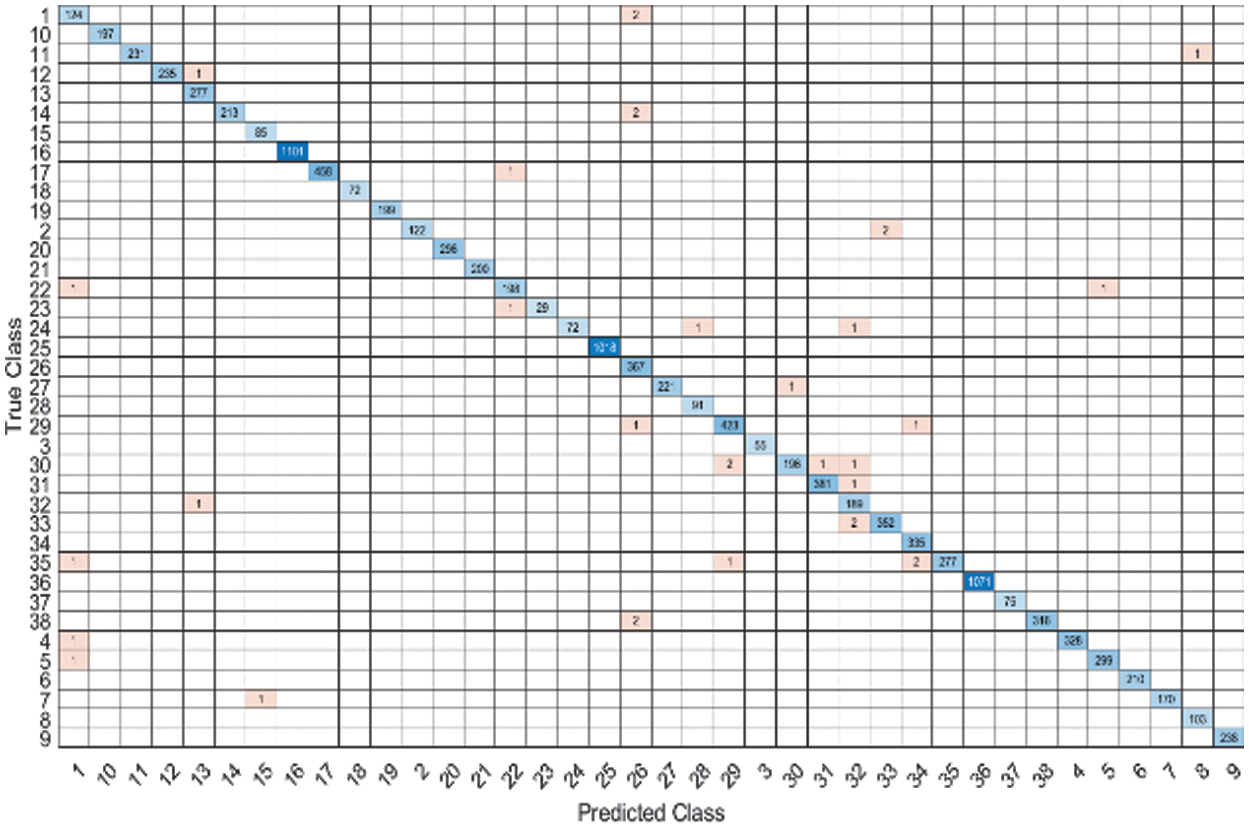 Fig. 11. Confusion matrix of MPA-KAN model classification performance on PlantVillage dataset.
ROC curve: Figure 12 illustrates ROC curve which represents the classification performance of the MAP-KAN on the PlantVillage dataset, demonstrating its high sensitivity and specificity. The curve depicts the relationship between the TPR and FPR for multiple disease classes and helps evaluate how effectively the model distinguishes between different plant diseases and healthy leaves.
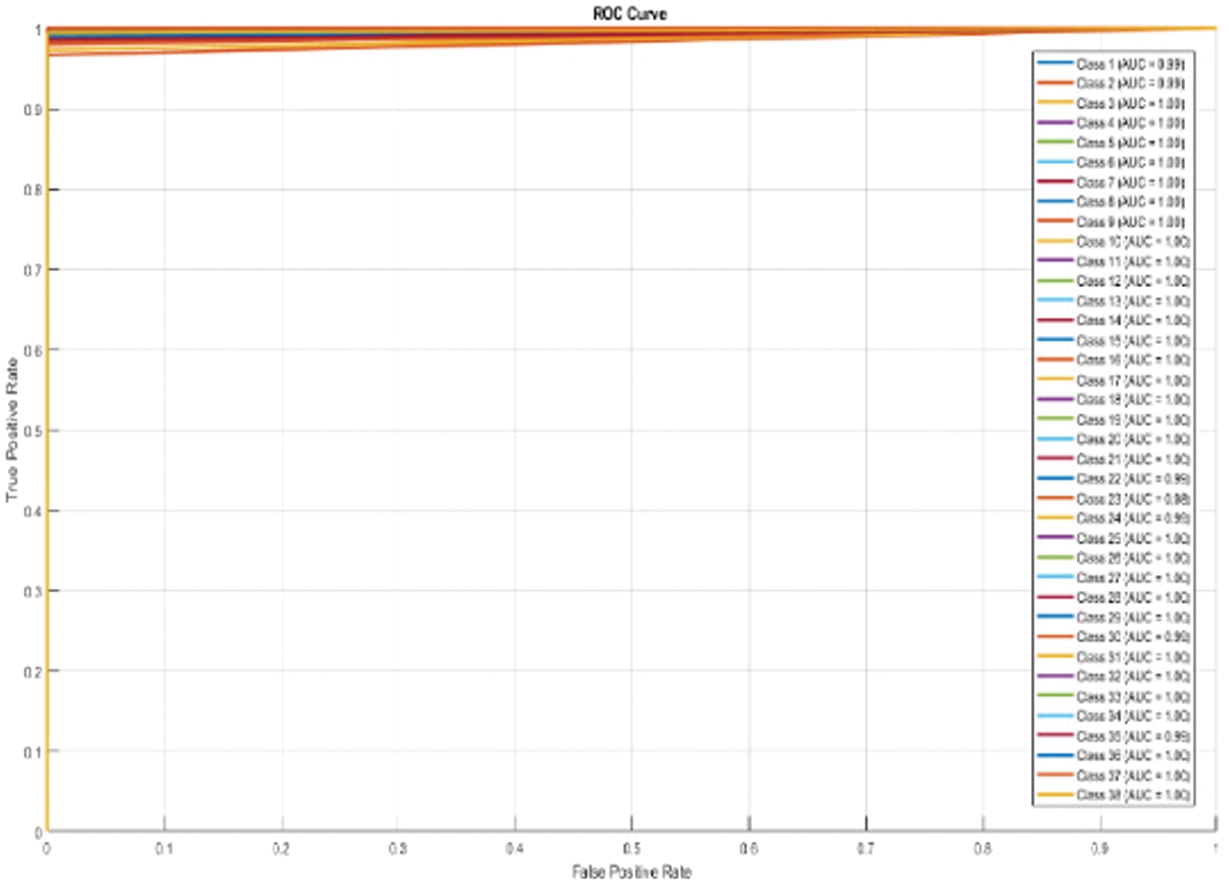 Fig. 12. ROC curve-based performance analysis of MPA-KAN model in plant leaf disease classification performance using PlantVillage dataset.
Standard deviation: The classification of plant leaf diseases attains higher accuracy than traditional approaches with respect to the PlantVillage dataset. The standard deviation of the proposed method is minimal compared with those of the existing approaches. Figure 13 depicts the standard deviation of plant leaf disease classification in the PlantVillage dataset.
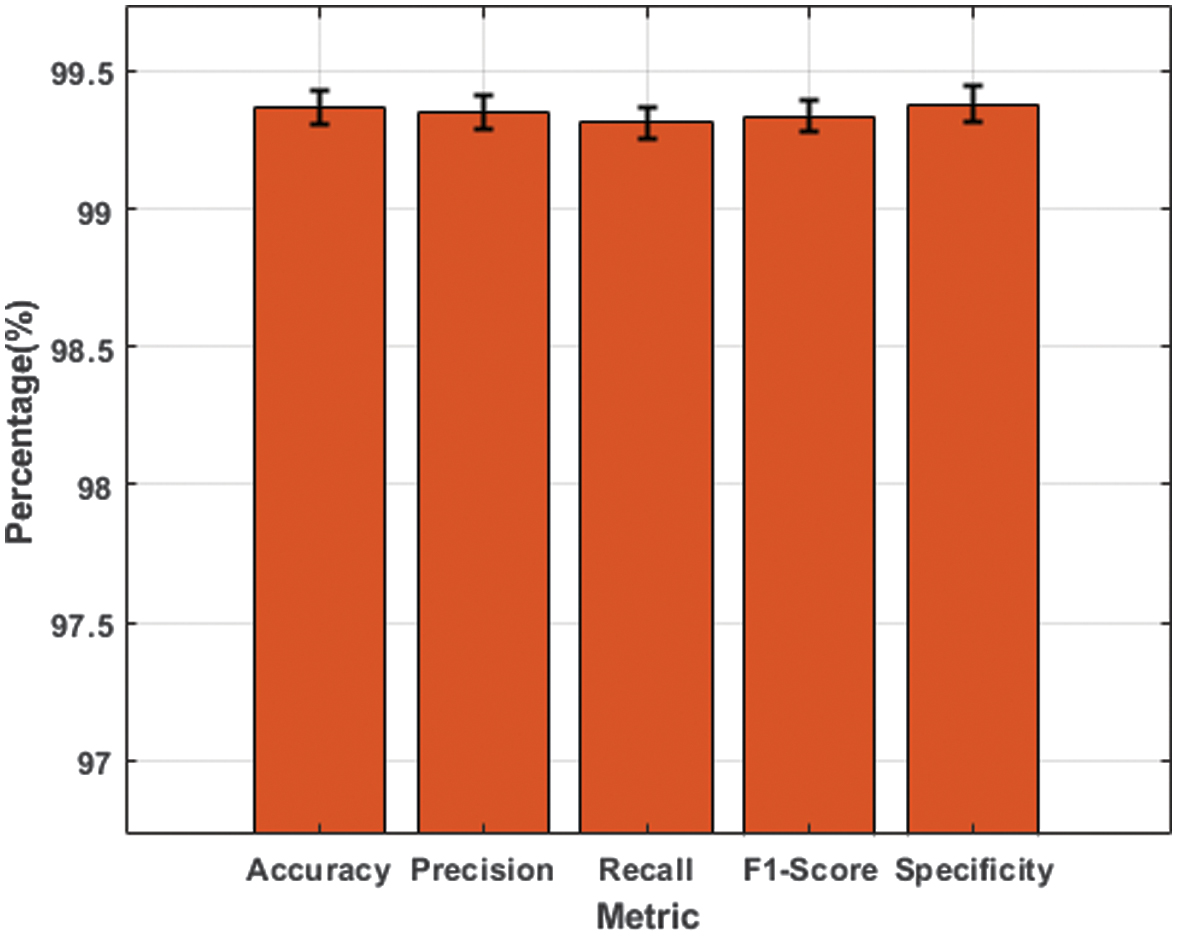 Fig. 13. Standard deviation for the PlantVillage dataset with respect to plant leaf disease classification.
Statistical analysis: Statistical evaluation provides a deeper insight into the computational efficiency and reliability of each model. The proposed MPA-KAN provides the lowest p-value of 0.0027 for the PlantVillage and 0.0011 for the apple dataset, which achieves accuracy and better statistical significance. The proposed method decreases memory usage, thereby exhibiting optimal resource utilization, minimal inference time, and floating point operations (FLOPs) compared with existing models.
The confidence interval validates the consistency of the model by maintaining high accuracy across both datasets. The outcomes of the proposed method are analyzed using statistical analysis, which improved the model’s stability and computational complexity during deployment. Figure 14 visualizes the statistical analysis of the MPA-KAN method.
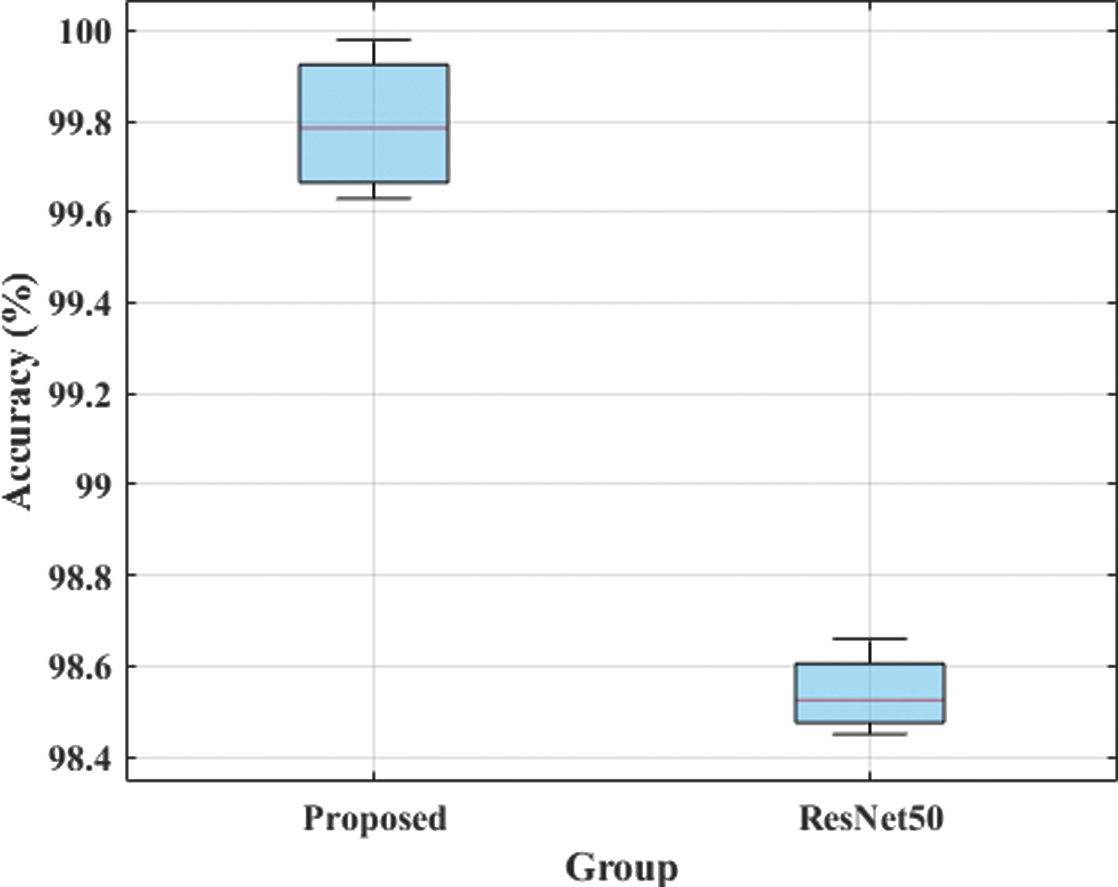 Fig. 14. Plant leaf disease dataset statistical analysis with respect to the PlantVillage dataset.
D.ABLATION STUDY
To evaluate the contribution of each component in MAP-KAN, Table XI summarizes the ablation results relative to the baseline models. The proposed model efficiently performs as an individual component, achieving better performance on the benchmark dataset. KAN individually attains 98.79%, demonstrating its ability to capture complex leaf textures, outperforming the MPA model. The combination of MPA-KAN provides robust results across hyperspectral images.
Table XI. Ablation study of the MPA-KAN with baseline models
| Method | Accuracy (%) | Precision (%) | Recall (%) | F1-score (%) |
|---|---|---|---|---|
| MPA without KAN | 96.24 | 96.34 | 95.67 | 96.43 |
| KAN without MPA | 98.79 | 97.91 | 96.62 | 97.63 |
| MPA-KAN for PlantVillage dataset | 99.98 | 99.01 | 98.98 | 98.99 |
| MPA-KAN for hyperspectral image dataset | 98.99 | 99.97 | 99.98 | 99.97 |
1).HYPERPARAMETER SETTING
The proposed model is carefully optimized to ensure efficient convergence and higher classification accuracy across all datasets. Categorical cross-entropy loss function is utilized for the training and binary classification of the PlantVillage and hyperspectral image datasets. The model used for multi-class data provides accurate discrimination for multi-class data. The developed approach is trained with a batch size of 32 over 30 epochs, which provides a balance between stable gradient updates and computational efficiency. Table XII displays the parameter settings.
Table XII. Demonstrating parameter settings
| Parameter | Value |
|---|---|
| Loss function | Binary cross-entropy for Rice Leaf Virus Subset (RLVS) and Rice Wheat Fungal (RWF), categorical cross-entropy for PlantVillage, and the hyperspectral image dataset |
| Epoch | 30 |
| Learning rate | 0.0001 |
| Batch size | 32 |
| Activation function | Softmax |
| Optimizer | Adam |
Comparative analysis for the PlantVillage dataset: The performance is evaluated by comparing several ML and DL techniques for plant disease classification. When compared methods, the MPA-KAN architecture achieves a superior accuracy of 99.98% across both the hyperspectral image and PlantVillage datasets. Conventional approaches, such as CNN [21], PDDNet [22], EfficientNet [23], and other CNN-based models, perform well but cannot surpass the adaptive feature recalibration capability of the MPA-KAN. This result emphasizes that incorporating attention-based feature refinement enhances discriminative power, leading to precise disease detection. Table XIII presents a comparative evaluation of MPA-KAN approach with traditional techniques.
Table XIII. Comparative study of MPA-KAN with conventional techniques with respect to the PlantVillage dataset
| Method | Precision (%) | F1-score (%) | Accuracy (%) | Recall (%) |
|---|---|---|---|---|
| CNN [ | NA | NA | 96.24 | NA |
| PDDNet [ | 90.9 | 91.6 | 97.79 | 92.6 |
| EfficientNet B0 [ | 97.0 | 97.8 | 99.8 | 93.6 |
| CNN [ | NA | NA | 99.8 | NA |
| MPA-KAN | 99.012 | 98.997 | 99.98 | 98.982 |
Comparative analysis for the hyperspectral image dataset: Several methods are examined to evaluate the disease identification accuracy. While existing techniques such as DNN [25], CARS [26], ResNet-50 [27], and the SVM [28] demonstrate comparative results with 99.98% accuracy, the proposed MPA-KAN model achieves high precision while significantly reducing computational complexity. This demonstrates that MPA-KAN is a more efficient alternative for real-time hyperspectral leaf disease diagnosis. This indicates that the proposed model significantly learns color variations and texture in hyperspectral image datasets, providing better classification even when the visual symptoms overlap. Table XIV presents comparative study of the proposed method with existing detection approaches.
Table XIV. Comparative analysis of the developed approach with conventional methods for the hyperspectral image dataset
| Method | Precision (%) | Accuracy (%) | F1-score (%) | Recall (%) |
|---|---|---|---|---|
| DNN [ | NA | 96.82 | NA | NA |
| CARS [ | NA | 94.44 | NA | NA |
| ResNet50 [ | 99.06 | 98.44 | 99.21 | 99.37 |
| SVM [ | NA | 93.33 | NA | NA |
| MPA-KAN | 99.97 | 98.99 | 99.97 | 99.98 |
E.DISCUSSION
The early detection of plant diseases plays an important role in improving crop quality and food security globally. Existing methods fail to accurately classify plant leaf diseases in hyperspectral image datasets into healthy, early blight, and late blight. These diseases have the greatest impact on plant health within the hyperspectral image dataset and efficiently contribute to global crop yield losses. The proposed MPA-KAN approach effectively categorizes hyperspectral image datasets by focusing on diseased regions. The proposed method restructures spatial dimensions and processes them via separate branches, improving the model’s ability to detect subtle disease edges, which are common in plant disease imagery. KAN is used to enhance the model performance in a complex environment by enhancing the efficiency of the MPA model. The proposed method helps in accurate disease classification by allowing a better representation of the intricate patterns of the leaf images. The MPA approach enables the model to capture complex patterns and increase feature extraction capabilities. The proposed MPA-KAN model attains 99.98% and 98.99 % accuracies on the PlantVillage and hyperspectral image datasets, respectively, for plant disease classification.
V.CONCLUSION
Plant disease detection and classification remained challenging because manual identification by farmers is often unreliable during the critical early stages of disease progression. Plant diseases posed various threats to the economy and productivity and caused substantial losses in agriculture, which impacted farmers’ livelihoods. In agriculture, accurate identification of plant diseases was critical for improving economic prosperity. Various pesticides and pathogens made it difficult to cultivate a maximum number of plants. However, manual examination of crop diseases is often constrained by the scarcity of human resources and inconsistent diagnostic accuracy. These difficulties were addressed using the proposed method, MPA-KAN, which helped identify plant leaf diseases in hyperspectral image datasets by capturing cross-dimensional interactions and enabling the model to focus on diseased leaf image areas to improve the sensitivity of the disease regions. The proposed method helped learn complex patterns and enhanced extraction capabilities. The proposed MPA-KAN model attained an accuracy of 99.98% for PlantVillage and 98.99% for the hyperspectral image dataset for plant disease classification. As a future work, this research will be the integration of advanced hybrid DL architectures to further improve the effectiveness of plant leaf disease classification using hyperspectral datasets. Future work will focus on reducing computational complexity via weight quantization and model pruning to decrease the parameter count and FLOPs of the proposed MPA-KAN architecture.