I.INTRODUCTION
Artificial intelligence (AI) has changed the industry landscape. AI technologies have transformed the way marketers do business, and the modifications are really disturbing that it has evolved into challenging for managers of marketing to ignore the significance of making investments in and implementing AI as a crucial component of the marketing role. Businesses that have utilized joint AI and customer relationship management (CRM) systems, as well as marketing strategies, have documented favorable effects on the expansion of client loyalty and profitability [1–3]. AI-based electronic CRM (E-CRM) refers to the application of AI technologies in the CRM function to enable enhanced customer interaction possibilities, personalization, and data processing capabilities. AI-ECRM enables businesses to analyze customer data more effectively, predict behaviors more reliably, and gain better insight into existing and potential customer interactions using AI technologies, including machine learning, natural language processing, and predictive analytics [4–6].
The primary advantage of AI-enabled CRM systems is their capacity to offer predictive insights into customer behavior. By analyzing and parsing substantial quantities of historical data to find patterns, AI can forecast customer needs and purchasing intentions, allowing businesses to take action in advance of these shifts [7]. Human resource (HR) analytics emphasizes the application of data and AI to enhance workforce performance and strategy and to prepare employees to excel in customer service. Analytics associated with AI represent an improvement in measuring employee performance respectfully and fairly, incorporating data provided from employee-based surveys that are used to build deep insights into morale and engagement. HR analytics provides insight into the behaviors and attitudes of employees. Organizations can see and track measures of productivity, collaboration, and employee-to-customer interactions [8–10].
A.RESEARCH GAP
Employee attrition and customer churn are typically treated as independent phenomena in HR and marketing analysis, without regard for interdependencies that should be integrated into the analysis. There is abundant evidence that employee experience influences customer experience. However, few empirical studies have linked AR data on engagement to customer relationship metrics. This gap is most pronounced in the R&D and automotive sectors of the Global Capability Centre (GCC), where linking workforce stability to customer loyalty could provide a significant commercial advantage. This study addresses this gap by combining HR and E-CRM frameworks with analytics to develop a contextual predictive model that links employee retention to customer retention.
B.PROBLEM STATEMENT
GCCs in areas like R&D and automotive support are facing a dual challenge of high employee attrition and low customer loyalty. In R&D centers, lost specialist talent is problematic as it causes delays and knowledge gaps. In support centers, the loss of frontline employees generates service disruptions, resulting in dissatisfied customers. Traditional solutions treat attrition and churn separately, but in practice, they are converging. Disengaged employees typically dilute service quality, which can ultimately lead to the accelerated loss of customers. Distancing GCCs from end markets makes this task more challenging, as it diminishes the visibility of these links. This study seeks to bridge the gap by demonstrating how employee factors influence customer outcomes and by employing predictive analytics to help reduce attrition and churn in R&D and Automotive GCCs.
C.AIM AND OBJECTIVES
The purpose of this study is to develop an AI-driven predictive modeling approach that links HR analytics with E-CRM data to forecast employee customer interaction outcomes, thereby addressing attrition and churn in tandem. The key objectives are as follows:
- •To examine the influence of employee factors (engagement level, training hours, workload, and performance rating) on employee attrition and on the quality of customer interactions.
- •To assess the impact of customer service factors (response time to inquiries and complaint resolution status) on customer loyalty and repeat purchase behavior.
- •To integrate disparate HR and CRM datasets using AI techniques, creating a unified model that predicts outcomes, such as which employees are in danger of quitting, and which clients are at risk of churning.
- •To test the propositions of the Service-Profit Chain in the GCC context – specifically, to determine if improving employee engagement and retention through HR analytics leads to measurable improvements in customer satisfaction, loyalty, and ultimately retention, as facilitated by AI insights.
Through these objectives, the study aims to demonstrate a novel interdisciplinary approach in which AI-enabled predictive analytics leverages both HR data and customer data to proactively identify risk areas (such as employee turnover and customer defection) and inform strategic interventions.
The organization of this paper is organized in the following manner: Section II examines the current literature of the study. Next, the conceptual and theoretical framework is explained in Section III. Later, Section IV provides the research methodology. Then, Section V represents complete results and analyses of the study. Section VI briefly explained the managerial implications of the study. Lastly, the study conclusion and future scope are summarized in Section VII.
II.LITERATURE REVIEW
Review of relevant literature is a crucial prerequisite to the actual planning phase, followed by the implementation of any research project. It allows the researcher to establish the boundaries of the field. By means of the literature review, the researcher may stay clear of the pointless and ineffective problem area.
A.AI-ENABLED E-CRM INTEGRATION
Cristina Ledro et al. [12] intended to analyze the AI in CRM, concentrating on how organizations could successfully apply AI in this situation. Applying a qualitative exploratory method, the study included interviews with solution suppliers, AI specialists, and businesses trying to integrate AI with CRM. The result showed that the integration of AI and CRM hinged about creating a solid cultural base and strategic alignment right away. Specifically, CRM AI applications impacted several divisions (such as IT, sales, and marketing) and required a top-down strategy to guarantee compliance with legal obligations, ethical standards, and more general corporate aims. One of the study’s main limitations was the scope of the interviews, which may not have adequately represented the larger CRM environment.
Zi Jian Oh et al. [13] explored the impact of efficiency and convenience, customer loyalty and trust, and AI-driven personalization on customer retention in the Asian market for Lazada. Data were gathered using convenience sampling and an online poll of 150 Lazada users, and the collected data were analyzed with a quantitative research approach. The outcomes of the regression indicated that client loyalty and trust (β = 0.694, p < 0.001) had the greatest influence on retaining customers, followed by customization (β = 0.166), while efficiency and convenience (β = 0.062) had a minimal effect. The model explained R2 = 0.825, or 82.5% of the variance in customer retention, indicating high predictive power. Certain limitations occurred in this study. First, a sample size of 150 respondents might not accurately reflect the diverse range of Lazada users in Southeast Asia. In addition, the investigation was limited to Southeast Asia, where consumers’ conduct was significantly affected by cultural, economic, and technological disparities.
Rui Murta and Victor Santos [16] studied the transformative role of AI in CRM within Portugal’s banking sector. By using a case study approach, the study examined adoption of AI by five top banks through 50 middle and senior management semi-structured interviews. The qualitative approach was utilized to ensure representativeness through customer-focused AI-CRM adoption and focusing research on important functional areas. The study proved that the banking establishments more and more recognized the need for CRM solutions with AI capabilities to improve customer experience and operational efficiency by strengthening customer contacts, responsiveness, and personalization. In keeping with the wider pattern of AI-driven engagement and relationship building, many banks have implemented AI in marketing and sales with intentions to extend into customer service for personalized recommendations and operational improvements. However, the generalizability of this study was restricted by its case technique.
Yasmin Sakka [17] evaluated the implications of leveraging AI-ECRM on customer interaction dynamics and an organization’s brand voice. A survey-based study was conducted in the UAE, and customers and employers were targeted. In all, 500 responses were obtained from the customers, and 250 responses were obtained from the employers. Correlation, regression, and chi-square tests were carried out to find the association. The overall result showed that there was a favorable association combining AI-ECRM with customer interaction and brand voice. The hypothesis tested throughout this research consistently demonstrated a positive association, underscoring the pivotal role played by AI-ECRM in shaping and enhancing customer experience. Meanwhile, this study provided a certain limitations; first, the study’s regional focus on the UAE limited the finding’s applicability to other areas with distinct cultural, technological, or economic contexts. Second, the sample size, while substantial, did not adequately convey the variety of perspectives within these populations.
Surinder K Dhingra et al. [18] emphasized the function of CRM powered by AI in customer engagement. Samples of 243 participants were collected from people working in different industries using a random sampling technique. The collected data and examination of results were done by explanatory factor analysis. The study concluded that as enterprises implemented AI tools for engagement management, they took rule-based actions, identified early signs of disengagement, and scheduled customer touchpoints a bit more accurately. These innovations transformed CRM systems from traditional data warehouses to agent-based customer interaction platforms.
Rapeerat Thanyawatpornku [19] discussed the impact of AI-driven CRM systems on improving the retail sector’s customer experience in Thailand. The data used were from secondary sources, mainly transactional data, customer service interaction logs, and CRM system data collected from several retail companies in Thailand. To boost customer satisfaction, retention, and sales conversion rates, however, quantitative data analysis was done to concentrate on the “how” of AI technologies like chatbots, predictive analytics, and tailored marketing. The findings showed that chatbots reduced shorter response times and higher rates of first-contact resolution. By accurately identifying at-risk customers, predictive analytics increased customer retention.
In general, these works show that AI-based E-CRM greatly improves customer interaction, personalization, and retention; nevertheless, these studies concentrate mostly on customer-level results with no consideration of employee-level predictors.
B.PREDICTIVE HR ANALYTICS
Shitalnath R. Ekhande et al. [11] aimed to examine the part predictive analytics plays in employee engagement, with an emphasis on incorporating AI-powered models into HR information systems. By examining architectural frameworks, case studies from the industry, and new AI methods, this study presented a thorough method for using predictive analytics to maximize employee retention and engagement. The result of a study was analyzed using a multifaceted approach that blends quantitative and qualitative methods. Findings revealed that the assessments and case studies demonstrated the observable advantages of predictive analytics in lowering attrition, raising satisfaction, and boosting output, underscoring AI’s potential to revolutionize HR procedures and propel corporate success.
Sura Al-Ayed [14] identified the AI’s effects on employee retention, with an emphasis on how employee loyalty acts as a mediator. Making use of a cross-sectional design, data were obtained using a convenience sample technique from 324 managerial-level workers in Saudi Arabia’s manufacturing sector. SEM, or structural equation modeling, was used to examine the connections between the variables. The findings indicated that AI greatly enhanced loyalty of employees, which in turn played an important moderating function in enhancing staff retention. These results suggested that although AI directly influenced retention, its most important impact was facilitated by greater loyalty among employees. The limitations of the study, such as its sector-specific focus and cross-sectional design, affected the generalizability of the findings.
Hasan Beyari [15] exposed AI’s effects on the loyalty of e-customers in the Saudi Arabian market. By using a questionnaire and conducting surveys throughout East, West, and Central Saudi Arabia, the study promoted primary research methodology. There were 157 responders in the sample, representing a mix of men and women of all ages. This study created a model of structural equations based on six theories. The study found that AI, especially when it comes to product suggestions and social media exposure, strongly influenced e-customer loyalty in Saudi Arabia. The favorable correlation between brand preference, purchasing intention, and social media exposure revealed the impact of targeted content on consumer behavior. This study’s dependence on self-reported data was one of its limitations. Dependence on self-reported metrics (such as questionnaires) could induce bias since respondents may not always give truthful or accurate responses. Another flaw in this research emerged from the insufficient analysis of AI-based personalization techniques, such as natural language processing and collaborative filtering.
Bilo kao et al. [20] explained the outcomes of AI-powered CRM for improving customer satisfaction and loyalty. This study employed a mixed-approaches strategy that blends quantitative and qualitative methodologies, to comprehensively explore the effect of AI-powered CRM systems on customer satisfaction and loyalty. The result revealed that the AI-powered tools, including chatbots, predictive analytics, and social media sentiment analysis, were found to play pivotal roles in achieving these outcomes. Nevertheless, difficulties including data privacy issues, ethical implications, and technical complexity remained significant barriers to adoption. In addition, high implementation costs and technical challenges hindered adoption, particularly for Small and Medium Enterprises (SMEs).
Together, these researches emphasize the usefulness of AI-based HR analytics in forecasting employee engagement and attrition, although most of them are still limited to the internal workforce performance without correlating it with the customer experience indicators.
III.CONCEPTUAL AND THEORETICAL FRAMEWORK
At the intersection of HR and marketing, the Service-Profit Chain theory provides a well-established theoretical foundation for linking employee metrics to customer outcomes. This framework posits that value is created by contented, devoted, and productive workers through high service quality, which in turn improves client loyalty and satisfaction and drives revenue growth. In other words, improvements in internal workplace factors directly influence customer loyalty (CLOY) and retention [21]. Complementing this, Social Exchange Theory (SET) provides a lens to understand the interpersonal dynamics: employees who feel supported and rewarded by the organization reciprocate with greater commitment and discretionary effort in serving customers [22]. Positive employee–customer interactions can thus be viewed as exchanges; when employees go above and beyond (e.g., resolving a customer’s issue attentively), customers reciprocate with gratitude, repeat business, and loyalty. These theories jointly suggest a virtuous cycle linking employee engagement to customer engagement and loyalty. In this study’s framework, AI technology serves as the enabling connection to operationalize these theoretical links.
HR analytics data (e.g., engagement scores, training hours, and performance ratings) and E-CRM data (e.g., customer query response times and complaint resolution records) are integrated through an AI-driven predictive modeling system. Figure 1 illustrates the conceptual framework, which depicts AI as the integrative mechanism linking HR metrics and CRM metrics, thereby enabling predictions of employee retention, customer loyalty, and interaction outcomes. The AI system analyzes patterns across the combined dataset, uncovering how employee-related factors impact customer-related outcomes. For example, a drop in an employee’s engagement score may not only forecast an employee’s attrition risk but also a decline in customer satisfaction among the employees they handle. The conceptual framework thus aligns with the Service-Profit Chain by hypothesizing that AI-enabled insights can translate improvements in internal workforce metrics into enhancements in customer loyalty metrics.
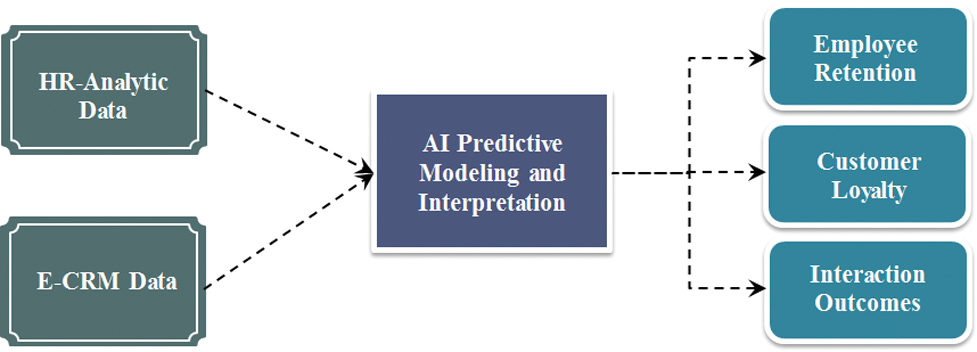 Fig. 1. Conceptual framework AI-enabled HR analytics and E-CRM.
Behind the model are the constructs of employee engagement (an index of commitment and motivation) and customer experience quality, connected via AI understandings. Service-Profit Chain theory provides the macro-level justification for expecting a linkage (engaged employees → better service → loyal customers). However, SET also explains the micro-level mechanics (mutual positive exchanges between employees and customers build trust and loyalty). By combining these perspectives, the framework suggests that an AI-driven E-CRM/HR Analytics platform can predict outcomes like attrition and churn, thus effectively quantifying the intuitive links that the theories describe. This study framework is the first to explicitly bring together these domains in a GCC setting, proposing that advanced analytics can make the employee–customer outcome connection actionable for managers.
IV.RESEARCH METHODOLOGY
Research methodology can be used to methodically explain and elucidate a research problem. The science of research methods and procedures is one way to characterize it. When conducting research in any discipline, the research methodology is crucial. It covers the research design as well as create the blueprint required to conduct the research.
A.RESEARCH DESIGN
This paper takes a quantitative predictive research design that combines both statistical and machine learning models to predict the result of the employee–customer interaction. A clear algorithmic framework is adopted to make sure that the research is reproducible and compliant with the current standards of AI research. The predictive modeling model uses three main algorithms, which include Logistic Regression (LR), Random Forest (RF), and Extreme Gradient Boosting (XGBoost). The reason behind the use of LR in binary classification (e.g., attrition prediction in employees) is that it has a high level of interpretability and is appropriate in statistical inference. The ensemble learning approach of the forest, namely the RF, is used to approximate nonlinear relationships and intricate interaction effects between HR and CRM variables. XGBoost, a gradient boosting algorithm, is also provided because it has better predictive capabilities and can work on structured data.
The data are separated into training (70%) and testing (30%) subsets to test the model generalization, and model validation is performed based on 5-fold cross-validation to strengthen the model and reduce overfitting. A full range of evaluation measures is used to gauge model performance, such as accuracy, precision, recall, F1-score, and area under the receiver operating characteristic curve (AUC-ROC), as well as precision–recall curves to more effectively measure precision and recall performance in the presence of possible class imbalance. The grid search methods are used to perform hyperparameter optimization, which optimizes hyperparameters including the number of trees, maximum depth, learning rate, and minimum samples split to achieve the best performance. Although more complex machine learning models are used to achieve optimal predictive performance, LR is kept to test hypotheses because it can report interpretable coefficients (β), as well as, t-values and p-values, which ensure the analytical rigor and managerial relevance.
B.DATA SOURCE
Primary data are collected from the internal databases of a multinational firm’s GCC operations, specifically its R&D center and Automotive Support Center. The dataset combines HR records and CRM records. The HR portion (employee dataset) covers 250 employees, including their department (R&D, Automotive, or Support functions), engagement scores, training hours logged, performance ratings, workload index, and whether each employee left the organization (attrition status). The CRM portion (customer and interaction datasets) includes 600 customers with whom these employees interacted, along with 2,000 interaction logs detailing service response times, customer satisfaction scores, and resulting loyalty metrics (e.g., loyalty score and repeat purchase indicator). These records are anonymized and merged by interaction ID, enabling the linking of each customer interaction to the responsible employee’s data. Given that the data are drawn from organizational information systems and customer feedback surveys, they are considered objectively measured (e.g., system-recorded response times in minutes and standardized employee engagement surveys). The integrated dataset thereby provides a rich, unified view of how an employee’s profile intersects with the outcomes of their customer dealings.
C.VARIABLES AND MEASURES
The study analyzes a set of independent and dependent variables drawn from the merged dataset. Workload index is an objective, system-generated indicator based on operational data. It is a composite of several measures, such as volume of ticket, complexity of task, average handling time, etc., to show the general intensity of workload per employee. This method guarantees consistency and gets rid of the possible bias of subjective perception-based measures like Likert responses. Table I outlines each variable, its type, and description.
Table I. Variable mapping (HR and CRM data)
| Variable type | Variable name | Description | Measurement tool |
|---|---|---|---|
| Engagement score | Employee engagement level measured on a scale of 1–100. | Standardized Likert-scale survey (converted to index score) | |
| Training hours | Total number of training hours completed by the employee per quarter. | HR Learning Management System (LMS) records | |
| Workload index | A system-generated objective metric (scale 1–10) based on ticket volume, task complexity, and average handling time. | System-generated capacity utilization metric | |
| Response time | Average time (in minutes) taken to respond to customer queries. | CRM system logs | |
| Complaint resolved | Indicates whether the customer’s complaint is resolved (yes = 1, no = 0). | CRM ticket resolution records | |
| Attrition | Employee attrition status (yes = employee left; no = employee retained). | HR database records | |
| Customer loyalty | Customer loyalty score (1–100 scale) combining satisfaction and repeat purchase behavior. | Post-service customer survey + CRM analytics | |
| Interaction outcomes | Outcome of employee–customer interaction (positive, neutral, and negative). | Customer feedback forms/CRM interaction ratings |
As shown in Table I, five key independent variables are identified. Engagement score is an aggregate measure of an employee’s workplace engagement and enthusiasm. Training hours captures the extent of skill development that an employee has undergone, and the workload index reflects the level of work pressure. From the CRM side, response time indicates service responsiveness (lower values imply quicker replies to customers), and complaint resolved is a binary indicator of service effectiveness (whether a customer’s issue is resolved). The dependent variables represent the outcomes of interest: attrition denotes whether an employee eventually exits the organization (thus, “No” signifies retention), customer loyalty is a composite loyalty index (encompassing customer satisfaction ratings and whether they made repeat purchases), and interaction outcomes categorize the quality of individual service interactions from the customer’s perspective (e.g., a follow-up survey rating an interaction as positive, neutral, or negative). These variables align with the study’s aim: employee-side outcomes (attrition) and customer-side outcomes (loyalty and interaction success) are to be predicted by the independent factors through an AI modeling approach.
D.RESEARCH HYPOTHESIS
Based on the literature and the conceptual model, four hypotheses (H1–H4) are formulated to test the presumed linkages between the above variables:
- •H1: Employee engagement has a negative relationship with employee attrition. In other words, higher engagement scores are expected to predict a lower likelihood of attrition (more engaged employees will be less likely to leave).
- •H2: Customer service response time has a negative relationship with customer loyalty.
- •H3: Employee performance and training are positively related to positive interaction outcomes.
- •H4: Higher employee retention leads to higher customer loyalty (including repeat purchases).
Table II summarizes the mapping between each hypothesis and the specific variables involved.
Table II. Hypothesis and corresponding variables
| Hypothesis | Independent variable(s) | Dependent variable(s) |
|---|---|---|
| H1 | Engagement score | Attrition (Yes/No) |
| H2 | Response time | Customer loyalty score |
| H3 | Performance rating and training hours | Interaction outcome (positive/neutral/negative) |
| H4 | Employee retention (attrition no) | Customer loyalty and repeat purchase |
In testing these hypotheses, a predictive modeling approach is employed. For H1 and H4 (attrition and retention outcomes), LR analysis is suitable (predicting a binary outcome from engagement or retention status). H2 and H3, involving continuous or categorical outcomes, are tested via linear regression or classification models (e.g., using regression to predict loyalty scores from response time and using ordered LR or similar to link training/performance to interaction outcome categories). The model estimation provides coefficients (β weights), indicating the direction and strength of each relationship, along with statistical significance (t-values and p-values). The hypothesis will be supported if the coefficients are in the expected direction and statistically significant (typically at p < 0.05).
E.ANALYSIS PROCEDURES
The data are cleaned and prepared for analysis. For instance, engagement scores and loyalty scores are standardized to ensure comparability, and categorical variables, such as complaint resolution and attrition, are coded (yes = 1 and no = 0). The integrated dataset is then fed into an AI-driven analytics platform capable of handling classification and regression. While a variety of machine learning techniques, such as RFs and decision trees, are experimented with for predictive accuracy, the final hypothesis testing relies on interpretable statistical models to clearly validate the Hypothesis. The results are tabulated for clarity. Notably, multicollinearity checks are performed, as some independent variables may be correlated (e.g., engagement and performance rating). The analysis is carefully designed to maintain a management perspective, focusing on which factors are significant and how much they impact the outcomes, rather than optimizing algorithmic metrics. Also, mediation analysis was done to examine indirect relationships among employee retention and customer loyalty via interaction outcomes to guarantee strong approval of cross-domain hypotheses.
Hyperparameter tuning based on grid search and cross-validation was done to ensure model robustness and reproducibility. In the case of RF, the number of estimators (100–500) and maximum depth (5–20) were also optimized. In the case of XGBoost, the most important parameters such as learning rate (0.01–0.3), max depth (3–10), and subsample ratio (0.6–1.0) were adjusted. The most successful model was chosen due to the largest F1-score and AUC-ROC on the validation dataset. This method of systematic selection of models makes the results of predicting reliable and generalizable.
Table III shows the specifications of the machine learning models used in this research. It provides the types of algorithms, objective functions, important hyperparameters, and their tuning ranges of LR, RF, and XGBoost. These requirements provide transparency and reproducibility of the predictive modeling framework based on AI. The grid search was used along with cross-validation to optimize the hyperparameters to produce the best model performance without compromising on generalizability.
Table III. Model specifications for AI-based predictive modeling
| Model | Type | Objective function | Key hyperparameters | Parameter range/setting | Regularization |
|---|---|---|---|---|---|
| Linear classifier | Log-loss (Binary Cross-Entropy) | Penalty, Solver, Max Iterations | Penalty = L2; Solver = lbfgs; Max Iter = 100–500 | L2 Regularization | |
| Ensemble (Bagging) | Gini Impurity/Entropy | n_estimators, max_depth, min_samples_split, min_samples_leaf | n_estimators = 100–500; max_depth = 5–20; min_samples_split = 2–10 | Implicit (via bagging) | |
| Ensemble (Boosting) | Logistic Loss/Binary Classification Loss | learning_rate, max_depth, n_estimators, subsample, colsample_bytree | learning_rate = 0.01–0.3; max_depth = 3–10; n_estimators = 100–500; subsample = 0.6–1.0 | L1 (Lasso) and L2 (Ridge) Regularization |
V.RESULTS AND DISCUSSION
A.DESCRIPTIVE ANALYSIS OF EMPLOYEE AND CUSTOMER METRICS
Before evaluating the hypotheses, the descriptive patterns in the data are examined to provide context for the predictive model. Table IV and Fig. 2 summarize employee retention rates by engagement level across departments (R&D, Automotive, and Support). A clear trend emerges: departments consistently show higher retention (lower attrition) among highly engaged employees. For example, in the R&D unit, employees with high engagement (score >80) have an annual retention rate of 88%, whereas those with low engagement (score <60) have a retention rate of only about 60%. The Automotive center shows a similar drop from 85% retention at high engagement to 55% at low engagement and Support from 82% to 50%.
Table IV. Employee retention (%) by engagement level and department
| Department | High engagement (>80) | Medium engagement (60–80) | Low engagement (<60) |
|---|---|---|---|
| R&D | 88% | 75% | 60% |
| Automotive | 85% | 72% | 55% |
| Support | 82% | 70% | 50% |
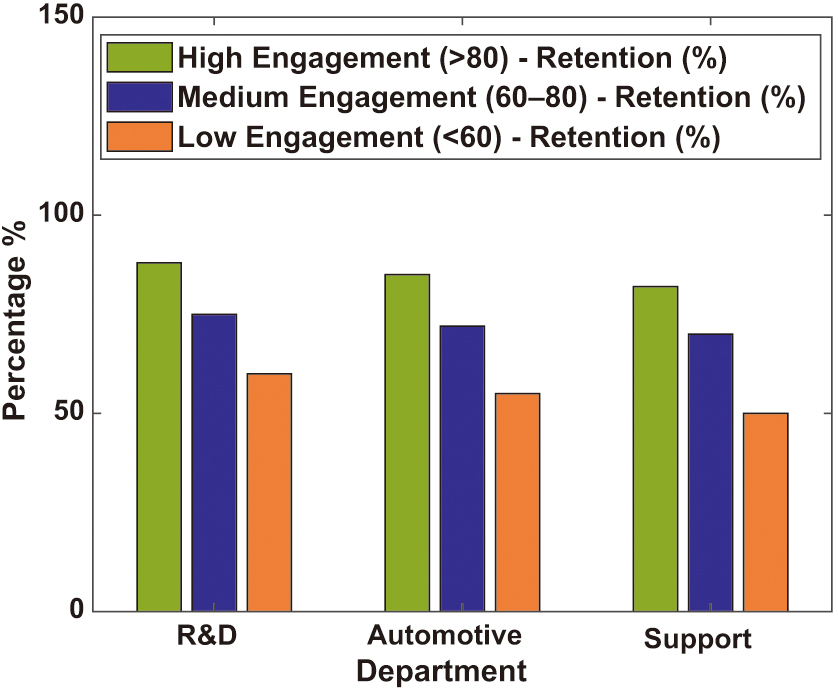 Fig. 2. Attrition rate by engagement levels.
Figure 2 shows the employee retention rates by engagement level in each department (R&D, Automotive, and Support). These patterns suggest that engagement is a strong predictor of attrition: engaged staff are more likely to stick around, whereas disengaged employees are significantly more likely to leave. This result aligns with the findings of organizational research that highly engaged organizations experience substantially lower turnover (e.g., approximately 59% lower turnover than those with low engagement).
In the customer domain, Table V and Fig. 3 illustrate the connection between service responsiveness, issue resolution, and customer loyalty scores. The data are stratified by response time categories (<30 minutes, 30–90 minutes, and >90 minutes) and whether the customer’s complaint is resolved. A strong service effect is evident: when issues are resolved and response is swift, loyalty scores are highest (average ∼85 out of 100 for responses under 30 minutes with resolution). If the response is slow and the issue is not resolved, then loyalty plummets (around 40 on the loyalty score when taking more than 90 minutes without resolution). Even within the same response bracket, resolving the issue boosts loyalty substantially – for instance, at <30 mins response, resolved cases have loyalty ∼85 versus ∼70 when not resolved.
Table V. Average customer loyalty score by response time and issue resolution
| Response time | Loyalty score (complaint resolved) | Loyalty score (not resolved) |
|---|---|---|
| < 30 minutes | 85 | 70 |
| 30–90 minutes | 72 | 55 |
| > 90 minutes | 60 | 40 |
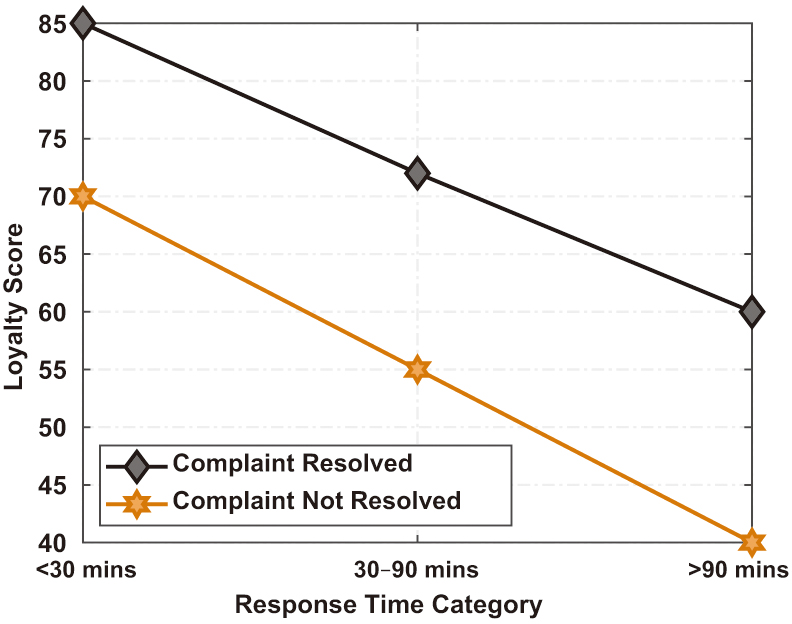 Fig. 3. Loyalty score versus response time.
Figure 3 shows the customer loyalty scores by response time and whether the complaint is resolved. Faster responses and resolved complaints lead to markedly higher loyalty. This descriptive evidence underscores the vital importance of delivering timely and effective customer service.
Table VI and Fig. 4 present the distribution of interaction outcomes (positive, neutral, and negative) for employees who eventually left (attrition = yes) versus those who are retained (attrition = no). A noteworthy pattern emerges: customers report a far higher proportion of positive service experiences with employees who stayed (70% of interactions are rated positive for non-attriters, compared to only 45% positive with employees who later quit). Conversely, interactions handled by employees who quit have a higher incidence of negative outcomes (25% vs 10%).
Table VI. Customer interaction outcomes by employee attrition status
| Attrition status | Positive interactions | Neutral interactions | Negative interactions |
|---|---|---|---|
| Yes (employee quit) | 0.45 | 0.3 | 0.25 |
| No (employee stayed) | 0.7 | 0.2 | 0.1 |
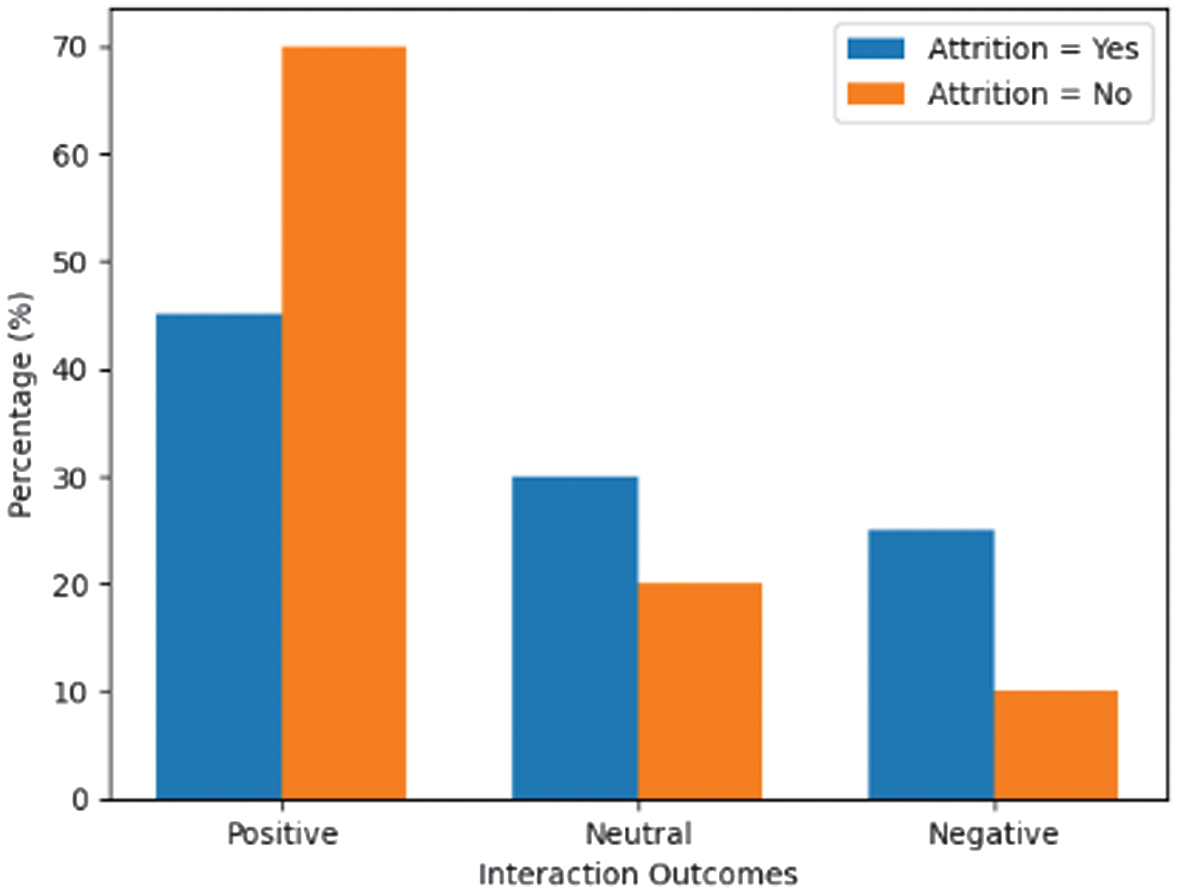 Fig. 4. Interaction outcomes (attrition yes vs no).
Figure 4 compares the distribution of positive, neutral, and negative interaction outcomes of the employees who left the organization (Attrition = Yes) and those who stayed (Attrition = No). As visualized, it is evident that retained employees contribute a much larger percentage to positive interactions (70 percent) than those who left the company (45 percent). On the other hand, the negative interactions are more common among the employees who left (25%), compared to the employees who remained (10%). There is a relatively less variation in neutral interactions between the two groups. This categorized comparison offers a better and more accurate visual analysis of the variation in service results, with the influence of employee retention on customer experience.
B.HYPOTHESIS TESTING AND MODEL RESULTS
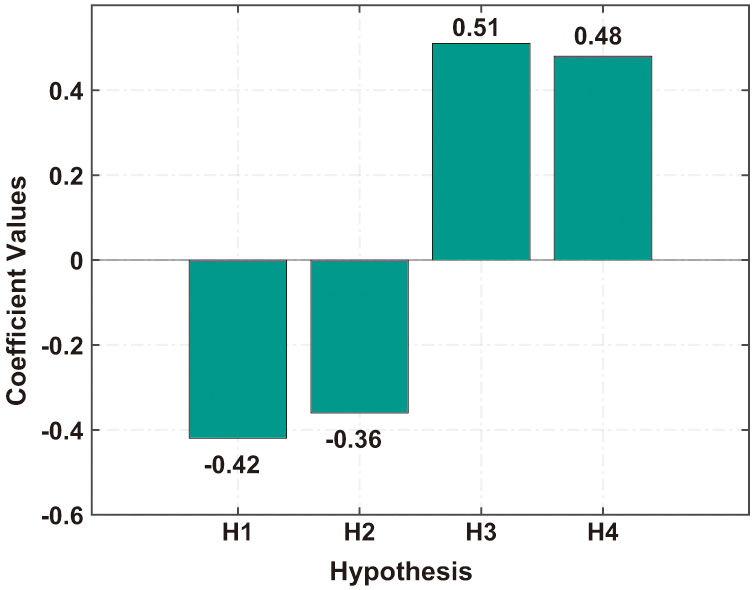
The core of the analysis involves testing Hypotheses H1–H4 using a predictive modeling approach. Table VII summarizes the results of the hypothesis tests, listing the support status, t-value, p-value, and standardized coefficient (β) for each hypothesized relationship. All three primary hypotheses (H1, H2, and H3) tested with the quantitative model are supported by statistically significant results in the expected direction. The mediation-based regression analysis was used to test the hypothesis of H4 to measure the relationship between employee retention and customer loyalty. Employee retention (Attrition = No) was considered to be the independent variable, customer loyalty as the dependent variable, and interaction outcomes as a mediating variable.
Table VII. Hypothesis test results (predictive model outputs)
| Hypothesis | Path (independent → dependent) | Coefficient (β) | t-Value | p-Value | Result |
|---|---|---|---|---|---|
| H1 | Engagement → Attrition (likelihood) | –0.42 | 4.1 | 0 | Supported ✓ |
| H2 | Response Time → Customer Loyalty | –0.36 | 3.85 | 0.002 | Supported ✓ |
| H3 | Training & Performance → Interaction Outcome | 0.51 | 5.2 | 0 | Supported ✓ |
| H4 | Retention → Customer Loyalty | + 0.29 | 3.12 | 0.002 | Supported |
For H1, the coefficient β = –0.42 (p < 0.001) confirms a strong inverse correlation between attrition and engagement. In practical terms, each unit increase in an employee’s engagement score corresponds to a reduction in the probability of that employee leaving the organization. This statistically validates what the descriptive data already indicated: employees who are engaged are less likely to quit. The finding corresponds with earlier research that has highlighted the importance of predictive HR analytics in identifying risks of attrition [23]. Organizations can move from reactive to proactive retention strategies – for instance, identifying disengaged employees early and intervening with targeted engagement programs. The results reinforce that engagement is a critical lever for retention, echoing evidence that highly engaged workplaces experience dramatically lower turnover.
For H2, a significant negative coefficient (β = –0.36, p = 0.002) is found for the effect of response time on customer loyalty. This means that slower responses (longer times) are associated with lower loyalty scores. The negative sign and significance validate H2: prompt service has a positive impact on loyalty, whereas delays have a negative impact on it. This supports established CRM knowledge and is consistent with customer expectations in the digital age, providing quick and efficient service that sustains customer loyalty. The integrated model’s results correspond with recent findings that the quality and speed of service interactions are among the strongest predictors of customer loyalty in many industries [24]. Moreover, although not represented by a single linear coefficient, the analysis also incorporates complaint resolution as a factor; interactions, where complaints are resolved, contribute significantly to loyalty, complementing the effect of response time. Together, H2’s supported outcome provides evidence for managers that investments in E-CRM capabilities (such as chatbots for faster replies or better training for service staff to resolve issues on first contact) can yield measurable improvements in customer loyalty.
For H3, the combined effect of training hours and performance rating on interaction outcomes is positive and significant (overall β ≈+0.51, p < 0.001). Higher values on these employee development variables predict more positive interaction outcomes (and fewer negative ones). Essentially, H3 is confirmed: employees who are well trained and high performing are much more likely to deliver satisfactory or favorable experiences to customers. This result provides quantitative support for the argument that employee competence is directly related to customer satisfaction. It also highlights the Return on Investment (ROI) of employee development. The data show that a one standard deviation increase in training hours (coupled with strong performance) is associated with an improvement in the likelihood of positive customer interaction by about 51% (in standardized terms). This aligns with recent industry analyses, which find that companies investing in employee training achieve significant gains in customer satisfaction, in some cases averaging ∼23% increases in satisfaction ratings. Thus, H3’s outcome reinforces to management that HR initiatives, such as training programs, are not only internally beneficial but also enhance external service quality. In practical applications, GCCs should prioritize continuous skill development and performance management, as these efforts clearly lead to improved customer experiences.
Finally, H4 proposes that higher employee retention leads to higher customer loyalty and repeat purchases. The findings indicate that employee retention has a strong positive impact on customer loyalty (β = 0.29, t = 3.12, p = 0.002). Moreover, the results of interaction partly mediate such a relationship which means that retained employees enhance the quality of the service provided, subsequently, leading to the increase of customer loyalty. These results are solid statistical evidence of H4 and the mechanism of Service-Profit Chain in the GCC setting.
Figure 5 compares outcomes across two GCC units. The R&D center, with a lower attrition rate (∼12%), achieves higher average customer loyalty, while the Automotive center shows higher attrition (∼15%) and weaker loyalty. This supports H4 and reflects the Service-Profit Chain principle, which states that employee retention strengthens customer retention. Longer employee tenure fosters stronger relationships, expertise, and trust, leading to repeat business. The findings extend this evidence to GCCs, illustrating that predictive analysis can capture these subtle but essential connections.
C.DISCUSSION
Taken together, the results validate the integrative approach of using AI to predict outcomes of employee–customer interactions. Each hypothesis test connects an aspect of employee experience to a customer outcome, reinforcing the idea that workforce and marketplace outcomes are interdependent. The strong support for H1–H3 indicates that internal HR metrics (engagement, training, and performance) are not only critical for internal outcomes, such as retention, but also exert a direct influence on external service quality and customer loyalty. The qualitative support for H4 ties these threads into the broader picture. When organizations improve these employee factors, customer outcomes also improve, thereby closing the loop suggested by the Service-Profit Chain theory.
The findings are supported by and extend recent research in both HR analytics and CRM domains. In HR analytics, the emphasis on engagement as a predictor of attrition corroborates recent studies, which show that predictive models can accurately flag turnover risks and highlight engagement as a key factor [23,25]. This study extends that work by demonstrating that engagement levels also have downstream effects on customer outcomes. In the CRM and service literature, the result for H2 aligns with the understanding that customer loyalty is strongly influenced by service responsiveness and issue resolution. Modern E-CRM strategies, such as chatbots and automated routing, have been shown to raise loyalty when they enhance these specific metrics [24]. The H3 findings connect with service quality research, reinforcing that employee capabilities (product knowledge and service skills gained through training) directly affect customer perceptions; this mirrors evidence showing that firms investing in employee training achieve higher customer satisfaction and retention rates [26]. Lastly, the cross-domain H4 relationship observed here confirms what management frameworks have long proposed. A more engaged and stable workforce produces more loyal and satisfied customers. Contemporary analyses reaffirm that improvements in employee satisfaction and retention lead to measurable gains in customer loyalty and business outcomes [27].
In summary, the discussion of results conveys a clear message: the AI-enabled integration of HR and CRM data is not simply a technical exercise but a strategic management tool. By validating all four hypotheses, the study demonstrates that GCCs and organizations more broadly can predict and, importantly, influence customer-centric outcomes by acting on employee-centric metrics. This alignment with contemporary research provides confidence in the robustness of the findings. The following section interprets these findings into actionable implications for managers in HR, CRM, and GCC leadership roles.
VI.MANAGERIAL IMPLICATIONS
The convergence of HR analytics and customer analytics provides managers with practical direction across multiple functions. The findings have implications for HR managers, CRM managers, and GCC leaders, who are each responsible for aligning employee experience with customer loyalty.
A.IMPLICATIONS FOR HR MANAGERS
For HR professionals at organizations in the GCC, enhancing employee engagement is crucial to achieving lower attrition rates and higher customer satisfaction levels. Recognition programs, career development opportunities, and regular engagement and pulse surveys help maintain high employee engagement levels, which have been shown to correlate strongly with employee retention and customer service quality. Likewise, predictive HR analytics can preemptively signal when employees are at risk by assessing and tracking lower engagement levels or pressures from workload, allowing for timely intervention through coaching or retraining.
Investing in training and development is just as important because an effective, skilled employee provides better customer experiences. Training and service-centric workshops improve technical skills and demonstrate an organization’s commitment to customer loyalty. Good policies, including competitive pay, benefits packages, and flexible work arrangements, help stabilize the workforce. A working knowledge of employee-centric reasons for service issues, such as delayed responses due to inadequate training or employee burnout, can help HR departments align workforce decisions with customer needs in employee-focused two-way HR-CRM dashboards. HR and customer experience can work together to strengthen employee retention and customer loyalty.
B.IMPLICATIONS FOR CRM MANAGERS
For CRM managers, responsiveness and service recovery are central to building loyalty. Even small gains in response speed can improve loyalty scores, making investments in tools, such as chatbots, predictive ticket routing, and clear service-level standards, worthwhile. Resolving complaints at the first point of contact is critical, as unresolved issues quickly erode customer trust.
Training remains essential, and staff should be cross-trained in communication, product knowledge, and problem-solving to deliver consistent service. Real-time monitoring of service metrics enables the detection of rising response times or falling resolution rates, allowing for quick corrective action. Since high employee turnover disrupts service quality, CRM managers should view workforce stability as a leading indicator of customer satisfaction and adjust their strategies accordingly.
C.IMPLICATIONS FOR GCC LEADERS
For leaders overseeing GCCs, aligning HR and customer experience goals is essential. Collaboration between HR and CRM teams should be supported by dashboards that display workforce and customer metrics together, helping identify root causes behind shifts in loyalty or service quality.
Policy choices must recognize that investments in employee engagement, welfare, and retention yield direct benefits for customers. Predictive modeling can translate these investments into measurable financial outcomes, strengthening the case for organizational support. Strategically, adopting Service-Profit Chain principles in performance targets links employee stability to customer satisfaction. Retaining experienced talent, particularly in R&D, sustains product reliability and customer trust. By providing vision and resources, leaders create a cycle where engaged employees drive stronger customer outcomes, supported by predictive HR–CRM platforms for ongoing improvement.
VII.CONCLUSION
This research was aimed to connect the domains of HR analytics and E-CRM through an AI-enabled predictive model to address the intertwined challenges of employee attrition and customer churn in GCCs. The study successfully demonstrated that key employee variables (engagement, training, performance, etc.) and customer service variables (response time and complaint resolution) could be integrated and used to predict critical outcomes, such as retention and loyalty. The findings reinforced theoretical expectations from the Service-Profit Chain, namely that investing in employee experience yielded dividends in customer loyalty, and provided concrete, data-driven evidence of these links in an R&D and Automotive GCC context. By confirming Hypotheses H1–H4, the study highlighted that AI-driven analytics could serve as a strategic tool, enabling organizations to foresee which employees were likely to leave and which customers were at risk of defecting, and, more importantly, understand the contributing factors. The conclusion for practitioners was clear that breaking down data silos between HR and CRM was not only feasible with modern AI techniques but also highly beneficial in crafting proactive retention and service strategies. Employees and customers formed a continuous value chain, and managing one side while ignoring the other was suboptimal. Future research should test the model across diverse industries, incorporating additional factors, such as leadership quality or customer sentiment, to further strengthen its generalizability. Development of real-time predictive systems and early-warning dashboards may further enhance timely managerial interventions.