I.INTRODUCTION
Layout analysis aims to segment document pages geometrically into structural regions. Subsequently, logical understanding aims to classify the segmented regions into semantic classes like paragraphs, tables, figures, lists, and titles. Robust layout analysis enables precise physical and logical structures recovery, which is the foundation for various important applications such as document retrieval and text recognition.
Traditional layout analysis generally adopts top-down and bottom-up strategies. The former split the document image into smaller regions progressively, while the latter merge the smaller elements into a larger image region. These methods depend on sophisticated handcrafted features and heuristic rules, which are hard to be designed and prone to errors. Its feature representation is relatively low dimensional and inadequate for diverse and complex layouts.
In recent decades, deep learning has gained its popularity in object detection, which is capable of performing end-to-end segmentation and classification. Convolutional neural network (CNNs) [1] is introduced to integrate multiple convolution layers from high-resolution shallow features to deeper semantic features. There are numerous attempts in applying CNN-based methods for document analysis. The distinguishing feature extraction capability is one of the reasons why CNN adapts naturally to many visual tasks, including document layout analysis. In [2], VGG Net [3] is used as the backbone network, with full convolutional network [4] branches for page segmentation and table detection tasks. Yi et al. [5] choose AlexNet [6] and VGG-16 [3] as the baseline networks to explore the influence of network scales on the performance of the detection model. In [7] and [8], ResNet [9] is applied as the feature extraction network, and it achieves excellent results on public datasets. The above-mentioned methods are CV-based, considering layout analysis as detection or segmentation tasks. There are also some NLP-based methods [10,11], viewing layout analysis as a sequence-labeling task. These methods usually obtain text information through PDF parsing or optical character recognition OCR recognition. The text information provides auxiliary NLP modality enhancement when mixed with CV-based methods, while for CV-based unimodal, the performance depends heavily on optimized visual feature representation.
Increasing the depth of a backbone network could exploit abundant features and boost the ability of feature representation, but there are few reports considering the improvements of backbone network for document layout analysis tasks. For the extracted high-dimension feature information, there inevitably exists informative feature and relatively less useful ones, which can be selectively emphasized or suppressed.
To improve the quality of representations, some research works focus on incorporating attention mechanism into the structure of convolutional networks [12–14] for common object detection. For document layout analysis task, the feature representation is expected to capture salient properties of document images for layout analysis, such as symbols of lists, borders of tables, and boundaries of figures. Intuitively, neural network needs to pay attention to these regions of interest. It is natural to locate the most informative regions which conforms to human vision mechanism. Vision attention mechanism enables human to quickly acquire critical information when reading complicated information, thereby it greatly improves the efficiency and accuracy of visual information processing. Attention mechanism in deep learning deriving from the attention thinking mode of human beings has achieved excellent performance in many tasks [15–22].
Thus, a hybrid spatial-channel attention network (HSCA-Net) is proposed to explore dependencies among the channel layers within multiple levels and incorporate contextual spatial information. With the goal of enhancing feature representation, the attention mechanism is integrated along channel dimension and spatial dimension. Channel attention module (CAM) adaptively adjusts channel feature responses by emphasizing selective information, which depends on the contribution of the features of each channel. Spatial attention module (SAM) guides CNNs to focus on the informative contents and capture global context information among page objects. In addition, the SAM-CAM is plugged into each level from the backbone network to the multiscale feature maps in lateral attention connection.
Our principal contributions are as follows:
- (1)HSCA-Net integrates attention mechanism into deep learning-based methods along spatial and channel dimensions to explore the salient features which are well suited for document layout analysis task.
- (2)A novel connection named lateral attention connection is proposed to incorporate attention modules. The attention modules are connected at all levels from the backbone network to the multiscale feature maps by lateral attention connection.
- (3)In addition to evaluating the effectiveness of our network on public datasets, each separate attention module and their position arrangement strategies are explored and discussed in our experiments.
II.RELATED WORK
A.ATTENTION NETWORKS
Attention mechanism is capable of biasing the allocation of neural network resources towards the most informative part. The same mechanism appears when human vision enables readers to capture key information quickly and analyze the context of the whole document page. Obviously, focusing on the important and ignoring the unnecessary is an important property of human visual. In the neural network training process, it treats every part of the image equally, without focusing on the regions more informative. The intuitive thought of the computer vision attention mechanism is to train the neural network to be able to pay more attention to the informative regions and ignore irrelevant parts like humans. In the research of attention mechanism, there have been many innovative practices, including spatial attention and channel attention. SE Net [23] exploited channel attention to model independencies among channels as well as cross-channel interaction. It used global average pooling to describe channel independencies and two fully-connected layers to capture cross-channel interaction. The identity residual connection framework proposed by SE Net is innovative for attention block research. In order to solve the problem of higher model complexity and heavier computational burden in SE Net, ECA Net [24] introduced a parameter to represent the coverage of local cross-channel interaction, which aimed at learning effective channel attention with low model complexity. To further consider spatial information in each channel, BAM [25] and CBAM [26] continued the skip connection of SE Net, combining channel and spatial attention.
Self-attention mechanism in natural language processing (NLP) [27], on the other hand, can describe long-distance dependency. Non-local network (NL Net) [28] chose to establish connections among all pixels of an image, and this connection was established in a similar way of capturing words relationship within a sentence in NLP. In fact, after being verified by attention heat maps from different locations, pixels could share the same attention weight map since the attention maps did not differ much from place to place. Based on this fact, GC Net [29] developed a simplified NL Net and integrated with SE Net, resulting in a lightweight module to model long-range dependency.
To identify useful contextual information, Swing-L [30] limited self-attention calculation to non-overlapping local windows of fixed size. The global information interaction can be realized by continuously resizing windows to achieve cross-window connections. In [31], the authors proposed a new mechanism incorporating both fine-grained local and coarse-grained global interactions, which capture effectively both short-range and long-range visual dependencies. It can be concluded that contextual information has a positive effect on object detection. In [32], the proposed remote sensing image defogging network consists of both encoding and decoding, and the dual self-attention module is applied to the feature enhancement of the output feature maps of the encoding stage. It improved the definition of foggy images effectively. Zhong et al. [33] integrated a dual attention network composed of position attention and channel attention into the feature extraction network, which enhanced the robustness of backbone network and achieved higher accuracy in person reidentification tasks. Guo et al. [34] proposed a TBAL-Net using an attention mechanism to learn fine-grained feature representation, which is an effective training framework for fine-grained class incremental learning (CIL).
B.DEFORMABLE CONVOLUTION NETWORK
CNNs have limited ability to learn geometric transformations due to convolution feature maps at fixed locations. Research works on convolution kernels have tried to improve the transformation modeling capability of CNNs. Considering the limitation originates from the fixed structures of CNNs, novel convolution operators were proposed to improve the learning of spatial transformations. Dilated convolutions [34] were able to aggregate contextual information from the expanded receptive field. In [35], deformable convolution was proposed to sample spatial locations with additional self-learned offsets. Deformable convolution has significantly improved the transformation learning of traditional convolutional layers by introducing sparse sampling. It has been widely used in object detection backbones to enhance the feature representations. In this work, the deformable convolution is utilized to build SAM, which further enhances the discriminative ability of features in spatial dimension.
III.HYBRID SPATIAL-CHANNEL ATTENTION NETWORK
HSCA-Net consists of SAM, CAM, and designed lateral attention connection. SAM enhances informative regions and explores contextual information. CAM emphasizes the channels containing more discriminative features. As is depicted in Fig. 1, the attention modules are connected between the backbone network and the feature maps successively by lateral attention connection. The details are described in next section.
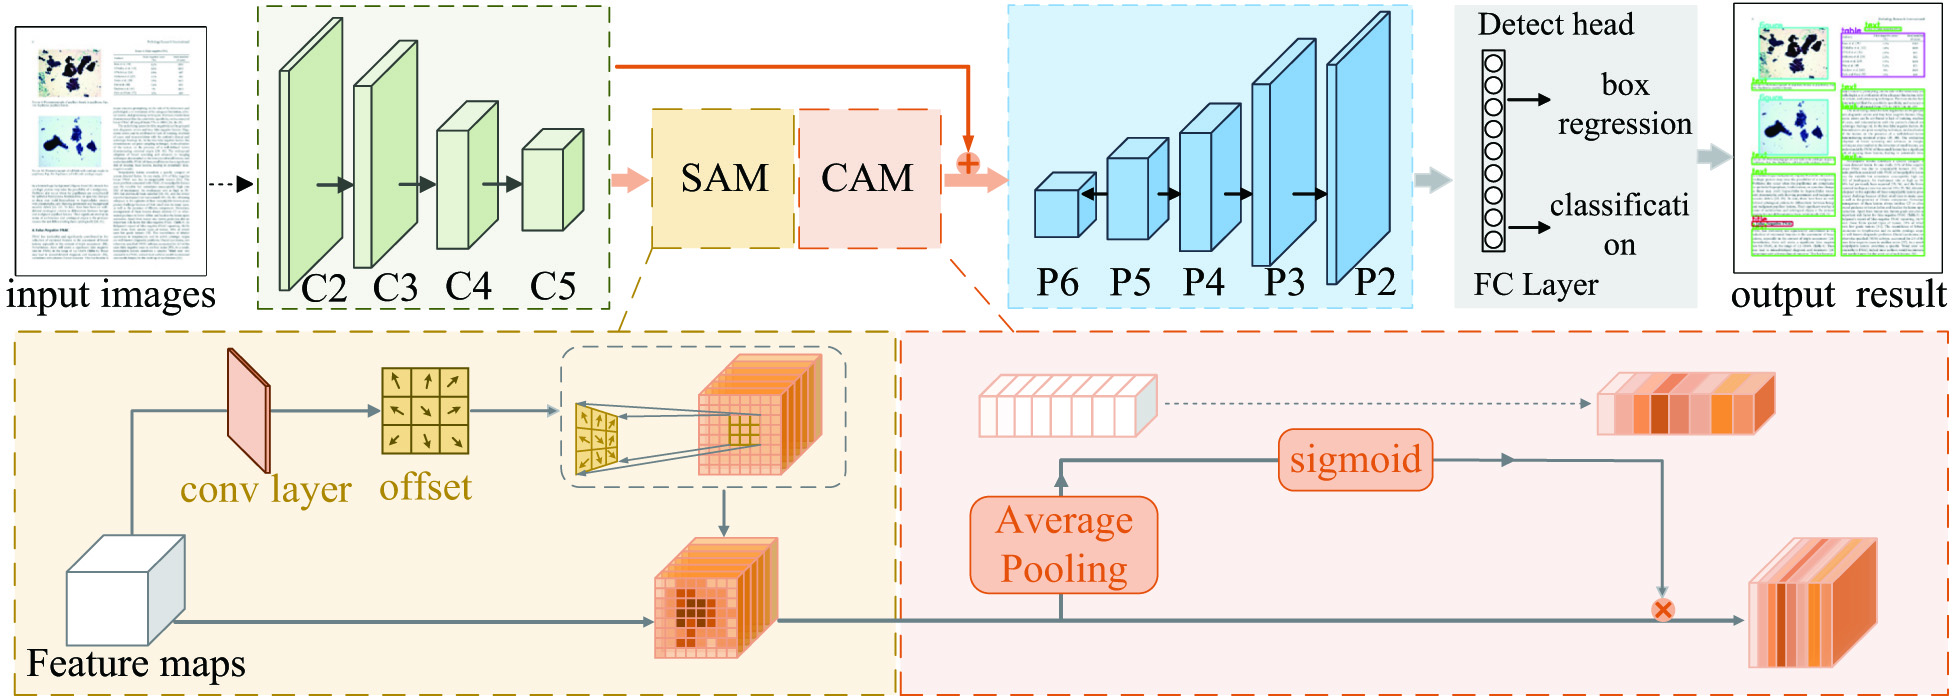 Fig. 1. The architecture overview of HSCA-Net.
A.CHANNEL ATTENTION MODULE
To attain effective representation of channel feature, the CAM is built to integrate the attention mechanism into network along the channel dimension. The structure of CAM is depicted in Fig. 2.
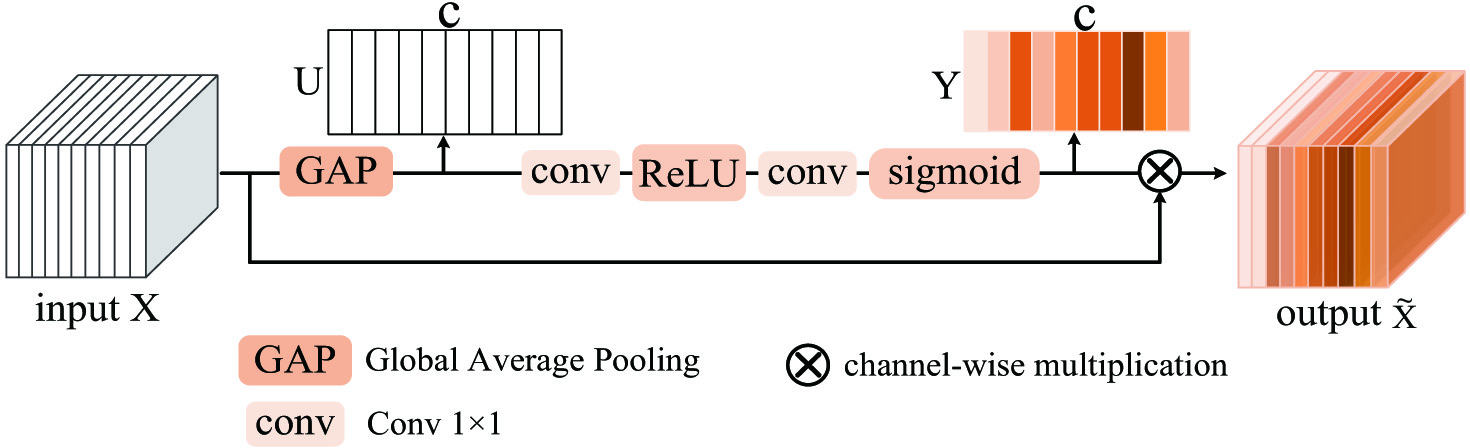 Fig. 2. The structure of channel attention module (CAM).
The input is the feature maps from backbone network. In order to emphasize on channel-wise features selectively, a global information is learned to reflect the importance of each channel. Global average pooling has been commonly adopted in simple and effective ways. The function is formulated as:
where , is a set of the local channel descriptors and is the c-th local channel descriptor. The parameter represents the global distribution of feature on channels. In order to reduce the complexity of the model, there are two connected to adjust the dimension variation. Then, the sigmoid function is to learn a nonlinear interaction between channels and ensures that multiple channels are allowed to be emphasized. is a set of normalized channel weights calculated bywhere refers to the ReLU [36] function, and refers to the sigmoid function. Finally, there is a channel-wise multiplication between feature maps and channel weights to perform feature recalibration in channel dimension.where is the c-th element of . It shows that each channel of is emphasized by the weight . is the output feature maps consisting of weighted channels.B.SPATIAL ATTENTION MODULE
In order to explore contextual information and informative regions in spatial dimension, we build a SAM with deformable convolution.
For a 2D standard convolution kernel, the convolution operation over feature mapis the summation of sampled values weighted by . And is the parameter within the convolution kernel. It is natural to think that more sampling points are located in the informative regions, and the neural network focus more on these regions. And more contextual information can be captured between page components. In this case, the sampling location may offset to cover informative regions. Therefore, deformable convolution is introduced to construct SAM so as to learn offsets. As is described in Fig. 3, the input is feature maps .The offsets are learned by applying a convolutional layer offset conv over .Its output offset fields have the same spatial resolution () with while the channel dimension is corresponding to 2D offsets.k is the number of the sampling locations of . The convolutional kernels for generating output features and offsets are learned simultaneously in training process. In offset fields, each sampling location of the convolution kernel learns offset for each pixel of feature maps. It can be calculated as
where are the learned offsets. is the shifted sampling location over . The offsets guide the convolution kernel to focus on the discriminative regions.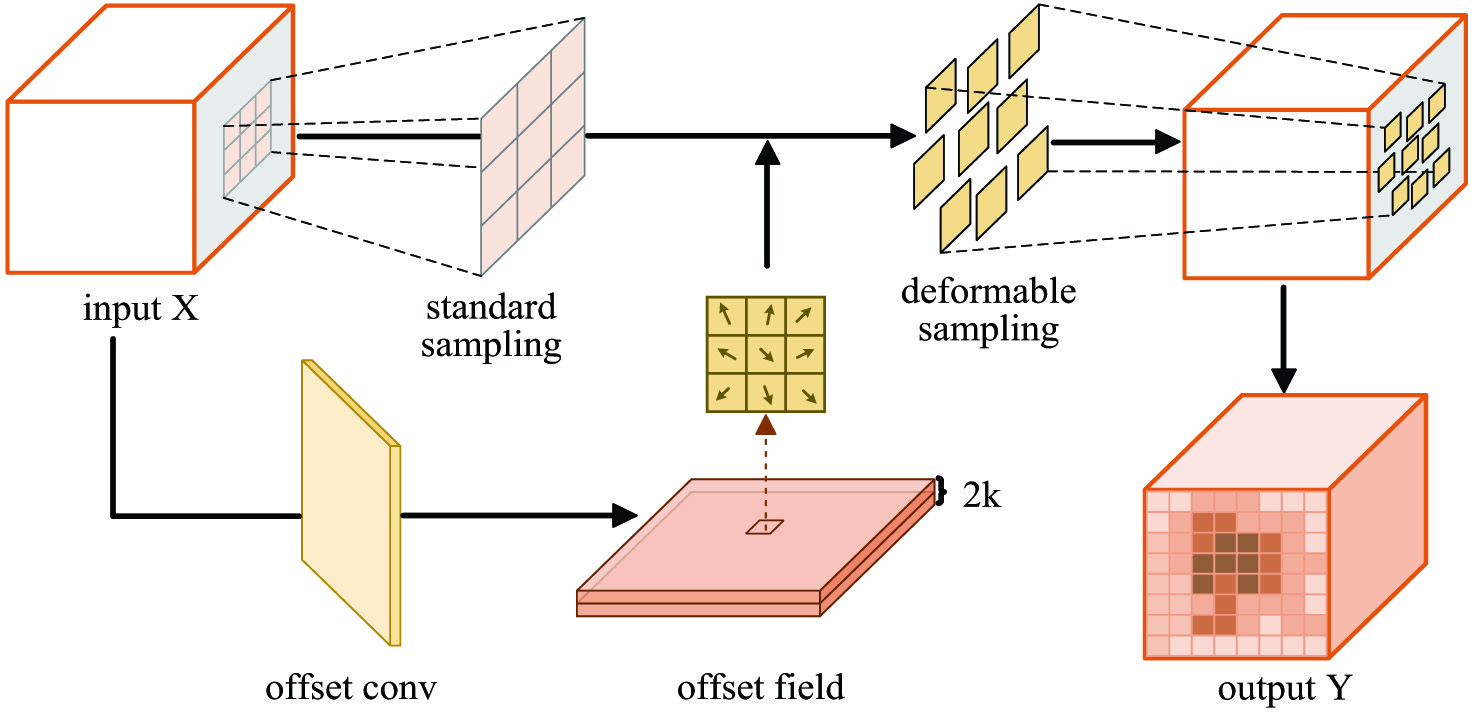
IV.LATERAL ATTENTION CONNECTION
ResNet and its variants are widely adopted due to impressive feature extraction ability. The identity connection of residual unit plays an important role in obtaining deeper representation from considerably increased depth of network. Previous attention works [27,30,33] adopt similar connection that place the attention block after the residual unit. In the construction of the feature pyramid networks (FPN) [37], it includes a bottom-up pathway, and a top-down pathway and lateral connection.Each lateral connection merges feature maps of the same spatial size from the bottom-up pathway and the top-down pathway,which means to fuse semantically strong features into higher-resolution feature maps. Motivated by the connections above, the lateral attention connections is proposed to integrate our attention module into multiscale feature pyramid network. Figure 1 shows the construction of our lateral attention connection. The outputs of Resnet are defined as while the feature map of FPN is defined as . The formula is as follows:
where refers to the operations of attention modules. and are the up-sampling and down-sampling operations, respectively. represents the element-wise summation. Overall, lateral attention connection is parallel to the original lateral connection. The outputs of ResNet are computed by SAM and CAM sequentially. The feature maps of FPN fuse the features of the two pathways.V.EXPERIMENTS AND DISCUSSION
A.DATASETS
In this section, experiments are conducted on the three public document image datasets: PubLayNet [8], ICDAR-POD [38], and Article Regions [36], for evaluating the effectiveness of our HSCA-Net.
PubLayNet is comparatively large, which contains over 360K document images. It is based on over 1 million PDF articles that are publicly available on PubMed Central™. It annotates five document layout categories (Text, Title, List, Figure, and Table) with both bounding boxes and polygonal segmentations. Its evaluation metric is the mean Average Precision (mAP) with Intersection over Union (IoU) [0.50:0.95].
ICDAR-POD consists of 2,000 document page images which are scanned pages from contemporary magazines and technical articles. It contains three classes: Formulae, Tables, and Figures. The evaluation metric is average precision (AP) with IoU thresh holds (0.6 and 0.8).
Article Regions is a public dataset of region-labeled articles, which consists of 822 document images and nine region classes, including Title, Authors, Abstract, Body, Figure, Figure Caption, Table, Table Caption, and References. The annotation is in object detection format and the evaluation metric is mean Average Precision (mAP).
B.IMPLEMENTATION DETAILS
The setting of hyperparameters follows existing Mask R-CNN. The backbone network is mainly based on ResNet-101, which is pre-trained by ImageNet [6]. The input images are scaled to pixels. Each mini-batch has two images per GPU. Each image has 512 sampled RoIs, with a ratio of 1:3 of positive to negatives. All the models are implemented under the PyTorch framework 1.9.0 and trained on one Nvidia GTX 2080Ti GPU by the Stochastic Gradient Descent (SGD) optimizer with a momentum of 0.9 and weight decay of 0.0001.PubLayNet is trained by 3 epochs at a basic learning rate of 0.0009, which is divided by 10 every epoch. The training epochs of article regions and ICDAR-POD are 30, which is divided by 10 every 10 epochs with the basic learning rate of 0.0025. All the experiments are conducted on an Ubuntu 20.04 workstation with an Intel(R) Xeon(R) Silver 4210 2.20GHz CPU 64GB RAM.
VI.RESULTS DISCUSSION
A.PUBLAYNET
In Table I, we conducted experiments on PubLayNet benchmark, which is one of the largest document image databases with the amount of 360k thousand pages, HSCA-Net improves the performance on all classes compared with Faster R-CNN and Mask R-CNN, with an increase of 3.8% mAP and 3% mAP, respectively. With the comparison of VSR, which achieved the best performance in ICDAR-SLP layout analysis recognition competition, HSCA-Net has higher detection performance for List, Table, and Figure categories, which achieve 94.9%, 97.5%, and 96.6% mAP, respectively. Our HSCA-Net outperforms on most categories, which contain distinctive features such as the symbol of list, the boundary feature of tables, or figures. The attention network enables to make these essential features more prominent.It uses global information to recalibrate the channel-wise feature adaptively and exploits contextual information to locate objects more accurately. Furthermore, VSR utilizes both visual information and NLP information generated by parsing PDFs. The preprocessing introduces additional computation. However, HSCA-Net focus on the expression of visual features. It explores visual features more suitable for layout analysis in spatial and channel dimensions. Attention mechanisms emphasize the visual information of key areas. In addition, text information may interfere with visual information to a certain extent. Our method tends to make full use of visual information to facilitate the effective flow of feature information under the current task.
Table I. Performance comparison on PubLayNet dataset
| Methods | Text | Title | List | Table | Figure | mAP |
|---|---|---|---|---|---|---|
| Faster R-CNN [ | 91.0 | 82.6 | 88.3 | 95.4 | 93.7 | 90.2 |
| Mask R-CNN [ | 91.6 | 84.0 | 88.6 | 96.0 | 94.9 | 91.0 |
| VSR [ | 94.7 | 97.4 | 96.4 | |||
| HSCA-Net | 93.6 | 87.3 | 94.0 |
B.ARTICLE REGIONS
Table II shows the performance comparison of our HSCA-Net and three methods, including Faster R-CNN, Mask R-CNN, and VSR on Article Regions dataset. It can be seen that HSCA-Net achieves highest mAP on most categories such as authors, figure caption, references, etc. In detail, the mAP of authors and table caption increases by 2.8% and 6%, respectively. It outperforms 2.2% mAP compared to VSR. Page objects have a large variety in size. In this dataset, authors and table caption belong to relatively small region classes. It makes them difficult to be localized and distinguished from other text classes. Contextual information is critical to lead localization and recognition. For example, the positional relationship between table and table caption can be regarded as a kind of contextual hints. The table caption is more easily to be identified by the neighboring table class. The experimental result indicates the CAM enhances feature information and SAM exploits contextual relation in features to identify the regions.
Table II. Performance comparison on article regions dataset
| Methods | Title | Authors | Abstract | Body | Figure | Figure Caption | Table | Table Caption | References | mAP |
|---|---|---|---|---|---|---|---|---|---|---|
| Faster R-CNN w/context [ | – | 10.34 | – | 93.58 | – | – | – | 30.8 | – | 70.3 |
| Faster R-CNN [ | 92.71 | 79.90 | 93.79 | 96.83 | 86.86 | 92.66 | 81.66 | 68.83 | 98.34 | 87.95 |
| Mask R-CNN [ | 83.85 | 78.05 | 94.20 | 97.42 | 90.43 | 93.78 | 83.39 | 71.64 | 99.37 | 88.01 |
| VSR [ | 94.00 | 95.00 | 94.50 | 96.10 | 84.60 | 92.30 | 94.50 | |||
| HSCA-Net | 95·90 | 99.00 | 94.70 |
C.ICDAR-POD
In Table III, the experimental results for comparison refer to [38]. Overall, HSCA-Net achieves higher performance, reaching 93.9% mAP and 92.0% mAP with two IoU thresholds 0.6 and 0.8, respectively. When IoU threshold equals 0.6, the results increase by 8.2% mAP on Formula, 1.1% AP on Table, 0.6% AP on Figure. When the IoU threshold increases to 0.8, HSCA-Net performs better in each category with 8.4%, 1.4%, and 2.2% mAP improvements, respectively. It can be observed that HSCA-Net achieves better performance on formula category. Referring to human visual attention mechanism, formulas have distinguishing appearances and visual features. The formula region also contains contextual relations between formula and formula tags. Our HSCA-Net captures informative context and locates salient regions with deformable convolution in spatial dimension. The capturing of contextual information in spatial dimension improves detection accuracy.
Table III. Performance comparisons on ICDAR-POD dataset
| Methods | AP(IoU = 0.6) | AP(IoU = 0.8) | ||||||
|---|---|---|---|---|---|---|---|---|
| Formula | Table | Figure | mAP | Formula | Table | Figure | mAP | |
| NLPR-PAL | 83.9 | 93.3 | 84.9 | 87.4 | 81.6 | 91.1 | 80.5 | 84.4 |
| icstpku | 84.9 | 75.3 | 67.9 | 76.0 | 81.5 | 69.7 | 59.7 | 70.3 |
| FastDetectors | 47.4 | 92.5 | 39.2 | 59.7 | 42.7 | 88.4 | 36.5 | 55.9 |
| Vislnt | 52.4 | 91.4 | 78.1 | 74.0 | 11.7 | 79.5 | 56.5 | 49.2 |
| sos | 53.7 | 93.1 | 78.5 | 75.1 | 10.9 | 73.7 | 51.8 | 45.5 |
| UITVN | 19.3 | 92.4 | 78.6 | 63.4 | 6.1 | 69.5 | 55.4 | 43.7 |
| Matiai-ee | 11.6 | 78.1 | 32.5 | 40.7 | 0.5 | 62.6 | 13.4 | 25.5 |
| HustVision | 85.4 | 93.8 | 85.3 | 88·2 | 29.3 | 79.6 | 65.6 | 58.2 |
| Li eta[ | 87.8 | 94.6 | 89.6 | 90.7 | 86.3 | 92.3 | 85.4 | 88.0 |
| HSCA-Net | ||||||||
D.ABLATION STUDIES
In this section, ablation experiments are designed to investigate the contribution of each module and the impact of different module sequences. The experiments are conducted on PubLayNet dataset. The baseline model is Mask R-CNN. Each model is trained for 90k iterations with a base learning rate of 0.0025. In Table IV, when the baseline Mask R-CNN is equipped with CAM alone, the performance is boosted from 89.21% to 90.94% mAP. Figure and List results achieve around 2.18% and 4.5% mAP higher than the baseline. The figure boundary feature and list symbols are essential information for recognition. The results indicate that CAM is able to effectively emphasize these critical features. When the baseline model embeds with SAM alone, the result is 2.85% mAP higher on Figure and 5.75% mAP higher on List than the baseline alone. This demonstrates that the SAM is capable of guiding the model to locate the informative regions. In addition, we investigate the impacts on position arrangement strategies of the attention modules.It can be observed that the spatial-channel (SAM + CAM) arrangement has a slightly better performance reaching 91.41% mAP. The overall performance is affected by the arrangements of the attention modules. The SAM should be arranged before the CAM. The reason for the increase could be that SAM obtains rich context information and makes some features prominent in spatial dimension. Based on this spatial information, CAM selectively emphasizes the features suitable for layout analysis task. Therefore, the spatial-channel shows better performance on layout analysis tasks.
Table IV. Ablation experiments on PubLayNet dataset
| Models | Text | Title | List | Table | Figure | mAP |
|---|---|---|---|---|---|---|
| Baseline | 91.83 | 82.53 | 84.40 | 95.68 | 91.59 | 89.21 |
| +CAM | 83.50 | 88.90 | 96.64 | 93.77 | 90.94 | |
| +SAM | 91.71 | 90.15 | 96.53 | 94.44 | 91.32 | |
| CAM + SAM | 91.71 | 80.35 | 83.50 | 94.93 | 90.99 | 88.30 |
| SAM + CAM | 91.87 | 83.34 |
VII.NETWORK VISUALIZATION RESULTS
Example results of improved detection performance are shown in Fig. 4. As Fig. 4(a-2) depicts, the two tables are segmented inaccurately and the table caption is detected as text category. In this case, the contextual relation between table and table caption appears to be essential. In Fig. 4(a-3), HSCA-Net identifies the table region accurately with the table caption included. The reason may be that our SAM enables the model to capture the contextual information and utilize the contextual relations to achieve more precise recognition. In Fig. 4(b), the baseline model Mask R-CNN detects the table region as list category imprecisely. The table border is not detected by baseline model. As shown in Fig. 4(b-3), HSCA-Net calibrates the inaccurate prediction box and identifies the right logical roles of the region. The border feature of tables is important for table detection. This example indicates that our HSCA-Net is able to emphasize these features that are significant for the detection task.
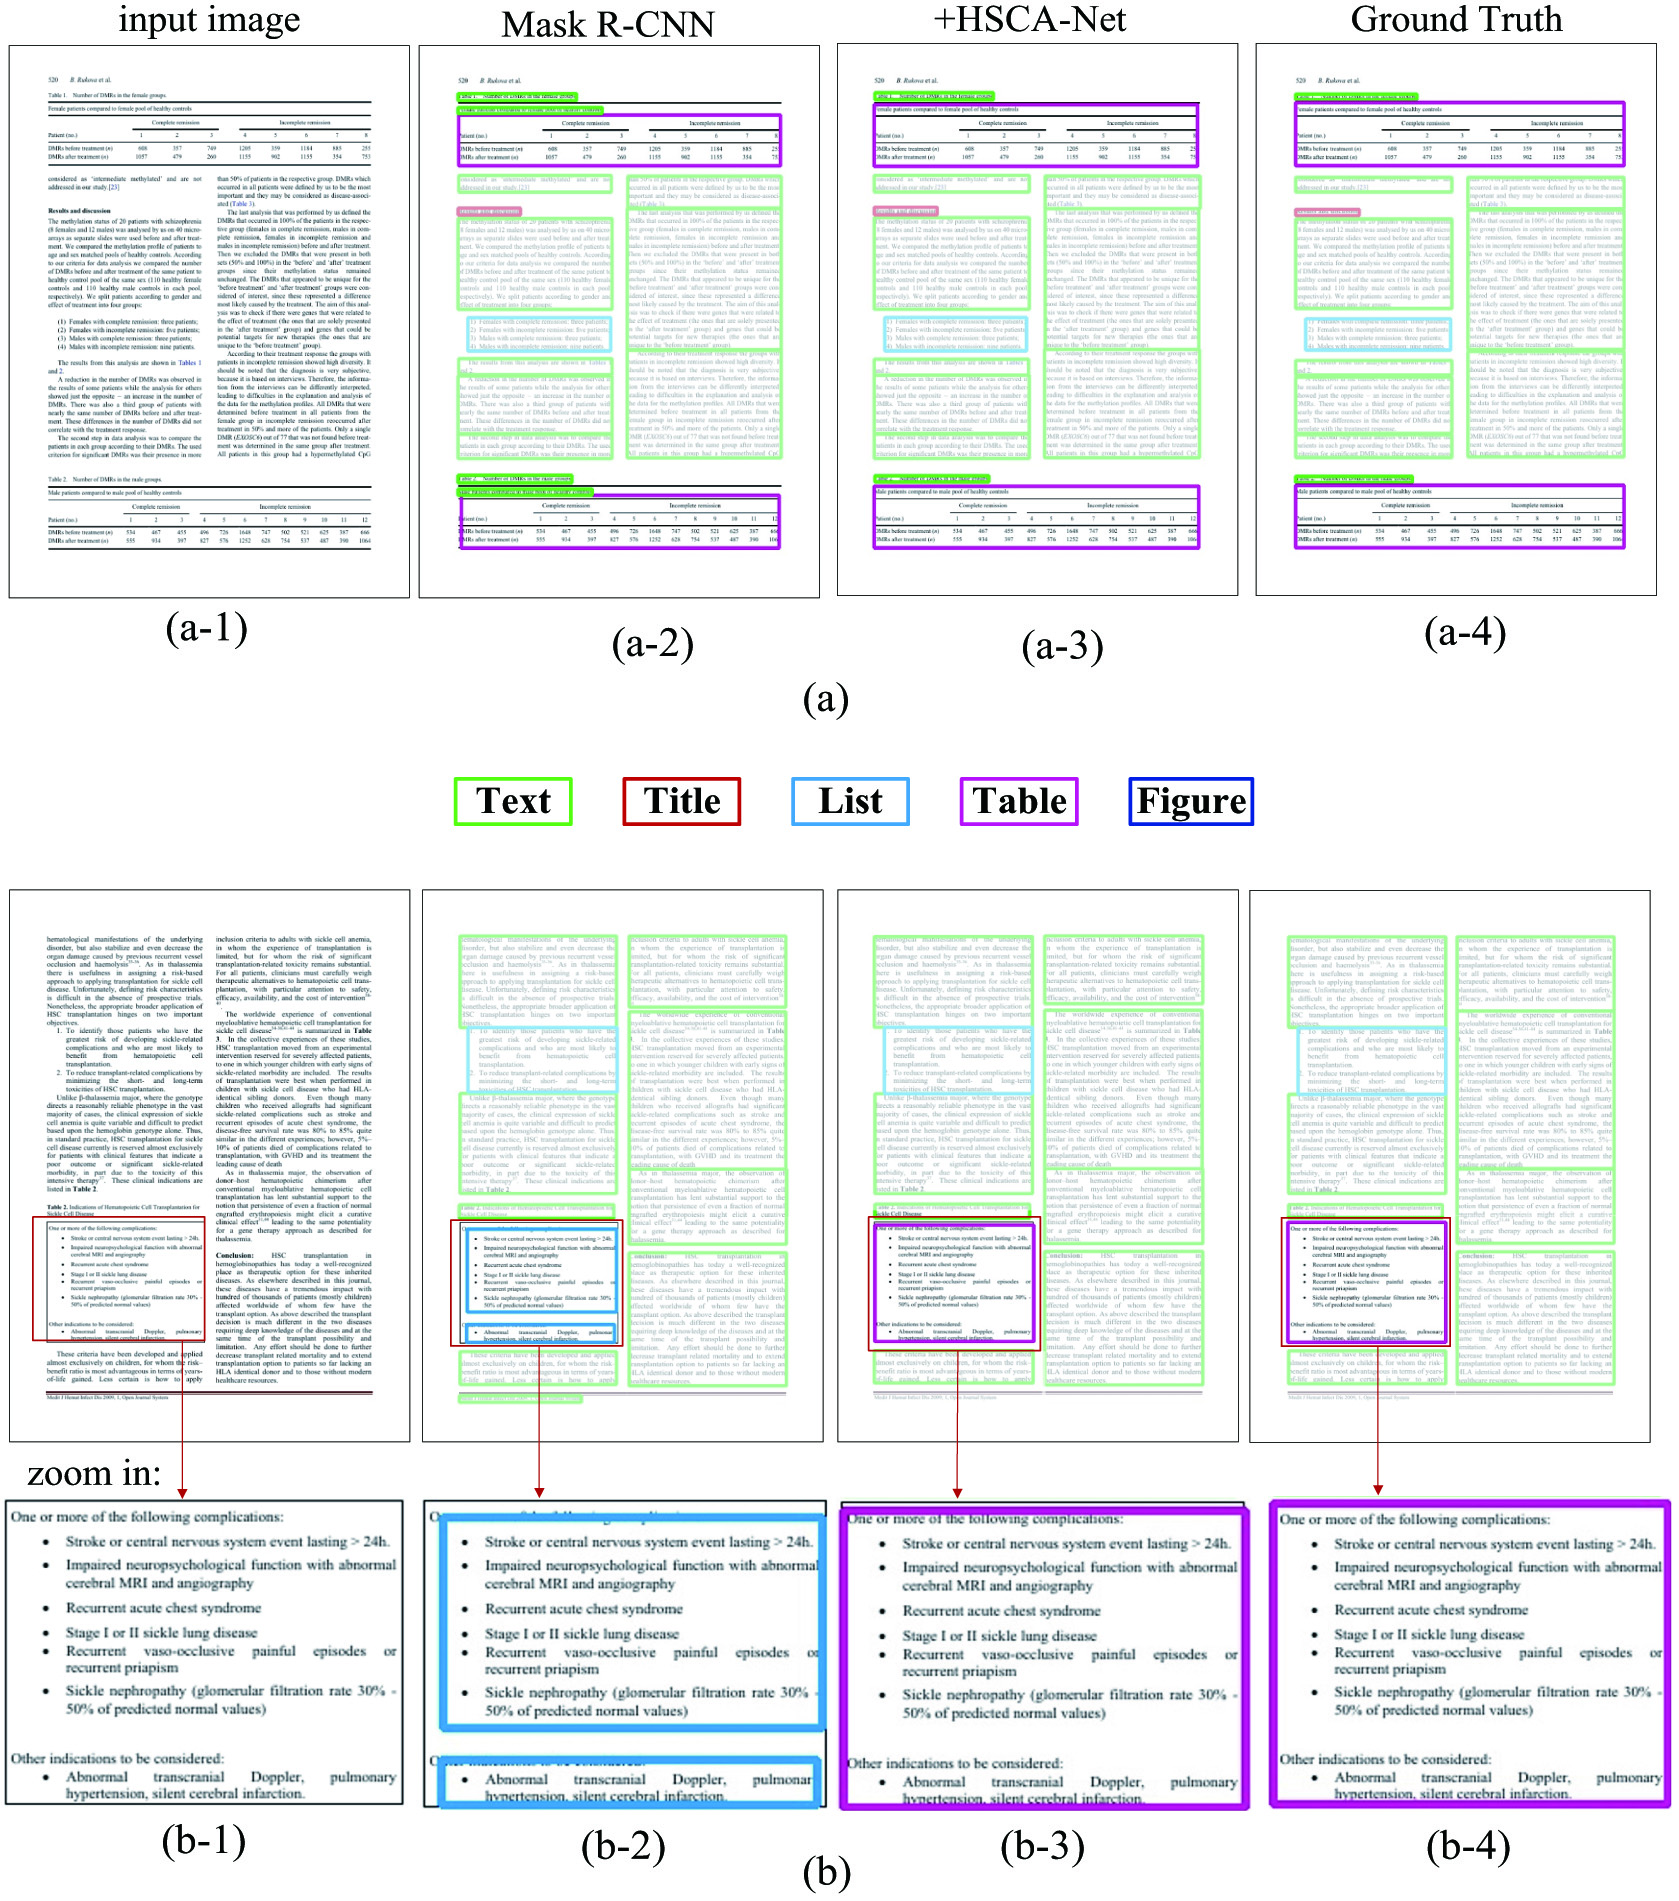 Fig. 4. Representative examples of the document layout analysis comparison results on PubLayNet.
VIII.CONCLUSION
We proposed a HSCA-Net for the document layout analysis task. It incorporated the attention mechanism into the object detection model along the spatial and channel dimensions.The work aimed at improving the performance of document layout analysis algorithm. HSCA-Net integrated SAM and CAM into FPN-based model by designed lateral attention connection. The SAM extracted contextual information and enhanced important spatial features, while the CAM performed dynamic channel-wise feature recalibration to explore effective feature representation. Extensive experiments on three public document datasets demonstrated the superiority and adaptability of HSCA-Net.