I.INTRODUCTION
At present, the significant increase in the types and quantity of medical equipment used in hospitals has led to an increasing workload of medical equipment maintenance. Maintenance management has become the core of medical equipment management [1,2]. Hospitals must devote a substantial amount of human and material resources to the maintenance of medical equipment. To maintain the quality of the management of failures and related costs during the acquisition, maintenance, and disposal of medical equipment and equipment by the appropriate staff, it is required to investigate an efficient method for reliably predicting failures.
This study is organized as follows: in the second section, we examine relevant perspectives on fault identification for medical devices. This paper presents an entire life cycle failure prediction system for medical devices in the third section; in the fourth section, experimental analysis is conducted. The fifth section of this study is the Conclusion.
II.RELATED WORK
Current medical equipment failure prediction mainly includes three methods: Reference [3] studied the hardware failure prediction of unbalanced time series data: Gaussian process artificial data generation and the application of LSTMFCN in hardware failure prediction. Three models were trained using sequence data: long-short-term memory (LSTM), fully convolutional network (FCN), and a combination of LSTMFCN reported by Karim et al. (Karim et al., 2019). Finally, the highest F1 score of 87.45% and the highest accuracy rate of 99.35% were obtained by using LSTMFCN. However, this method needs to accumulate a large number of failure mechanisms and models. Considering the particularity of some medical devices, such methods require a lot of accumulation during use. The fault diagnosis time is long. The method of reference [4] studied the failure prediction method based on the critical analysis of failure mode effects. It needs to prepare the same equipment with the same technology and process. The cost of the application process is high. Maneuverability is low. Reference [5] proposed a failure prediction method based on LabVIEW, which predicted its operating status by monitoring the change of a certain characteristic parameter of the target. It has strong applicability.
III.PROPOSED PREDICTION SYSTEM
A.THE OVERALL STRUCTURE OF THE PROPOSED SYSTEM
Medical equipment plays an essential role in assuring the safety and efficacy of the hospital’s treatment procedure. The essential maintenance and management of medical equipment are crucial for ensuring its regular operation in medical activities and the efficacy of patient treatment. As a result, intelligent theories such as an inference engine and a failure prediction model are employed to complete the improved prediction of the life cycle of medical equipment failure based on the gathered life cycle data of medical equipment. Figure 1 depicts the framework of the enhanced failure prediction system for the whole life cycle of medical equipment. The system consists of four primary modules: the entire life cycle management module, the status detection module, the problem diagnosis module, and the failure prediction module.
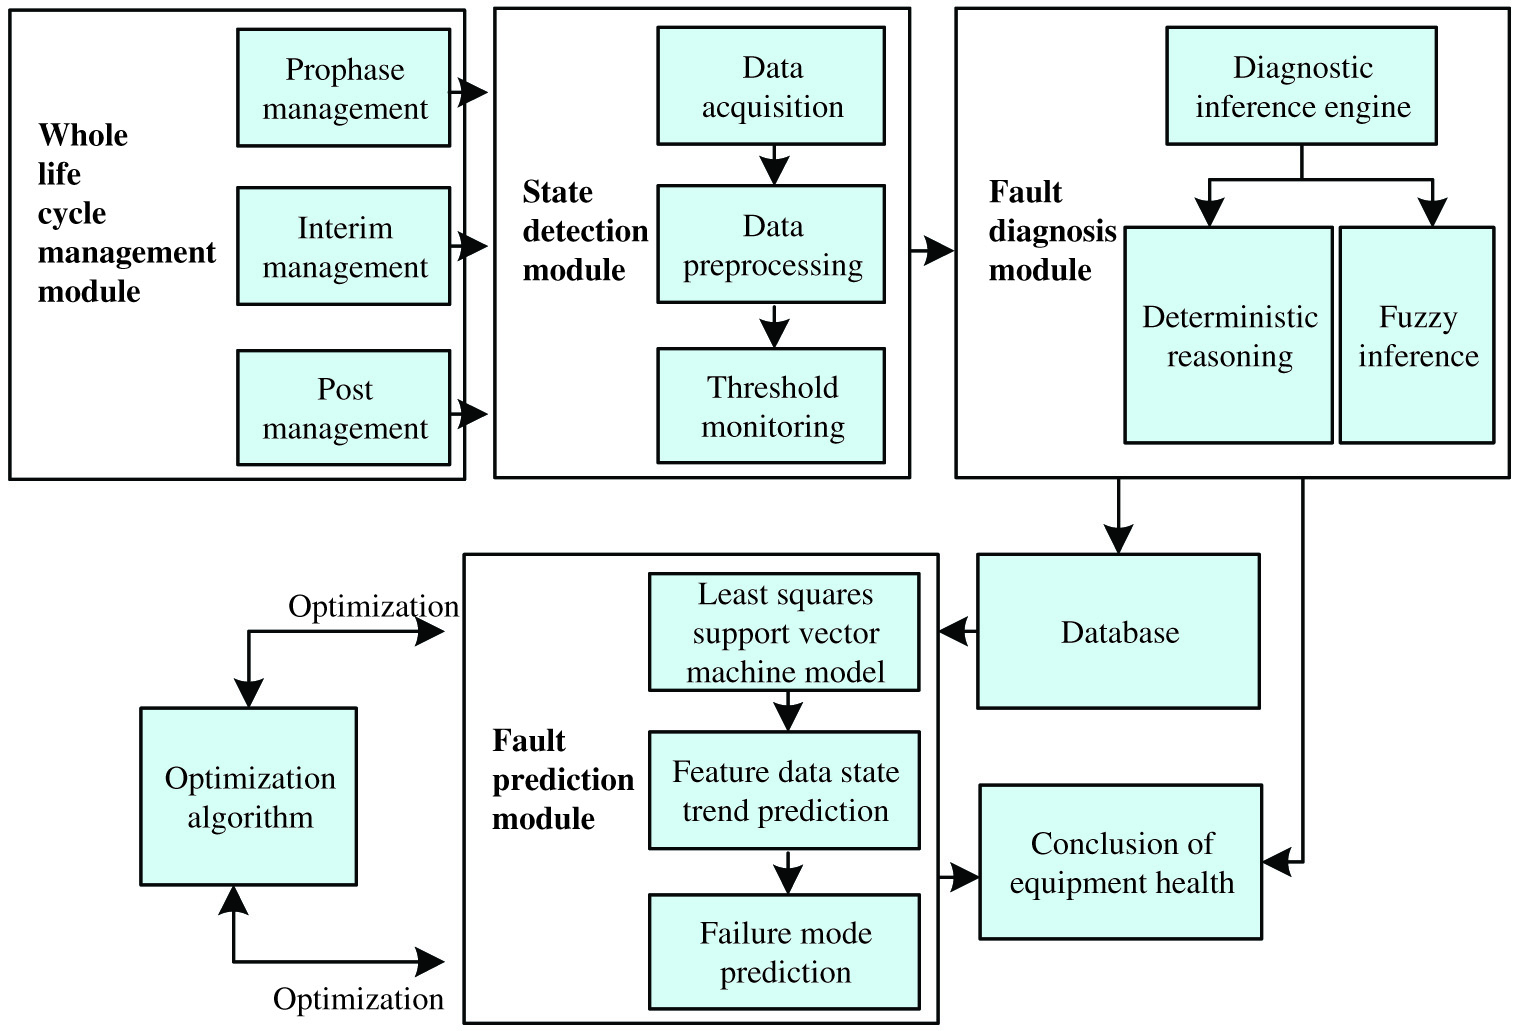 Fig. 1. The overall structure of the system (highlight the added components in this diagram).
The proposed prediction system consists of 4 modules – whole life cycle management module, site detection module, fault diagnosis module, and fault prediction module. The whole life cycle management module mainly contains data related to the life cycle of medical equipment. The status detection module is mainly composed of three parts: data acquisition, data preprocessing, and threshold monitoring. The whole life cycle management module collects relevant data. After the preprocessing process, the redundant data is cleared [5]. Through threshold monitoring, the main operating data of medical equipment components are monitored.
The main function of the fault diagnosis module is to diagnose medical equipment faults based on the operation data of medical equipment. It is done via an inference engine. The inference engine consists of deterministic reasoning and fuzzy inference. Deterministic reasoning is used to diagnosis precise data, and fuzzy inference is used to diagnosis fault data.
The main function of the database is to store various types of operating data, failure mode information, inference rules, prediction results, and historical failure information required for medical equipment fault diagnosis and prediction.
The fault prediction module contains two main parts, namely the trend prediction of the characteristic data of medical equipment and the prediction of the failure mode of the medical equipment. Its main function is to predict failures and determine the reliability of the prediction results [6]. Based on the failure prediction results, the medical equipment health conclusion is obtained, which includes the medical equipment status monitoring results, equipment maintenance auxiliary information, equipment failure alarms, and equipment management-related information.
B.WHOLE LIFE CYCLE MANAGEMENT MODULE
Figure 1 depicts the system’s general structure framework, which is used to analyze the entire life cycle management module. The majority of the program is separated into three sections: early, medium, and late management. The administration of medical device equipment can be separated into the aforementioned three sections in order to supervise and forecast each phase. Life cycle management framework of medical device equipment is depicted in Fig. 2.
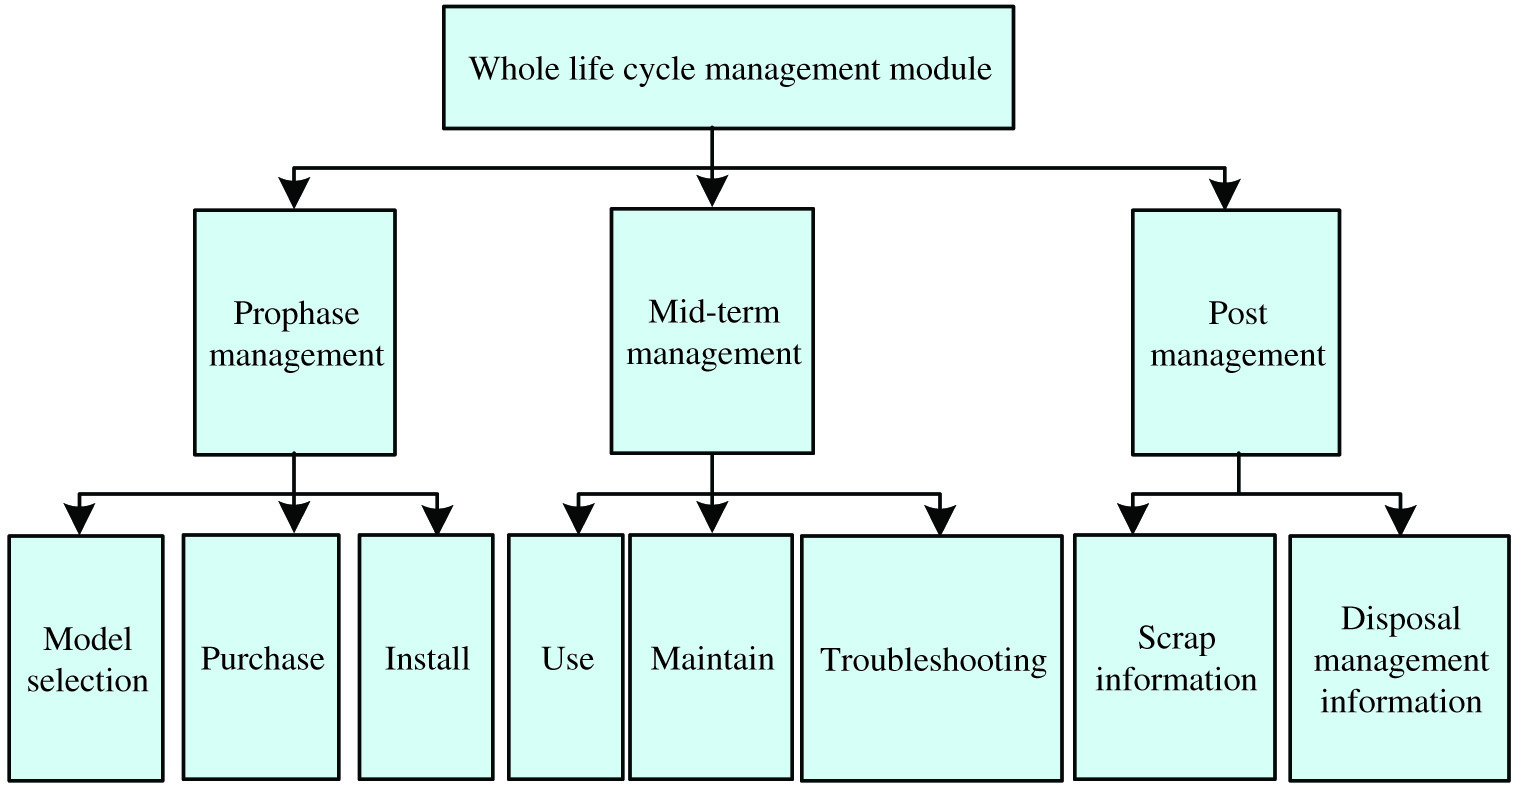 Fig. 2. The structure diagram of the whole life cycle management of medical equipment.
The prophase management is mainly composed of the model selection, purchase, and install [7]. Effective management of this section can avoid the use of poor-quality medical devices. After purchasing medical equipment, it needs to be installed. At the same time, the device number is set, and the device-related data set is constructed. Based on the differences in the functions of different medical devices, the medical devices are divided into different types, and the information of different types of medical devices is managed uniformly.
The main function of mid-term management is to manage all the information in the use of medical equipment [8]. The management of this part can monitor whether failure of the equipment at any time, so as to make the corresponding decision in time. During the operation of medical equipment, various state index data during the operation of different equipment are regularly monitored, and the data are stored in the corresponding data set.
What is described in the post-management is the medical equipment scrap information and disposal management information [9], including the treatment process under the condition that the medical equipment is scrapped or has no application value. The management of this part can prevent the end-of-life medical equipment from being put into use again.
C.FAULT DIAGNOSIS MODULE
The fault diagnosis module is based on the state monitoring module and realizes the fault diagnosis of medical equipment through different reasoning mechanisms. Figure 3 shows the structure diagram of the inference engine.
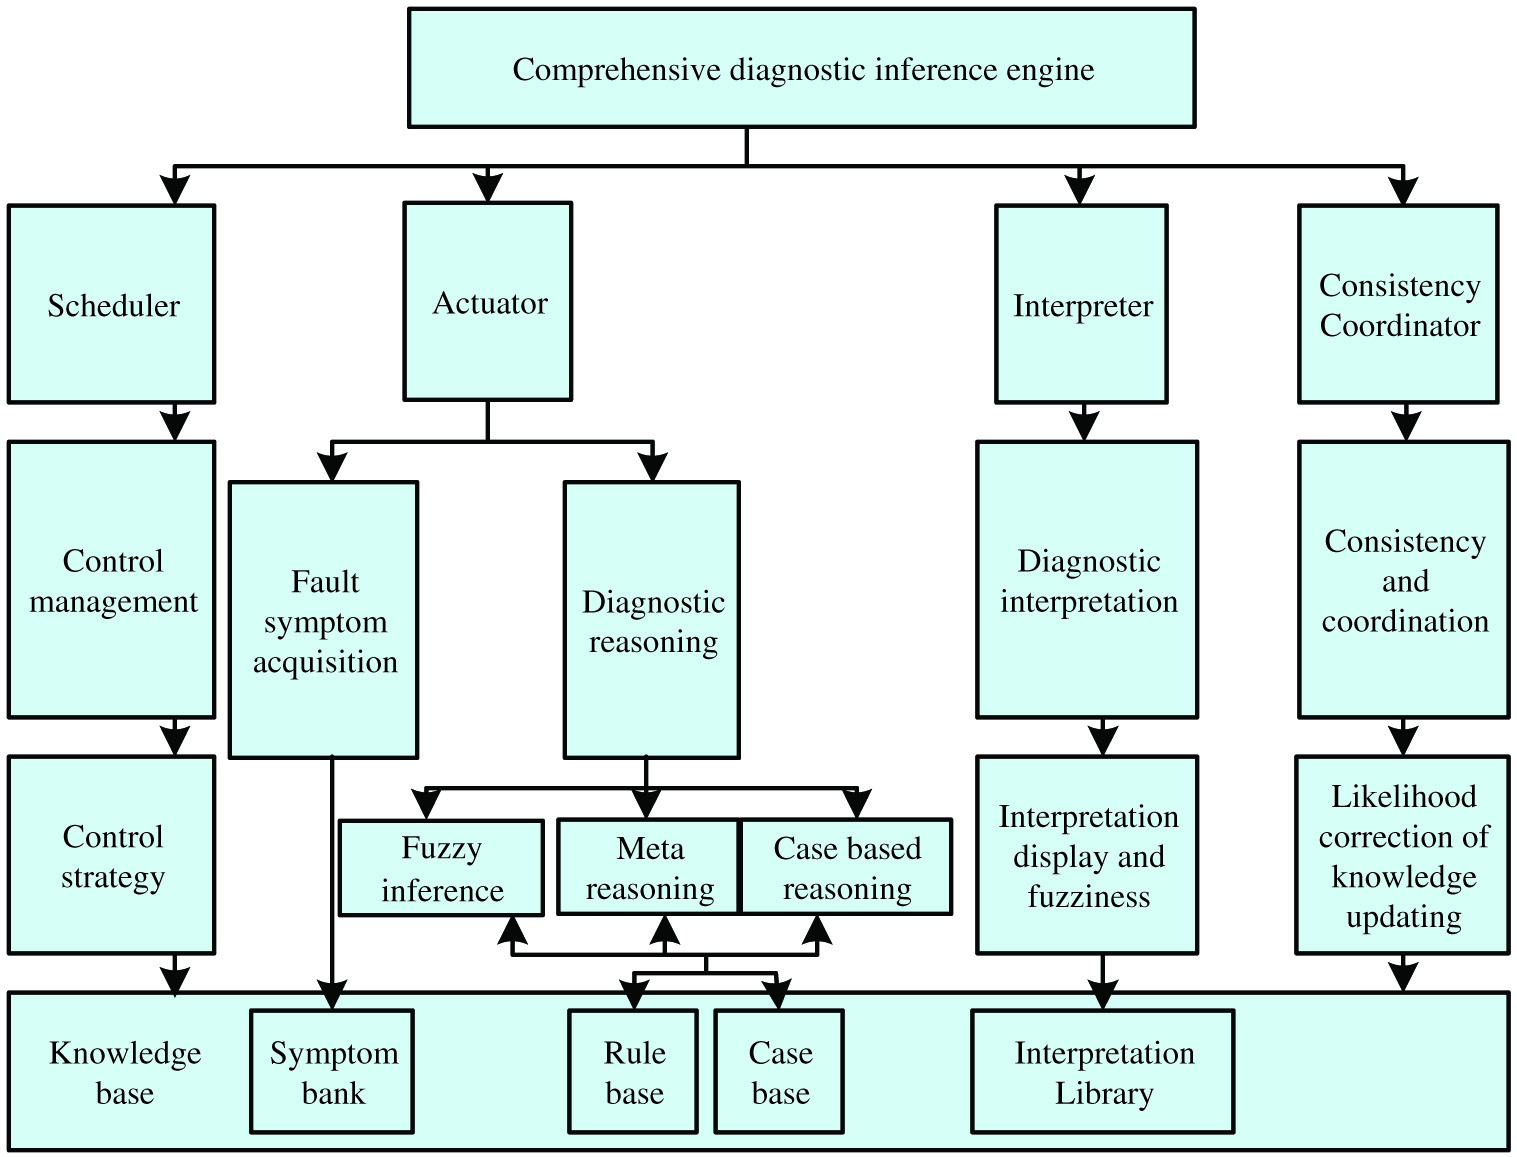 Fig. 3. Structure diagram of the inference engine.
As shown in Fig. 3, the inference engine mainly consists of two parts [10], namely control management and diagnostic inference.
- (1)The main function of control reasoning is to realize the transmission and control function of scheduling information between different jobs in the reasoning engine.
- (2)The process of diagnostic reasoning includes reasoning techniques such as fuzzy reasoning and meta-rule reasoning. Fuzzy reasoning is based on generalized fuzzy generative rules and fuzzy reasoning algorithms. Meta-rules implement forward reasoning with the core of generative rules and meta-inference engine.
D.DESIGN OF FAULT PREDICTION MODULE
1)LEAST SQUARES SUPPORT VECTOR MACHINE ALGORITHM
The prediction model is constructed based on the least squares support vector machine algorithm, that is, the prediction model is constructed according to the general observation data of the fluctuation of a certain operating data of the medical equipment and equipment. The predicted value is output through the model, thereby obtaining the state of the fluctuation amount of the medical equipment and equipment operating data at a certain time in the future. Reconstructing the linear space to determine the correlation between input and output is the core work in the process of predicting model construction [11–14].
Describe the predicted target value and model input value with and , respectively. Based on this, a fault prediction model for medical equipment is constructed. By transforming , the learning samples of the support vector machine can be obtained:
According to formula (1), there is a one-to-one mapping correlation between the input and output of the prediction model [15,16]. Among them, represents the embedding dimension, and , respectively, represent the values before and after the prediction model is mapped. The final prediction error FPE specification is used in the model, and the formula is described as follows:
In formula (2), represents the prediction error data mapping value. represents the prediction confidence level.
Under the condition that fluctuates, also fluctuates accordingly. From this, an optimal value can be determined to make the value the lowest. Under this condition, the optimal embedding dimension can be obtained.
According to the above formula, after obtaining the input, output, and embedding dimensions of the medical equipment failure prediction model, the support vector machine can be trained, and the least square support vector machine regression function can be obtained as formula (3):
In formula (3), represents the regularization parameter, represents the width parameter, represents the basis function.
Based on formula (3), the predicted value of points can be obtained:
At the same time, a set of data can be obtained. Among them, is the predicted value of the , that is, .
In the same way, the predicted value of the can be obtained:
From this, the least squares support vector machine prediction model of the step is obtained:
In formula (6), .
2)OPTIMIZATION ALGORITHM
In order to improve the accuracy of the least squares support vector machine model in predicting medical equipment failures, the AFS-ABC algorithm is used to optimize the regularization parameters and width parameters of the least squares support vector machine model.
The specific process of the AFS-ABC algorithm is mainly to optimize it with reference to the honey-collecting behavior of bees. The optimal value of the output of the support vector machine fitness function is the final optimization goal [17–21]. The interaction and iteration between the data in the model are used to obtain the optimal solution of the support vector machine fitness function. x means nectar. Equation (7) describes the work of the reconnaissance bee:
In formula (7), and , respectively, represent the dimensional coordinate of and an arbitrary number between 0 and 1.
represents the domain nectar source of the dimension update of , and formula (8) represents the behavior of leading and following bees to implement domain nectar source search:
In formula (8), and respectively, represent a nectar source different from and an arbitrary number uniformly distributed in the range of [−1,1].
In the AFS algorithm, formula (9) is used to dynamically modify the artificial fish search step:
In formula (9), Z and g, respectively, represent the artificial fish search step and the current iteration number. R and p, respectively, represent the upper limit of the number of iterations and an integer greater than 1. Equation (10) is used to update the artificial fish:
In formula (10), and , respectively, represent the coordinates of the artificial fish and the center of the fish school after performing the foraging work. and , respectively, represent the current artificial fish coordinates and the optimal coordinates obtained by the fish school [22,23].
According to the above analysis process, the optimized least squares support vector machine model is obtained. The specific process is as follows:
- (1)The food source is initialized, and the lead bee is replaced with artificial fish;
- (2)Different artificial fish perform foraging work and update their coordinates according to formula (10);
- (3)Determine the profit rate data of different artificial fish and update the bulletin board data according to the determined data;
- (4)Lead the bee to be followed according to the probability to select nectar sources to perform domain search work and to update the domain nectar sources;
- (5)The number of domain nectar source updates is determined. If the update threshold is met, the nectar source is abandoned, and a follower bee turns into a scout bee to form a new nectar source; otherwise, proceed to (6);
- (6)Whether it does meet the end criterion [24], if it does, the optimal solution will be output and the optimization process will end; on the contrary, the colony rate of return is determined, the bulletin board is updated, and proceed to (2).
IV.EXPERIMENTAL ANALYSIS
In order to verify the application effect of the medical equipment failure life cycle refined prediction system designed in this article in the actual medical equipment failure prediction, the X-ray machine, electrocardiogram diagnostic instrument, and constant temperature incubator used in a third-class hospital were selected. Each application target selects eight state parameters, respectively, named B11–B18, B21–B28, B31–B38. The system in this paper is used to predict the failure of the above three application targets, and the experimental results are as follows.
A.FAILURE TYPE PREDICTION
For the ECG diagnostic apparatus and the constant temperature incubator, the two application targets are set as B27 and B33 parameter failures. The system in this paper is used to predict the failure types of ECG diagnostic equipment and constant temperature incubators, and the results are shown in Figs. 4, 5.
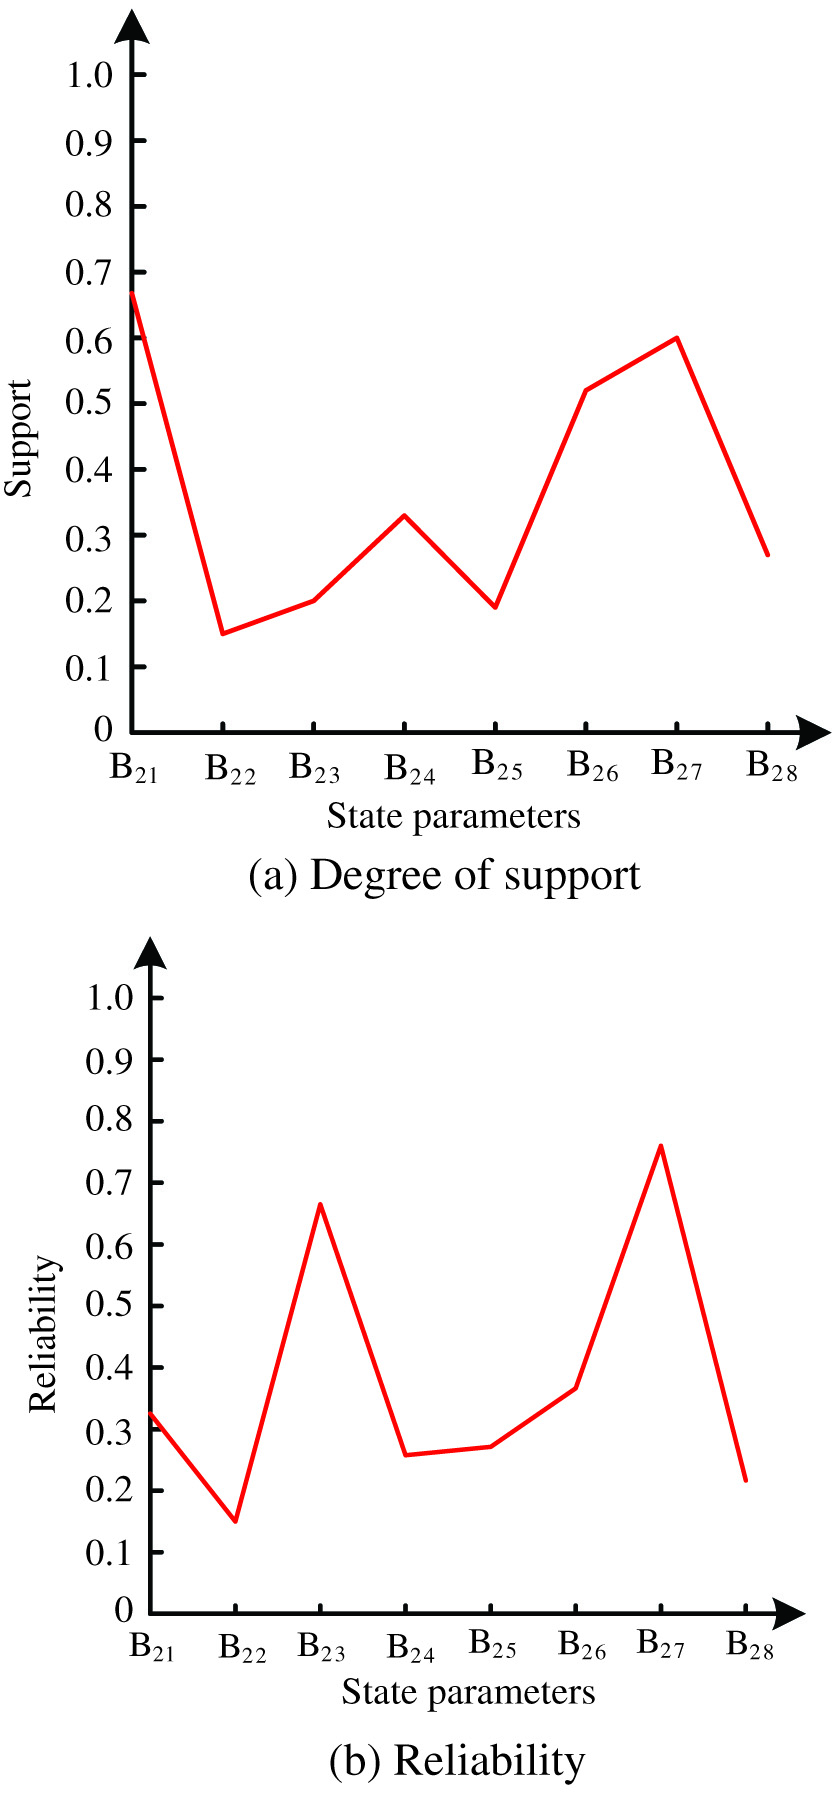 Fig. 4. Prediction results of fault types of ECG diagnostic equipment.
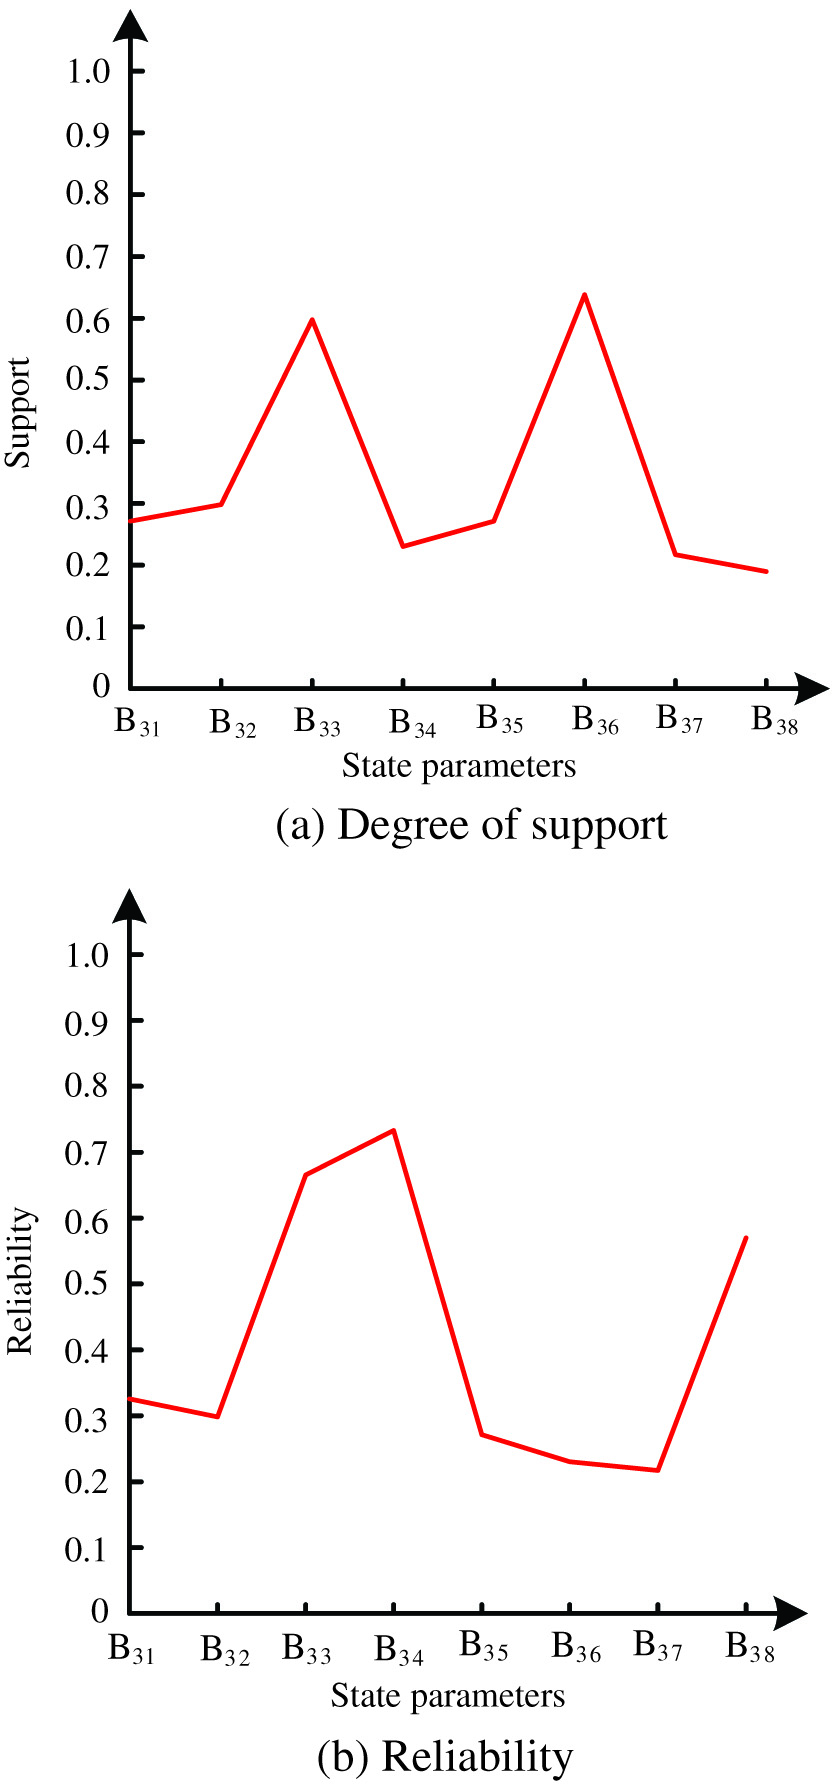 Fig. 5. The prediction results of the fault type of the constant temperature incubator.
The reliability of this study will be based on the time function of the model as a reference, and the reliability of the prediction is mainly the prediction accuracy of the system to judge the equipment from 0 to t time.
It can be seen from Fig. 4 that the support of B21, B26, and B27 in different state parameters of the ECG diagnostic apparatus is relatively high, while the reliability of B23 and B27 is relatively high. Combining the support and reliability of the different state parameters of the ECG diagnostic apparatus, B27 is the current fault type of the ECG diagnostic apparatus, which is the same as the set fault type.
It can be seen from Fig. 5 that the support of B33 and B36 in different state parameters of the constant temperature incubator is relatively high, while the credibility of B33, B34, and B38 is relatively high. Combining the support and credibility of the different state parameters of the constant temperature incubator, B33 is the current failure type of the constant temperature incubator, which is the same as the set failure type. The results of Figs. 4, 5 show that the system in this paper can accurately predict the fault type of the application target.
B.FAILURE CAUSE PREDICTION
The failure type and failure cause of each application target are set. The failure type and failure cause of each application target predicted by the system in this paper are compared with the actual failure to verify the accuracy of the failure prediction of the system in this paper. The results are shown in Table I.
Table I. Failure Prediction Results
| Application goal | Actual failure type | System prediction results in this paper | Actual cause of failure | System prediction results in this paper |
|---|---|---|---|---|
| X-ray machine | Circuit failure | Circuit failure | Abnormal AC power supply | Abnormal AC power supply |
| Mechanical failure | Mechanical failure | Mechanical deformation | Mechanical deformation | |
| Equipment aging | Equipment aging | Part wear | Part wear | |
| Computer software program failure | Computer software program failure | Computer resources conflict | Computer resources conflict | |
| Inadequate maintenance | Inadequate maintenance | Lack of lubricating oil | Lack of lubricating oil | |
| Electrocardiogram | Mechanical failure | Mechanical failure | Part uanlie | Part uanlie |
| Circuit failure | Circuit failure | Solder joints fall off | Solder joints fall off | |
| Equipment aging | Equipment aging | Part wear | Part wear | |
| Constant temperature incubator | Inadequate maintenance | Inadequate maintenance | Mechanical connection piece falls off | Mechanical connection piece falls off |
| Circuit failure | Circuit failure | Disconnected | Disconnected | |
| Inadequate maintenance | Inadequate maintenance | Equipment contaminated with dust | Equipment contaminated with dust |
Analyzing Table I shows that the prediction results of the system failure types and failure causes in this paper are completely consistent with the actual failure types and failure causes, which shows that the system in this paper can accurately predict the failure causes of each application target.
C.SYSTEM VERIFICATION
The sinc function is used to verify the system in this paper. This function is commonly used in functional regression verification problems. After preprocessing the experimental data, the embedding dimension is determined according to the final prediction error F specification, and the optimal least square support vector machine model is obtained. Two models for the period term and the trend term are constructed separately, and the experimental data are implemented to predict. In order to highlight the advantages of the system in this paper, the system based on failure mode and effect analysis (Reference [4]) and the system based on LabVIEW (Reference [5]) are used as comparative systems. The predictive performance of different systems is shown in Fig. 6.
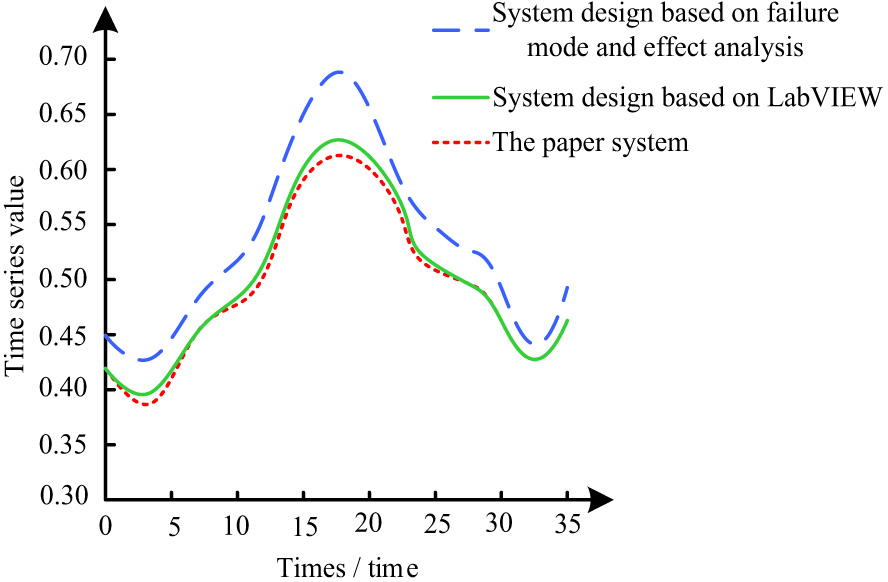 Fig. 6. Sinc function comparison results.
From Fig. 6, the prediction error of the system in this paper is the smallest among the three systems. The calculation time of the system program is also the shortest, which shows that the prediction performance of the system in this paper is significantly better than the comparison system.
V.CONCLUSIONS
The medical equipment failure life cycle refined prediction system designed in this paper can accurately predict its failure category and failure cause. The system in this paper still has defects in some aspects. Due to the limitation of research time, subsequent optimization will optimize the system as a whole. On the basis of accurately predicting failures, system performance has been comprehensively improved. The key contributions of this study are as follows: (1) This study designs an accurate prediction system for the failure life cycle of medical devices, including a four-module system. The empirical analysis shows that it can work better. (2) This study optimizes the prediction system using the AFS-ABC algorithm to obtain the optimal model with regularization and width parameters for good prediction. (3) After comparing with similar prediction systems, this study’s proposed system has a minor prediction error and the shortest program running time.