I.INTRODUCTION
Nowadays, one of the most important food sources is the agricultural production field, and more than 30% of the human food consumption is lost in some phases of the supply chain. There are multiple open problems in agricultural production in some of the phases involved in the supply chain process and plant care processes. One of the most relevant affectations in agricultural production is the problem derived from poor plant care with 40% of affection, being reactive to pests and diseases of the plants [1]. Based on data from Food and Agriculture Organization, an estimated 1.3 billion tons of food is lost or wasted every year in the world [2]. Moreover, the waste existing during the production phase reaches 28% of the total evaluated [2]. On the contrary, food waste in Latin America is considered to be 127 million tons per year which means 9.8% of world waste [2]. Thus, having efficient agricultural practices allows obtaining an optimum use of the crop, a reduction of environmental pollution, and reduction of waste [3]. At present, these practices allow the farmer to supply the necessary amount of nutrients to the plants, at the time they need them.
Specifically, the tomato represents one of the most important economic and agricultural products in the world [4]. Due to the production standards that this fruit has achieved over the years, it has allowed the demand to have increased considerably, nationally, and internationally due to its quality, performance, and profitability. In Mexico, tomato crops have increased by 50% over the years. Thus, in 2010, more than 54 thousand hectares for its cultivation were destined. In 2014, based on data obtained by the Mexican Agrifood and Fisheries Information Service (SAGARPA, from Spanish), tomato crops took second place while chili cultivation continued taking first place in crops in Mexico [4]. Moreover, Mexico is considered the main tomato supplier worldwide with a market share of 25.11% of all world exports [5].
Tomato is a perennial plant that grows as an annual crop belonging to the Solanaceae family which includes different crops such as chili peppers, potatoes, eggplant, among others [6]–[9]. Tomato harvesting can be carried out throughout the year. However, it is important to consider that extreme low-and-high temperatures can damage the plant [10].
One of the difficulties with the tomato crops is nutrient deficiency due to its impact on the quality of the plant and the fruits. Nitrogen, phosphorus, and potassium are known as primary nutrients vital for many plants including tomatoes. Multiple research works [11], [12] have reported symptoms in the leaves of tomato crops where those nutrients are deficient (see Fig. 1 as reference). For example, large leaves of the plant change from green to yellow, and the small ones turn pale when there is a lack of nitrogen. Leaf veins of the plant turn purple color in absence of phosphorus, and lacking potassium turns the edges of leaves yellow [13]. Tomato, over decades, has become one of the most used crops as commercial and homegrown crops due to that this product is used in a large number and variety of international dishes and can be consumed in different presentations, which allows its high acceptance by users and is one of the sources of vitamins and minerals present in their diet [14]. As a result, searching for technological and innovative solutions to enhance the best practices in these kinds of crops has increased. For example, precision agriculture and robotics have been implemented [15], as well as sensor-based and vision-based monitoring [16]–[20]. In a previous work [13], we designed a simple convolutional neural network (CNN) that was able to predict the nutrient deficiency in tomato crops using an image of their leaves. After different experiments, results show that this CNN model performed with an accuracy of 86.59% [13].
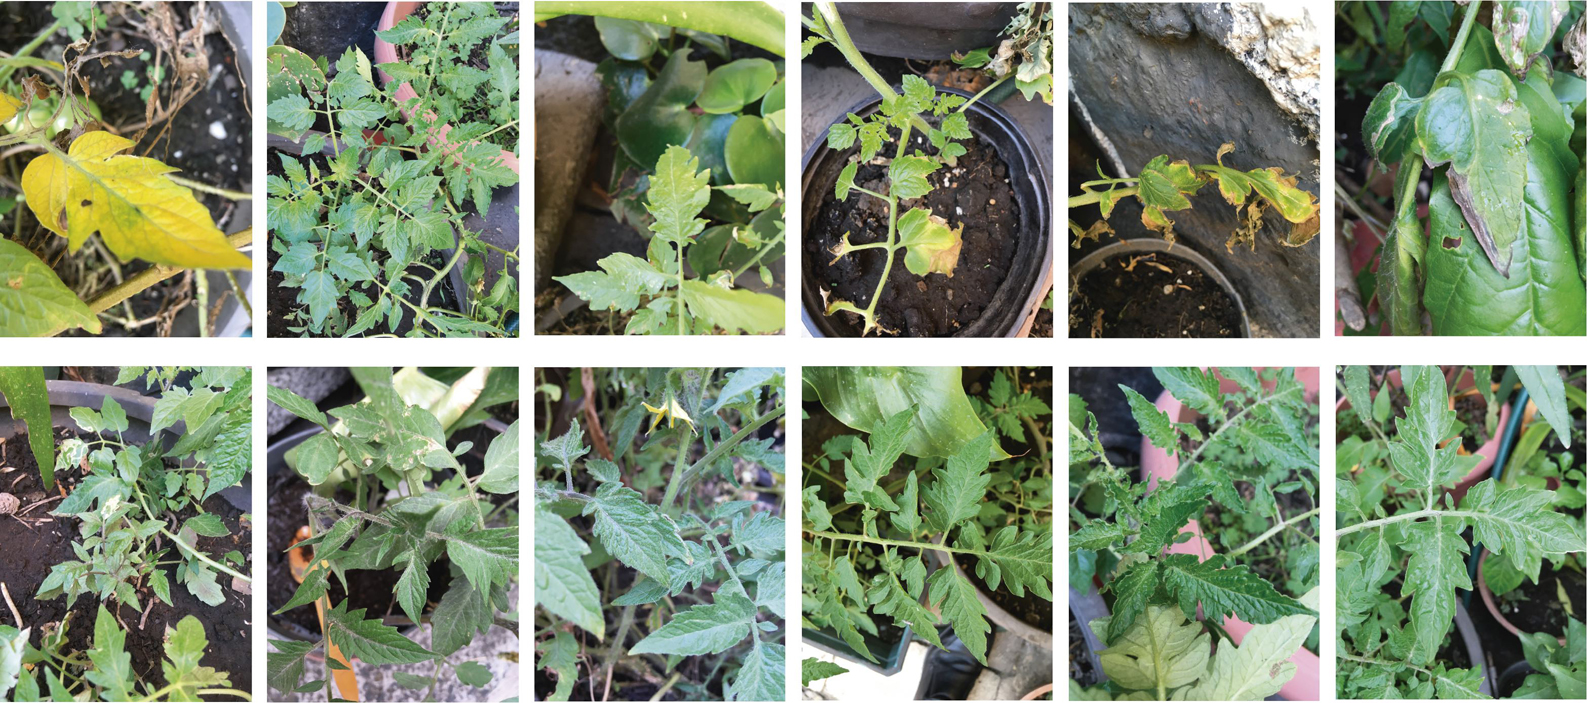 Fig. 1. Examples of images in our dataset. It shows different views of the tomato leaves. For instance, yellow leaves represent deficit of nitrogen, purple veins in leaves are related to deficit in phosphorus, and deficit of potassium are those leaves with yellow edges.
In this work, we propose a novel CNN-based model, namely, CNN+AHN, for estimating low nutrients in tomato crops using an image of the tomato leaves, as part of a vision-based monitoring system (as shown in Fig. 2). The architecture of this CNN+AHN model comprises a set of convolutional layers, as feature extraction, and an artificial hydrocarbon network (AHN) model as the dense layer. Roughly speaking, AHN is a supervised learning method [21] that models data using carbon networks as inspiration that promotes modular organization of data, structural stability of data packages, and inheritance of packaging information [22].
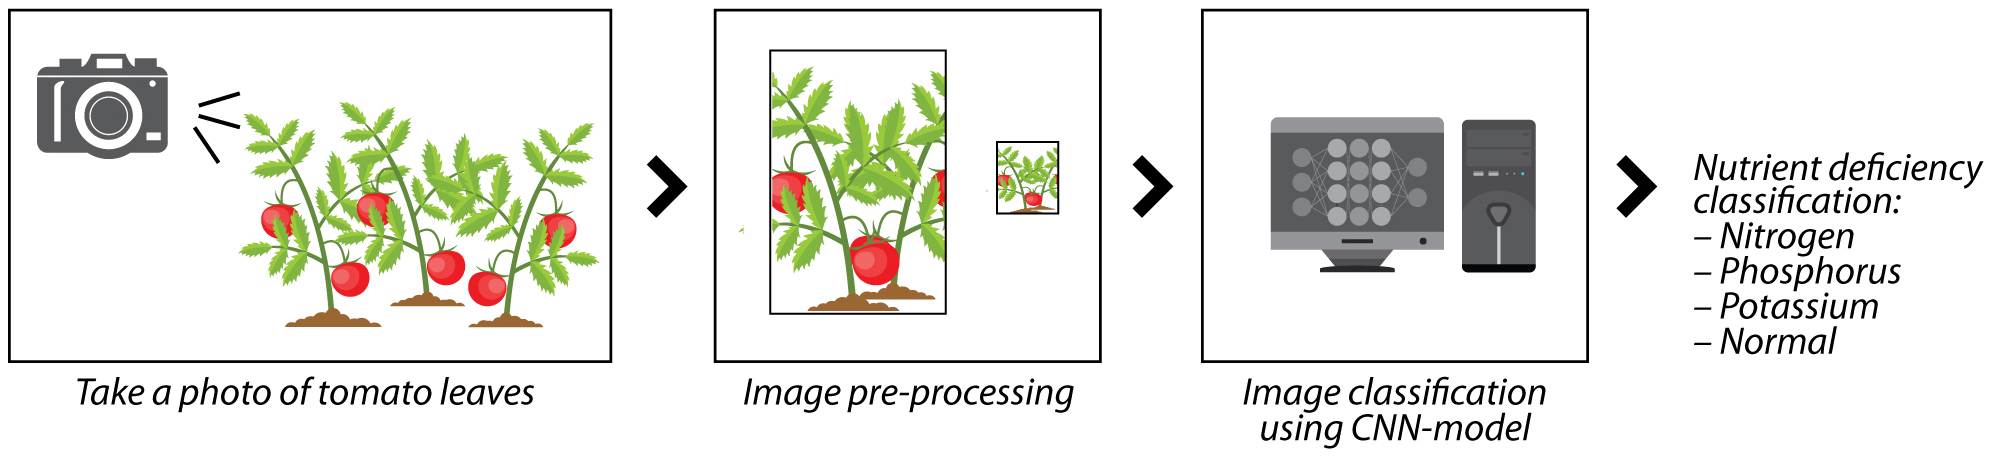 Fig. 2. Schematic of the vision-based monitoring system for detecting low nutrients in tomato plants.
In this regard, our proposed CNN+AHN is able to detect if a tomato plant has low nitrogen, potassium, or phosphorus. For designing, we first build a CNN model using Bayesian optimization to define a suitable architecture (number of convolutional layers) and other hyperparameters for the training process. Then, the dense layer of the CNN is replaced with an AHN to improve the performance of the full network. We train and test the CNN+AHN using a public dataset that we released previously [13]. For comparison purposes, we compare our CNN+AHN with three models: our CNN model developed in [13], the single CNN model, and a CNN+AHN with an intermediate feature reduction layer. The results show that our best CNN+AHN model is able to estimate low nutrients in tomato plants with an accuracy of 95.57%.
The main contribution of this work consists of developing a new classification model, that is, CNN+AHN, for monitoring nutrients deficiencies in tomato crops based on images of their leaves. To the best of our knowledge, this is the first time that a combined CNN-and-AHN architecture is developed.
The remainder of the paper is organized as follows: Section II presents the related work of relevant technologies used in agriculture, giving some examples. Section III presents our methodology for building and evaluating the CNN+AHN model. Section IV presents the results of our CNN+AHN model. Finally, Section V highlights the conclusion of this work.
II.RELATED WORK
One of the major improvements over the years in agricultural technology has been the robotics field. Robotics have been adopted in multiples countries and regions and have become more popular. In Japan, for example, Noguchi and Barawid [23] presented the usage of mobile robots in the form of tractors to perform the necessary tasks within the rice, soybean, and wheat crop. These tasks as sowing of seeds, cultivation of plants, fertilization, and monitoring of the crops, and harvest of the final product. The project was designed to cover large farmland, focusing on user safety with the use of multiple inexpensive sensors and having a system for locating and searching for better trajectories.
Different investigations have been carried out to protect crops from climate change and pollution factors. In [16], Hemming et al. presented a room equipped with different robots, sensors, and specialized areas in each type of cultivated plant. This room can control temperature, humidity, and pressure, allowing it to adapt to any type of plant. However, this has not been fully automated, requiring human intervention to perform certain tasks such as supervision of the tasks performed by the robots or detection of the color of the fruits to be harvested.
To achieve high quality in the cultivated food and crop safety for the user and the final product, the use of robotics in agriculture has been successfully applied, and projects based on good agricultural practices have been carried out with the help of measurement tools, performance sensors, and analysis software seeking to implement a controlled harvest [15].
The use of vision-based applications in agricultural problems has incremented over the years, for example, to calculate the necessary amount of treatment to achieve specific exterior maturation of freshly harvested oranges for final consumption, a project based on image processing was carried out to detect their coloration [24]. To perform the evaluation, it was necessary to have an Android device and the use of its camera. The calculation obtained from the detected image shows the amount of treatment necessary based on the established color indices. Furthermore, vision-based systems have been used for color detection and analysis of the tomato during its growth [17]–[20], and thus finding the ideal date to harvest and sell the product. Also, this type of technology has been used during the phase of accommodation and distribution of the product, where the tomato can be classified as defective or nondefective, and mature or immature for its separation.
Hence, based on the detection of the color of fruits, it is possible to determine the ripeness of the fruit at different stages of the supply chain, being the principal ones during the growth and the harvest of the plant. There are different works based on the color of the fruit peel to be evaluated. For example, in [25] the authors analyzed the coloring of papaya for its final harvest. With this, it is sought to obtain better products for sale and final consumption without having to use physical and chemical processes to obtain the required maturation.
As described before, the previous projects have the advantage of using accessible technologies for a better quality of the final product; however, it only focuses on the analysis of a single fruit (e.g., tomato or papaya) and its harvest time, not on the rest of the plant and its complete life cycle.
Deep learning methods in vision-based problems have been used to analyze the characteristics of the leaves of different plants and thus to detect diseases or pests. In [26], it is presented a system capable of detecting the lack or excess of nutrients in plants. It is important to work with plant pests and diseases to save on resources such as pesticides; however, it is important to focus on plant nutrients and deficiency thereof to obtain healthy plants and quality products. For example, the authors in [27] present a one-dimensional fully convolutional network to quantitatively analyze the nicotine composition of tobacco leaves using near-infrared spectroscopy data via the cloud. A similar work [28] using the residual network is proposed for classifying regions of tobacco cultivations.
In this work, we take advantage of deep learning to analyze the leaves of the tomato crops for detecting nutrients deficiency. Another successfully vision-based application of deep learning [13] is where with a simple CNN predicting the nutrient deficiency in tomato crops using an image of their leaves, the results show that this CNN-based work achieved 86.59% of accuracy metric using the same dataset used in this work [13].
The current work is based on our previous research [13] in which we showed that a simple nonoptimized CNN model is able to perform an accuracy of 86.59%. For that, we collected and released a public dataset of tomato leaves with their nutrient levels. Then, we performed four different experiments using the original dataset, a set of enhanced images from the dataset, the original images augmented with others from the Internet, and the enhancement of the original plus the augmented images. In contrast, the current work assumes that a CNN model is able to perform the classification task of low nutrients detection. Then, we improve the architecture of the CNN via Bayesian optimization and the inclusion of the AHN model at the dense layer. We outperformed our previous work as shown in Section IV.
III.MATERIALS AND METHODS
This section describes the CNN+AHN classification model for estimating the low nutrients in a tomato plant using an image of its leaves as input. This CNN+AHN model is part of a vision-based monitoring system for tomato plants. The details of the overall monitoring system and the development of the proposed CNN+AHN model are described in the following, as well as the description of the machine learning methods implemented in this work.
A.FUNDAMENTALS
First, we describe in general the machine learning methods—CNN and AHN—implemented in this work.
1)CNNs
These networks have three factors involved in their learning process: sparse interaction, parameter sharing, and quasi-variant representation [29], [30]. CNN is a multilayered neural network that consists of two different types of layers: convolution layers (c-layers) and sub-sampling layers (s-layers). C-layers and s-layers are connected alternately and form the feature extraction part of the network. The input data pass through convolutions using trainable filters. After that, a pooling layer is implemented to reshape the features in a one-dimensional array that is input into a fully connected network used for classification. Typically, the fully connected network works similarly to a standard multilayered perceptron with a Softmax layer at the output [29], [30].
2)AHNs
AHN is a supervised learning method [21] that models data using carbon networks as inspiration. It loosely simulates the chemical rules involved in hydrocarbon molecules to find a way for representing the structure and behavior of data [31]. Its key feature can be described as the ability to package data in units of so-called molecules. Then, packages are organized and optimized through heuristic mechanisms based on chemical assumptions that are encoded in the training algorithm [22].
A molecule consists of a kernel function with a set of weights, as in (1), where is the feature vector of the input data, is a set of weights namely the hydrogen values, is a vector of weights namely the carbon value, and is the maximum number of hydrogen values associated to one molecule. Jointly, those weights are known as molecular parameters, and they resemble the hydrogen and carbon atoms of a hydrocarbon molecule in nature.
Molecules are arranged in groups so-called compounds. Those are structures that represent nonlinearities among molecules. They are associated with a functional behavior as in (2), where is the number of molecules in the compound and is a partition of the input such that , and is the center of the -th molecule [22]. In fact, if . The compound behavior written in (2) is known as linear chain of molecules since it is similar to organic chains in chemical nature [31].
Compounds can interact among them in definite ratios , namely, stoichiometric coefficients or simply weights, forming a mixture . It is represented in (3), where is the number of compounds in the mixture and is the weighted factor of the -th compound. The latter can be calculated using the least-squares estimates method [31].
The literature has reported different training algorithms for AHN. They differ in terms of how to approach the learning process of the molecular parameters and the centers of molecules. In this work, we adopted the stochastic parallel extreme (SPE-AHN) training algorithm, and further details can be consulted in [22].
B.VISION-BASED MONITORING SYSTEM
The CNN+AHN is immersed in a vision-based monitoring system. The system comprises three main steps. The first one is taking a photograph of a tomato plant (Section III-B-1). The second is to preprocess the image for resizing and contrast enhancement (Section III-B-2). And the third is to use the CNN+AHN model to classify the type of low nutrient detected in the plant (Section III-C). The overall system is depicted in Fig. 2.
1)NUTRIENTS LEVEL IN TOMATO PLANTS DATASET
In this work, we use a previous dataset that we obtained from this monitoring system [13]. The dataset was collected for 10 weeks, from tomato plants harvested in separate pots (one per primary nutrient) located in the backyard of a house in Mexico City, Mexico. The backyard consisted of a direct sunlight place with temperatures ranging from 22°C to . Three plants were grown in the pots and were added with the primary nutrients—nitrogen, phosphorus, and potassium—once per week. The level of nutrients was measured using Rapitest chemical nutrient testers soil kits. In the end, 596 images of px size were stored in the dataset: 213 lacking nitrogen (nitrogen), 168 lacking potassium (potassium), 94 lacking phosphorus (phosphorus), and 121 with normal level of nutrients (normal). Examples of images in the dataset are shown in Fig. 1.
2)IMAGE PREPROCESSING
In our previous work [13], we proved that contrast enhancement and image resizing improve the performance of the machine learning classifier. In the current work, we adopted the same preprocessing for the images to be consistent with the comparative process.
First, we apply contrast enhancement to the original images emphasizing the color of the leaves using the gamma transformation to the Red-Green-Blue (RGB) channels [32], as shown in (4), where is the input gray level (red, green, or blue intensity values) to the gamma transformation, is the maximum intensity value in the channel, is the resulting output gray level, and is the input range of gray levels to enhance. For all images in the experimentation, the value was set to 1, and we used the following input range of gray levels to contrast enhancement: for the red channel, for the green channel, and for the blue channel.
Then, we reduce the original images px) to px size to reduce the computing task in the CNN+AHN model.C.DEVELOPMENT OF THE CNN+AHN MODEL
The proposed CNN+AHN model consists of a set of convolutional layers that act as the feature extractor, and an AHN as the dense layer (Fig. 3). To design this architecture, first, we train and optimize a simple CNN model using a dataset of tomato leaves images with low nutrients labels. Then, we use the feature extraction layers of the CNN as the first part of our model, and we place an AHN in sequence. Later, we train the AHN for the classification task, to finally obtain the proposed CNN+AHN model.
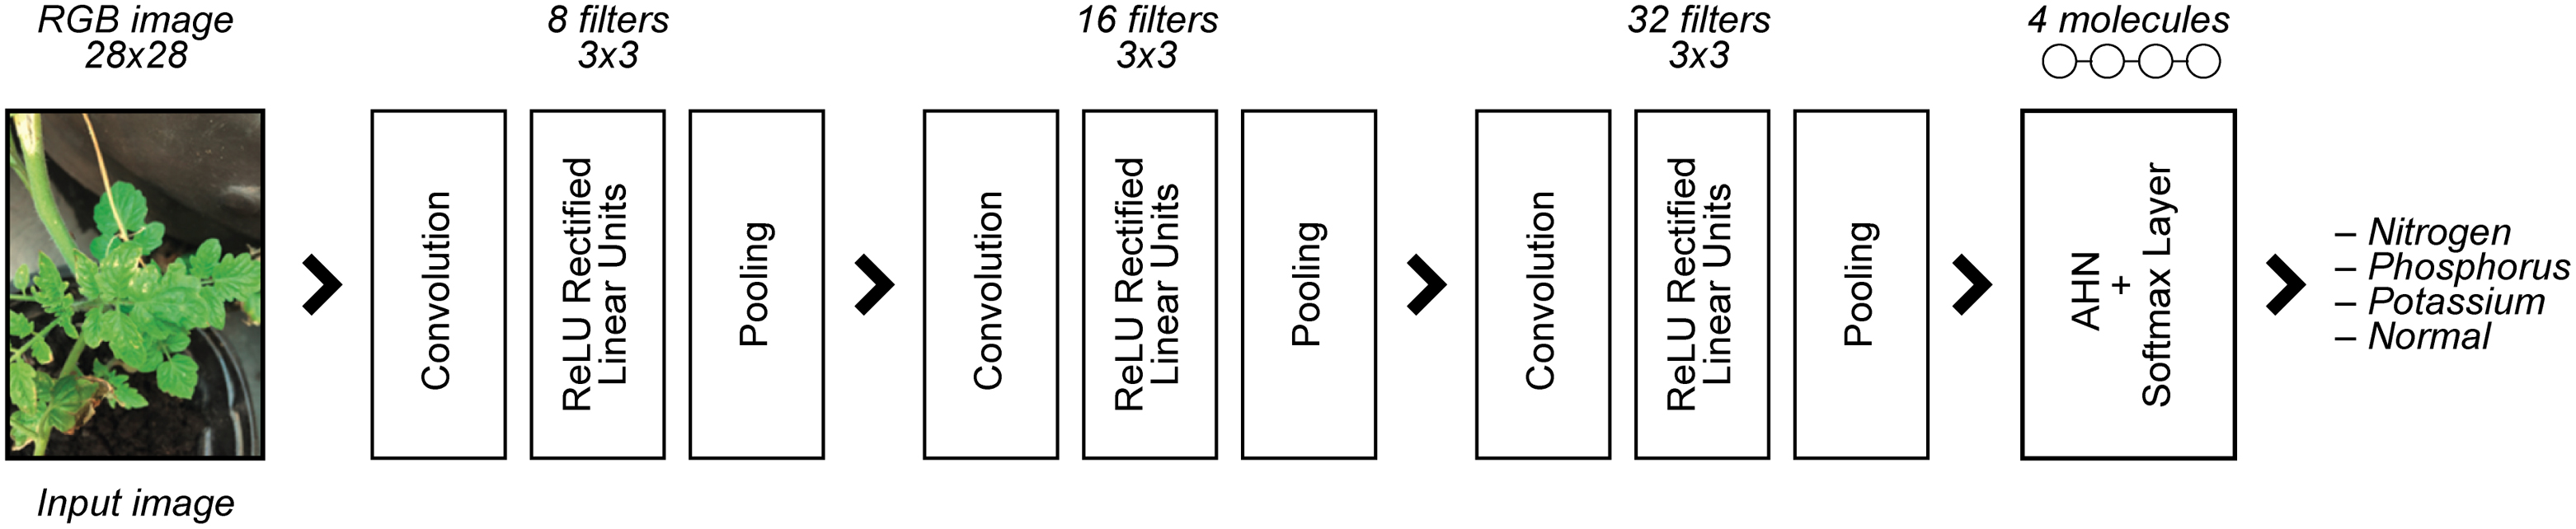 Fig. 3. Architecture of the proposed CNN+AHN model. It receives an input RGB image of the tomato leaves with 28×28 px resolution. Then, this image goes through the three convolutional-based layers and the AHN dense layer. Finally, the estimated class is output using a Softmax layer.
1)CNN MODEL BACKBONE
We propose a CNN as a backbone that receives as input a px size of an RGB color image. The image inputs into a sequence of three convolutional layers with 8, 16, and 32 filters of size. Each of these layers follows with a rectified linear unit (ReLU)-based layer and a max-pooling layer that reduces the spatial size of the maps. Finally, there is a fully connected layer with a Softmax layer of four units. The output of the CNN is a class label of the low nutrient estimated in the image. The possible classes are nitrogen, phosphorus, potassium, and normal. It is worth noting that this CNN architecture was obtained using a Bayesian optimization method [33] that searched in the following hyperparameters: the number of convolutional layers (from 1 to 5), the initial learning rate (from 0.001 to 0.01), and the regularization term (from to ). The number of filters and the filter sizes of the convolutional layers were fixed.
We used the stochastic gradient descent with momentum algorithm for training, and the optimized hyperparameters: Three convolutional layers, 0.005044 as initial learning rate, and regulation term of .
2)AHN AS DENSE LAYER
To develop the CNN+AHN model, after training the CNN, we isolate the first three convolutional layers with their respective ReLU-based and max-pooling layers. Then, we place an AHN in sequence. We use Bayesian optimization to determine the suitable number of molecules (from 1 to 20) in the AHN model, as the only hyperparameter. The output of the AHN is, then, connected to a Softmax layer to perform the classification task. Fig. 3 shows the architecture of the proposed CNN+AHN model.
To train the AHN dense layer, we input the images into the CNN and we get the output of the last max-pooling layer. These outputs were used as inputs to the AHN, and the same class labels were used as targets. We used the SPE-AHN algorithm to train the AHN with four molecules.
3)FEATURE REDUCTION LAYER
The literature reports that large number of features in data might reduce the predictability power of the AHN [22]. To minimize the impact of large number of features from the last convolutional layer, we propose to implement a feature reduction layer in the CNN+AHN before the AHN. To do so, we use principal components analysis (PCA) [34] to reduce the number of features. This reduction layer takes the convolutional features as input, then principal components are computed, and finally, a subset of the first components are selected that explain a given degree, that is, threshold , of data variance. For this work, we select a threshold of of explained variance. Finally, those components are the inputs of the AHN layer.
D.EVALUATION
We evaluate the performance of the CNN+AHN classifier with widely used metrics in machine learning [35]: accuracy (5), precision (6), sensitivity (7), specificity (8), and F1-score (9), where refers to true positives, to true negatives, to false positives, and to false negatives.
From our previous work [13], we determined that the training of models is better with an augmentation of the dataset. In this regard, the current work adopts the same augmentation procedure that consists of 84 images retrieved from the Internet. Those were collected manually by inspection, and the level of nutrients was tagged using the information in the description of the web sources. The augmented images were also preprocessed in the same way as the original images.
All the experiments were implemented in MATLAB using the Deep Learning Toolbox, and a personal computer Dell with processor Intel Core i7-8850H at 2.6 GHz, six CPU cores, and 16 GB in RAM.
IV.RESULTS AND DISCUSSION
We compare the performance of the CNN+AHN classifier with the CNN model reported in our previous work [13]. Also, we made different configurations to validate the effectiveness of the proposal, e.g., the single CNN model (backbone), the CNN+AHN, and the CNN+AHN with a PCA layer.
For the experiments, we conduct a fivefold cross-validation approach for each of the models. In Table I, we report the mean and standard deviation of each model with respect to the performance metrics.
TABLE I Performance Evaluation of the CNN+AHN and the Different Configurations
| Model | Accuracy (%) | F1-score (%) | Precision (%) | Sensitivity (%) | Specificity (%) |
|---|---|---|---|---|---|
| Baseline CNN [ | 86.59 (2.34) | 81.36 (1.87) | 81.22 (1.54) | 81.94 (2.68) | 93.05 (1.07) |
| Single CNN (backbone) | 93.83 (1.72) | 93.72 (1.64) | 93.56 (1.64) | 93.92 (1.68) | 97.80 (0.65) |
| CNN+AHN | 95.33 (0.17) | 95.23 (0.20) | 95.43 (0.21) | 95.18 (0.26) | 98.34 (0.07) |
| CNN+AHN and PCA layer |
Bold numbers represent the best performance in the metric. The representation of numbers is: mean (standard deviation).
Table I shows that the baseline CNN model reported in [13] performs with an accuracy of . It is far from the new results found in this work. For instance, the CNN backbone classifier performs with an accuracy of and the proposed CNN+AHN gets an accuracy of and when no having and having PCA layer, respectively. This gives an insight that the combined CNN+AHN improves the performance of the single CNN model in all the metrics. Moreover, the standard deviation of the single CNN model is slightly larger than the one computed with the CNN+AHN.
Fig. 4 shows the confusion matrix of the best model obtained during the cross-validation using the CNN+AHN with PCA layer (accuracy: 95.57%, F1-score: 95.75%, precision: 95.94%, sensitivity: 95.61%, specificity: 98.40%). It can be observed that mainly all images are well classified with the target low nutrients, except where the target class is potassium, and the model incorrectly classifies the image as nitrogen. This can be explained since low nitrogen is related to yellow leaves and low potassium to leaves with yellow edges. This condition is difficult to discriminate visually.
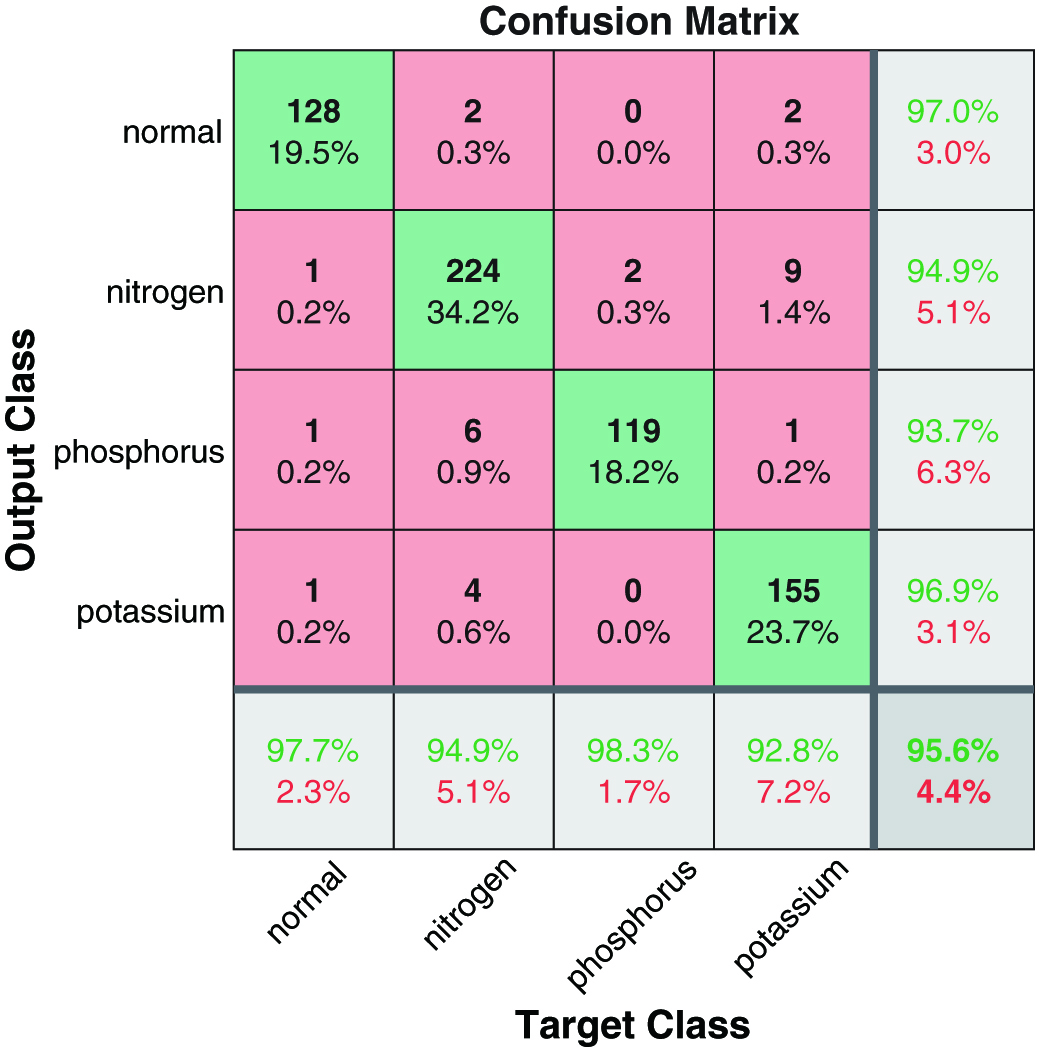 Fig. 4. Confusion matrix of the best CNN+AHN with PCA layer classifier (accuracy: 95.57%, F1-score: 95.75%, precision: 95.94%, sensitivity: 95.61%, specificity: 98.40%).
A.DISCUSSION
The experimental results show that the proposed CNN+AHN with PCA layer is the best model in terms of all performance metrics evaluated in this work. As noticed, the single-optimized CNN classifier found in this work is better than the previous baseline CNN. Also, the optimized CNN classifier is able to transfer the feature extraction layers into the CNN+AHN in which the response is slightly better in all the metrics (mean and standard deviation). However, the CNN+AHN with PCA layer does not represent a major improvement. A reasoning to choose CNN+AHN with PCA layer as the best model, in contrast with the CNN+AHN without the PCA layer, is that the feature reduction impacts positively in the number of learning parameters that has the AHN. In this regard, the AHN associated to the one without the PCA layer has 28,224 learning parameters while the AHN with PCA layer only has 5,634, that is, a significant reduction.
The advantages of our method are that the CNN+AHN classifier significantly improves the vision-based monitoring system for anticipating the insufficiency of primary nutrients in tomato crops using only images from leaves. Also, it is validated that the CNN+AHN works with different images with no restrictions on how to take the photograph (angle or distance). Some weaknesses of the proposed CNN+AHN are that the dataset is very limited, so a large dataset is required for robust validation. Also, the CNN+AHN was not evaluated for different intensity light. Also, the resizing preprocessing might delete interesting features that were not taken into account in this research. Finally, the CNN+AHN was validated in tomato leave images, thus no other crops are considered so far.
To this end, and to the best of our knowledge, this is the first time that the combination of CNN and AHN is done for a vision-based monitoring system to detect low nutrients in tomato plants. Therefore, we consider our current work to be very promising for future precision agriculture applications. Currently, we manually photograph the tomato leaves. Later, we could adopt the drone approach [36] to automatically and systematically photograph the tomato leaves based on the planned paths to extend our research to massive farming lands.
V.CONCLUSIONS
This work proposed a CNN+AHN classifier to estimate low nutrients—nitrogen, phosphorus, or potassium—in tomato plants using an image of their leaves. The method consisted of a hybrid model divided into two parts. The first comprises a set of convolutional layers that act as the feature extraction process. Then, a PCA layer was used to reduce the number of features that enters to the final layer comprised of an AHN with a Softmax function. We optimized the CNN backbone and the AHN separately.
Based on the comparative results, against the baseline CNN from previous work and different architecture configurations of the CNN+AHN, we validated that the CNN+AHN with PCA layer performs the best in terms of accuracy, F1-score, precision, sensitivity, and specificity. Also, the incorporation of the PCA layer allows us to propose a lighter version (in terms of the learning parameters) of the CNN+AHN.
Currently, we manually photograph the tomato leaves. For future work, we could adopt the drone approach [36] to automatically and systematically photograph the tomato leaves based on the planned paths to extend our research to massive farming lands. Applying the methods to other agriculture products is also possible. Also, we are considering increasing the original dataset, conducting a robust comparative study with sensitivity analysis of the different hyperparameters that might influence the CNN+AHN model, and developing a multilabel classifier to predict a combination of low nutrients in the same plant.