I.INTRODUCTION
An estimated 3.7 million people in the United States have severe speech and language impairments due to various medical issues such as autism, cerebral palsy, aphasia, and amyotrophic lateral sclerosis. Augmentative and alternative communication (AAC) is used to supplement or replace speech for them in the production or comprehension of spoken language [1]. One type of AAC uses high-tech AAC devices to communicate with others. AAC users without physical impairment use their hands/fingers to select words/icons on a device’s touchscreen to produce a computer voice to express what they want to “say.” To improve AAC users’ communication performance, evidentiary interventions are necessary to help users utilize the device functionalities effectively [1]. AAC intervention is expensive and time consuming [2], [3]. A successful intervention relies on accurate log data collecting and active outcome monitoring [4], [5]. However, various types of AAC devices on the market have their own data collecting systems and are not compatible with each other. Thus, the current AAC field has no comparable means to gather, share, access, or analyze a large pool of logged data to study the statistical correlation between AAC users’ performance and technical variables during the intervention. In the AAC clinical and research communities, practitioners need a set of easy-use, objective measurement, and accurate logging toolkits that can work with all AAC devices for both clinical and research purposes.
Previous AAC studies have demonstrated the success of using automatic data logging (ADL) to monitor AAC users’ language and communication performance in research contexts [4], [6], [7]. ADL has two basic variables: the timestamp and the text output. Some extra variables may be available associated with different access methods: keyboard typing, eye gazing typing, and so on [8]. According to the study done by Chen et al. [8], by utilizing different ADL formats with various variables, AAC practitioners could compare AAC users’ performance between different data logs. However, the existing ADL can only capture the AAC usage data without distinguishing its producers (users). In clinical settings, AAC intervention sessions usually involve multiple participants (an AAC user, a clinician, family members, and other communication partners). Most of the time, only one AAC device is used. While an AAC user practices on the AAC device, other participants use the same device to provide modeling to help the user to learn words and functions on the high-tech AAC system [9]. Therefore, when reading the ADL files after sessions, it is difficult to differentiate who generated particular words. Fig. 1(a) shows the ADL generated by CoughDrop [10]. By reading the ADL data, it is impossible to know if the three lines were generated by the AAC user only or other participants. This limitation not only reduces the validity of data logs and the accuracy of performance analysis including semantic analysis, syntactical analysis, and usage efficiency [11], but also further impedes the efficiency of AAC services. The current solution for this limitation is to have clinicians manually clean the ADLs (filtering or labeling) by using predetermined guidelines [7] or comparing the ADLs with the recorded videos from intervention sessions with human vision. These methods are not only time consuming and labor intensive but also error prone. In addition, it reduces the time that clinicians can work with AAC users.
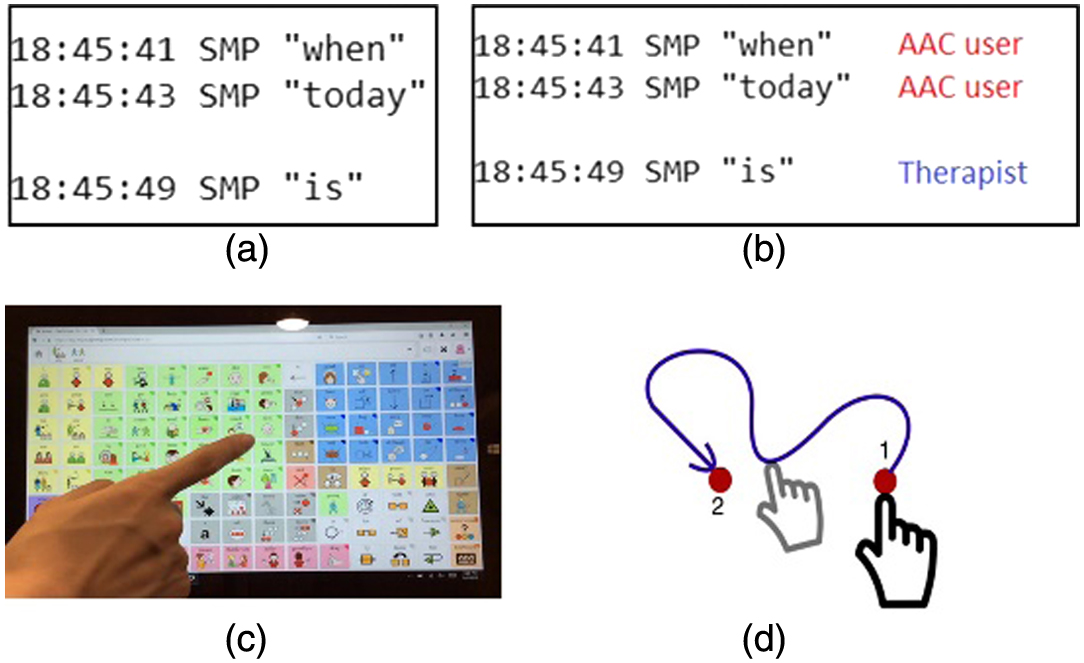 Fig. 1. Example of AAC use with its automatic data log (ADL) and the proposed SAIL.
Although hand gesture analysis is common in other fields, so far no related computing and analysis study has been applied in the AAC field. Thus, we are working on a visual-based logging system to make the data logging user (speaker)-aware-able by analyzing AAC usage videos. Ultimately, the AAC data logs will have an additional attribute indicating the producer of each event (see the example in Fig. 1(b)). The essential part of this novel speaker-aware information logging (SAIL) system is to recognize all participants from the videos, where the hands are in an egocentric viewpoint (see Fig. 1(c) and (d)). The contributions of this work are twofold:
- •Collect egocentric hand gesture images with labeled tags, which is the first labeled image dataset in the AAC field.
- •Present a proof-of-concept application that utilizes a deep neural network to classify different AAC participants using the same device.
In the rest of this paper, Section II introduces some related work; Section III presents the framework in detail; Section IV provides the evaluation results; and Section V draws conclusions and describes future work.
II.RELATED WORK
Many works employ deep convolutional neural networks (CNNs) to study hand-object interactions in an end-to-end framework [12], [13]. In contrast to these approaches, our solution involves the use of first-person activity recognition, where human hands are naturally the only information we can get as far as the movements are concerned. Therefore, in the context of representing activities, object manipulation and hand movements are the main source of visual information.
Thus, related works in this category describe activities using an object-centric approach that derives from the existence of specific objects in the scene [13]–[16]. Moreover, scene understanding is also used in [17]. In [18], a multitask clustering framework tailored to first-person view activity recognition is presented. Another more recent approach uses deep CNN architectures [19] to learn deep appearance and motion clues. Deep CNNs are also used to learn hand segmentations in order to understand the multiple user activities and interaction with each other [13], [20].
Some works focus on multimodal analysis of egocentric cameras and information from other wearable sensor equipment with the deployment of early or late fusion schemes [21]–[23]. More recently, González-Díaz et al. [24] proposed CNN-based solution to control grabbing actions in an egocentric view, where an eye tracking and image processing tools are used to measure eye movements or gaze direction for target manipulation. To handle the noisy and unstable gaze signals caused by unconstrained human posture and cluttered working environment, CNN framework is utilized to process the gaze fixation signal. It can determine the target location and classify the object in an end-to-end fashion. Motivated by the need of recognizing activities of patients with critical disease in nursing homes or hospitals, Giannakeris et al. [25] analyze egocentric videos provided by patient’s wearable cameras. This setting is similar to ours. The detected objects incorporating the motion patterns into low-level microaction descriptors, Bag-of-Micro-Actions, and then, Gaussian mixture models clustering and Fisher vector encoding are used to recognize the activities.
III.METHODOLOGY
Visual information of AAC practices is captured from an egocentric viewpoint [26], where the camera faces the hand and the device screen with the same viewpoint as the AAC user’s eyes (see Fig. 1(c)). The recorded videos contain the hand/finger actions and the screen contents without the user’s face, which protects the individual’s privacy and confidentiality in clinical data. To distinguish the roles of users, wearing a colored ring on the working finger is required for some users, and the color is role dependent. For example, a green ring is for family members and the red is for therapists. AAC users can be with or without a ring. The color-role association can be decided according to user’s preferences. Based on this setting, the producers of the log data can be identified when an AAC practice video is processed by the SAIL system, where a customized deep neural network single shot detection [27] is used for this task.
A.SINGLE SHOT DETECTOR (SSD) NETWORK STRUCTURE
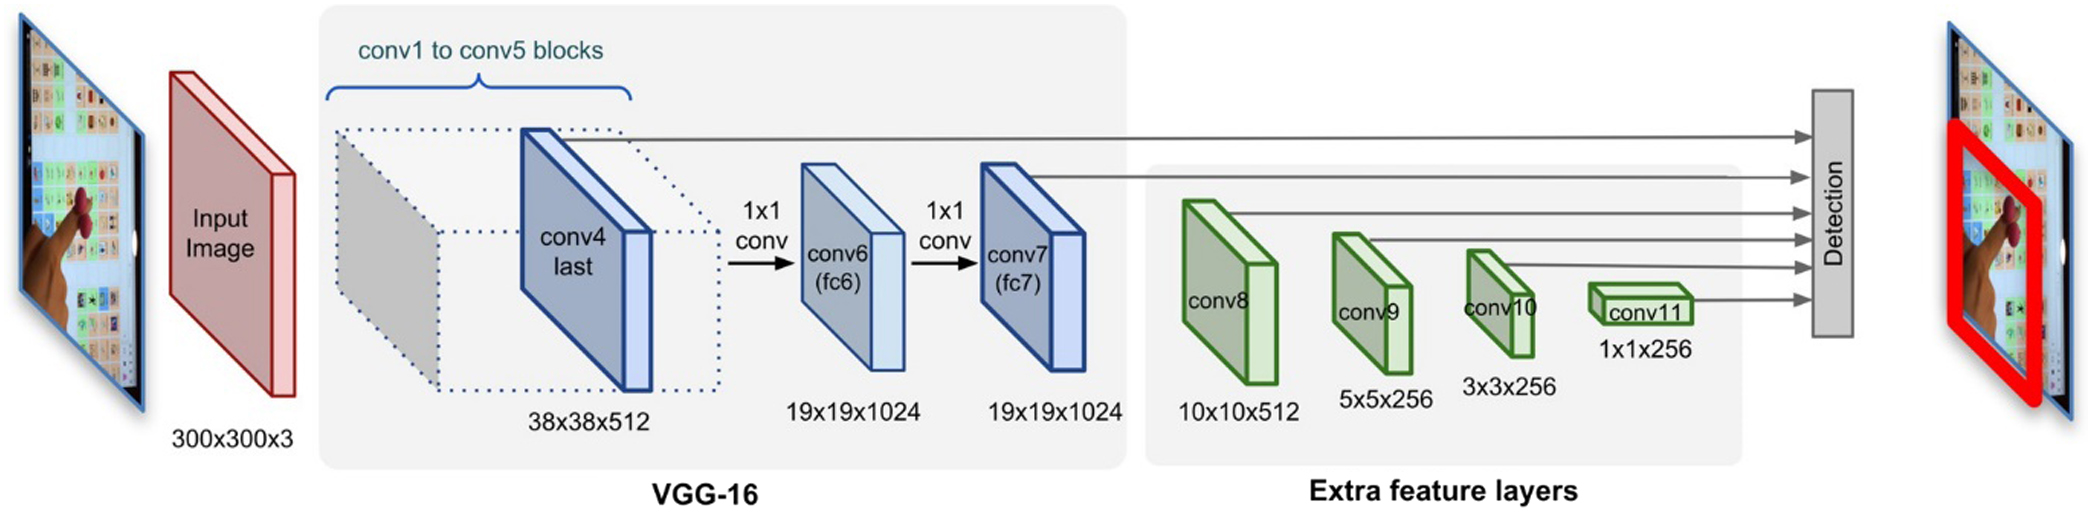
The single-shot detector (SSD)-based network structure has two parts: the base network and the auxiliary network illustrated in Fig. 2. The base network (blue blocks in Fig. 2) uses the well-established VGG-16 [28] for feature extraction, and the auxiliary section (green blocks) has several convolutional layers to predict the bounding boxes and corresponding confidence scores for detecting targets (hands). The size of the auxiliary layers gradually decreases so that different sizes of hands can be detected. This model predicts multiple boundary boxes from a single image, and then, non-maximal suppression is applied to obtain the final predictions with high confidence scores in the image. This SSD-based detection model could handle the challenges in our task, such as varied/poor lighting, diverse background, diverse view angles, and unexpected occlusions.
B.TRAINING
We train the network to determine the target box via bounding box regression, and object classification of the target box.
During training, we determine the correspondence between default boxes to a ground-truth detection. For each ground-truth box, we find its default box with the best overlap, and also match the default boxes to any ground truth with overlap higher than a threshold (e.g., 0.5). This allows the network to predict high scores for multiple overlapping default boxes rather than picking only the one with maximum overlap. The overall loss function L is a weighted sum of localization loss (loc) and the confidence loss (conf):
where N is the number of matched boxes. The weight term α helps us in balancing the contribution of the location loss. As usual in deep learning, the goal is to find the parameter values that most optimally reduce the loss function, thereby bringing the predictions closer to the ground truth. In this work, α is set to 1 by cross validation.Confidence loss (conf) measures how confident the network believes the true object is in the computed bounding box. Categorical cross-entropy is used to compute this loss:
where is an indicator for matching the i-th default box to the j-th ground-truth box of p class; and e(·) is the prediction logits of class p.Location loss (loc) measures how faraway the predicted bounding boxes are from the ground-truth ones from the training set:
where smoothL1 loss between the predicted box (l) and the ground-truth box (g) parameters is used. Here, m includes the center (cx, cy), width (w), and height (h) of default and the ground-truth boxes. By minimizing this loss, the network regresses the target to the ground-truth box.C.AAC EGOHAND DATASET
For this proof-of-concept application, we collected four videos of simulated AAC practice sessions from four different users interacting with three AAC software: CoughDrop [10], Sono Flex [29], and Proloquo2go [30]. These were downloaded from the Apple App Store and have grid-design displays, color icons, and synthesized speech output (see Fig. 3). Depending on the AAC activities in these simulation sessions, we extracted roughly 1,200 to 2,500 hand images per video, which are then manually annotated with ground-truth (GT) labels at the pixel level. There are five hand categories defined (see Fig. 3): hands with blue, red, yellow, and green rings, and a bare hand without a ring. We have collected 7,124 labeled images for our AAC egohand dataset, which are split into training and testing sets with 5,055 and 2,069 images.
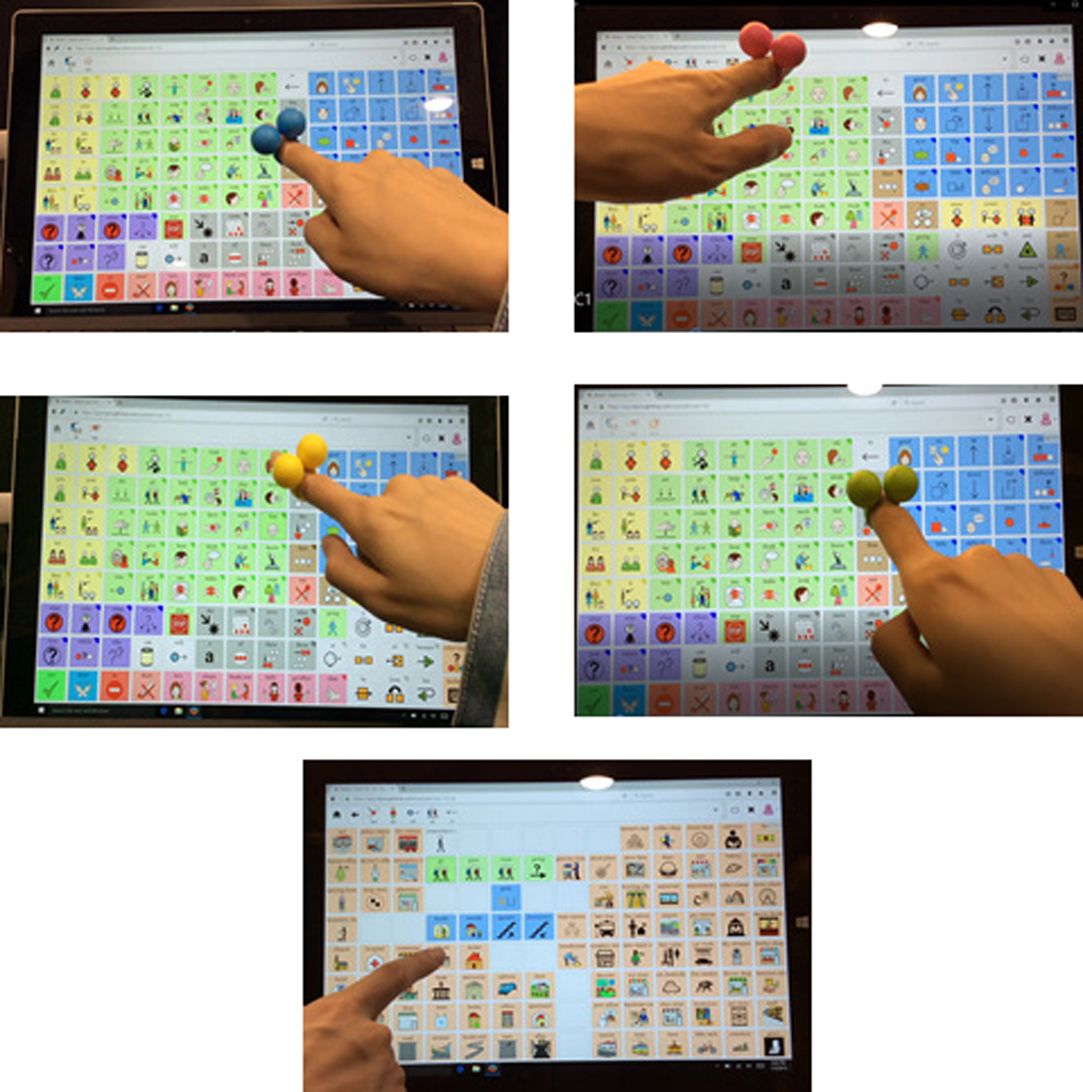 Fig. 3. AAC egohand dataset with five classes.
Since the size of our AAC egohand dataset is relatively small, we followed the fine-tuned transfer learning strategy to train our model. Specifically, an SSD model pretrained on the common objects in context (COCO) dataset [31] is publicly available and utilized as the starting point of our training process. Our specific hand detection network is further trained on our AAC egohand dataset. COCO, a large-scale object detection dataset, has 200k labeled images with 1.5 million object instances under 80 object categories. By utilizing the generic image features extracted from this large dataset, the training process for our task is efficient and effective.
D.DATA AUGMENTATION
Like in many other deep learning applications, data augmentation has been crucial to teach the network to become more robust to various object sizes in the input. To this end, additional training examples are generated. They are from the patches of the original image at different overlap ratios (e.g., 0.1, 0.3, 0.5, etc.) and random patches as well. Moreover, each image is also randomly horizontally flipped with a probability of 0.5, thereby making sure potential hand objects appear on left and right with similar likelihood.
IV.EVALUATION
A.EXPERIMENTAL SETTING AND NETWORK TRAINING
The training and testing of this proof-of-concept system were conducted on a Dell server with two NVIDIA GeForce RTX 2080 GPUs, Intel(R) Core(TM) i7-9800 3.80 GHz CPU and 64 GB RAM. The neural network is built on the deep learning framework TensorFlow 1.15 on Ubuntu 18.04 operating system. The program code is written in Python 3.7.6. The input image size is 1240 × 720 pixels, which is then adjusted to 300 × 300 during the training process. Training is a process of network updating, and is set to 200,000 iterations with batch size = 5. The initial learning rate is set to 4e-3. After 60k, 120k, and 180k iterations of training, the rate was reduced to 3.8e-3, 3.6e-3, and 3.4e-3, respectively. Table I lists the details of the training settings. The goal of training is to minimize the difference between the predictions and the ground truth. Such differences are represented by the loss values. For the object detection tasks, there are two types of losses: classification loss and localization loss. Localization loss gives the distances between the predicted boxes to the target object (hand), while the classification loss reflects the recognition errors on the predicted target boxes. The total loss combines both with corresponding weights. Fig. 4 shows the total loss curve during the training process, which has a rapid downward trend at the beginning, and then slowly decreases until convergence. The training loss is eventually stable and reaches the minimum value 1.63 at 200,000 iterations.
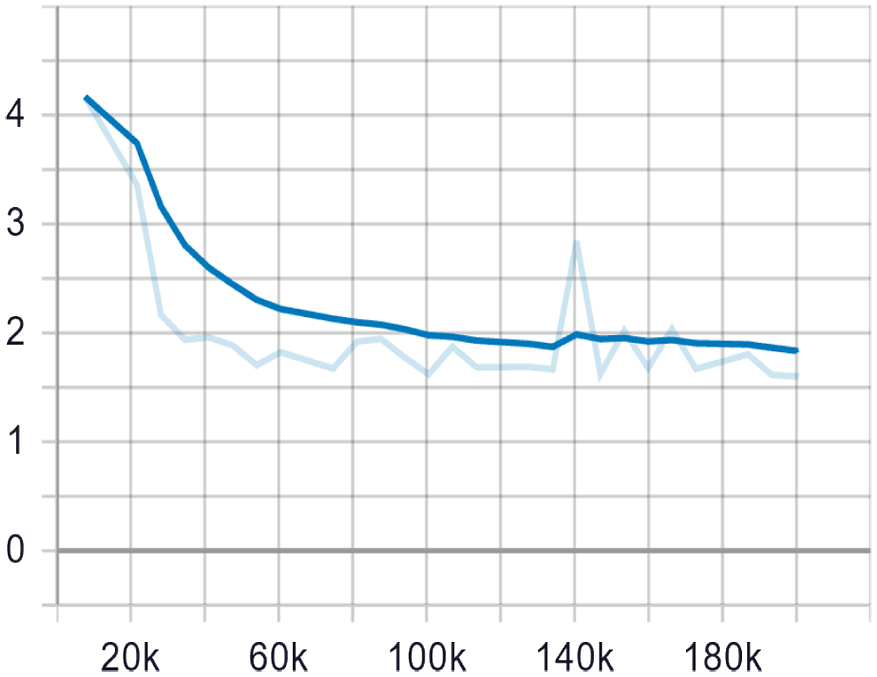
TABLE I. Parameters in SSD Model
| Parameter name | Value |
|---|---|
| Original image size | 1240 × 720 |
| Adjusted image size | 300 × 300 |
| Initial learning rate | 4 × 10⁻³ |
| Learning rate decay steps | 60,000 |
| Learning rate decay factor | 0.95 |
| Image number in each iteration | 5 |
| Iteration number | 200,000 |
B.NON-MAXIMUM SUPPRESSION
Given the large number of boxes generated during a forward pass of the network at inference time, it is essential to prune most of the bounding box by applying non-maximum suppression. Specifically, the boxes with a low confidence value (e.g., <0.01) and a small overlap ratio (e.g., <0.45) are discarded, and only several top predictions are kept. This ensures only the most likely predictions are retained by the network, while the much noisier ones are removed.
C.PERFORMANCE ASSESSMENT
Several metrics are used to assess the effectiveness of our hand detection model. The object detection accuracy is associated with the bounding box overlap between the prediction and the ground truth. The intersection over union (IoU) is defined to express the overlap:
where P and GT represent the bounding boxes of the prediction and ground truth, respectively. A threshold θIoU ≥ 0.5, indicates an object has been detected. Furthermore, both precision and sensitivity are used to compute the ratios of detected true positives against predictions and entire data samples, respectively. The mean average precision (mAP) combines both sensitivity and precision for detected hands:where AP is the average precision and Q is the number of testing cases. Fig. 5 shows the mAPs for different IoU thresholds. When IoU = 1, the performance of our model reaches 85%+. mAP is close to 100% when IoU = 0.5, which is a common threshold treating an object as detected. This result demonstrates that the trained model performs well on the testing dataset.
In addition, the sensitivity score is also present on Fig. 6 which shows a curve of average sensitivity for top 10 detection ranking. The score gradually increased until it reached its highest peak at 91% when the training was close to iteration # 200k.
 Fig. 6. Average sensitivity for top 10.
Table II is the confusion matrix of our AAC participants role detection based on IoU = 0.75. According to the experimental assumption, therapist, both family members, and social worker wear blue, red, yellow, and green rings, respectively, while AAC user (the patient) does not wear anything. This matrix uses different font colors to indicate the roles of AAC participants. From the matrix, the AAC user with bare hand and Therapist (with blue ring) hand can be recognized with almost perfect accuracies. However, the family member with the yellow ring is relatively easy to be confused with social worker with the green ring. The major reason for this issue is related to the light condition and the ring colors, that is, the green color under the indoor light was turned to yellowish color, which makes the network hard to distinguish both roles. We will change the ring shape or color in future study.
TABLE II. Confusion matrix of our hand recognition method
V.CONCLUSION AND FUTURE WORK
Our proof-of-concept application demonstrates a deep neural network framework for differentiating different “Speakers” using one AAC device. Our system can detect above 90% of different hands successfully across three different AAC software and four different users. The model verifies that the concept does indeed function as envisioned. This approach provides a solution to the clinical issue in the AAC domain. The system is able to improve the validity of automatic data logs, and potentially will make AAC users’ performance analysis more accurate. Our next step is to improve the detection accuracy by increasing the diversity of training data, utilizing more salient hand features. We also will use an interoperable data log format [6] to generate our SAIL data logs, then conduct a user study to evaluate their consistency and usability by comparing with traditional language sample analysis.