I.INTRODUCTION
The brain is a vital organ in the human body, and every action of the human body is controlled by the brain. Brain tumor is one of the most dangerous cancers that cause death. It is an unwanted growth of abnormal cells in the brain and is classified as primary and secondary brain tumors [1]. Primary brain tumor cells originate in the brain, whereas secondary brain tumors cells grow in other parts of the body [2]. Benign and malignant tumors belong to primary brain tumors. Malignant tumor is more dangerous compared to benign, and it can easily be predicted as its intensity levels are different from the neighboring cells [3–5].
Generally, brain tumors can be detected using various scanning techniques such as computed tomography (CT) and magnetic resonance imaging (MRI). MRI scanning results in high-quality images, especially hard tissues are clearly visible [6]. Accurate identification and delineation of tumor regions provide crucial information to healthcare professionals, enabling them to make informed decisions regarding patient management. In recent years, advancements in imaging technologies and computational techniques have propelled the development of sophisticated algorithms for brain tumor segmentation. These techniques have demonstrated remarkable potential in improving the accuracy, efficiency, and reliability of tumor delineation. The important advancements for locating brain tumors are feature extraction and determination.
There are numerous features, including GLCM, statistics, wavelet features, texture, and region-based characteristics. Additionally, there are many ways to extract the necessary information from the image. Utilizing a vast array of features for classification is particularly effective deterrent. Therefore, it is necessary to select the important qualities. It involves lowering the computational complexity while also improving classification accuracy. For choosing features from the image, a variety of deep learning and optimization algorithms have been used, including Fisher linear discriminant analysis, K-nearest neighbor, decision tree, multilayer perceptron, and support vector machine (SVM). A powerful strategy for the multicategory classification problem was discovered in artificial neural network (ANN) classification methods. Many researchers, clinicians, and scientists have proposed different brain tumor detection and segmentation techniques, but the predicted accuracy is not reached so far. Hence, we propose a fully automated hybrid technique that includes modified fuzzy C-means and ANN classifier.
Due to its ease of use, the fuzzy C-means (FCM) algorithm is one of the most well-liked segmentation techniques that has been extensively employed in medical research. The debut of FCM is what led to its success. When pixels in a cluster are weighted according to how closely they resemble each other, fuzziness is present. FCM neglects the spatial information surrounding each pixel, which makes it sensitive to noise, which is a significant drawback of standard FCM clustering. The FCM algorithm cannot manage the various levels of noise that are found in medical images. The creation of noise-free pictures via hardware innovations remains a difficulty despite all the advancements made in MR imaging. There are two ways to fix this problem with FCM: (1) create FCM extensions that are more noise resistant and (2) enhance image denoizing techniques. Prior research has suggested a number of extensions for the first method to enhance FCM performance. These extensions may be distinguished by their predominant application of modifications to the spatial domain, transform domain, and metaheuristics. Due to their dependence on the original noisy image, these approaches are still susceptible to high levels of noise even though the proposed improvements improve FCM segmentation of noisy MR images. In the second approach, noise from the original MR images is removed before segmentation using a well-liked technique known as denoizing.
In recent times, ANNs have emerged as a promising solution, offering significant improvements over previous techniques. Traditional techniques for brain tumor segmentation often relied on handcrafted features and rule-based algorithms. These methods involved manual selection of features, followed by the application of thresholding, region growing, or morphological operations to delineate tumor regions. Although these techniques were useful to some extent, they often struggled with handling tumor heterogeneity, intensity variations, and irregular tumor shapes. The accuracy and reliability of these approaches were limited, and they heavily relied on expert knowledge and manual interventions. The rise of ANNs has revolutionized the field of medical image analysis, including brain tumor segmentation. ANNs offer powerful computational models capable of learning complex patterns and relationships directly from the data. By leveraging their ability to automatically extract high-level features, ANNs can effectively handle the challenges posed by brain tumor segmentation. These networks can capture intricate spatial information, learn from diverse examples, and generalize well to unseen data. ANNs provide several advantages over previous techniques in the context of brain tumor segmentation. First, ANNs can learn discriminative features directly from the raw input data, eliminating the need for manual feature engineering. This ability enables the networks to capture subtle patterns and variations in tumor regions, improving the accuracy of segmentation. Second, ANNs can handle the inherent heterogeneity of brain tumors by learning and modeling complex relationships between different tumor components and surrounding tissues. This capability allows for more precise delineation of tumor boundaries, including the tumor core, edema, and necrotic regions. Additionally, ANNs have the potential to adapt and generalize well to diverse imaging modalities, making them versatile tools in multimodal brain tumor segmentation. When compared to previous techniques, ANNs have demonstrated superior performance in various studies and competitions focused on brain tumor segmentation. The learned representations and internal feature representations of ANNs enable them to capture both local and global context, enhancing segmentation accuracy. Additionally, ANNs have shown robustness to noise, intensity variations, and imaging artifacts, making them more reliable in real-world clinical scenarios. Moreover, ANNs can leverage transfer learning, where pretrained models on large datasets can be fine-tuned for specific segmentation tasks, reducing the need for large annotated datasets.
The rest of the paper is organized as follows: Section II discusses the related works. Section III presents the proposed methodology. Section IV outlines the results and discussions, and the conclusion and future scope are discussed in Section V.
II.LITERATURE SURVEY
During the transmission and acquisition of MRI images, unwanted signals can interrupt and contaminate the quality of the images and therefore extraction of vital features from the image becomes difficult. V.V.S. Sasank et al. [7] proposed a hybrid technique that combined the lattice Boltzmann method and modified sunflower optimization algorithms for brain tumor segmentation and achieved an accuracy of 95.23%. P. Supraja et al. [8] developed an efficient deep learning technique combined with a fuzzy K-means algorithm to segment the tumor region separately, and it is verified on the BRATS dataset and produces an accuracy of 94%. Marwan A.A. Hamid et al. [9] used spatial filters to remove undesired information and noises further supporting vector machine is used to classify the MRI brain tumors and obtained an accuracy of 95%. Jose Bernal et al. [10] discussed different deep convolutional neural networks (CNNs) in their review article. El-Sayed Ahmed et al. [11] used hybrid intelligent techniques. They used DWT and PCA (principal component analysis) to extract and select the features of MRI images, respectively, and feed-forward back-propagation ANN and K-nearest neighbor to classify the normal and abnormal MRI brain images. Ming-Chuan Hung et al. [12] proposed a novel and efficient algorithm known as the psFCM algorithm, which reduced the computation time required to partition a dataset into desired clusters. Keh-Shih Chuang et al. [13] presented a fuzzy c-means algorithm that incorporates spatial information into the membership function for clustering. S. Deepak et al. [14] adopted a technique that combines CNN features with SVM for classification of the medical images, and it is verified on figshare dataset and attained overall classification accuracy of 95.82%. Abbasi et al. [15] presented another fully automated tumor detection methods that use different clustering algorithms to segment the brain MRI into different regions. The partitioned regions become the ROI for further analysis. In order to diagnose esophageal cancer, Xue et al. [16] used the concept of merging CNN and SVM to solve their microvascular morphological classification challenge. Despite having more training data, the CNN-SVM combination outperformed the stand-alone CNN classifier in terms of accuracy.
The segmentation of uterine fibroids in MR-guided focused ultrasound surgery and the segmentation of metastatic brain cancer in neuro-radio surgery are two clinical cases involving bimodal MR image analysis. Rundo et al. [17] presented a scalable system for medical image preprocessing, automatic global thresholding, and segmentation. Fast curvelet transform was used by Nayak et al. [18] to extract patient features from binary and multiclass brain MR datasets, and kernel extreme learning machine was used to classify the features. Cui et al. [19] developed an autonomous segmentation model utilizing a cascaded deep learning CNN. It consists of two different kinds of networks: an intra-tumor classification network (ITCN) and a tumor localization network (TLN). The tumor region can be separated from the MRI images using TLN, and it can be divided into more manageable portions using ITCN. A model for tumor segmentation and classification was created by Chinmayi et al. [20] utilizing the Bhattacharya coefficient.
The undesired MRI sections, such as the skull, are removed using an anisotropic filter. It trains the MRI image of the brain cancer using deep learning CNN. Additionally, it uses a quick-bounding box method to isolate the cancer area. A dense FCNN with a dense conditional field was used by Shaikh et al. [21] in 2018 to segment brain tumors for the Multimodal Brain Tumor Image Segmentation (BraTS 2017) challenge. Dense conditional fields were implemented as a postprocessing step to fully utilize context information, and dense blocks were used to facilitate information flow. A deep supervised 3D squeeze-excitation (SE) V-Net was proposed by Liu et al. [22] The average dice for the WT, TC, and ET on BraTS 2017 reached 89.3%, 80%, and 74.7%, respectively. 3D SE blocks were introduced to drive the V-Net to concentrate on the relevant feature channels.
III.PROPOSED METHODOLOGY
The feature extraction phase plays a vital role in the medical imaging field. The output of feature extraction methods depends on the output of preprocessing methods. We present a framework to filter, segment, extract the desired features, and finally use a classifier to distinguish between types of brain tumors. In this study, the performance of the proposed method has been verified on the BraTS 2015 and BraTS 2017 datasets.
The proposed framework consists of five stages: (i) preprocessing, (ii) feature extraction with DWT, (iii) feature selection using PCA, (iv) classification of images using ANN, and (v) segmentation using modified fuzzy c-means, and these stages are shown in Fig. 1.
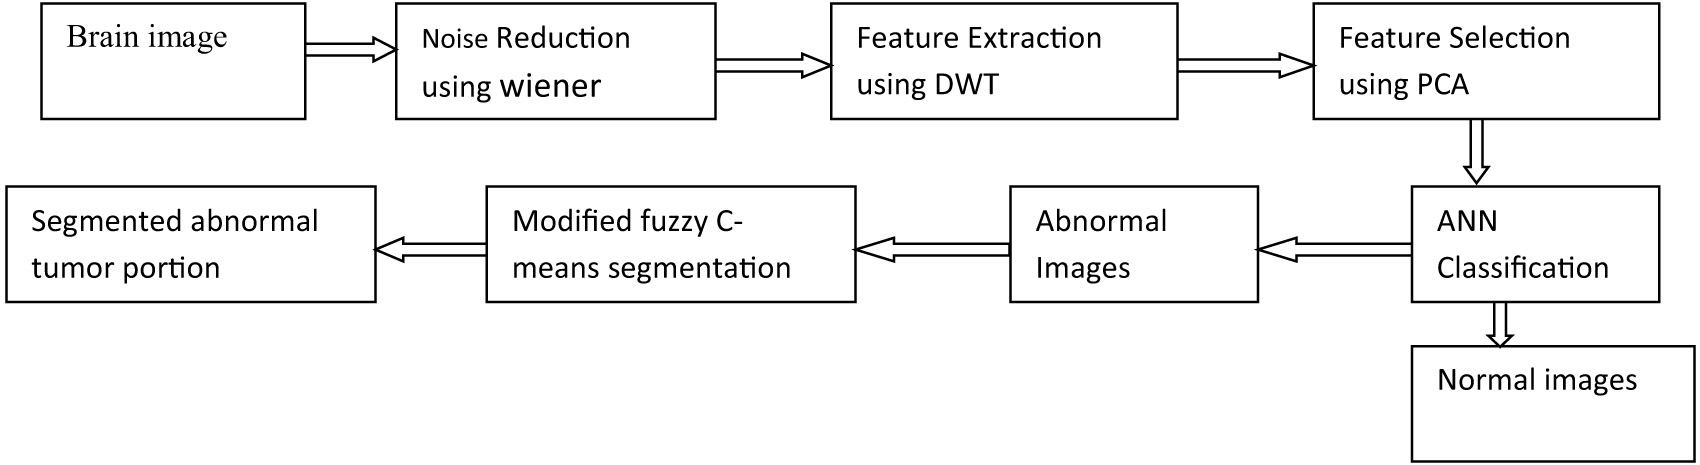 Fig. 1. Block diagram of the proposed framework.
A.PREPROCESSING
The proposed method uses a hybrid technique to extract tumors in MR images. MRI is a simple and low-risk technique that provides detailed tissue images of the brain. Though we get good-quality images using MRI, however, the skull and scalp are the unwanted components that may contain noise.
The process of removing artifacts and noise present in the MR images is known as preprocessing. Based on the nature of noise various filters such as Wiener filter, Gaussian filter, and Mean filter are used. In this proposed technique, genetic optimized median filter (GOMF) is used to remove noise and artifacts present in the brain MRI image. At each location, GOMF selects a vector randomly, and partitions that vector into ‘N’ segments. On each segment, this filtering operation is applied and thus this algorithm gives the optimum weighting factor for each segment. This filtering operation is applied repeatedly on the given image to get the expected image quality. The evaluation function is
where “E” represents total square error. “U” indicates uncorrupted pixel value. “V,” and “W” denotes filtered output and weighting vector, respectively.B.FEATURE EXTRACTION WITH DWT
To extract features from the above preprocessed images, we used discrete wavelet transform (DWT). Though there are many mathematical transformation techniques present in the frequency domains such as Fourier transform and Laplace transform, we deal with wavelet transform that is generally used for image analysis and data compression. DWT is a powerful technique that uses dyadic scales and positions. In this work, DWT extracts features from the denoized image. Unlike Fourier transform, DWT offers knowledge about time and frequency domains.
Let us assume that is a square-integrable function, and that the continuous wavelet transform of relative to a given wavelet is defined in equation (2)
In the third equation, and h are dilation and translation parameters, respectively. can be determined from the mother wavelet by translation and dilation.In the wavelet analysis, different kinds of wavelets gained popularity, out of which Haar wavelet is the simplest wavelet often used in most of the applications. In this work, Haar wavelet transform is used for decomposing the given image to extract the features. Figure 2 represents the 3-level decomposition tree.
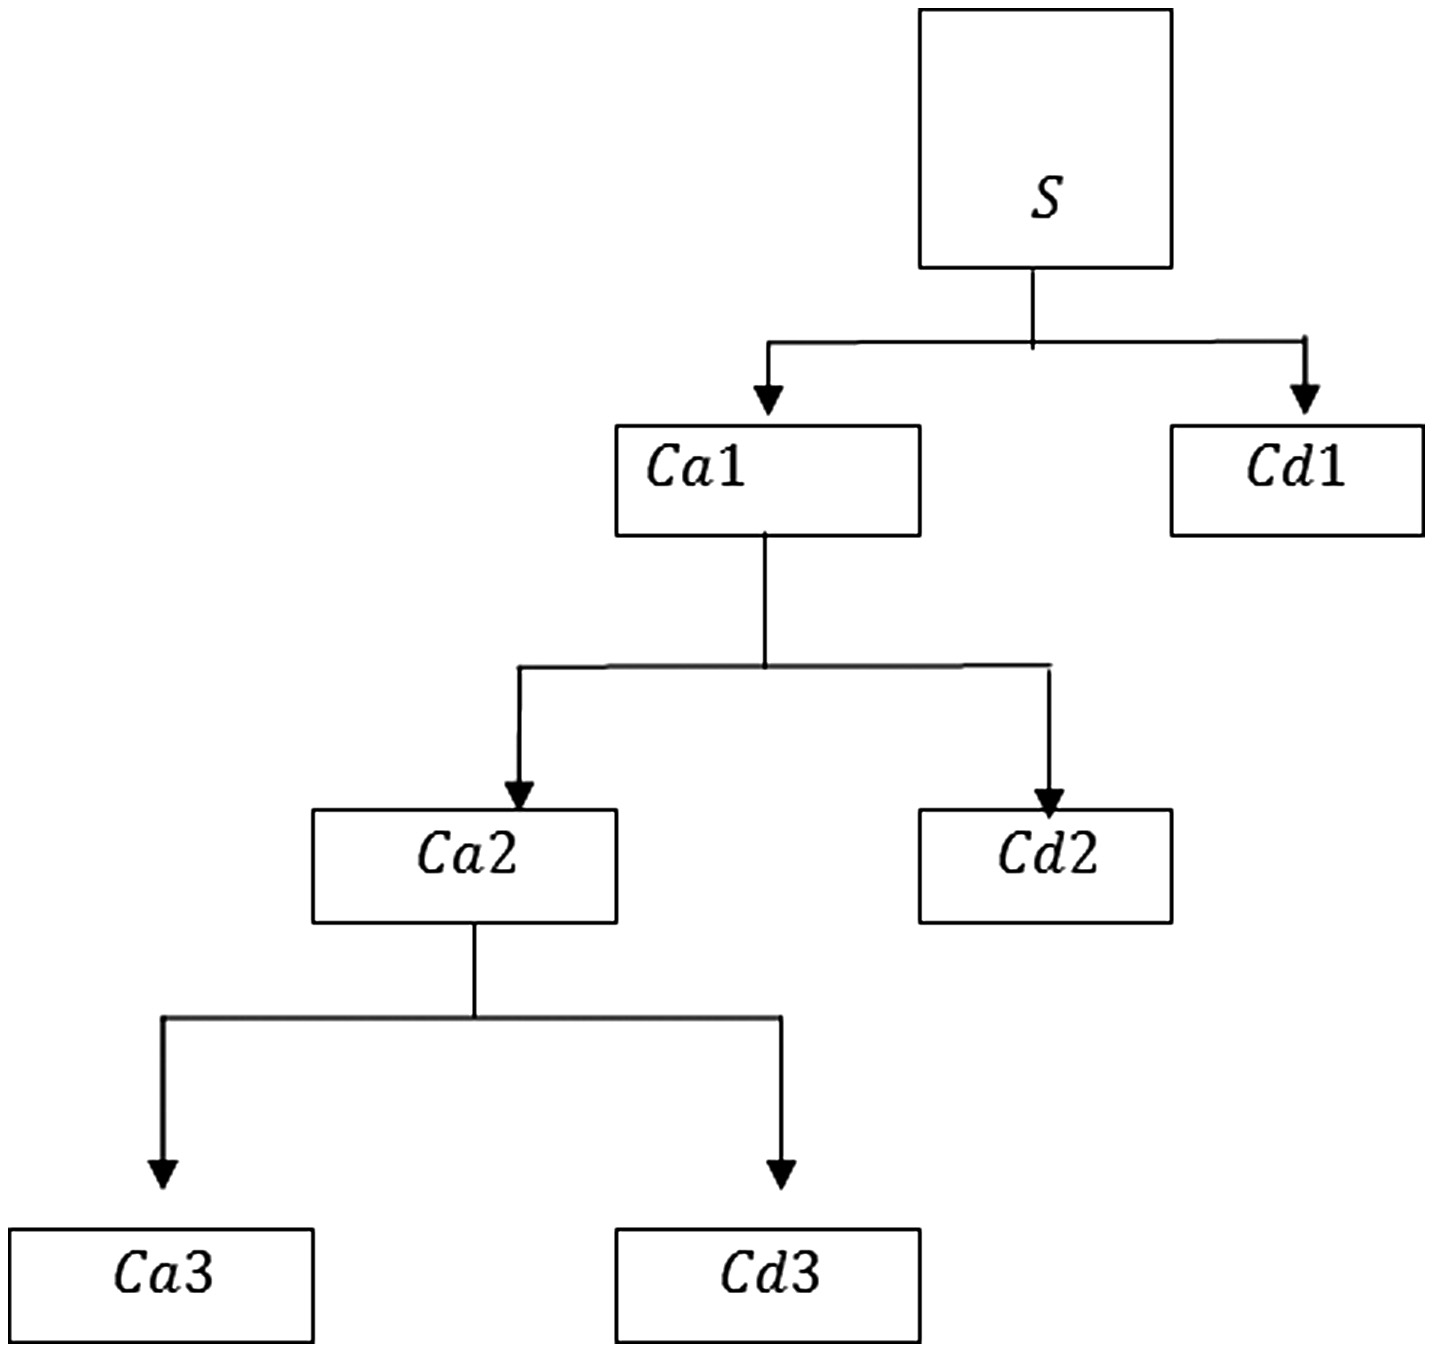 Fig. 2. Three-level Haar wavelet decomposition tree.
Here is the given image, having 1, 2, 3 represents approximated and detailed coefficients at levels 1, 2, and 3. As the number of decomposition levels increases, we get a compactor but coarser approx. information.
C.FEATURE SELECTION USING PCA
The excessive features that are extracted using DWT consume more computation time and storage memory. Principle component analysis (PCA) is a statistical approach to select the principal features of a dataset based on their total variance. Thus, PCA reduces the dimension of the dataset through the following steps:
- a.Image normalization
- b.Determine the covariance matrix
- c.Calculate Eigen vectors and its values from the covariance matrix
- d.Transform image data into the new basis
Before performing PCA, it should be noted that the input image should be normalized to get a unit variance and zero mean. To calculate Co-variance matrix, we need to find the mean of the image using equation 4.
The covariance matrix (B) is calculated as
Finally, the Eigen vectors are calculated from equation 6.The Eigen vectors with higher values are selected, and these are the principal features of the given dataset.
D.ANN CLASSIFICATION
ANN is a biologically inspired concept, and it is the subfield of artificial intelligence. As neurons are interconnected to each other in the human brain, similarly ANN consists of neurons linked to each other called as nodes. The three layers of ANN are the input layer, hidden layer(s), and output layer. The input layer is multiplied with input hidden weights.
where is the hidden function, is the input bias value, is the output function, is the output bias value, and is the mean square error (MSE). During testing, the minimum MSE-weighted values are given to the ANN for classification. Based on the obtained value, test image is classified into normal or abnormal image. where and are the output and target values, respectively.E.MODIFIED FUZZY C-MEANS
The ANN-classified abnormal images are given to the modified fuzzy C-means algorithm. Let us discuss clusters, their types, fuzzy C-means, and finally modified fuzzy C-means algorithm. Unlabeled patterns are partitioned or grouped into clusters such that similar patterns form a cluster. Hard clustering or crisp clustering and fuzzy clustering are the two approaches widely used in clustering. In crisp clustering, boundaries between adjacent clusters must be well-defined. But in practical cases, boundaries between adjacent clusters cannot be defined clearly. For such cases, fuzzy clustering is a more suitable method to classify these unlabeled patterns.
Among all fuzzy clustering techniques, fuzzy C-means (FCM) technique is widely used. Let denotes an image with “” pixels and that is to be partitioned into “C” clusters, where indicates multispectral data.
The FCM algorithm is an iterative optimization algorithm which minimizes the under defined cost function.
where indicates the membership of pixel in the cluster, and is the cluster center as shown in equations 11 and 12, respectively. ‘’ is the degree of fuzziness. In this study, we used .The minimization of the above cost function depends on the membership value that is given to the pixels. That means the pixels nearer to the centroid of their cluster should be given high membership values and the lower membership values to the far pixels from the centroid.
And
By appropriate guess for every cluster center, FCM converges to a solution for representing local minima of the cost function. The membership function discussed in equations 11 and 12 should be modified to get the accurate spatial information of the pixels. Thus, we present modified fuzzy C-means algorithm.The modified membership function is defined as
is the function in spatial domain, which enhances the membership value of the pixel, and it presents the probability of pixel that belongs to the th cluster. is square window centered on pixel in the spatial domain. are window parameters.We know that denotes an image with “M” pixels and let be the set of centers.
The algorithm for Modified FCM is
Thus, it is observed that 14 iterations are performed. During 14th iteration, the above conditions are satisfied. Hence, the iteration process is stopped.IV.RESULTS AND DISCUSSIONS
In this paper, the input MRI brain images are taken from the BRaTS 2015 and BRaTS 2017 datasets. The proposed method is simulated using MATLAB R 2016 developed by Math works Inc. In this proposed framework, benign tumors (training-140, testing-115) and malignant tumors (training-140, testing-115) are used for implementation. The simulation results of the proposed work are shown in Fig. 3.
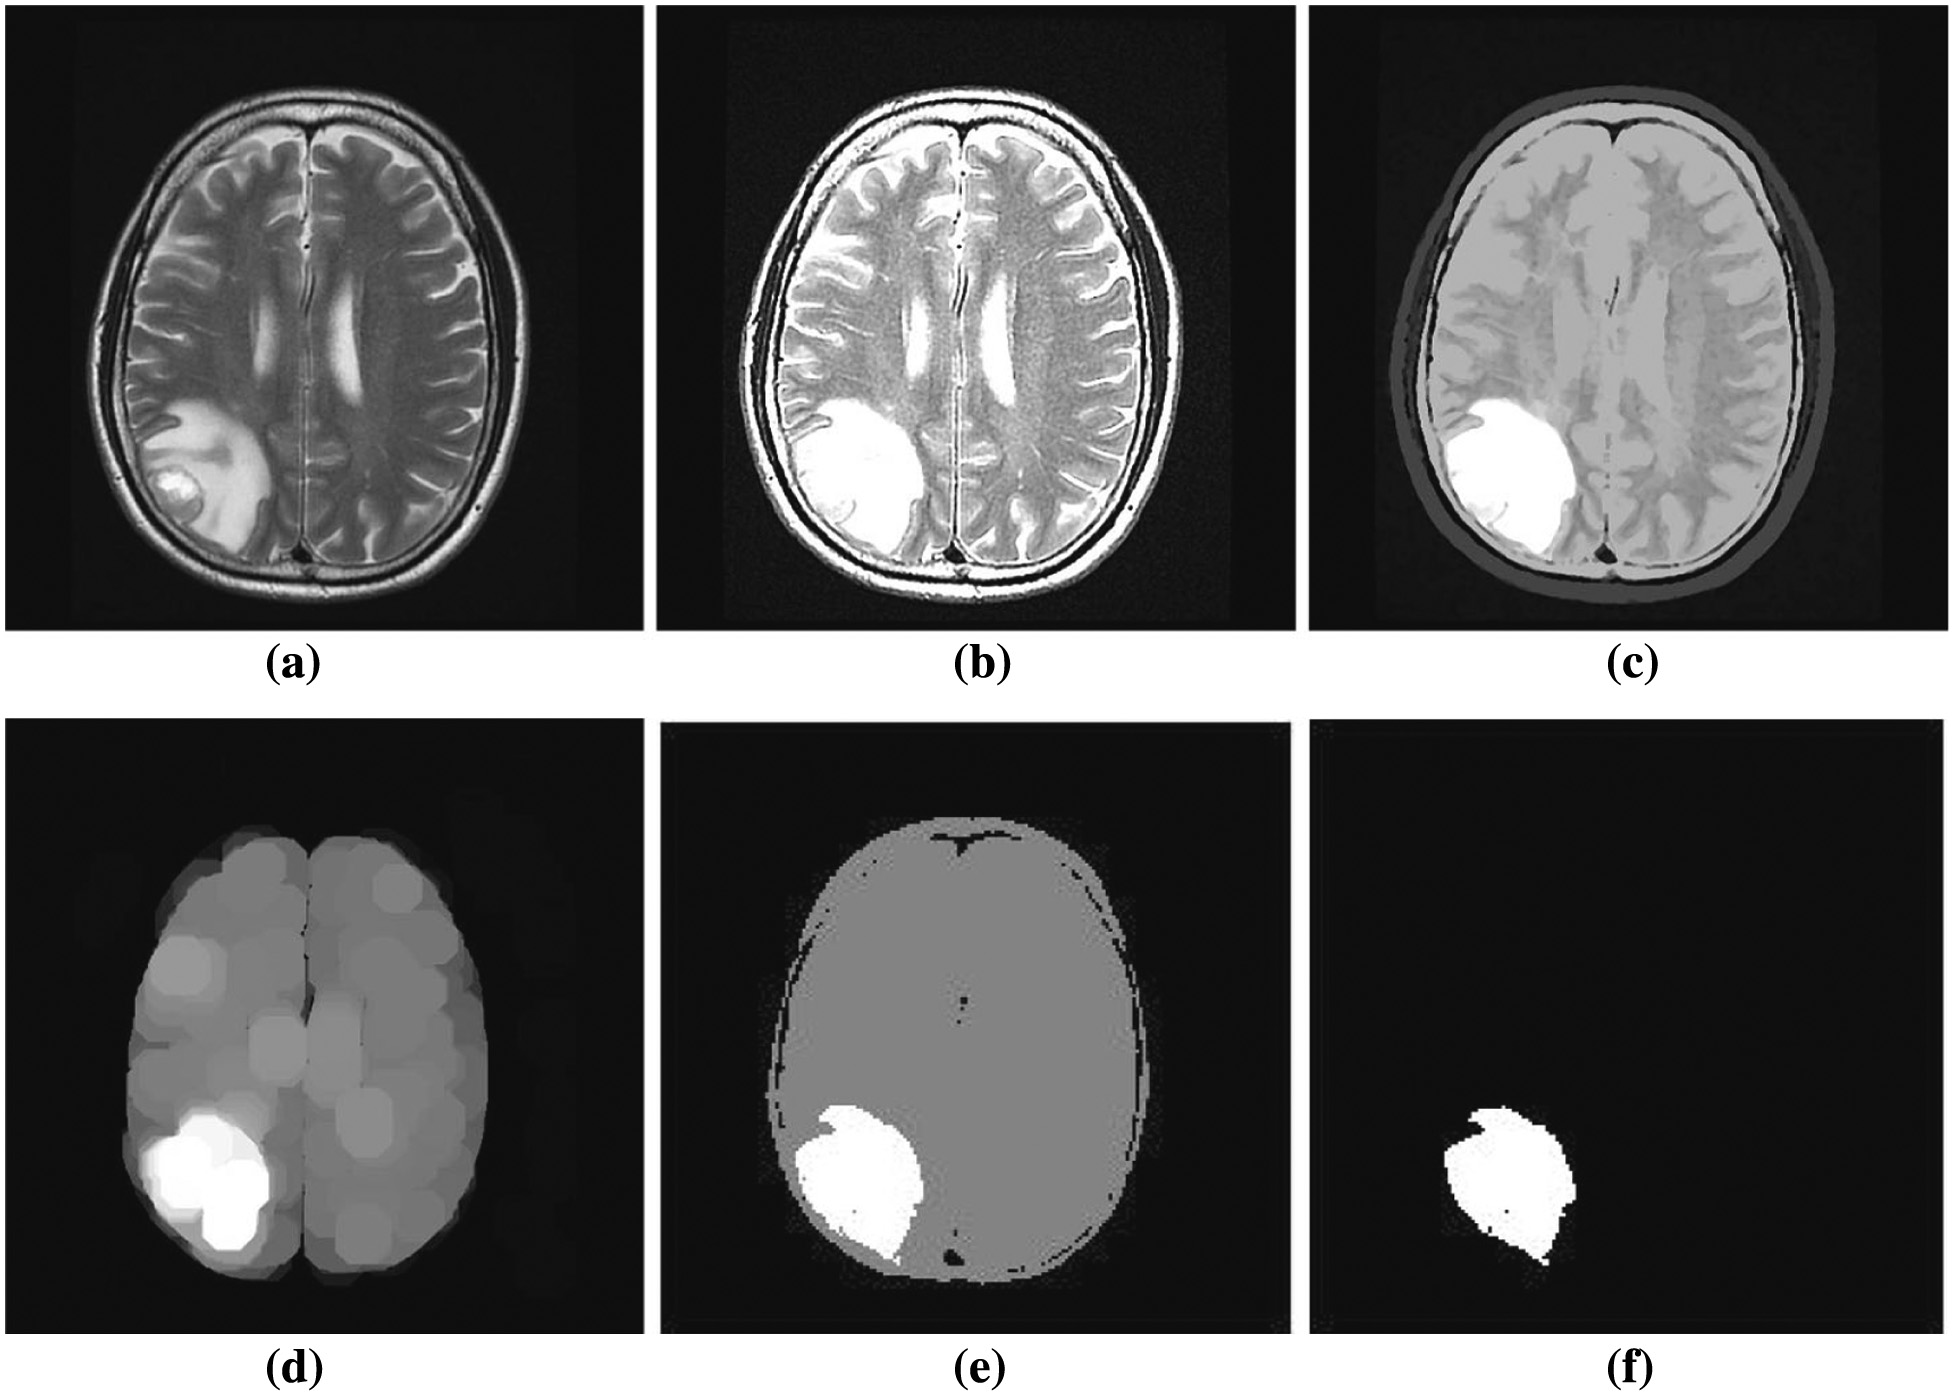 Fig. 3. Simulation results of proposed technique: (a) preprocessed image, (b) image sharpening, (c) feature selection using PCA, (d) fuzzy clustered image, (e) at 14th iteration, and (f) final segmented image.
A.PERFORMANCE ANALYSIS OF GOMF
For preprocessing, GOMF is used, and its results are shown in Table I. The GOMF performance is evaluated by calculating the following metrics.
- (i)PSNR and MSE: PSNR stands for peak signal to noise ratio. It represents a measure of the peak error.where are the original and modified images, respectively, is the pixel position of image, and MSE is the mean square error.
- (ii)SSIM: SSIM means structure similarity index metric. The name itself indicates that it measures similarity between the reference image and the original image. By multiplying the three similar aspects such as luminance, contrast, and structure, we can calculate the SSIM. where , are mean values of f, g. c1, c2 are stabilizing constants and , are standard deviations of f, g, respectively.
- (iii)Correlation: Correlation is mainly used to match the template image with the given image. If each pixel in an image has nonlinear relationship with its neighboring pixels, then such a relationship is defined as correlation.
- (iv)MAE: MAE stands for mean absolute error
Table I. Performance analysis of GOMF
| S.NO | Preprocessing filter | Parameters | ||||
|---|---|---|---|---|---|---|
| MAE | MSE | PSNR | SSIM | CORRELATION (%) | ||
| 1 | Genetic optimized median filter | 17.968 | 5.6272 | 37.5124 | 0.9856 | 97.42 |
B.PERFORMANCE ANALYSIS OF FEATURE SELECTOR (PCA)
Though the features of input brain image are extracted using DWT, the required and essential features (feature subset) are selected by PCA method. The assessment metrics such as sensitivity, specificity, and accuracy are computed for feature subset and shown in Table II.
- (i)Sensitivity: The sensitivity is defined as the quantity of actual positives, which are accurately predictable.
- (ii)Specificity: The specificity is defined as the quantity of actual negatives, which are accurately predictable.
- (iii)Accuracy: Accuracy gives the perfectness of the proposed method.
where
BA (True Positive) : Benign tumor is accurately identified as benign tumor
BI (False Negative) : Benign tumor is inaccurately identified as malignant tumor
MA (True Negative) : Malignant tumor is accurately identified as malignant tumor
BA (False positive) : Malignant tumor is inaccurately identified as benign tumor
Table II. Performance comparison of feature subset parameters
| Feature subset | Sensitivity (%) | Specificity (%) | Accuracy (%) |
|---|---|---|---|
| Intensity | 82 | 72 | 93.78 |
| Texture | 86 | 81 | 92.86 |
| Shape | 83 | 70 | 94.86 |
| Intensity + Texture | 90 | 94 | 96.23 |
| Intensity + Shape | 92 | 91 | 97.46 |
| Shape + Texture | 94 | 95 | 97.62 |
C.PERFORMANCE ANALYSIS OF ANN CLASSIFIER
After selecting the required features of brain MR image, the tumor classification is done using ANN classifier, and it classifies the tumor as either benign or malignant. The performance of the classifier is shown in Table III.
Table III. Performance analysis of the ANN classifier
| Classes | Training/testing data | Number of correctly classified data | Percentage of correct | ||||
|---|---|---|---|---|---|---|---|
| Without optimal feature subset generation | With optimum feature subset generation | With optimum feature subset generation using ANN | Without optimum feature subset generation | With optimal feature subset generation | With optimum feature subset generation using ANN classification | ||
| Benign | 140/115 | 92 | 101 | 111 | 80 | 87.82 | 96.52 |
| Malignant | 140/115 | 101 | 105 | 113 | 87.82 | 91.30 | 98.26 |
| Average | 83.91 | 89.56 | 97.3 | ||||
The ANN classifier classification accuracy is 96.52% for benign tumors and 98.26% for malignant tumors. Finally, the average accuracy of the ANN classifier is 97.3%, which is far better compared to earlier conventional classification methods.
D.PERFORMANCE ANALYSIS OF MODIFIED FUZZY-C-MEANS SEGMENTATION
The efficiency of the proposed technique, i.e., the modified fuzzy-c-means segmentation method, is evaluated using the structural similarity index metric (SSIM). After extraction of the tumor portion, its area is computed and compared with ground truth images, and these values are presented in Table IV. As the name indicates, SSIM is used to find the similarity between segmented images and ground truth images.
Table IV. Structural similarity index metric for various MR images
| Sample No | Predicted tumor region | Extracted tumor region | Under segmentation | Over segmentation | SSIM |
|---|---|---|---|---|---|
| 1 | 24.40 | 24.36 | 0.04 | 0 | 0.9832 |
| 2 | 19.62 | 19.60 | 0.02 | 0 | 0.9769 |
| 3 | 25.21 | 25.11 | 0.10 | 0 | 0.9652 |
| 4 | 23.21 | 22.92 | 0.29 | 0 | 0.9732 |
| 5 | 18.56 | 18.88 | 0 | 0.32 | 0.9914 |
| 6 | 19.75 | 19.51 | 0.24 | 0 | 0.9876 |
| 7 | 15.52 | 15.23 | 0.29 | 0 | 0.9752 |
| 8 | 14.76 | 14.43 | 0.33 | 0 | 0.9834 |
| 9 | 20.61 | 21.10 | 0 | 0.49 | 0.9926 |
| 10 | 23.65 | 23.60 | 0.05 | 0 | 0.9912 |
| 11 | 19.86 | 19.75 | 0.11 | 0 | 0.9836 |
| 12 | 20.58 | 20.47 | 0.11 | 0 | 0.9677 |
| 13 | 21.43 | 21.20 | 0.23 | 0 | 0.9736 |
| 14 | 24.12 | 23.97 | 0.15 | 0 | 0.9811 |
| 15 | 25.16 | 25.02 | 0.14 | 0 | 0.9923 |
After a thorough analysis of the results, we conclude that the proposed method is not affected by oversegmentation and produced an average SSIM value of 98.5%.
The proposed method is compared with the existing methods such as computational neural networks (CNN), fuzzy-k-means, skull stripping 2-dimensional convolutional networks (SS-2D-CN), and K-nearest neighbor. The performance of these techniques has been evaluated using various evaluation parameters and tabulated in Table V.
Table V. Performance analysis of proposed segmentation method with existing methods
| SegmentationTechnique | Sensitivity | Specificity | Jaccard index | Accuracy |
|---|---|---|---|---|
| CNN | 83 | 86 | 83 | 85 |
| Fuzzy-K-means | 90 | 91 | 93 | 92 |
| SS2DCN | 86 | 94 | 82 | 90 |
| KNN | 82 | 92 | 81 | 87 |
| Proposed method | 98 | 98 | 97 | 95 |
From the above analysis, we conclude that our proposed technique gives 98% sensitivity, 98% specificity, 97% Jaccard index, and a high accuracy of 95% compared to the existing methods as shown in (Fig. 4).
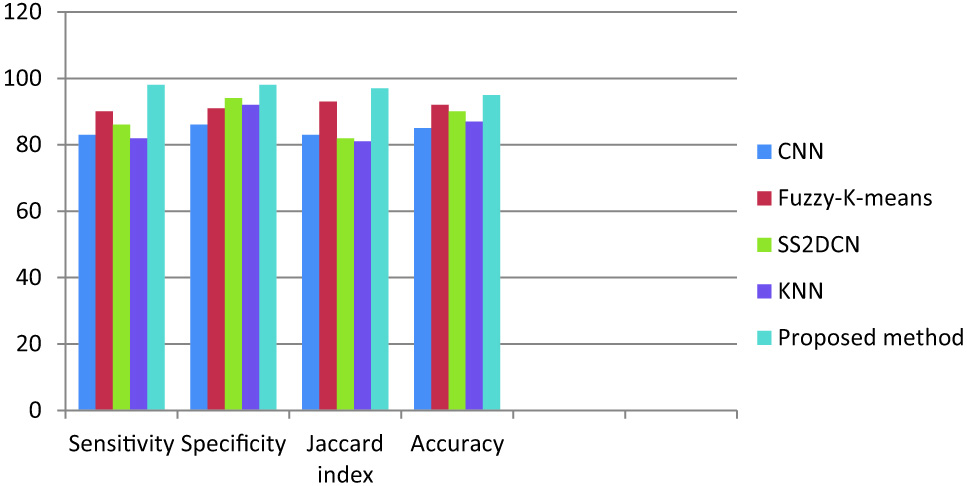 Fig. 4. Comparison of the proposed technique with the existing techniques.
V.CONCLUSIONS
In this paper, we proposed a hybrid technique for the classification and extraction of tumors from MR brain images. Initially, the images were obtained from BraTS 2015 and BraTS 2017 datasets. The MRI brain image was preprocessed using GOMF, and the features are extracted and selected using DWT and PCA algorithms, respectively. Then ANN classifier classified the images into normal and abnormal images. Finally, the modified fuzzy-c-means algorithm was used to segment the tumor portion from the abnormal images. The performance of the proposed hybrid technique had been analyzed using various evaluation parameters. The simulation results revealed that the proposed method’s statistical evaluation parameters are much better compared to the other traditional methods such as CNN, fuzzy-K-means, SS2DCN, and KNN. The main advantage of the proposed method was that it predicted not only the size of the tumor but also the type of tumor (benign or malignant). For future studies, we want to develop various hybrid techniques to classify and segment MR brain images.