I.INTRODUCTION
As a result of the widespread usage of tobacco products, the number of fatalities from lung cancer among males skyrocketed throughout the majority of the twentieth century, contributing significantly to the overall increase in cancer mortality. More than 1600 people in the United States lose their lives to this disease every day, with a projected total of 608,570 deaths in 2021 [1]. To save lives, early detection of lung cancer is essential because symptoms do not appear until the disease has progressed, yet diagnosis at an earlier stage improves the likelihood of a successful outcome from treatment [2]. The use of medical imaging is essential in the early diagnosis of cancer. It is well-known that medical imaging has been employed for early cancer identification, appraisal, and procedure follow-up [3]. Processing and analyzing a huge volume of medical images manually can be a time-consuming and error-prone process [4]. Classification algorithms based on models sort incoming data into categories based on shared traits. By examining several computed tomography (CT) scans [5], researchers have found that early detection of lung cancinoma [6] using pattern analysis can save lives. Therefore, starting in the early 1980s, computer-aided diagnosis (CAD) systems were used to aid clinicians in efficiently interpreting medical images [7,8].
Deep learning techniques [9], which have had tremendous success in the realm of natural image identification and recognition [10], are now being applied to a wide variety of challenges and modalities in the field of medical image analysis [11]. In many medical image processing tasks, the deep convolutional neural network (CNN) model [12] of deep learning has proven to be vastly superior to the previous state-of-the-art methods. Among the many deep learning methods, CNN [13] have seen the most use in analyzing pulmonary nodules. CNNs have been successfully implemented in lung cancer CAD systems, yielding good outcomes. The primary motivation behind the development of Capsule Neural Network (CapsNet) [14] was the need to decrease the volume of the training set, which is typically massive in the case of CNN [15]. The output of a CNN, another type of neural network, is proportional to the amount of the training set. The inability to adapt to the shifting perspectives of CNN is one of the biggest flaws of the network [16]. CNN may fail to recognize an image if its orientation is flipped [17]. Here, CapsNet makes use of the fact that shifting one’s perspective has a nonlinear effect on individual pixels but a linear effect on individual objects. A group of capsules is known as a CapsNet. An entity in an image is represented by a capsule, which is a collection of neurons. An entity represented by a capsule has two values, one positive and one negative. The first factor is the likelihood that a capsule accurately depicts a real-world entity. The second set of info concerns the entity’s initial conditions. CapsNet can adjust to changes in perspectives as it learns the linear manifold between an object posed as a matrix of weights. The ultimate focus of CapsNet, an artificial neural network, which is to more closely mimic the biological neural network [16] for superior segmentation and recognition. Capsule here stands for a layer of capsule networks within a larger capsule network. The parameters of features of an object are set by capsules.
In this research work, a deep learning architecture is generated that can differentiate between benign and malignant lung cancers based on the provided test CT scans. The deep learning architecture in this paper is meant to be constructed with capsules rather than neurons. The remaining sections of this paper can be broken down as follows: The related works for classifying the lung cancer are outlined in Section II. The proposed method and materials for this paper are discussed in Section III. While Section IV gives detailed results and discussions, the paper is concluded in Section V.
II.RELATED WORKS
In recent years, CNN has been used for computer-aided diagnostic (CAD) research in the diagnosis of lung cancer. Rossetto et al. [18] introduced a Basic CNN architecture that uses a Gaussian filter to eliminate noise. To improve the precision of the automated labeling of the scans, researchers devised an ensemble of CNN employing multiple preprocessing techniques and a voting approach to obtain the consensus of the two networks. Lung cancer was categorized by VGG-16 architecture proposed by Chaunzwa et al. [19]. To better predict tumor histology in nonsmall cell lung cancer from CT scan data, the authors proposed a radiomics technique. With an emphasis on the two most common histological forms, adenocarcinoma and squamous cell carcinoma, the system trained and validated CNNs using data from 311 individuals diagnosed with early-stage NSCLC. Jin et al. [20] employed a 3D CNN that learned spatial information from the images. In this research, we build a 3D CNN network architecture using CT lung volumes that have been segmented as both training and testing data. The new model keeps the temporal connections between adjacent CT slices by extracting and projecting 3D information to the next hidden layers. Whether a patient has cancer or not is classified by the model’s 11 layers, which in turn generate 12,544 neurons and 16 million parameters. Based on morphological and laboratory evidence, Zhang et al. [21] created a three-dimensional CNN to identify lung nodules and categorize them as cancerous or benign. In this research, a CNNmodel was pretrained using a large amount of publicly available picture data to identify and categorize pulmonary nodules. After that, updated information from a wide variety of Chinese hospitals was used to refine the model’s training and verification processes. Shanchen Pang et al. [22] came up with the idea for a deep CNN and called it VGG16-T. Using a boosting method, numerous VGG16-T networks that functioned as weak classifiers were trained. To conduct this investigation, CT scans from 125 patients with early-stage lung cancer were collected. Rotating, reshuffling, and duplicating the data set helps even out the variance that naturally exists in the data. After that, a deep CNN called VGG16-T was suggested, and many instances of VGG16-T that worked as weak classifiers were trained using a boosting technique.
Kasinathan et al. [23] have presented a lung tumor detection and classification system that is based on the cloud for use with PET/CT scans. The suggested Cloud-LTDSC first built the active contour model as lung tumor segmentation, and then constructed and validated using standard benchmark images a multilayer CNN for classifying different stages of lung cancer. Using the lung CT DICOM images as well as the reference image LIDC-IDRI dataset of 50 low doses, the effectiveness of the provided approach is assessed. The most recent effort to categorize lung cancer utilized augmented CNN proposed by Bushara et al. [24]. Using modifications including scaling, rotation, and contrast adjustment, data augmentation helps locate useful training examples in current training sets. To evaluate the systems, researchers tap into the Lung Imaging Database Consortium-Image Database Resource Initiative database.
For instance, capsule networks have been studied for their potential in medical CT analysis and lung cancer diagnosis [16]. The newest innovation in deep learning is capsule networks [25]. They have proven to be worthy of this high praise by outperforming CNNs on the aforementioned tasks. This study offered an in-depth analysis of the current state-of-the-art architectures, resources, and approaches for implementing capsule networks. With the help of histopathology scans, Adu et al. [26] presented a CapsNet for detecting lung and colon cancer. To ensure that significant information is extracted from images with varying backgrounds, the proposed approach uses a squash function to effectively compress the vectors. Histopathological images were used to demonstrate DHS-CapsNet’s efficacy in practice. Mobiny et al. [27] proposed a modified version of CapsNet for lung nodule categorization. The malignancy of cancer in lung nodules was predicted by a new CapsNet developed by Afshar et al. [28]. The implementation of a capsule network for the survival analysis of different types of lung cancer was done by Bo Tange et al. [29]. In the proposed study, a CapsNet equipped with a dynamic routing algorithm was utilized to categorize lung cancer as benign or malignant from LIDC datasets by utilizing CT images.
III.MATERIALS AND METHODS DATASETS
The objective of the research is to apply deep learning techniques, specifically the Capsule Network, to the task of classifying lung tumor images. This section describes the datasets employed, the capsule network architecture, and the proposed architecture for lung cancer classifications.
A.DATASETS
The Lung Image Database Consortium image collection (LIDC-IDRI) dataset [30] is used for the training and testing of the proposed approach. This model evaluated a total of 4335 CT scans. This information includes 2160 cases of benign tumors and 2175 cases of malignant tumors. A deep examination of the LIDC data set was analyzed by four radiologists. The size of lung nodules on CT scans is represented in this dataset. Nodules are classified as benign if they are smaller than 3 millimeters in diameter and malignant if they are more than 3 millimeters in diameter. Figure 1 displays examples of both benign and malignant data from LIDC databases. Datasets are divided into three types, namely training, testing, and validation. 20% of the images (867) in the LIDC dataset are devoted to serving as test cases. 20% of the remaining (694 images) are utilized for validation, which is used to determine the top-performing model, and the remaining datasets (2,774) are utilized to train the model. Sample lung images from LIDC datasets for benign and malignant are shown in Fig. 1.
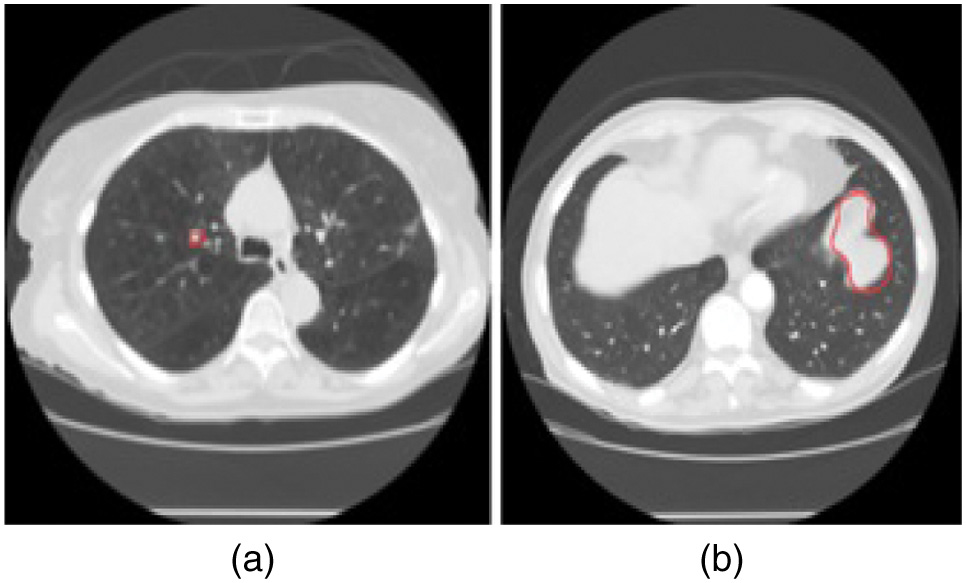 Fig. 1. Sample Lung Images from LIDC Datasets (a) Benign (b) Malignant.
B.BASIC CAPSULE NETWORK
The capsules are the most essential component of the CapsNet system. The concept that led to the development of capsules was conceived to resolve issues that are common to CNNs [31]. They are the inability to accurately capture the correct orientation of any given object and the accidental loss of significant data in the process of moving information from convolutional layers to the pooling layers. The three primary functions of capsules are the affine transformation, the weighted sum, and the squashing. An affine transformation is a helpful tool for determining the real orientation by making use of the characteristics that were captured by the convolutional layer. The expression of the prediction vector is given in Equation (1).
In such cases, are the prediction vectors, is the weight matrix, and is the output of a capsule.
The weighted sum, is comparable to the process of adding up all of the weights that take place in deep neural networks and is given by Equation (2).
where is a coefficient computed by Equation (3), based on the results of the dynamic routing method.where andThe norm quantity is maintained between 0 and 1 using the squashing function to cause the capsule to squeeze the norm of the vector without affecting the direction in which the vector is oriented. The expression for the output vector is given in Equation (4).
where, is the total input of capsule j, and is the output vector of capsule j.The term is the correlation between inputs and outputs and is the prediction score. The CapsNet is distinguished from a CNN by the use of routing by agreement, which also contributes to the ability of the system to identify spatial relationships.
C.PROPOSED CAPSULE NETWORK FOR LUNG CANCER CLASSIFICATION
The proposed architecture of the CapsNet is shown in Fig. 2. Inputs are paired images that have been annotated as either benign or malignant. The whole images is split up into three parts namely the training data, the testing data, and the validation data. Before feeding into the feature extractor, the train and validation data are processed and prepared. Capsule networks are utilized for classification in the proposed model, and convolution is used as a feature extractor to draw out the deep features of images. During the model-building process, the loss and accuracy in training and validation are checked. The results of the test data can be used to calculate the accuracy. The use of a softmax classifier allows the prediction of a label. Measures of quality for both predicted and true labels are used to find the accuracy of the classification.
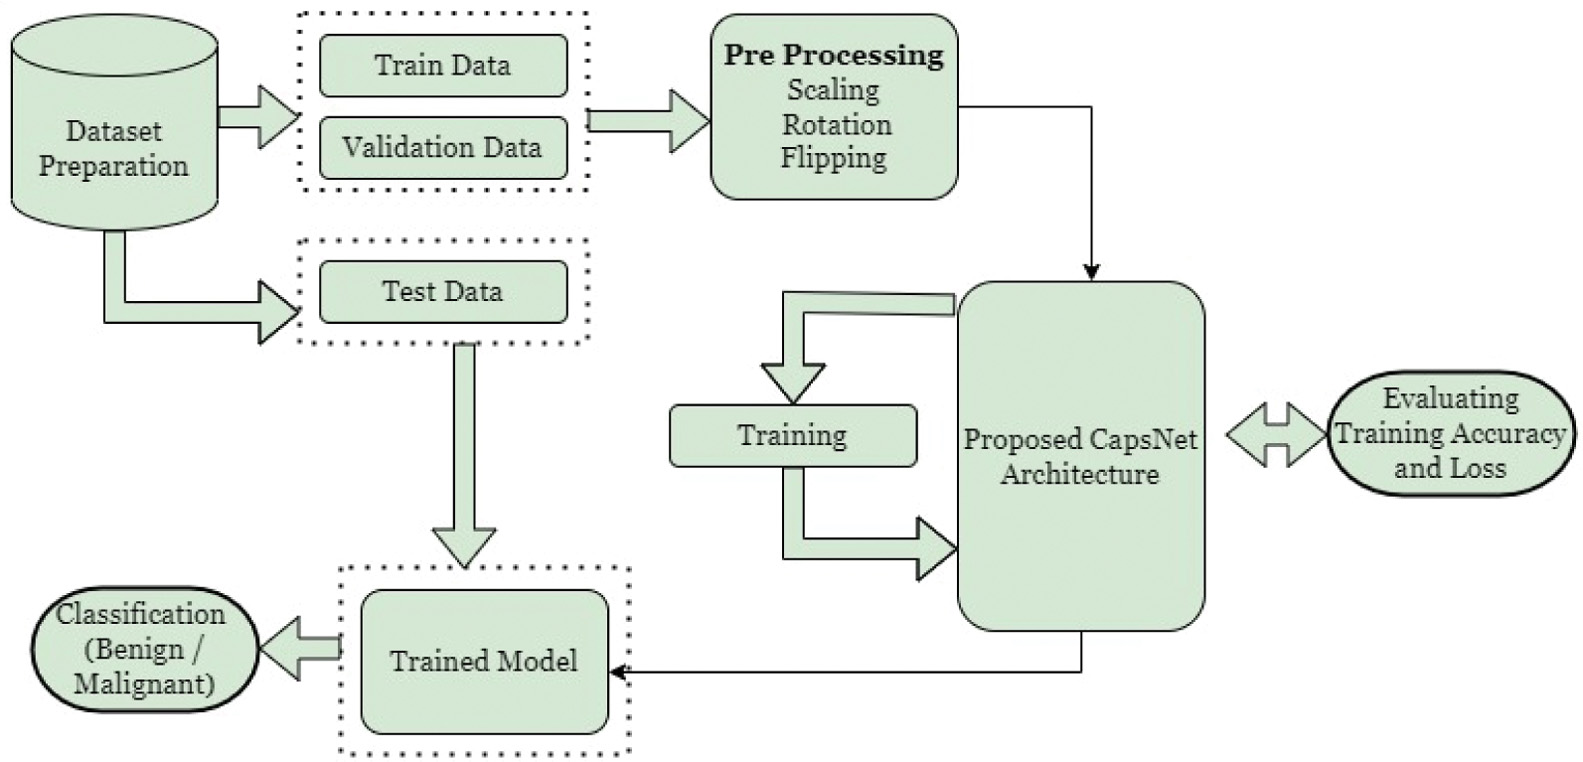 Fig. 2. The proposed CapsNet workflow for lung cancer classification.
The proposed capsule network has three layers, as shown in Fig. 3. The convolutional layers identify the basic features in the image. The primary capsule layer produces combinations based on the basic features detected by the convolutional layer. The lung capsule layer is the highest-level capsule layer and contains all of the instantiation parameters that differentiate lung cancer as either benign or malignant. CapsNet with a single convolution layer and 32 features (CN-1-32), CapsNet with a single convolution layer and 64 features (CN-1-64), and CapsNet with a double convolution layer and 64 features (CN-2-64) are the three capsule networks developed in this paper for lung cancer classification. CN-2-64 network performed the best out of the three networks used and its architecture is shown in Fig. 3. The architectures of the other two networks slightly differ from that of CN-2-64. The main difference is both CN-1-32 and CN-1-64 use a single convolutional layer. The other difference is while CN-1-32 consists of 32 features with a 9 9 kernel, CN-1-64 contains 64 features with a 9 9 kernel. All the other layers remain the same.
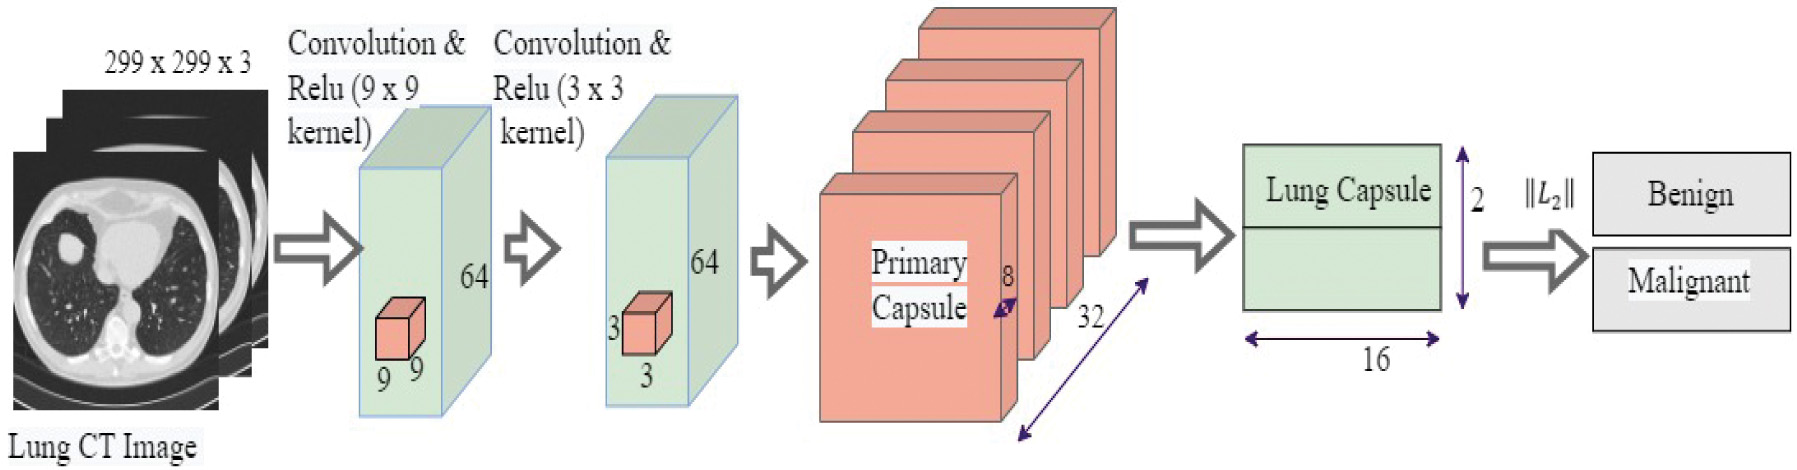 Fig. 3. The proposed CN-2-64 CapsNet architecture for lung cancer classification.
Table I provides layer-by-layer dimensional information, such as the parameters of the network layers and feature maps of the Proposed CapsNet. CT images are down-sampled from 512 512 to 299 299 and used as inputs to the model to cut down the number of parameters and shorten the time for training. The next layer is a convolutional layer that produces 64 feature maps using 9 9 filters and a stride of 1. Next convolutional layer generates 64 feature maps using 3 3 filters and a stride of 1.
Table I. Dimensional information and results of the proposed CN-1-32, CN-1-64, and CN-2-64 CapsNet architectures
| Layers | Output Size | ||
|---|---|---|---|
| CN-1-32 | CN-1-64 | CN-2-64 | |
| Input | 299 299 3 | 299 299 3 | 299 299 3 |
| Convolution & Relu (9 9) | 291 291 32 | 291 291 64 | 291 291 64 |
| Convolution & Relu (3 3) | NA | NA | 289 289 64 |
| Reshape | 88681, 32 | 84681, 64 | 83521, 64 |
| Primary Capsule | 32, 8 | 32, 8 | 32, 8 |
| Lung Capsule | 2, 16 | 2, 16 | 2, 16 |
| Output | 2 | 2 | 2 |
| Total parameters | 16,256 | 32,256 | 69,184 |
| Average Processing Time per Epoch (sec.) | 1321 | 1372 | 1556 |
Table I also describes the total parameters and the average processing time for the three CapsNets. From Table I, it is known that CN-1-32 has a small number of parameters, which means that it processes promptly on average. CN-2-64 has the maximum parameters of the three, which results in an excessively high average processing time.
IV.EXPERIMENTAL RESULTS AND DISCUSSION
The experiments were performed with the help of Python frameworks like Keras and TensorFlow, and the i5-1135G7 CPU and GPU NVIDIA MX450 were used to accelerate the process. A greater number of factors and the incorporation of routing into capsules may lengthen the training process. A routing procedure facilitates the connection between the lower and upper capsules. The algorithm used in dynamic routing is described in detail in Algorithm 1. The size of the available GPUs has a direct impact on training time.
| Algorithm 1. Dynamic Routing for the CapsNet Architectures |
|---|
| 1. |
| 2. Initialize , for every capsule in layer and in layer |
| 3. |
| 4. Calculate = |
| 5. Calculate |
| 6. Find |
| 7. |
| |
The confusion matrices of the proposed CN-1-32, CN-1-64, and CN-2-64 are shown in Fig. 4, which is used to obtain True Positive ( False Positive , False Negative , and True Negative . The accuracy, precision, sensitivity, specificity [32], error rate, Cohen’s Kappa Coefficient (), and Matthew’s Correlation Coefficient ), scores can be calculated from the aforementioned four variables using Equations (5)–(11).
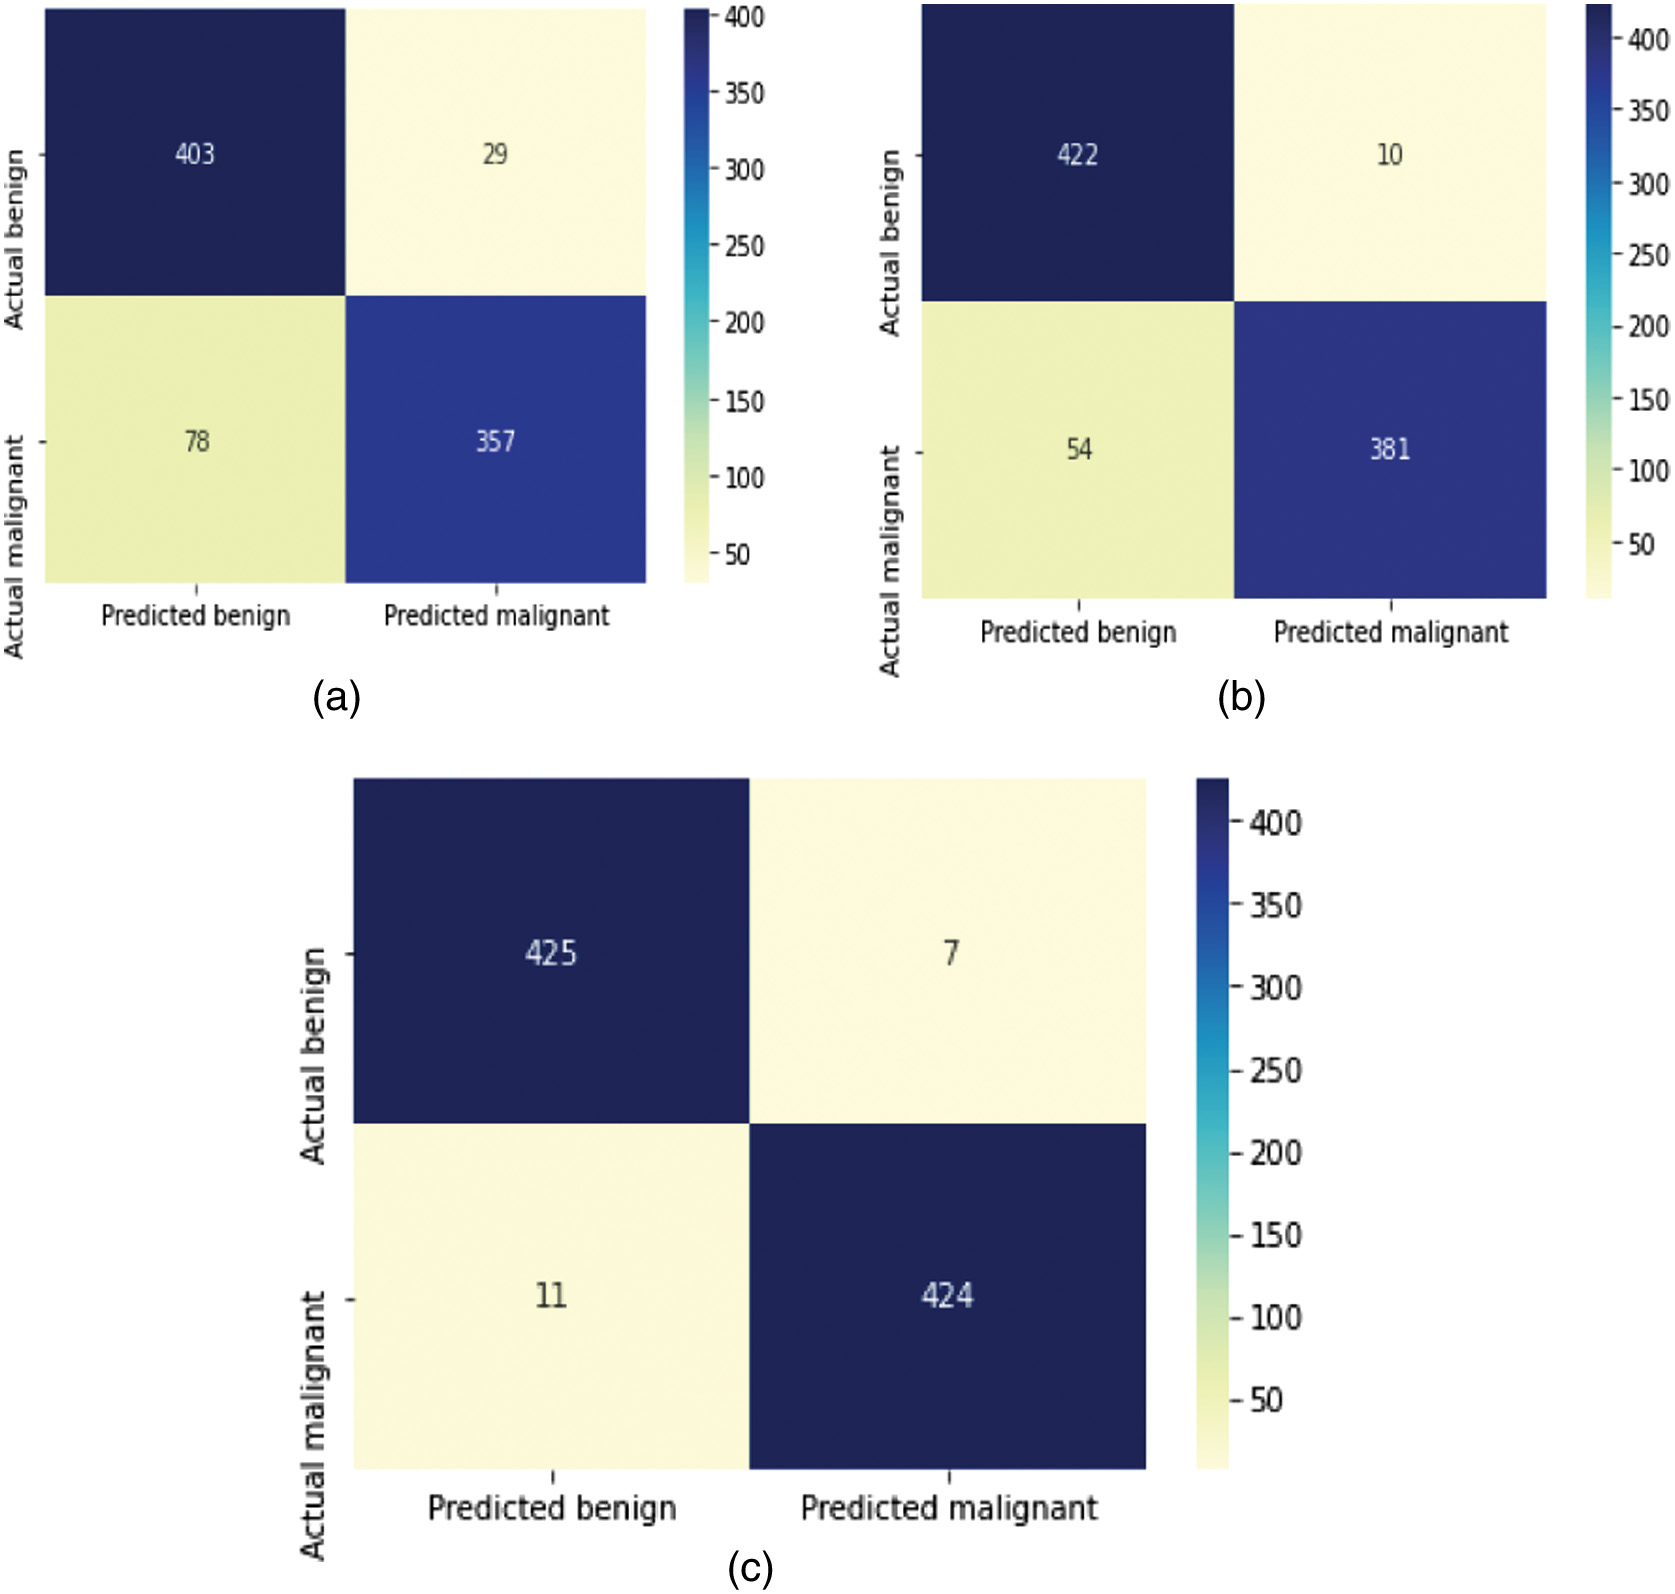 Fig. 4. Confusion matrices of the proposed (a) CN-1-32, (b) CN-1-64, and (c) CN-2-64 CapsNet architectures.
Table II summarizes the outcomes of several approaches, revealing that the original CapsNet performs unexpectedly low when used directly for lung cancer classification. Due to its origins in recognizing handwritten numeric characters, convolutional layers of CapsNets are rather tiny and shallow. This allows them to extract more detailed characteristics from the shapes. However, the main structure cannot be used since the textures in lung data are more complicated than those in MNIST data. The proposed model is based on this foundational network by adding more convolutional layers, expanding the size of convolutional feature maps, and increasing the number of network layers overall. The efficiency of this combination and layout has been verified by experimental observations. Specifically, the model compares the outcomes for CapsNet with a single convolution Layer and 32 Feature Map (CN-1-32), a single convolution Layer and 64 Feature Map (CN-1-64), and a double convolution Layer and 64 Feature Map (CN-2-64) for the model. Accuracy, Recall, Precision, and specificity are calculated using the confusion matrices shown in Fig. 4. The classification accuracy of CN-1-32 is 87.65%, CN-1-64 is 89.61%, and CN-2-64 is 97.92%. The Recall, precision, and specificity value of CN-1-2 are 82.06%, 92.48%, and 93.20%. Finally, CN-1-64 achieved 87.12%, 91.76%, and 92.10%, while the CN-2-64 produced 97.47%, 98.37%, and 98.37%, respectively.
Table II. Quantifying parameters of the proposed (a) CN-1-32, (b) CN-1-64, and (c) CN-2-64 CapsNet architectures
| Capsule network architectures | Accuracy (%) | Recall (%) | Precision (%) | Specificity (%) | Error rate (%) | MCC | KP |
|---|---|---|---|---|---|---|---|
| CN-1-32 | 87.65 | 82.06 | 92.48 | 93.20 | 12.34 | 0.758 | 0.753 |
| CN-1-64 | 92.61 | 87.58 | 97.44 | 97.68 | 7.38 | 0.856 | 0.852 |
| CN-2-64 |
The frequency with which the model makes an incorrect prediction is quantified using the error rate metric. When the error rate is 0, it signifies that the model is making accurate predictions. A 2.07% error rate in CN-2-64 is substantially low, while the 12.3 and 7.38% error rates in CN-1-32 and CN-1-64 are significantly more acceptable. MCC values for CN-1-32, CN-1-64, and CN-2-64 are, respectively, 0.758, 0.856, and 0.958. Inter-rater reliability for categorical items can be calculated with the use of the Kappa statistic. As KP accounts for the probability of the agreement occurring by chance, it is typically considered to be a more robust statistic than simple percent agreement computation. The KP values for CN-1-32, CN-1-64, and CN-2-64 are 0.753, 0.852, and 0.958, respectively.
The graphical representation of the performance parameters of the classifier models with different quantifying parameters is also displayed in Fig. 5. All models produce better outcomes for lung cancer categorization in terms of quantifying parameters. But CN-2-64 outperformed the others in terms of all parameters. Figure 6 also displays the graphical depiction of the performance characteristics of the classifier models with MCC and KP values.
 Fig. 5. Graphical representation of the quantifying parameters of the proposed CN-1-32, CN-1-64, and CN-2-64 CapsNet architectures.
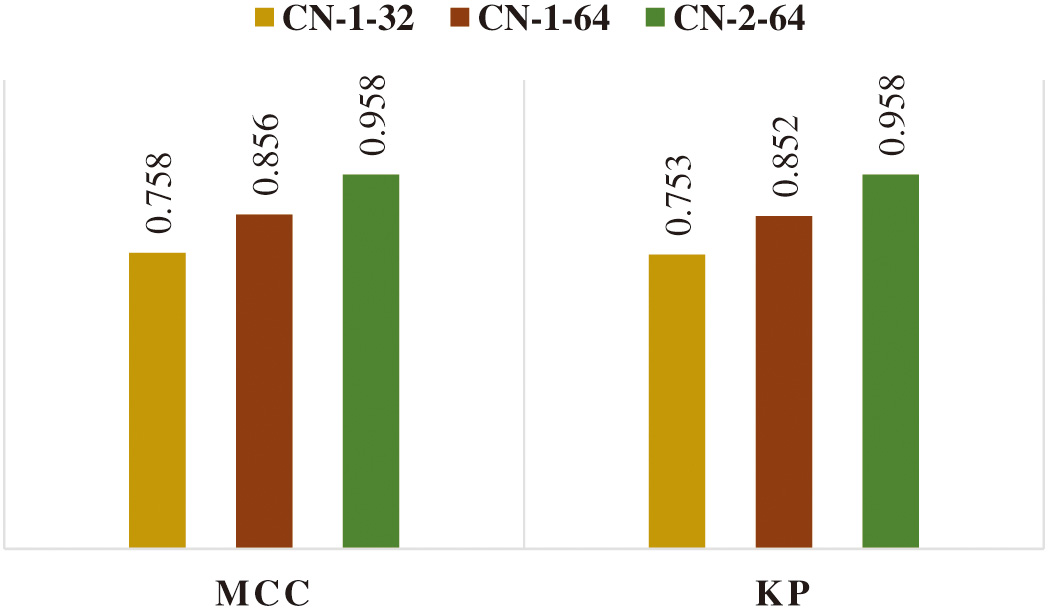 Fig. 6. Graphical representation of MCC and KP values of the proposed CN-1-32, CN-1-64, and CN-2-64 CapsNet architectures.
The loss function of the proposed CapsNet is computed by Equation (12) for each capsule .
where is equal to one while the class k is present and 0 whenever it is not. The hyperparameters of the model are denoted by the notations , , and . The total loss is determined by adding up all of the individual losses.The accuracy metrics for the three models during training and validation are shown in Fig. 7. The loss values of these models experienced during training and validation are shown in Fig. 8. When compared to the CN-1-32 model and the CN-1-64 model, the loss value stabilized faster in the proposed CN-2-64 model.
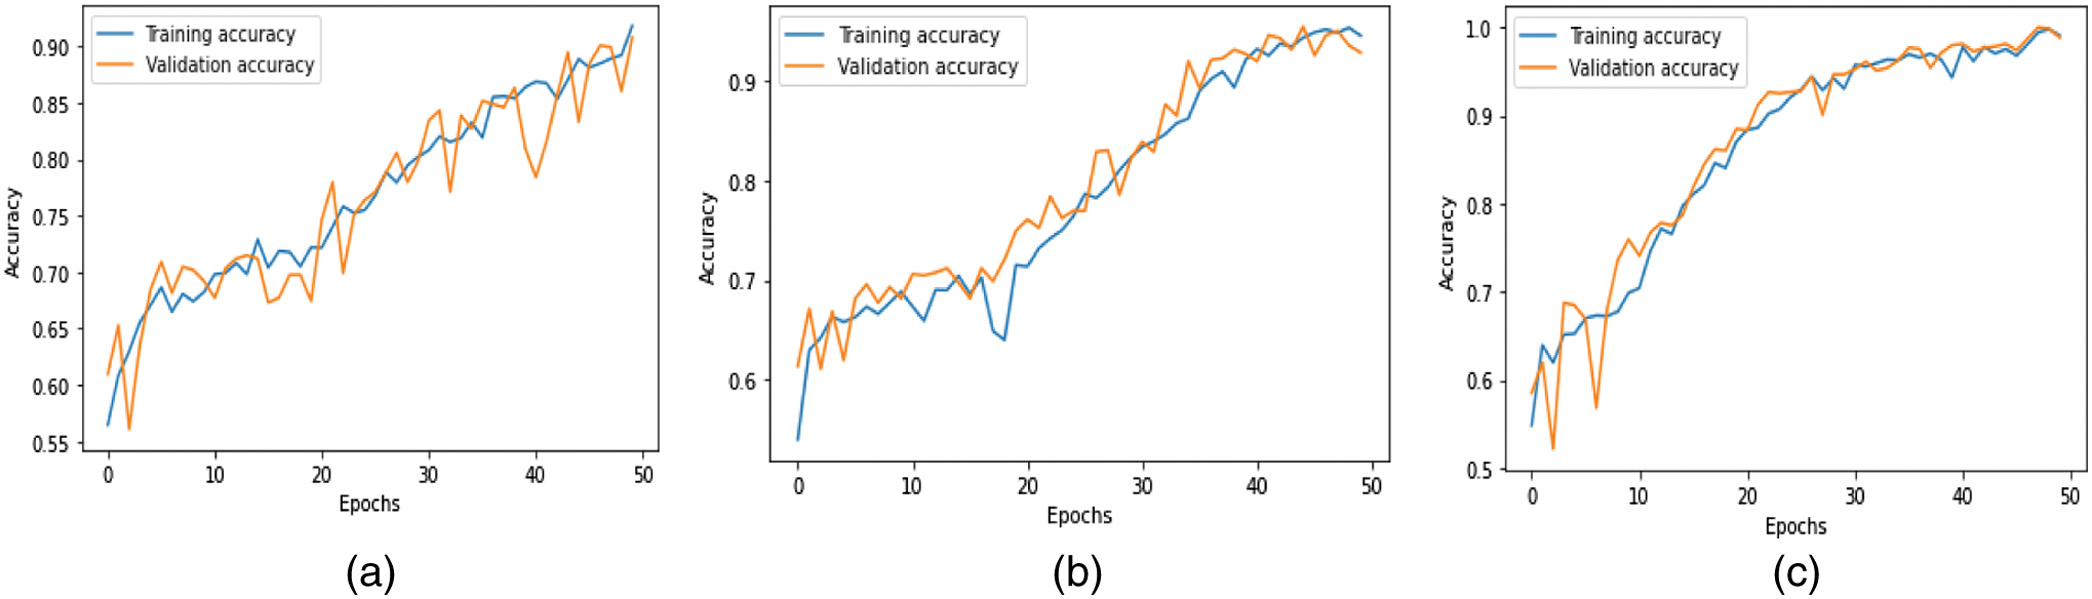 Fig. 7. Training and validation accuracy of the proposed (a) CN-1-32, (b) CN-1-64, and (c) CN-2-64 CapsNet architectures.
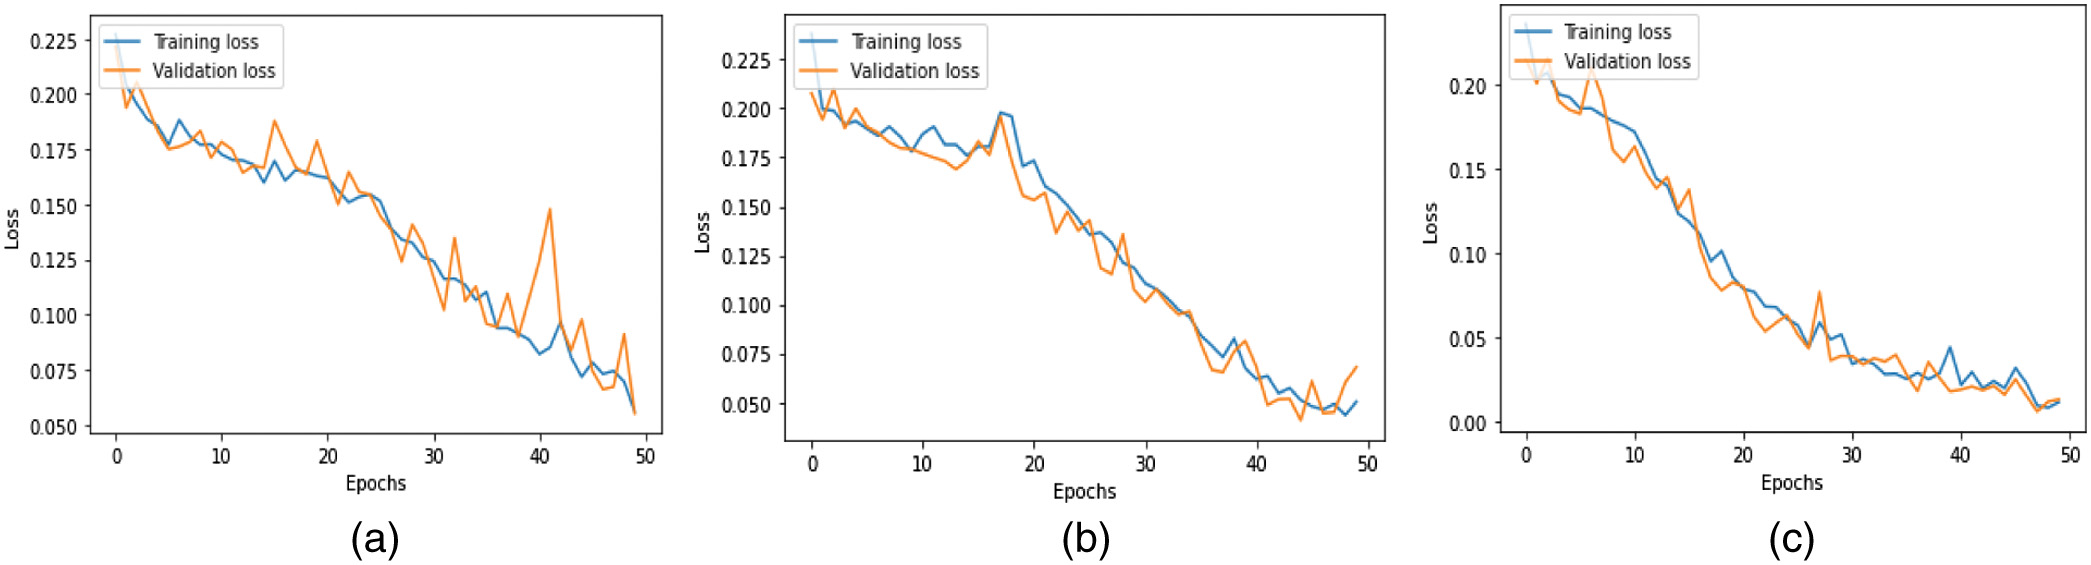 Fig. 8. Training and validation loss of the proposed (a) CN-1-32, (b) CN-1-64, and (c) CN-2-64 CapsNet architectures.
If there is only a minor difference between the two final loss values, then the training loss and the validation loss are very close, and the fit is Good. Compared to the CN-1-32 and CN-1-64 models, the CN-2-64 model has a higher level of Good Fit in both its train and validation learning curves. The results of the presented CapsNet were compared to the results of other related works using the LIDC_IDRI dataset as shown in Table III. From Table III, it is known that the presented method outperformed the other lung cancer classifications in terms of quantifying parameters such as accuracy, recall, precision, and specificity.
Table III. The proposed CapsNet architecture performance comparison with the state-of-the-art networks for the LIDC-IDRI dataset
| State-of-the-Art networks | Accuracy (%) | Recall (%) | Precision (%) | Specificity (%) |
|---|---|---|---|---|
| CNN [ | 95.00 | 94.50 | 94.50 | – |
| 3D CNN [ | 90.10 | 84.10 | – | 91.70 |
| CNN [ | 84.15 | 83.96 | – | 84.32 |
| Statistical and shape based [ | 92.00 | 93.75 | 85.11 | 91.18 |
| MC-CNN [ | 87.14 | 77.00 | – | 93.00 |
V.CONCLUSION
In this research, the classification efficiency of three capsule neural networks is compared after being trained on a total of 2774 images and then tested on a total of 867 images. The images of lung cancer were classified into two categories, including benign and malignant, based on the characteristics of cancer. CapsNet outperformed CNNs in the lung cancer classification challenge because it is more tolerant of a limited number of training data and because the elements in these networks are equivariant. Increasing the accuracy could also be achieved by adjusting the number of feature mappings used in the convolutional layers of the capsule network. The proposed CapsNet with two convolutional layers (CN-2-64) achieved better accuracy (97.92%), precision (98.37%), and recall (97.47%). The experimental results showed that the suggested method performed well over the state-of-the-art classifiers for lung cancer diagnosis in terms of classification accuracy.
In the future, it is planned to examine the implications of having more capsule layers on the accuracy of the classification, as well as explore the CNN architectures to encode input for CapsNet to achieve better performance.