I.Introduction
Artificial intelligence is making significant strides in the medical field. The selection of an appropriate model from the many available models can be a time consuming and laborious process, but it is essential to achieve favorable outcomes that benefit both doctors and patients. An increasing number of individuals are suffering from diabetes, which adds to the rising in morbidity and mortality rates. Diabetes is a persistent issue that presents a significant difficulty to every nation. In additional to Type 1 and Type 2 diabetes, gestational diabetes is a variant of the disease. Type 2 diabetes can develop later in life from gestational diabetes, a form of diabetes that appears during pregnancy. Since there is no permanent solution for this chronic disease, early detection and prevention of diabetes are crucial. Diabetes risk factors include family history, age, and weight, and maintaining a healthy lifestyle is critical in preventing the disease’s onset. Diabetes symptoms include blurry vision, intense thirst, frequent urination, slow wound healing, and persistent fatigue. Diabetes can also cause retinopathy, neuropathy, cardiovascular disease, nephropathy, and Alzheimer’s disease.
The research proposed several techniques to develop predictive models for healthcare professionals using various classifiers and data preprocessing techniques. To predict this disease, the article utilized the PID dataset from the ML database at the University of California and the DiabetesType dataset from the data world repository. This investigation has combined many ML models to predict whether the case is positive or negative and which type of diabetes is involved.
The structure of the rest of this paper is as follows: In Section II, several state-of-the-art methods are presented for predicting diabetes. While in Section III presents, an overview of the different methodologies employed, such as problem definition, preprocessing, and model evaluations. Preprocessing is discussed in more detail in Sections III, and IV covers the findings and discussion. Lastly, Section V concludes the paper and includes recommendations for further research.
II.RELATED WORK
Many researchers are still working in this area. The author [1] used the PID and regional datasets from Bombay upper bazaar medical hall Ranchi Jharkhand. The classification approaches include logistic regression, naïve Bayes, KNN, ID3 DT, and C4.5 DT. They used PCA and PSO techniques for feature reduction and found that PCA outperformed better. They concentrated [2] on the convolutional neural network long short-term memory (CNN-LSTM) DL approach, and the PID dataset is employed for diabetes mellitus prognostication. The obtained accuracy achieved by the authors is 68-74%. The author’s [3] point of convergence is to develop a decision support system for Type 1 diabetic people. The framework properly equipped medical records from 15 contributors with physiologically workable licensed model parameters. The study in [4] used electronic health records (EHRs) that are received from five Saudi hospitals and include three areas central, eastern, and western regions. The dataset consists of approximately 3000 patients assembled over two years from 2016 until 2018 via one-of-a-kind divisions such as outdoor patient, inpatient, and urgent situation. FPG labeled dataset gives better results as compared to HbA1c labeled dataset. The author in [5] uses doctors with the ability to quickly, accurately, and precisely monitor emergency patients who are confined to their homes utilizing telemedicine. In [6], nevertheless, because most current common neural network models are somewhat large, it has proven difficult to deploy them on IoMT devices. In [7], the author developed a system for COVID-19 prediction. The study in [8] developed an SVM framework for the prediction of diabetes. They used a chi-squared test, different trees, and lasso feature selection techniques with 83.20% accuracy, 87.20% sensitivity, and 79% specificity. The focus of the paper [9] is to introduce a local explainable agnostic model that leverages ensemble methods to predict diabetes. The research demonstrates that the accuracy of the ensemble voting classifier on the Pima Indian diabetes dataset is 81%, outperforming other traditional predictive models. In this paper [10], the classifiers taken are logistic regression, XGBoost, gradient boosting, decision trees, ExtraTrees, random forest, and light gradient boosting machine (LGBM). The results obtained from these classifiers show that the LGBM classifier has the highest accuracy of 95.20% in comparison with the other algorithms. The authors have [11] suggested an automated classification pipeline that includes a weighted ensemble of machine learning (ML) classifiers: Naive Bayes (NB), random forest (RF), decision tree (DT), XGBoost (XGB), and LightGBM (LGB). Grid search hyperparameter optimization is employed to tune the critical hyperparameters of these ML models. Furthermore, missing value imputation, feature selection, and K-fold cross-validation are included in the framework design. A statistical analysis of variance (ANOVA) test reveals that the performance of diabetes prediction significantly improves when the proposed weighted ensemble (DT + RF + XGB + LGB) is executed with the introduced preprocessing, with the highest accuracy of 0.735 and an area under the ROC curve (AUC) of 0.832.
Nevertheless, traditional algorithms could only forecast the degree of presence of the disease’s probability in the future. In this analysis, we present a unique ensemble learning method for forecasting diabetes risk and determining whether a specific form of diabetes, T1D or T2D, is expected to develop later on.
A.RESEARCH GAP
According to the literature survey, there is a research gap that needs to be filled by shedding more light on the development of a diabetes prediction model using machine learning techniques.
- •Numerous diabetes prediction models are typically trained using specific datasets or populations, which may limit their ability to perform well in other patient groups or environments. To investigate potential approaches for enhancing the generalizability of ML models for diabetes prediction, further research is required.
- •Relying solely on a single algorithm is frequently insufficient and may not produce the required results when using conventional ML approaches to predict diabetes. In order to increase the investigation’s accuracy and efficacy, ensemble models must be used. The distribution of individuals with diabetes is imbalanced, leading to unsatisfactory classification scores in datasets. This is due to the limited availability of records for diabetes patients in current accessible databases.
- •The task of accurately predicting diabetes is incredibly challenging due to several factors such as the limited availability of labelled data, the presence of missing values, and the existence of outliers within the diabetes dataset.
III.PROPOSED METHODOLOGY
The prevalence of diabetes in today’s daily life is a concerning issue, as many individuals struggle to manage their health properly. This condition can affect anyone regardless of their age, and the contributing factors can differ depending on the age group. In this section, we outline the materials and methods utilized in our experiments, which involve using two datasets in our proposed model for predicting diabetes. To improve the accuracy of our analysis, we applied several preprocessing techniques to clean, transform, and reduce the raw data. This resulted in a structured dataset better suited for utilization in ML classifiers. To analyze how well our proposed methodology is functioning, we conducted simulations using a 10-fold cross-validation method. This approach is utilized to validate the model’s efficiency, distinct from the general train-test-split process. The preprocessed data will then be fed into various ML classifiers and tested to determine which model gives the best results on both datasets. The preprocessed data are fed into ensemble approaches, which are a collection of ML algorithms such as average, voting, and stacking. The results are analyzed using a range of performance statistics and compared to cutting-edge methodologies. The block diagram of the proposed framework and the subsequently proposed algorithm is shown in Fig. 1.
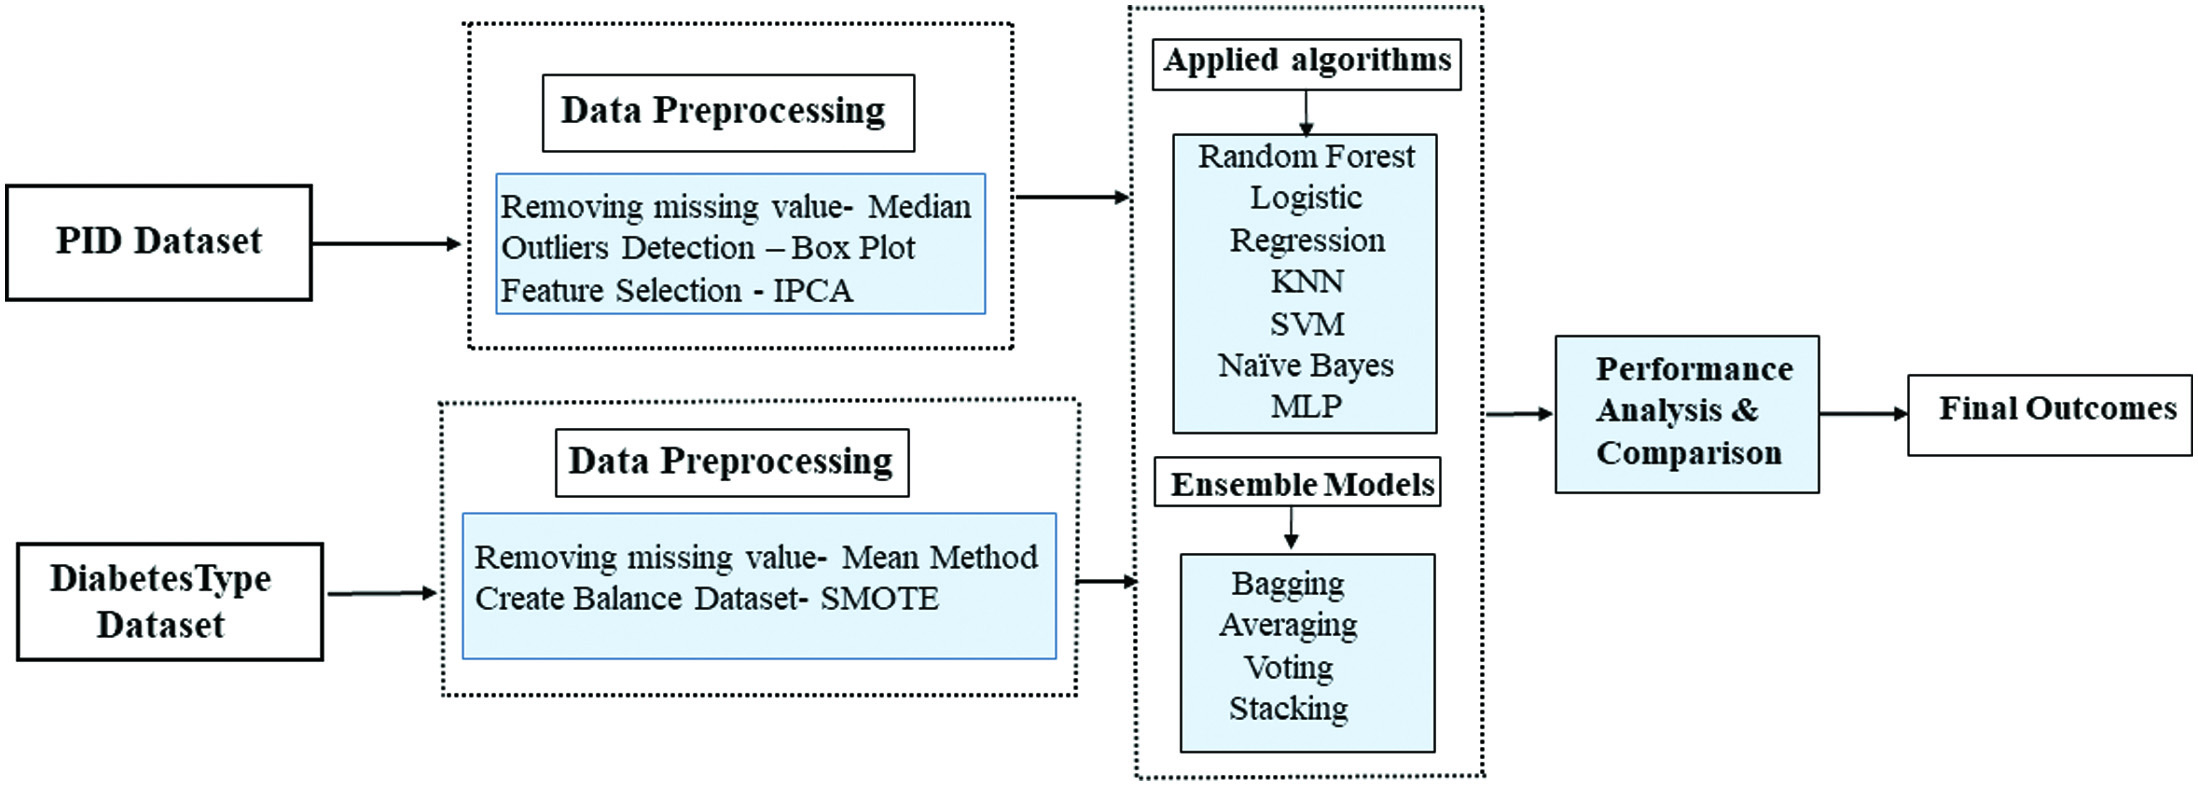 Fig. 1. Methodology of the proposed model.
A.DATASET DESCRIPTION
Pima Indian Diabetes Dataset is acquired from UCI ML database [12], and the DiabetesType dataset is gathered from Data World Repository for diabetes prediction. The DiabetesType dataset [13] contains 1009 records and six columns, whereas the PID dataset contains 768 records and nine columns. The datasets contain some missing values as well as some outliers. There is one target column in the PID dataset, which can be either 0 or 1, depending on whether the subject has diabetes or not. The DiabetesType dataset comprises a target column and a class column that identifies the sort of diabetes an individual has. The class column incorporates three values, zero for normal, one for Type 1 diabetes, and two for Type 2 diabetes (Fig. 2).
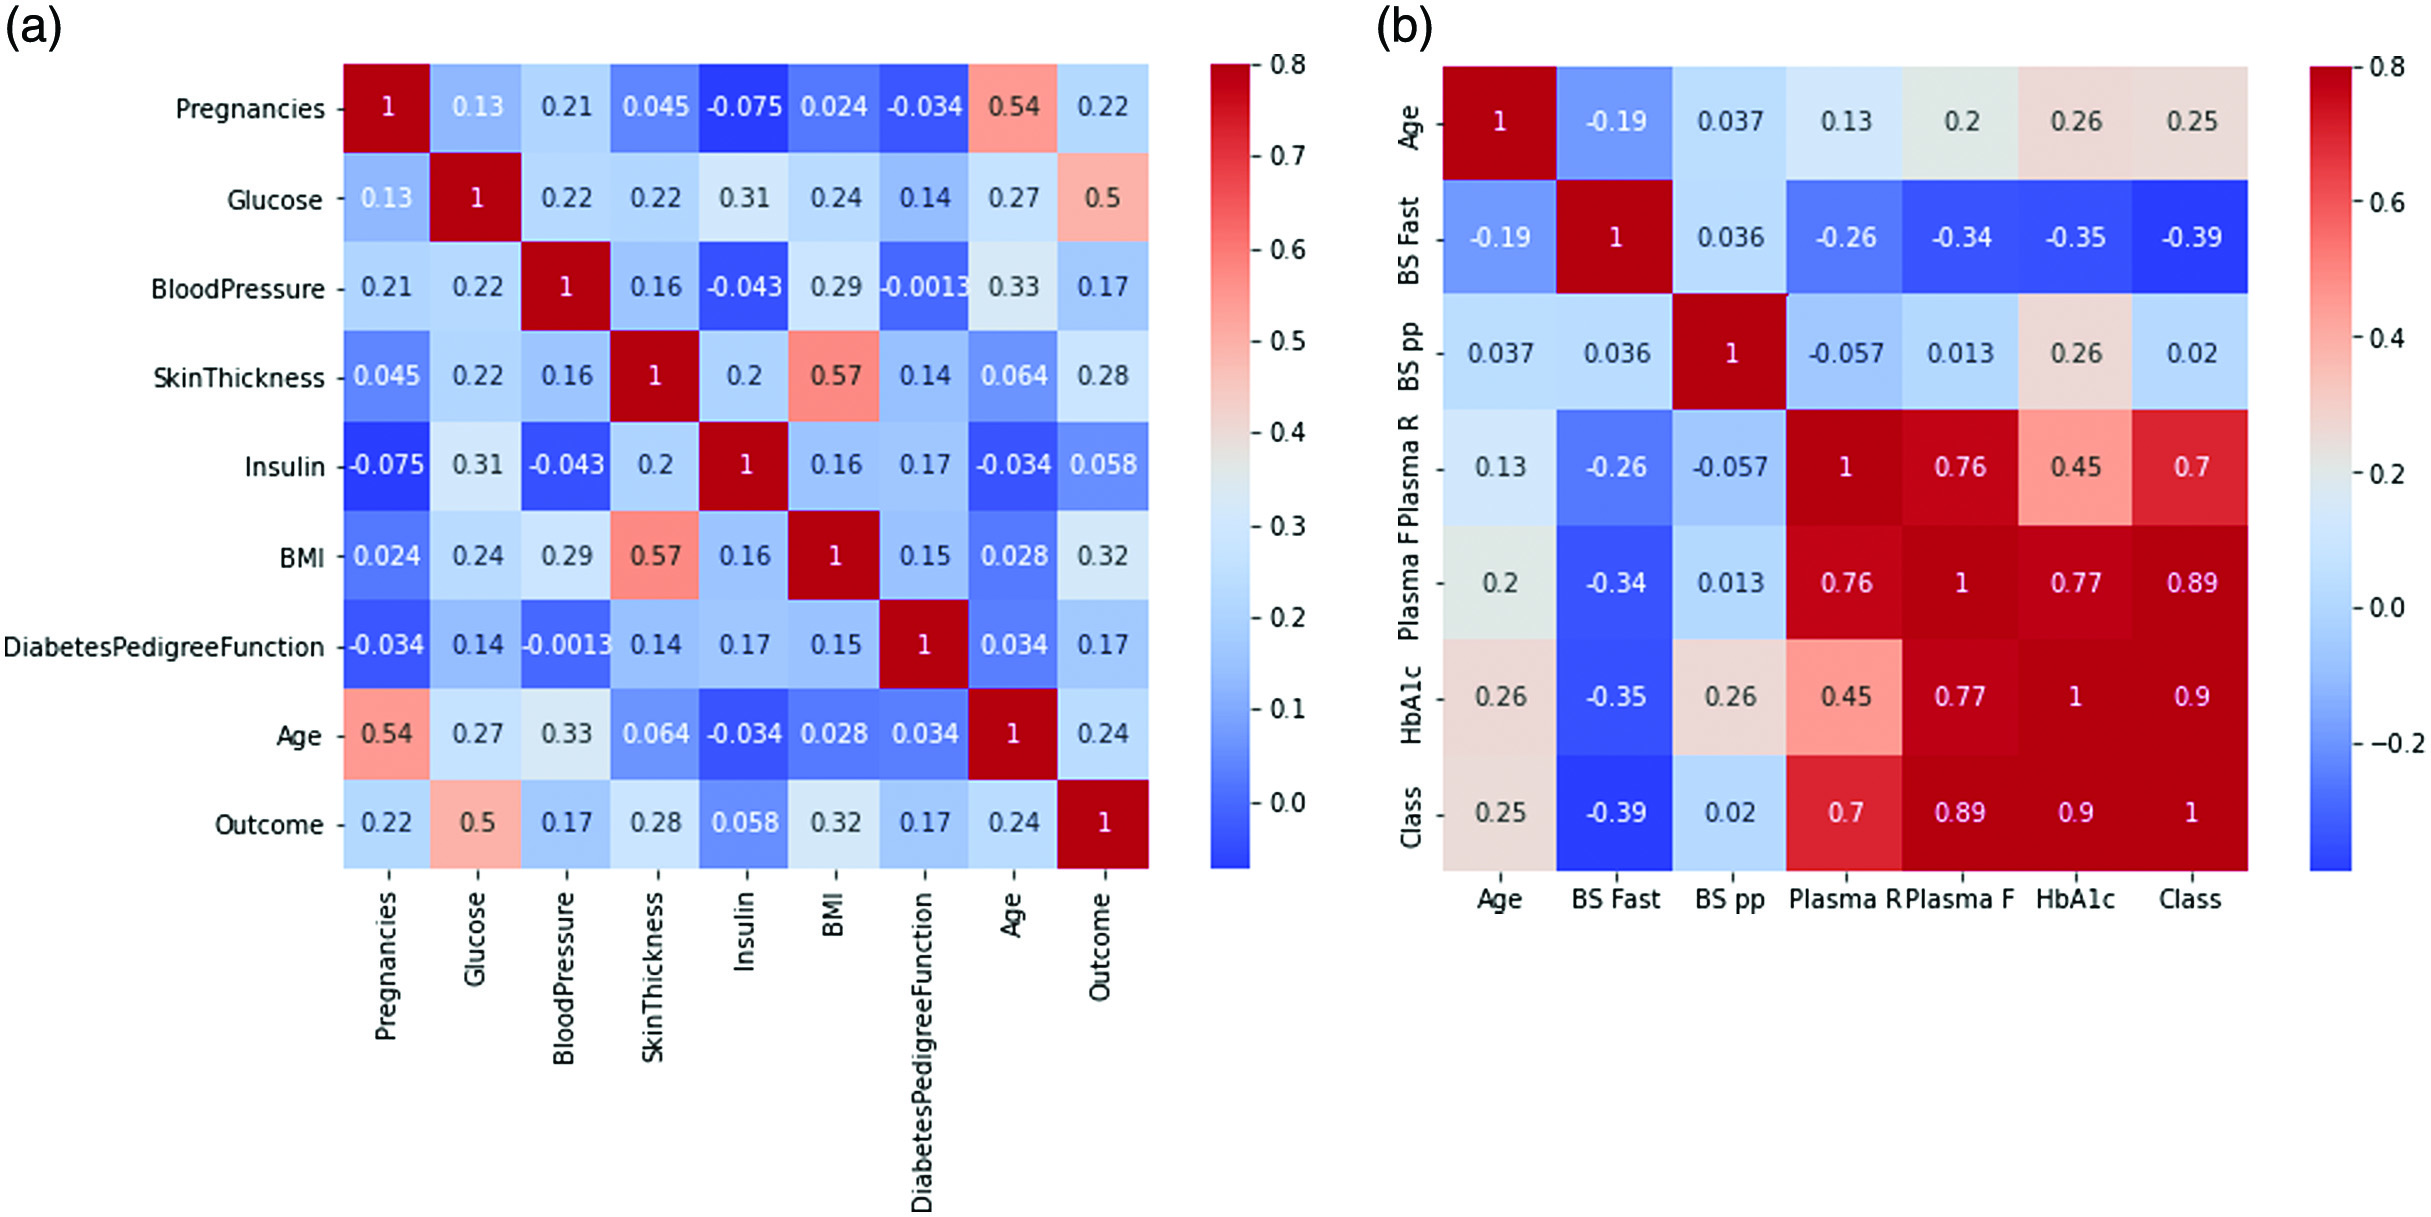 Fig. 2. (a) Heat map of PID dataset (b) Heat map of DiabetesType dataset.
B.DEALING WITH IMBALANCED DATA
As seen in Fig. 3, the distribution of the class is significantly imbalanced. The class distribution of the PID dataset is shown in Fig. 3(a) According to this dataset, which includes 500 observations of normal individuals (65.1%) and 258 observations of diabetes patients (34.9%), the ratio of normal persons to diabetes patients is very high. The DiabetesType dataset is imbalanced, as illustrated by Fig. 3(b, which indicates that there are significantly fewer entries for people with diabetes than for non-diabetics. Data visualization allows us to demonstrate the imbalance in the DiabetesType dataset, which includes records for 62.5% of healthy individuals, 17.1% type 1 diabetics, and 20.3% of type 2 diabetics, respectively. When both classes’ records are equal, the model tends to provide more accurate prediction scores. On the other hand, a significant imbalance in the number of records between the classes can lead to poor performance in classifying the data.
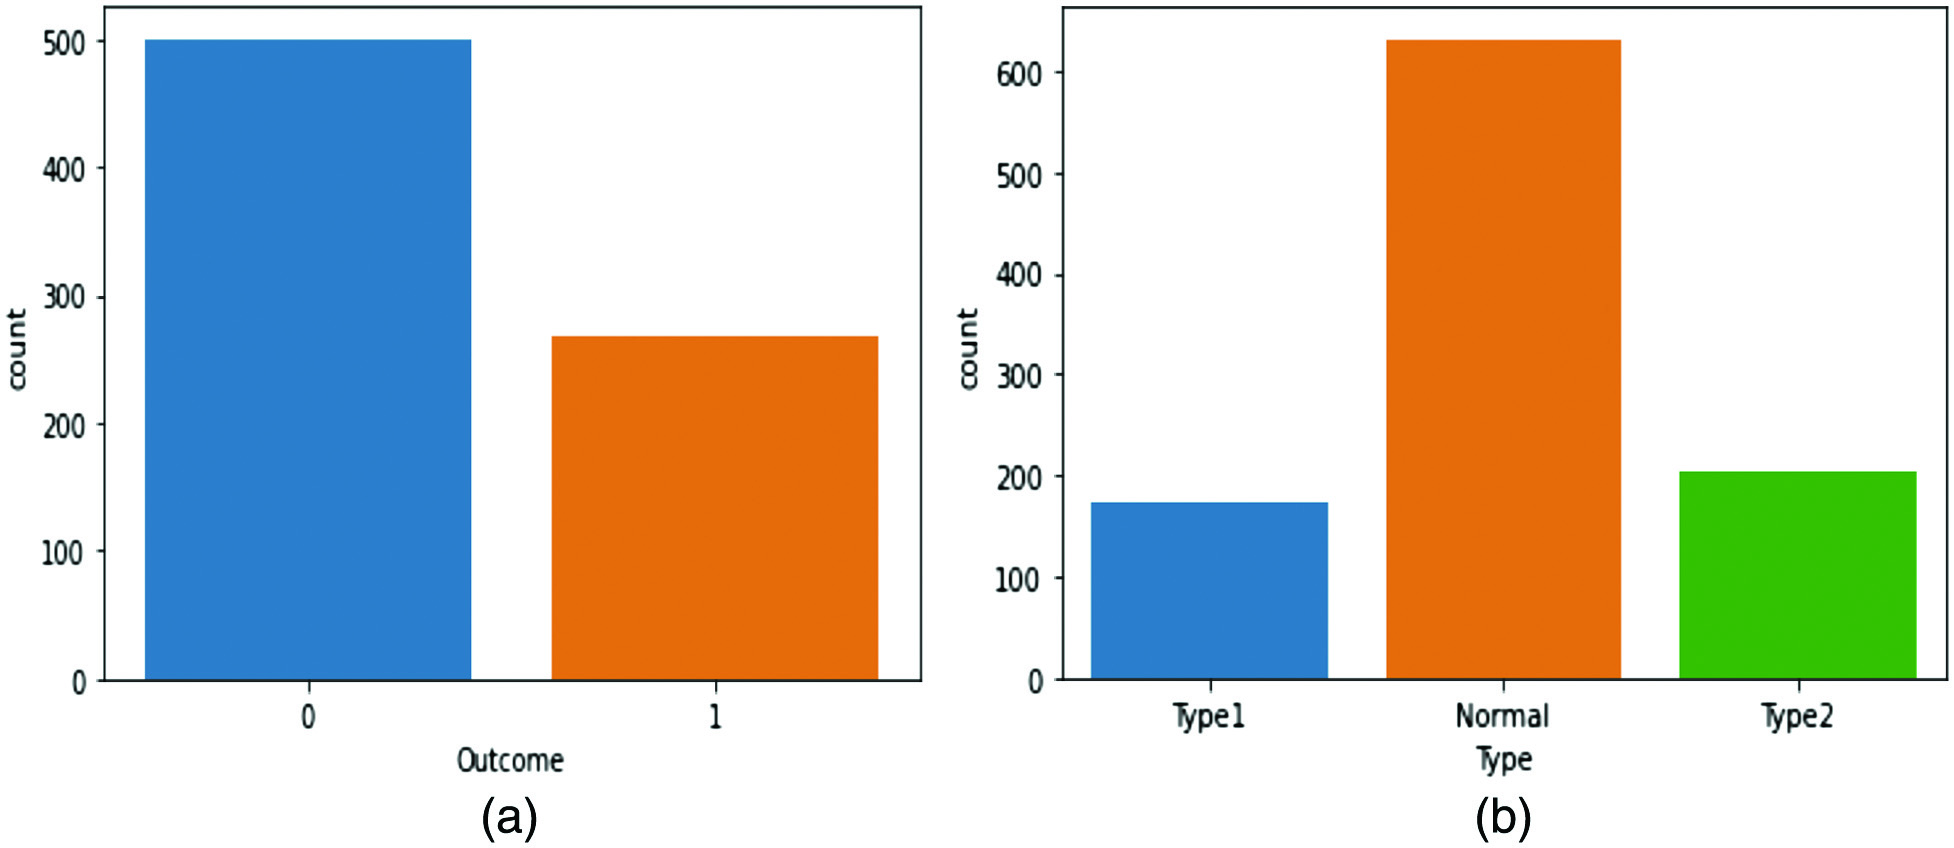 Fig. 3. (a) Class distribution of the PID dataset (b) class distribution of the DiabetesType dataset.
In order to address the problem of imbalanced datasets, two techniques, undersampling and oversampling, can be employed. However, if the dataset contains a small number of records, undersampling results in poor classification rates, and therefore oversampling techniques are utilized. The SMOTE technique is used in these experiments to balance both datasets, which enables the model to produce accurate findings.
SMOTE is widely used in ML research to address the data imbalance issue. It involves creating synthetic samples of the minority class by interpolating between existing samples and their neighbors. The interpolation is done by randomly selecting a feature and computing the difference between the selected sample and one of its neighbors. A synthetic sample is then created by adding a multiple of this difference to the chosen sample. A user-defined parameter can control the number of synthetic samples to be created. The resulting dataset will have an equal number of samples in both classes, thus reducing the class imbalance. SMOTE has improved classification performance in various domains, including medical diagnosis, fraud detection, and natural language processing.
C.MODEL ARCHITECTURE
This diabetes prediction system includes numerous ML classifiers that take into consideration various factors from both datasets. Physicians can diagnose sufferers through the utilization of the statistics provided by the classifier. The proposed system benefits healthcare professionals, who can use the model to indicate if an affected person is at excessive risk for certain ailments and circumstances. In this proposed methodology, random forest, logistic regression, K-nearest neighbor, support vector machine, Naïve Bayes, and multilayer perceptron have been employed. After using traditional techniques, we also feed the data into an ensemble learning approach for the reason that these methodologies are ingenious and are able to present how the inputs have an impact on the output. The parameters of the above-mentioned algorithms have been tuned to improve the accuracy of the classifiers. These models are discussed in detail in the below-given segment. The information and its formula are explained in the descriptions of the classifiers.
IV.RESULT AND DISCUSSION
The PID and DiabetesType datasets are utilized for simulating the model; cross-validation is used to split the dataset. The datasets are divided into fivefold cross-validation for training and testing data. The DiabetesType dataset has 1009 cases of diabetic patients, while the PID dataset has 768 records of diabetic patients. Both datasets have been divided into fivefold cross-validation. The feature engineering techniques enhanced the dataset’s quality, where outlier rejection and imputation of missing values were a fundamental concern. SMOTE delivers an acceptable outcome because the classification rate of the imbalanced data needs to be improved. The kurtosis and skewness of the attribute expansion in the datasets can be addressed using preprocessing strategies. The assessment of the diabetes prediction model and its statistics demonstrated that the framework is effective and produces favorable performance. The results of the grid search show that the ensemble model with the optimal hyperparameters outperforms the individual base models. This demonstrates the effectiveness of grid search in finding the optimal hyperparameters for a complex machine learning model. When implementing and evaluating different ML algorithms, performance indicators, including accuracy in classifying, precision, specificity, and recall, are considered. The number of positive and negative cases that are included in the dataset is represented. The PID dataset has 34.9% of diabetic people, while the DiabetesType dataset has 37.4% of diabetic people, while the DiabetesType dataset has 37.4% of positive cases. In contrast to positive examples, negative issues are more prevalent in both datasets. The DiabetesType dataset contains the classes “0,” “1,” and “2.” “0” stands for the normal class, “1” for a patient with type 1 diabetes, and “2” for a patient with type 2 diabetes. The PID dataset has two classifications, 0 and 1 in it. “0” denotes a non-diabetic person’s case, and “1” indicates a diabetic person’s record. The datasets also include some missing values.
Tables I and II represent the outcomes of the different ML models and some ensemble learners (bagging, averaging, voting, and stacking). In the case of the PID dataset, the random forest bagging algorithms give better accuracy as compared to traditional techniques. The Naïve Bayes algorithm gives a poor classification rate. In the case of the DiabetesType dataset, the voting framework provides the best accuracy. Also, the multilayer perceptron model achieves 98.4% accuracy, which comparatively performs better. Logistic regression gives 90% accuracy, significantly less than other ML classifiers. A comparative graph for both datasets areis presented in Fig. 4.
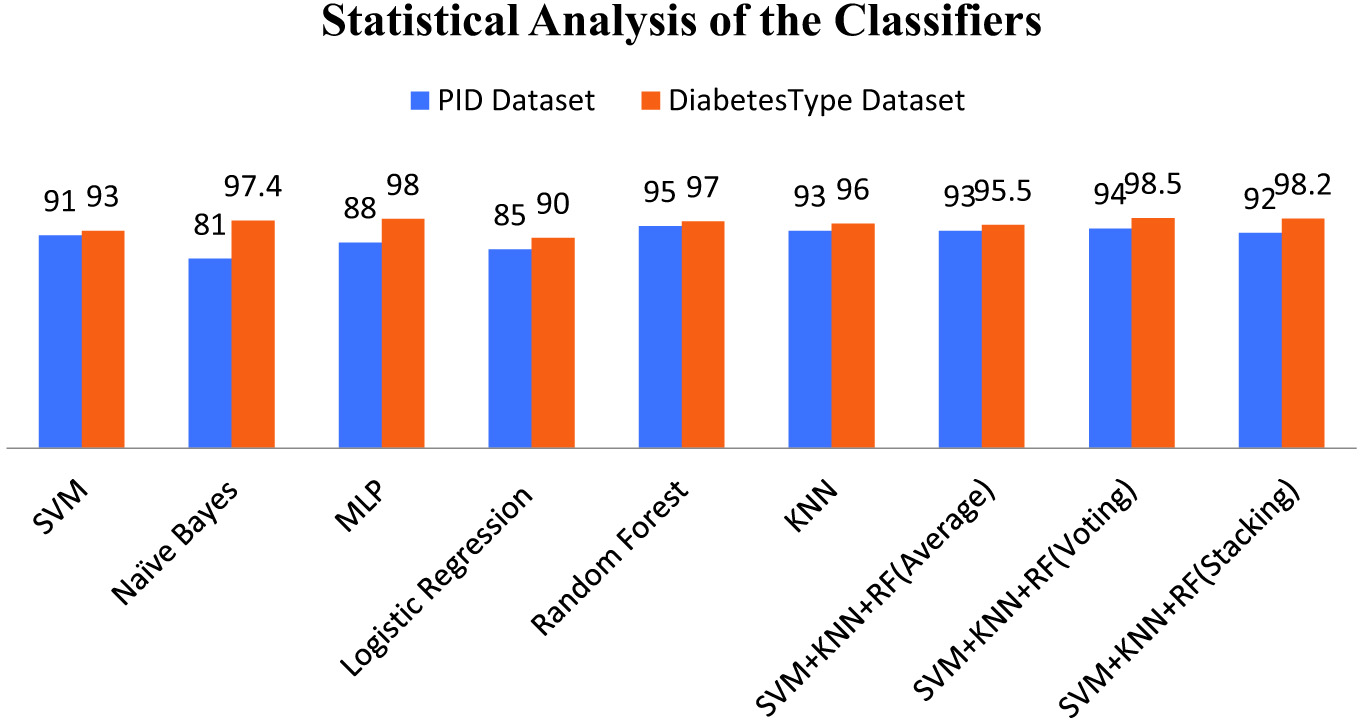 Fig. 4. Comparing classification accuracy of models.
Table I. Simulation result of classification techniques in PID dataset
| SN. | Classification technique | Accuracy (%) | Correctly classified | Incorrectly classified |
|---|---|---|---|---|
| 1. | SVM | 91 | 698.8 | 69 |
| 2. | Naïve Bayes | 81 | 622 | 146 |
| 3. | MLP | 88 | 675.8 | 92.5 |
| 4. | Logistic Regression | 85 | 652.8 | 115 |
| 5. | KNN | 93 | 714 | 54 |
| 7. | SVM+KNN+RF(Average) | 93 | 709 | 59 |
| 8. | SVM+KNN+RF(Voting) | 94 | 720 | 48 |
| 9. | SVM+KNN+RF(Stacking) | 92 | 644 | 124 |
Table II. Simulation result of classification techniques in DiabetesType dataset
| SN. | Classification technique | Accuracy (%) | Correctly classified | Incorrectly classified |
|---|---|---|---|---|
| 1. | SVM | 93 | 938 | 71 |
| 2. | Naïve Bayes | 97.4 | 982.7 | 26.3 |
| 3 | MLP | 98 | 978.7 | 30.3 |
| 4 | Logistic Regression | 90 | 908 | 101 |
| 5 | KNN | 96 | 968.6 | 40.4 |
| 6. | Random Forest(Bagging) | 97 | 988.8 | 20.2 |
| 7. | SVM+KNN+RF(Average) | 95.5 | 955 | 45 |
| 9. | SVM+KNN+RF(Stacking) | 98.2 | 982 | 18 |
Numerous evaluation criteria are considered for analyzing the ensemble learners and ML model. Performance metrics have several parameters, including F1 score, recall, precision, and accuracy. While recall indicates any missing positive predictions, precision calculates the positive predictive class. This research section compares the previous author’s results for diabetes and diabetes-type classification. This study compares ensemble ML model results using the PIMA and DiabetesType datasets. It can be concluded that, in the case of the PID dataset, the Bagging classifier has achieved maximum accuracy, precision, F1 score, recall, AUC value of 96.5%, 95.5%, 95.5%, 95%, 91.1%, respectively, as compared to other ensemble ML algorithms. Similarly, it can be observed from the table that in the case of the DiabetesType dataset, voting classifiers achieve maximum accuracy of 98.5% and 99% recall in the stacking method. Also, a comparison analysis from previous researchers is depicted in Table III.
Table III. Comparison analysis using state-of-art methods
| Authors & Ref. | Methods | Results | ||||
|---|---|---|---|---|---|---|
| Accuracy | Precision | Recall | F1-score | AUC-ROC | ||
| [ | Ensemble | 95.94 | – | – | – | – |
| [ | Adaboost + XGBoost | – | – | 78.9 | – | 95 |
| [ | Soft Voting classifier | 79.08 | 73.13 | 70 | 71.56 | 80.98 |
| Adaboost | 75.32 | 68.25 | 53.75 | 60.13 | 74.98 | |
| Bagging | 74.89 | 62.5 | 68.75 | 65.47 | 70.11 | |
| GradientBoost | 75.32 | 70.90 | 48.75 | 57.77 | 71.89 | |
| XGBoost | 75.75 | 64.28 | 67.50 | 65.85 | 69.01 | |
| CatBoost | 75.32 | 64.19 | 65 | 64.59 | 74.56 | |
| [ | Stacking classifier | 72 | 75 | 72 | 73 | – |
| Soft Voting | 73 | 74 | 73 | 73 | – | |
| XGB | 72 | 74 | 72 | 73 | – | |
| [ | XGBoost | 92.21 | 78.3 | 79 | 78.64 | 87.3 |
| DT | 78.79 | 66 | 57.8 | 61.62 | 78 | |
| RF | 82.25 | 78.7 | 71.4 | 74.87 | 87 | |
| [ | Stacking | 93.1 | 84 | 83.9 | 83.5 | – |
| PID Dataset | RF (Bagging) | 95 | 95.5 | 91.1 | ||
| SVM+KNN+RF(Average) | 93 | 94 | 91 | 83 | 82.1 | |
| SVM+KNN+RF(Voting) | 94 | 93 | 95 | 90 | ||
| SVM+KNN+RF(Stacking) | 92 | 92 | 96 | 94 | 93.1 | |
| DiabetesType Dataset | Random Forest(Bagging) | 97 | 93 | 90 | 91.4 | 95 |
| SVM+KNN+RF(Average) | 95.5 | 94 | 97 | 95.4 | 94 | |
| SVM+KNN+RF(Voting) | 95.5 | 96 | ||||
| SVM+KNN+RF(Stacking) | 98.2 | 92 | 83 | 97 | ||
V.CONCLUSION
This research introduced a novel intelligent ensemble framework for diabetes prediction. The study explores the diverse range of novel hybrid classifiers. Several preprocessing techniques were utilized to predict missing values and reduce the dimension of input data. The outcomes of our practical approaches indicated that the developed model enhanced the data quality and gave desirable results compared to affined methods. The current methodology was developed into two sections. The DiabetesType dataset was collected in the first part, and in the second part, the Pima Indian Diabetes Dataset was selected for practical implementation. The six classification techniques applied on both datasets were random forest, logistic regression, KNN, SVM, MLP, and Naive Bayes. Random forest gives the best result with 96% accuracy and 95.5% precision and recalls in the case of the PID dataset. The voting classifiers gave better accuracy of 98.5 % in the case of the DiabetesType dataset. In addition, several more performance measurements were used to evaluate the models’ output and analysis. Precision, recall, and F1-score values from these models were satisfactory. The ranges were greater than 0.5, which was notable and significant. Therefore, it was concluded from this research that the ensemble model gave better results. People would save time and money by utilizing this framework, and medical professionals would benefit from it. It remarked that the classifier’s attainment for both datasets was different. So, the performance of a classification model depends on the dataset. This is a suggestion for upcoming researchers: one should not rely on any particular classification model. Different models can generate different results with different datasets.