I.INTRODUCTION
To gain the confidence of investors in the stock market, companies need to analyze and clarify the role of corporate governance, from different aspects, including accounting, finance, business economics, law, management, etc. In addition to those factors, businesses also need to pay more attention to management methods and techniques and how to achieve the best results. When researching the best way to build and manage a business, whether in Asia, Europe, or the United States, the most important thing is to have the right and effective governance mechanisms.
The electronics industry, which has led Taiwan to create economic miracles, has been expanding in scale and output value since its fortune. From reviewing the history of Taiwanese semiconductors to the recent promotion of AI artificial intelligence (AI) strategy planning, it is closely related to IC design. Taiwan presently is among the leaders in the global semiconductor industry, and there is still a lot of room for development in the future. Therefore, it is still the major industry attracting capital from domestic and foreign investors. Return on equity (ROE) and return on assets (ROA) are the most critical financial investment indicators. Companies with stable ROE and ROA can grow steadily every year because they are worth holding for a long time, and the stock price is easy to rise steadily. Corporate governance is affected by the members of the board of directors because its members are the subjects of decision-making for the company during its operation. Although there have been many detailed studies on the impact of the board of directors on corporate governance, there are still few studies applying AI techniques to clarify the relationship between corporate governance and financial performance.
Three different types of neural networks in deep learning are artificial neural networks (ANN), convolutional neural networks (CNN), and recurrent neural networks (RNN). Each model is designed for specific tasks and applications. Compared to CNN and RNN, ANN is capable of learning any nonlinear model. Furthermore, the ANN is capable of learning the weights that map any input to the output and has the activation function to introduce nonlinear properties into the network. Therefore, the ANN is capable of learning any complex relationship between input and output.
ANN is a powerful machine learning-based data analysis algorithm that is a model of real biological neural networks, which has been widely used to solve complex problems of nonlinear regression analysis. This paper is one of the first to use an AI method, specifically ANNs, to establish a basic testing framework for the financial performance of a Taiwanese electronics company based on its board structure. These initial tests, based on firm-specific, are developed into a series of tightly standardized, autonomous tests useful in assessing profitability and providing investment advice to the market. Automated testing can be widely used in practice and helps to reduce unnecessary employment, saving costs for businesses as well as investors.
This study provides a technique using ANNs for predicting ROE and ROA at a future time when there is a large enough amount of data on the structure of the board of directors and managers in the past. The results show that the characteristics of the board of directors and managers decide 64.25% of the value of the ROE and 67.05% of the ROA, respectively. The empirical results also show that when ROE and ROA are in bad condition, board members use their power to protect their assets. More independent members of the board of directors have a negative influence on financial performance. Large company size has always been strong support for high profits, and a high debt ratio has not yet brought into play its tax-saving feature. Although ROE and ROA are not the only factors that affect the stock price, however, it is necessary to consider the company’s earnings based on the core and sustainable profitability of the company’s industry, rather than misjudging the short-term profit results that are short-lived, resulting in an investment loss.
The rest of the paper is organized as follows. Section II conducts a literature review. Section III describes the methodology, empirical model, and the empirical results analysis. The final section is the conclusion.
II.LITERATURE REVIEW
The agency cost theory is often used to examine the role that directors play in the performance of the company they govern [1]. Besides, resource dependency theory is applied to examine the relationship between firms and the essential resources required to maximize business performance [2]. Combining these two theoretical perspectives is consistent with previous studies by [3] who confirmed that the board of directors has two important functions, that is, monitoring and managing the company on behalf of shareholders and selecting human resources to meet the operational needs of the company. There is a lot of research literature on the relationship between ownership structure and firm performance [4–8]. However, there is a clear contradiction in the results of the existing literature.
Research findings on manager power are not consistent, as managers become more powerful, firm performance may change more or less ([5,9–11]; [12]). Powerful board members as well as managers often have a decisive voice in the company’s decisions. Chiu et al. [5] argue that managers make important strategies that have a great impact on the long-term development of the company. Lee [12] believes that powerful managers have significant decision-making power in determining expenditures, affecting the company’s performance. According to Core et al. [13], under the influence of powerful managers, the business environment can be better managed and interact more smoothly with the board of directors for maximizing firm profits.
It has been argued that firms with smaller boards are associated with higher variability in performance, suggesting that smaller groups are likely to make more extreme decisions than larger groups and that firms with a higher concentration of power within their boards should have higher performance volatility [4,14]. There are two views regarding the separation of roles between the board of directors and the managers. Firstly, Argenti [15] and Stiles and Taylor [16] who support the “management theory” argue that the members of the board of directors must not be the managers to ensure the separation between the two positions, as well as conditions to exchange plans for future business development. The separation of these two roles ensures mutual supervision as well as factors related to risk management. In addition, Jensen and Meckling [17] and Jensen [18] suggest that if an individual holds two important positions in such a company at the same time, it may lead to a situation where that individual uses the firm’s inside information to gain personal benefits and detriment of corporate interests. Second, proponents supporting management theory argue that they act in the best interest of shareholders because they have access to more sources of information than their counterparts. In addition, their income source depends on the business results of the firms, thereby, improving the firm performance.
Theoretically, firms with a higher proportion of independent directors are easier to resolve conflicts of interest between shareholders and the board. Furthermore, based on the agency cost theory school, Fama and Jensen [19] argue that there is an inherent relationship between the interests of firm owners and managers. A high proportion of independent members on the board of directors is considered likely to have a positive impact on corporate performance. Baysinger and Butler [20] and Rosenstein and Wyatt [21] have found that the appointment of independent directors leads to an increase in corporate profits, thereby increasing shareholder value. According to [22], the proportion of independent members in big firms increased slightly when that firms had worse business performance compared to the previous year. In contrast, Klein [23] found that, at The New York Stock Exchange (NYSE) in the period 1991–1993, firms with a market capitalization in the lower quintile often had a low percentage of independent directors than the group of companies with a market capitalization in the highest group. Denis and Sarin [24] found that firms significantly increased the proportion of independent members when the enterprise had higher-than-average profits than the previous year.
III.DATA, METHODOLOGY, AND EMPIRICAL RESULTS
A.DATA DESCRIPTION
This study uses the yearly data over the 2000 to 2021 period of 839 Taiwanese electronics firms listed on the Taiwan Stock Exchange. The data required for the study are obtained from the Taiwan Economic Journal (TEJ) data source. After excluding nonavailable values, 10,626 observations are used for (i) building an AI test (ANN models) for ROE and ROA; (ii) finding the factors affecting the ROE and ROA using threshold regression models.
From the perspective of the company’s internal financial performance, the ROE and the ROA are based on the profit earned from business activities. They measure the profitability of the company’s long-term basic capital. These ratios are adopted to avoid the decline of the profitability of the industry due to excessive interest or excessive tax burden. Profitability can be regarded as the best proof of the value of a company’s assets and an element in determining credit protection. Companies with high basic profitability have a strong ability to generate funds and withstand business reversals; on the contrary, when the basic profitability is low, it means that the company’s assets are not fully utilized, and there are too many idle assets.
Table I summarizes formulas and definitions of variables used in the empirical model, including the financial performance (ROE, ROA), board’s power (BDS1, BDS2, BPW, IBRD, FBD, T10P), managers’ power (MANP1, MANP2), and control variables (TTA and DTR).
Table I. Estimation of variables
| Var. | Estimation |
|---|---|
| Financial performance | |
| ROEit | The return on equity is the ultimate basis for judging business performance, which is calculated as recurring income divided by total shareholders’ equity × 100%. |
| ROAit | The return on asset, calculated as after-tax net profit before interest and depreciation divided by total average assets × 100%. |
| Board’s power | |
| BDS1it | Board size, calculated as the natural log of members in the board of directors. |
| BDS2it | Board size, calculated as the natural log of total number of supervisors and members in the board of directors. |
| BPWit | Board power, the proportion of the board directors’ shares in the company’s announcement to the company’s total issued shares. (Number of shares held by directors ÷ total number of shares × 100) |
| IBRDit | Independent board, calculated as the natural log of number of independent directors in the board of directors. |
| FBDit | Foreign members in the board of directors. A dummy variable, equal to 1 when the board of directors has foreign members, equal to 0 otherwise. |
| TOPit | The major shareholder of the company, whose shareholding accounts for the proportion of the company’s total issued shares. (Number of shares held by major shareholders (excluding board members and supervisors) ÷ total number of shares × 100) |
| Managers’ power | |
| MANP1it | Manager’s power, calculated as the proportion of shares held by managers to the company’s total issued shares (not concurrently serving as members of the board of directors). (Number of shares held by managers ÷ total number of shares × 100) |
| MANP2it | Manager’s power, calculated as the proportion of shares held by managers plus the number of shares held managers in board members. (Number of shares held by managers (including concurrent board directors and supervisors) ÷ total number of shares × 100) |
| Control variables | |
| TTAit | Total assets as the natural log of total assets as at the end of period. |
| DTRit | The debt ratio is calculated as total liabilities of total assets |
Major shareholders are the top 10 shareholders or major shareholders holding more than 5% of the company’s shareholding (TOP) information disclosed in the annual report of the shareholders’ meeting or the prospectus. It is compiled from written information since this type of shareholder information has not been announced on the stock exchange. These data include the shares held by major shareholders as defined by the competent authority but do not include the number of shares held by major shareholders serving as company managers, directors, and supervisors.
Table II describes the basic information of the sample companies selected for this study. The average value of ROA, which represents the company’s core business profit, is 5.327%, and the median value of 5.480% is almost close to the bell-shaped distribution.
Table II. Descriptive statistics
| Variables | Mean | Median | Max. | Min. | Std. dev. | Obs. |
|---|---|---|---|---|---|---|
| BDS1 | 3.042 | 3.045 | 4.220 | 1.609 | 0.215 | 10626 |
| BDS2 | 1.942 | 1.946 | 2.833 | 0.693 | 0.222 | 10626 |
| BPW | 21.071 | 17.265 | 95.160 | 0.000 | 14.252 | 10626 |
| IBRD | 0.843 | 0.693 | 1.792 | 0.000 | 0.276 | 10626 |
| FBD | 0.085 | 0.000 | 1.000 | 0.000 | 0.279 | 10626 |
| TOP | 19.846 | 18.040 | 88.420 | 0.000 | 10.993 | 10626 |
| MANP1 | 1.347 | 0.530 | 23.020 | 0.000 | 2.156 | 10626 |
| MANP2 | 5.171 | 3.035 | 50.300 | 0.000 | 5.994 | 10626 |
| TTA | 15.121 | 14.903 | 22.038 | 9.757 | 1.446 | 10626 |
| DTR | 39.926 | 39.455 | 99.760 | 0.490 | 17.022 | 10626 |
| ROE | 7.490 | 8.850 | 155.400 | −425.890 | 19.116 | 10626 |
| ROA | 5.327 | 5.480 | 77.040 | −112.520 | 9.780 | 10626 |
However, it can be seen that there are still great differences in the operating capabilities of different companies, and the maximum value can reach 77.040 %, the worst operating performance with profitability of −112.52%. ROE shows how efficiently the companies allocate their capital. It is obvious that the distribution is left-skewed, that is, the mean falls to the left of the median, and it can be found that, on average, the ratio of ROE is 7.49% which is significantly higher than ROA.
In terms of board power (BPW), the proportion of the board directors’ shares is 21.071% on average, and the highest value is 95.160%. There are still significant differences in the manager’s power (MANP1 and MANP2) of different companies, where the minimum values are 0%. The average debt ratio is 39.926%, and the median is 39.455%, which shows that, on average, the capital structure of the companies is still sound. The average value of company size is 15.121, and the median is 14.903. The largest sample company has a scope of 22.038.
The correlation coefficient between the variables of the experimental data is verified and collected in Table III.
Table III. Correlation analysis
| Variables | BDS1 | BDS2 | BPW | IBRD | FBD | TOP | MANP1 | MANP2 | TTA | DTR |
|---|---|---|---|---|---|---|---|---|---|---|
| BDS1 | 1 | |||||||||
| BDS2 | 0.37*** | 1 | ||||||||
| BPW | −0.12*** | 0.04*** | 1 | |||||||
| IBRD | 0.08*** | 0.46*** | 0.09*** | 1 | ||||||
| FBD | 0.11*** | 0.14*** | 0.07*** | 0.09*** | 1 | |||||
| TOP | 0.03*** | −0.12*** | −0.16*** | 0.05*** | −0.02* | 1 | ||||
| MANP1 | 0.08*** | −0.09*** | 0.05*** | 0.01 | −0.01 | −0.01 | 1 | |||
| MANP2 | −0.18*** | −0.20*** | 0.06*** | −0.12*** | −0.08*** | 0.02* | 0.36*** | 1 | ||
| TTA | 0.42*** | 0.34*** | −0.17*** | 0.22*** | 0.10*** | −0.10*** | −0.17*** | −0.27*** | 1 | |
| DTR | 0.10*** | 0.01 | −0.02** | 0.00 | 0.01 | 0.01 | −0.02 | −0.03*** | 0.28*** | 1 |
| ROE | 0.11*** | 0.05*** | 0.08*** | 0.04*** | 0.01 | −0.06*** | 0.07*** | 0.08*** | 0.18*** | −0.16*** |
| ROA | 0.08*** | 0.03*** | 0.08*** | 0.04*** | 0.01 | −0.02** | 0.09*** | 0.09*** | 0.13*** | −0.21*** |
Note:***, **, and * represent the 1%, 5%, and 10% significant level, respectively.
This result shows that most of the coefficients are statistically significant, so it is clear that there is a relationship between the empirical variables. In addition, all correlation coefficients are lower than 0.42, indicating that the problem of multicollinearity does not exist in the empirical models. This feature also helps the models not to fall into the phenomenon of “overfitting,” that is, the model is found to be “over-fitted” to the data, which can lead to very inaccurate results when the data used have high noise.
B.THRESHOLD TEST
The threshold test performs multiple tests for structural breaks in the data. The number of structure break points can be known and unknown. In the case of the threshold test, a known break point can check if the problem occurred at a particular time. For unknown errors, the threshold test implements three different hypotheses. The first hypothesis is that no breaks resist the variety of breaks, and the second hypothesis is that there are no breaks relative to the upper and lower limits of breaks. The final hypothesis checks for null of s break versus the alternative of more than one break (s + 1).
The threshold test implements the tests for structural break discussed in Bai and Perron [25,26] and [27]. The regime break points in this study are estimated using the methods of Bai [28], Bai and Perron [25], and related techniques. Table IV reports the result of the threshold test for the data of ROE and ROA. There are five thresholds detected when the threshold variables are themselves. The threshold values of ROE are −17.80, −1.52, 9.05, 17.93, and 30.21, and the threshold values of ROA are −9.75, 0.54, 8.06, 12.72, and 19.61. The threshold values of the two dependent variables are all significant at the 1% level.
Table IV. Detection of thresholds
| Threshold test | |||||
|---|---|---|---|---|---|
| ROE | |||||
| F-statistic | 719.47*** | 344.25*** | 453.68*** | 146.09*** | 129.73*** |
| Critical value | [26.13] | [28.4] | [29.68] | [30.62] | [31.25] |
| ROA | |||||
| F-statistic | 769.10*** | 407.93*** | 627.74*** | 164.76*** | 193.18*** |
| Critical value | [26.13] | [28.4] | [29.68] | [30.62] | [31.25] |
Note: Return on equity (ROE) and return on asset (ROA) are threshold variables. The maximum threshold applied for each detection is 5. The critical values are from Bai and Perron [
Data are divided into six different groups based on these five threshold values, which are used for building the ANNs of ROE (ANN-ROE) and ANNs of ROA (ANN-ROA). The threshold regression is also applied to explore which factors affect ROA and ROE and how they act.
C.ARTIFICIAL NEURAL NETWORKS
An ANN is a mathematical model or mathematical model built through biological neurons. It consists of groups of jobs; artificial neurons can connect and process information by passing along the connections and then calculating new values at the nodes. In many cases, an ANN is an adaptive system that can change its structure based on external or internal information flowing through the network during the learning process. Many ANNs are also tools for modeling nonlinear statistical data. They are also used to model complex relationships between input data or between results to look for patterns in the data.
ANNs can act like human neural networks. Each neuron is a mathematical function with the function of collecting and classifying information based on a specific structure. It consists of layers that contain interconnected nodes. Each node is a perceptron with a similar structure to the nonlinear regression. Inside a multilayer perceptron, they will be arranged according to the layers that are connected. The input layer collects the input samples, and the output layer collects the classifications or output signals that the input samples may reflect.
Since the first neural model by JL [29] is introduced, hundreds of different models of ANN have been proposed. The difference between these models can be functions, topology, learning algorithms, etc. In this study, the neural network based on the backpropagation algorithm of Rumelhart et al. [30] is applied, and this is one of the most popular models used in ANN to find suitable weights in predicting outputs from historical data.
The simplest ANN model with a single hidden layer and one neuron () graphed in Fig. 1 consists of three main components: input (X) and output (y) with only one layer, and the hidden layer can have one or more layers depending on the specific problem. The main activity of an ANN is to describe how the nervous system works with its associated neurons.
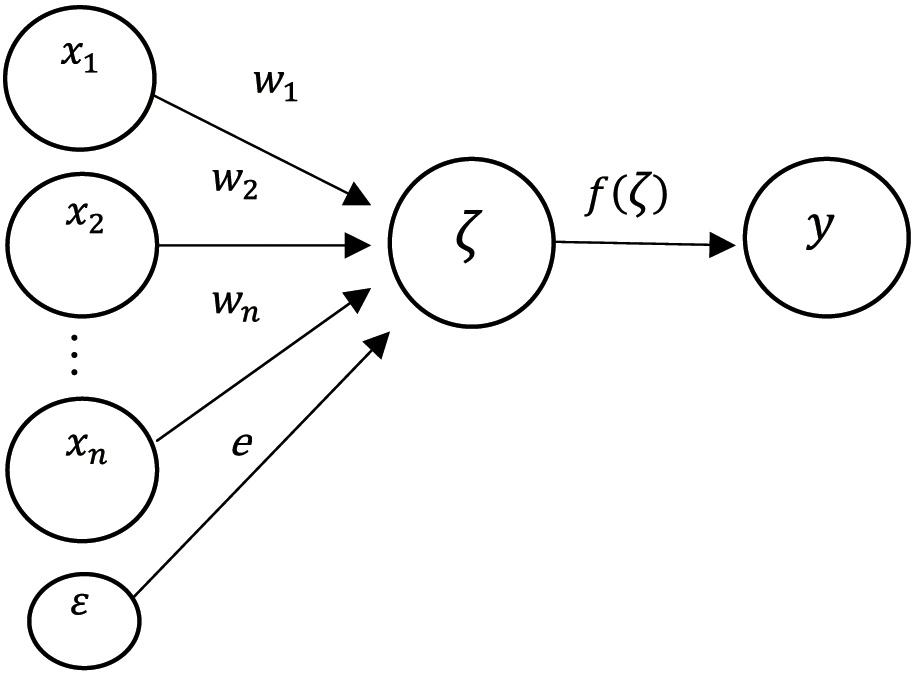 Fig. 1. The ANN model with single hidden layer and one neuron.
The linear regression at each neuron (ζ) of the jth hidden layer is as below:
where are the input vectors for each neuron are the weights of each synapse of the neuron, and is the error term.The weight of an artificial neuron can be negative or positive. By adjusting the weights of an artificial neuron, we can get the desired output given specific inputs. However, when the neural network consists of tens or hundreds of neurons, calculating these weights is very complicated. At each node, algorithms are used to adjust the weights of the ANN to get the desired output as quickly as possible. This adjustment process is called “learning” or “training.” In ANNs that may have one or more hidden layers, such neural networks are called multilayer neural networks. Then, each output of the previous layer is the input of the next layer.
Each layer of the ANN essentially performs a nonlinear transformation of the input from one vector space to another. The activation function (transfer function) is used to convert the received value into the output value:
The output value at the hidden layer neuron j continues to be transmitted to the output neuron k in the same way as from the input layer to the hidden layer:
At this point, the direct propagation phase here ends, and the network moves to the backpropagation phase.
Two nonlinear functions are used as the activation function for training (ANN-ROE) and (ANN-ROA):
Tanh function (aka hyperbolic tangent function):
ReLU (rectified linear unit) function:
Fan [31] find that the extended tanh function method is applied to nonlinear partial differential equations where the equilibrium numbers can be any other real number. Besides, the ReLU function is simpler and more efficient when used in multilayer neural networks, and it can train a very deep neural network. Although the disadvantage of the ReLU function is that it has zero derivatives with negative values, Goodfellow et al. [32] show that this drawback can be overcome by increasing the number of hidden nodes.
This study employs the ANN model to establish a basic testing framework for the financial performance of an enterprise based on its board structure. It should be noted that to accurately assess the financial performance of an enterprise, the autonomous testing system extends to all operations and management of the enterprise; many factors need to be specifically considered to achieve accurate test results such as politics, macroeconomics, revenue, research, and copyright. Within the framework of this study, we only focus on human factors, specifically board members, to build a dedicated ANN model. Because the performance of ANN in nonlinear modeling has been well demonstrated and its clear mathematical background. As an AI technique, the structure of the ANN and its inference process can dynamically adapt in response to data updates.
There is a total of 10,626 observations for empirical results, where 7,438 observations are used as training models and 3,188 observations are used for testing. This paper sets up a neural network based on these data to predict six groups of ROE and ROA detected by the threshold test. The eight inputs are variables that carry the characteristics and structure of the board of directors as well as the Management Board, of which two are a proxy for board power (BPW and TOP) and two are a proxy for manager power (MANP1 and MANP2). The number of hidden layers, the number of neurons in each hidden layer, and the change of activation functions in each layer are changed during the training process to find the most optimal solution.
Figures 2 and 3 draw two optimal ANN(ROE) and ANN(ROA) neural networks that consist of 3 hidden layers, 10 input values, and 6 output predictions of ROE and ROA of each Taiwanese electronics company at that year.
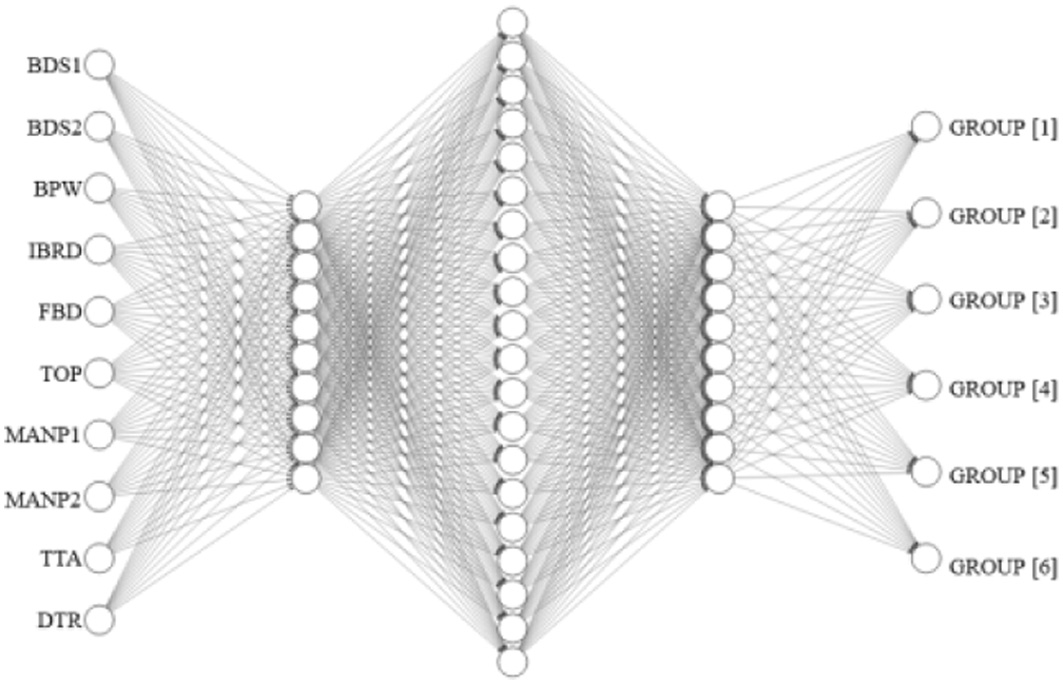 Fig 2. The ANN architecture schematics of ROE. (The model has 10 inputs, 3 hidden layers with 10-20-10 nodes, and 6 outputs).
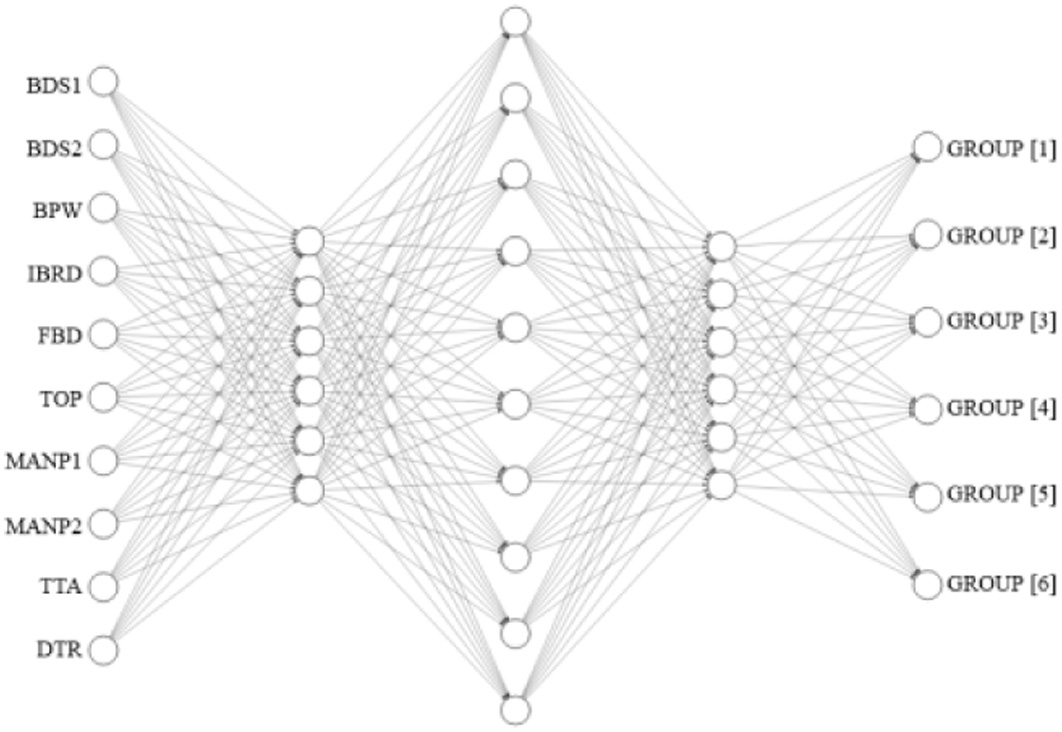 Fig 3. The ANN architecture schematics of ROA. (The model has 10 inputs, 3 hidden layers with 6-10-6 nodes, and 6 outputs).
The backpropagation algorithm of Rumelhart et al. [30] is used in the feed-forward ANN. The artificial neurons are organized into layers and send their signals forward, then errors are propagated back. The idea of the backpropagation algorithm is to reduce this error by varying the weights until the ANNs learn from the training data. When the data pass through all the layers to get the output, the error values between the ANN predicted result and the actual data are calculated. This error is a nonlinear function whose arguments are the weight matrices of the model. That function is known as the “loss function.” There are many ways to define the loss function; the mean squared error (MSE) is used in this study, and its formula is as follows:
Where is the actual (train) data is the ANN predicted (validation) result.The final loss of the ANNs are presented in Fig. 4. The accuracy of the ANN(ROE) and ANN(ROA) are 64.25 and 67.05, respectively.
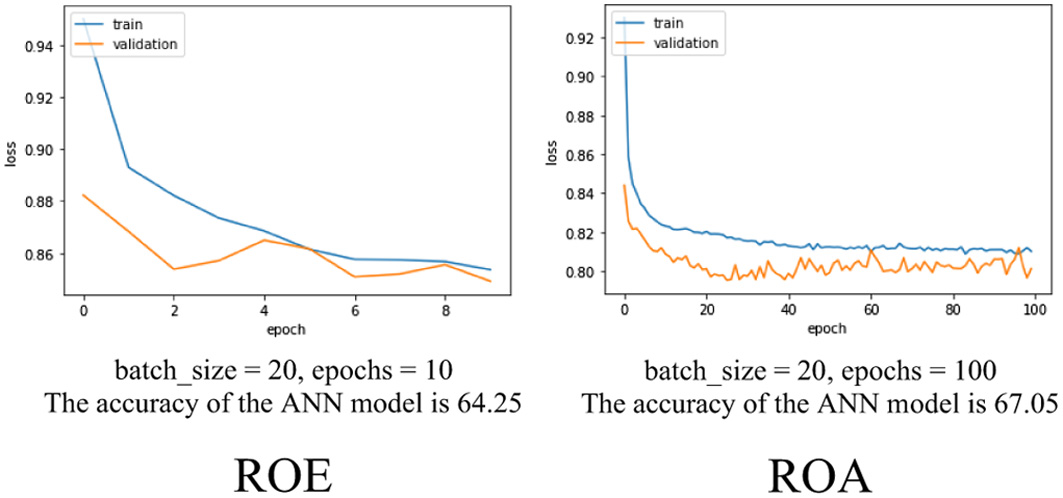 Fig. 4. The model loss of the ANN models.
In addition to the MSE, the mean absolute relative error (MAPE) between the estimated results and the actual values of the two models are also calculated to evaluate the accuracy of the models.
The study has provided a prediction method by ANNs for ROE and ROA groups at a future time when there is a large enough amount of data on the structure of the board of directors and managers in the past and evaluate the errors for the proposed ANNs. The results show that the characteristics of the board of directors and managers decide 64.25% of the value of the ROE and 67.05% of the ROA in that year.
The model created in this study only uses data on characteristics of the board of directors and managers in the past to predict the financial performance of the companies. To highlight the role of corporate governance, other factors that also influence corporate profits, such as politics, macroeconomics, social media, copyright, revenue, and market fluctuations, are not discussed.
D.THRESHOLD REGRESSION ANALYSIS
The multi-threshold regression model is applied for how the director board and managers affect ROE and ROA which are set as the threshold variables. The two regression models designed for this purpose are as follows:
Model 1: The nonlinear effect of director board and managers on ROE
Model 2: The nonlinear effect of director board and managers on ROA
where are coefficients and is the threshold value autodetected by model. means that there may be m conversion functions and m+1 different regimes. The observation is in the jth regime if its value is at least as large as the threshold of the jth regime but smaller than the threshold of (j+1)th. Suppose the conversion function to be true, then its value is 1; otherwise, its value is 0.Tables V and VI present the estimated results of Model 1 and Model 2, respectively.
Table V. Factors affecting return on equity (ROE)
| Variable | ROE < −17.8 | −17.8≤ ROE ≤1.52 | −1.52 ≤ ROE <9.05 | 9.05 ≤ ROE <17.93 | 17.93 ≤ ROE <30.2 | 30.2≤ ROE |
|---|---|---|---|---|---|---|
| Group | [1] | [2] | [3] | [4] | [5] | [6] |
| C | −191.85*** | −15.88*** | 0.63 | 12.11*** | 25.76*** | 50.12*** |
| BDS1 | 5.42** | −0.36 | 0.34 | 0.63 | −0.47 | −9.53*** |
| BDS2 | −6.78*** | 0.44 | −0.09 | −0.48 | −0.50 | −0.24 |
| BPW | 0.46*** | 0.02 | 0.01 | 0.00 | 0.00 | 0.04* |
| IBRD | −7.17*** | −0.30 | −0.02 | 0.01 | 0.78 | −0.86 |
| FBD | 0.03 | −1.06 | 0.17 | 0.26 | 0.46 | 1.94 |
| TOP | 0.13*** | 0.00 | 0.00 | 0.01 | 0.00 | 0.22*** |
| MANP1 | −1.99*** | 0.15 | 0.06 | −0.05 | 0.01 | 0.01 |
| MANP2 | 1.03*** | 0.03 | 0.01 | 0.01 | 0.01 | −0.08 |
| TTA | 12.88*** | 0.67*** | 0.16 | −0.02 | −0.10 | 0.80** |
| DTR | −0.85*** | −0.05*** | 0.01 | 0.00 | 0.00 | 0.08*** |
| Number of Obs. | 531 | 1484 | 3376 | 3021 | 1682 | 532 |
| R2: | 0.809 | |||||
| Adj.R2: | 0.808 | |||||
| F-Statistic | 690.76*** | |||||
Note: ROE is the return on equity based on the recurring profit. ***, **, and * represent the 1%, 5%, and 10% significant levels, respectively.
Table VI. Factors affecting return on assets (ROA)
| Variable | ROA < −9.75 | −9.75 ≦ ROA <0.54 | 0.54 ≦ ROA <8.06 | 8.06 ≦ ROA <12.72 | 12.72 ≦ ROA <19.61 | 19.61 ≦ ROA |
|---|---|---|---|---|---|---|
| Group | [1] | [2] | [3] | [4] | [5] | [6] |
| C | −68.09*** | −8.85*** | 1.53* | 11.09*** | 15.11* | 38.64*** |
| BDS1 | −2.25** | 0.46 | 0.48* | −0.10 | −0.39 | −1.08 |
| BDS2 | −2.60*** | −0.05 | 0.26 | −0.12 | −0.18 | −4.63*** |
| BPW | 0.16*** | 0.01 | 0.00 | 0.00 | 0.00 | 0.01 |
| IBRD | −0.25 | −0.10 | −0.22 | −0.13 | 0.23 | 1.27* |
| FBD | 1.61*** | −0.56* | 0.04 | 0.04 | 0.65* | −0.99* |
| TOP | 0.12 | 0.00 | 0.00 | 0.00 | 0.00 | 0.07*** |
| MANP1 | −0.17 | 0.07 | 0.04 | −0.01 | −0.01 | 0.10 |
| MANP2 | 0.33*** | 0.03 | 0.01 | 0.00 | 0.02 | −0.03 |
| TTA | 4.06*** | 0.30*** | 0.10** | 0.00 | 0.12 | −0.07 |
| DTR | −0.09*** | −0.01*** | −0.01*** | −0.01 | −0.01 | −0.07*** |
| Number of Obs. | 532 | 1677 | 4748 | 1963 | 1175 | 531 |
| R2: | 0.861 | |||||
| Adj.R2: | 0.861 | |||||
| F-Statistic | 1010.92*** | |||||
Note: ROA is the return on assets, after tax and before interest. ***, **, and * represent the 1%, 5%, and 10% significant levels, respectively.
Empirical results show that the influence of the board of directors, as well as the managers, is only evident in two regimes with too low and too high ROE and ROA. More specifically, when ROE < −17.8 and ROE ≥ 30.2, the board of directors and new directors apply their power to adjust ROE, especially when ROE is too low.
When ROE < −17.8, the effect of BDS1 on ROE is positive and the effect of BDS2 is positive. This result shows that more board members have a positive effect on ROE; however, the presence of supervisors may cause the results to be reversed. The power of the board (BPW) and of major shareholders (TOP) have the same positive influence on ROE. This result means that the greater their power, the more power they can take to improve profitability when the business situation is at its worst. Meanwhile, independent members of the board of directors (IBRD) have not been able to promote their responsibilities when there are more members. The power of managers who are not concurrently board members does not have a positive effect on ROE.
When managers serve as board members, their power improves ROE in a more positive direction. Large company size (TTA) contributes to improving ROE, and high debt (DTR) is a minus point of ROE.
When the business situation is favorable and profitable, leading to a high ROE (≧30.2), board size (BDS1 and BDS2) no longer puts pressure on ROE. The power of managers (MANP1 and MANP2) also reduces the impact on ROE. Only the power of the board of directors (BPW) and major shareholders (TOP) remain more or less influential. In this condition, high debt is the plus point of ROE.
As for the ROA, Table VI reports that the fewer members of the board of directors (BDS1 and BDS2), the higher the ROA, perhaps because they are easier to agree on corporate governance strategies. The results are consistent with the view that more compromises are needed for the larger board to reach a consensus; therefore, the decisions of the larger board are less extreme, leading to better company performance. Board power (BPW) and managers’ power (MANP2) only come into play when investment returns fall deeply. Independent members of the board of directors generally have no internal power to influence ROA, while foreign members have this power when earnings are weak. Large firm size (TTA) is always a positive prop for increased ROA, while debt ratio (DTR) has the opposite effect. This result shows that Taiwanese electronics companies do not benefit clearly from using debt to save on taxes.
In sum, when the ROE is too low to match expectations, harming the interests of shareholders, the power of board members is most effectively promoted. However, more independent members do not have a good effect on ROE. The supervisors did a good job when the company’s business situation developed in a worse direction. In contrast, when corporate profits are high, the board’s power and managers’ power will reduce their positive influence on ROE.
Generally, when ROE and ROA are in bad condition, board members of electronics companies will use their power to protect their wealth in one way or another. More independent members of the board of directors have a negative influence on financial performance. Large company size has always been a strong support for high profits, and a high debt ratio has not yet brought into play its tax-saving feature.
IV.CONCLUSIONS
In the process of Taiwan’s economic development, the high-tech industry has become the mainstream of domestic economic growth. The rapid development of Taiwan’s high-tech industries, especially the electronics industry, has become the most important pillar industry in Taiwan and plays an increasingly important role in the economy. Therefore, the company’s financial performance is a critical reference indicator.
The research results could be useful references for the stock market management agencies. It could help individuals, as well as organizations, understand clearly how corporate governance factors affect the performance of that business. The results of this study could be also useful for investors who intend to invest in electronics companies. The research results show that the higher the financial leverage ratio, the lower the financial performance. Companies with more members on the board of directors have lower efficiency. Especially, when ROE and ROA were in bad conditions, board members of electronics companies will use their power to protect their wealth. To save time and human resources for checking and inspecting the reliability of financial statements, investors could refer to the results of the ANNs model developed in this study for evaluating the risk management factors when reviewing the company’s annual report. When detecting a big change in the structure of the board of directors during the financial year, investors can rely on these results to make appropriate investment strategies.
For creditors and banks, it is necessary to carefully consider the group of factors affecting the performance, that is, the power of the Board, the power of managers, the Board’s total members, independent members, foreign members, ROE, return on total assets (ROA), firm size, etc., of the companies to make a reasonable decision before lending. More specifically, lenders monitor whether the companies have any changes on the above factors.