I.INTRODUCTION
Recent developments in machine learning techniques have enabled the implementation of intelligent healthcare monitoring systems with a multidisciplinary approach [1]. In this scenario, there are mainly two aspects of human health including physical and psychological health. Out of which the importance of psychological health cannot be neglected [2]. One of the key parameters in psychological health is the impact of the natural scenery and sounds [3]. In numerous metropolitan public locations, water fountains have been built. Fountains can provide pleasing sounds in addition to their appealing visual attributes, which enhances the acoustic environment’s or soundscape’s quality [4].
Barnali Brahma, Tusar Kanti Dash, and Ganapati Panda are with Department of ECE, C V Raman Global University, Bhubaneswar, India, e-mail: brahma.barnali@gmail.com, e-mail: tusarkantidash@gmail.com, e-mail: ganapati.panda@gmail.com (corresponding author: Barnali Brahma) L V Narasimha Prasad is with Department of CSE, Institute of Aeronautical Engineering, Hyderabad, India, e-mail: lvnprasad@yahoo.com, Rajesh Kulkarni is with Department of CSE, MVSR engineering college, Nadargul, Hyderabad, India, e-mail: kulkarni_cse@mvsrec.edu.in
Moreover, the water fountain sounds can have a profound effect on the psychological health of the visitors by adding to their health and well-being, reducing stress, and promoting personal restoration [5]. Several health benefits of the natural sounds including water sounds in the parks are studied and observed that water sounds play an important role in improving the health of the visitors [6]. To further investigate the usefulness of psycho-acoustic parameters in soundscape investigations, a detailed review of peer-reviewed literature over the previous 10 years is done in [7]. It is observed that the sound pressure level indicator, sharpness, roughness, fluctuation strength, and tonality impact the overall effect of sound on human perception. In the current scenario of smart city design, the use of machine learning and Internet of Things (IoT) plays a crucial role, and these techniques can be used to study the usefulness of water sound analysis on human health [8,9]. In another study on the effect of audio-visual coherence on outdoor sounds, it is found that audio-visual coherence is crucial to the perception of water sounds [10]. By comparing the impact of noise on indoor water sounds, the significance of pleasantness has been investigated [11]. The results of laboratory tests on subjective assessment revealed that pleasantness is one of the most sensitive traits, whereas loudness and noise level are the least sensitive traits.
In order to improve the soundscape quality of urban areas, a strategy has been successfully applied to reduce the effect of aircraft noise by adding moving water and vegetation. It is also observed that the overall quality, visual quality, auditory quality, and auditory pleasantness are not correlated but independent in nature [12]. Urban park soundscapes have been examined for their healing effects on children’s psycho-physiological stress, and results indicate that they can help children’s psycho-physiological recovery to some extent [13]. When there is background noise from traffic, the introduction of waterworks that incorporate sound and visual components can considerably improve how well people can relax. This is because of the visually resemble which consists of water with an acoustic informational masking effect [14]. A comparative study is carried out between the effect of natural water sounds from seas, rivers, and lakes with artificial water sounds of ponds and fountains. Several pieces of evidence are found on the health-related benefits of artificial water features which encourages the use of more artificial water sounds in the future [15].
For the overall improvement of the urban environments, park soundscape management is an important parameter. The sound comfort level measurement is designed using back-propagation neural network model along with subjective and objective evaluation methods. It is found that by improving sound pleasure and reducing sound annoyance one can improve sound comfort [16]. The subjective features are used with hot coding for the input to the artificial neural network, but no specific audio features are used in the model. Small, central urban parks frequently have noisy acoustic environments that are dominated by traffic noise. Through masking, water sounds can be used to lessen the damaging effects of undesired noises. Two hundred and seventy-four participants have been used in a study on the field experiment to assess the impact of the water. It is observed that the visual design, function of the space, and environmental conditions should be carefully considered and call for more field studies [17]. The IoT has been widely used in the design of smart cities for healthcare applications [9].
Several machine learning and deep learning-based approaches have been used for prediction tasks in healthcare systems [18–20]. Here, the use of a neural network is crucial and out of the different types of neural networks, and the functional link artificial neural network (FLANN) is a single layer-based neural network model without any hidden layer with less computational complexity. It provides efficient prediction performance when the data size is small with less number of features [21]. FLANN model has been used successfully for the prediction of speech quality, speech enhancement, and other speech-related information [22]. In [23], three neural network models such as FLANN, polynomial perceptron network, and Legendre neural network have been used to predict the machinery noise in opencast mines for a case study in the coal mine of Orissa, India. It is observed that the FLANN model gives better noise prediction as compared to the other two models. The FLANN is used for the active reduction of nonlinear noise. It is observed that the model is superior to other reported algorithms both in terms of steady-state mean square error and computational complexity [24].
To the complex problems in real-life applications such as transportation, logistics, energy, climate, social networks, health, and industry 4.0, several bio-inspired optimization algorithms are developed in recent years. These algorithms are designed by mimicking the natural behavioral patterns of living beings [25]. The bee colony approach has been used as the privacy-preserving framework for healthcare systems with comparatively high performance in terms of computation resource searching, emergency data transfer, and participative node privacy-preserving [26]. A bio-inspired optimization for classification and anomaly detection system is proposed and successfully used for diabetes, Parkinson, and vital signs detection in healthcare [27]. Using bio-inspired techniques and a spiking neural network possible voice problems are identified from the analysis of the speech signal in [28]. After thorough evaluations of the merits and drawbacks of the suggested approach, the results are examined and observed transformations and heuristic algorithms which can perform better during the voice analysis process. A bio-inspired dimensionality reduction for Parkinson’s disease classification is used in [29]. The Genetic Algorithm and Binary Particle Swarm Optimization are used to determine the optimal subset of features by delivering the highest accuracy of 89% by selecting only 403 features.
It is observed from the brief literature review that the sound scenario created by artificial water bodies in urban cities has a profound effect on the human body. These water sounds can enhance the visual attractiveness of the parks as well as it will increase the overall soundscape. The pleasantness of the water sound is a subjective quality whose measurement is time taking, costly, and tedious task as well as it needs skilled manpower. However, recently some work has been done on studying the importance of the health benefits of water fountains. But, till now, no direct method of pleasantness measurement is available which can take input as water sound and can predict the pleasantness level. This technique can provide an instant evaluation of the pleasantness as well as precautionary measures that can be taken for correction. This problem is taken up in this research article, where a perceptually weighted functional link artificial neural network (P-FLANN) model is developed using a combination of spectral features.
The main research contributions of the paper are listed below:
- •Application of human sound perception-based FLANN model which will accommodate the nonlinear nature of human ear response to different frequency bands. This will not only provide accurate modeling and weight adjustment to the neural network but also reduce the computations at unwanted frequency bands.
- •Application bio-inspired computing for the calculation of the optimal weight from the input perceptual features with the lowest prediction error.
- •Extraction of different spectral features at the frame level which will be combined at the sample level to extract several statistical features for effectively capturing the water sound features.
- •Comparison of the proposed pleasantness prediction model using different combinations of baseline features and neural networks with multiple datasets for justification of the proposed technique.
The article is split into four sections, with Section I covering the introduction, literature overview, research motivation, and research objective. Section II provides the details of materials and methods used in the current study. The results analysis and research contributions are listed in Section III. Section IV presents the research’s findings, limitations, and areas of potential future study.
II.MATERIALS AND METHODS
A.DATASET
Two datasets have been used in this study for the training and testing of the proposed model’s overall performance. The first dataset is collected from the article [4]. This dataset contains the sound recordings from 32 water fountains, from 28 different locations of Stockholm, Sweden. Each fountain sound has been recorded with a four-channel ambisonic microphone with a digital audio recorder. These sound recordings have been divided into 30-second samples with one channel for the further listening experiment. These sounds are passed through a high-pass of 100 Hz to eradicate the effect of ambient low-frequency components. This dataset contains a total of 64 audio files in the wave format with 44.1 kHz sampling frequency, and these recordings have been evaluated using subjective evaluation measures. In the next step, the audio files are labeled according to the different pleasantness levels. The second dataset is prepared by the authors at the C V Raman Global University, Bhubaneswar, India. This dataset contains 20 labeled water fountain sounds recorded using a condenser microphone with a 44.1 kHz sampling frequency. Three water fountains have been used for the subjective analysis by ten participants with pre-defined speeds.
B.PLEASANTNESS vs LOUDNESS
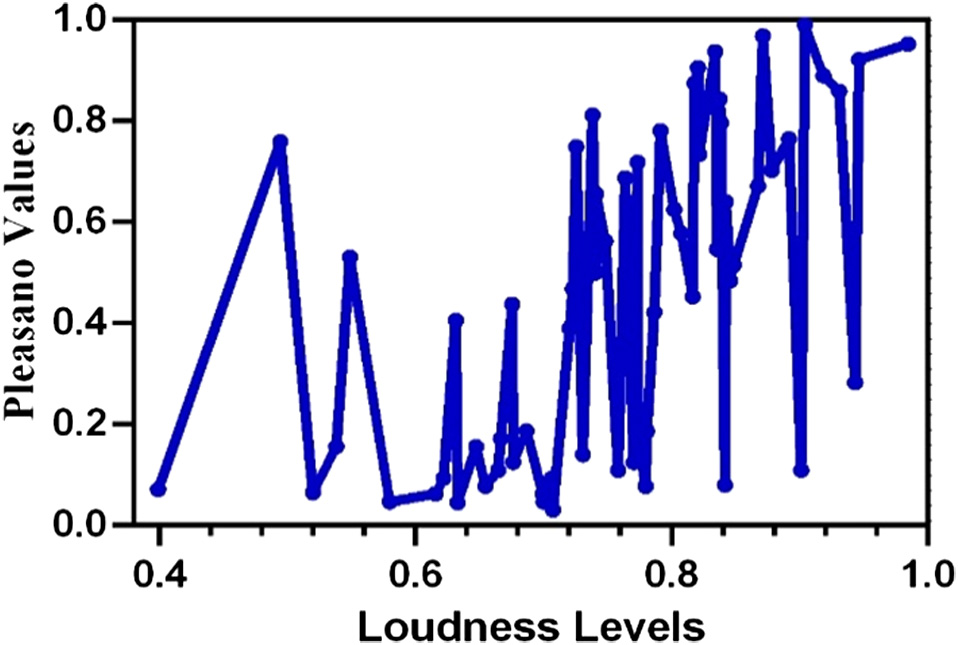
It is a common perception that loudness and pleasantness are correlated with other and pleasantness also depends on the pitch of the sound. The pleasantness is a perceptual quality not just a mechanical thing of calculation of loudness [30]. To validate this relation, an investigation is carried out for the dataset-1 [4]. Here, the listeners have subjectively evaluated pleasantness and expressed it as a number called ‘pleasano values’ which is having a range from 1 to 32 for different water fountains, respectively. The most pleasant sound is assigned a score of 1, and the least pleasant fountain sound is assigned a score of 32. Similarly, for the dataset-2, the ‘pleasano values’ varies from 1 to 20. The loudness level is measured using the spl Meter System object of MATLAB software, and the equivalent-continuous (Leq) value is taken as the loudness level [31]. The normalized values of pleasano values and loudness levels are plotted in Fig. 1 for dataset-1, and it is observed that there is no direct relationship between these two. No direct empirical method can be used to build the relationship between pleasantness and loudness. More audio features are required to predict the pleasantness levels from the water sound.
C.AUDIO FEATURES
In this section, the details of the audio features used for the water fountain sounds are mentioned. At the frame and sample levels, audio features are extracted in the frequency domains. The complete recording of a water fountain sound in one category is denoted as one sample, while a frame is a subset of one sample. Considering there is an ‘n’ number of frames present in each sample, the details of the frame-level features are described below. The features are named f (serial number of the feature) such as f1 to f1024. Due to the quasi-stationary nature of the audio signal, the frame size is fixed at 25 ms to extract statistical features. The frames are passed through a hamming window with a size of 25 ms duration with 50% overlapping between two successive frames [32]. At the frame level, the one-sided linear spectrum is extracted using a fast Fourier transform (FFT). The power spectrum is taken with the frequency range from 0 to fs/2 Hz, where fs is the sampling frequency. In the current implementation, the value of fs is 44.1 kHz, and the frame contains 1024 samples. So, the value of frequency resolution (Δf) would be 43.06 Hz with a frequency range from 0 to 22.05 kHz [33]. After extracting the frame-level features, the statistical features are extracted which are mean and variance. The whole frequency range (20 to 20 kHz) is divided into three bands (low, medium, and high) with the frequency ranges 0–300 Hz (low), 300 Hz–5000 Hz (medium), and 5000 Hz–20000 Hz (high) [34]. Accordingly, the extracted one-sided linear spectrum features are divided into three categories: low, medium, and high. The details are listed in Table I.
Table I. Audio feature extraction details
| Frequency range (KHz) | Frame-level features | Sample-level features | No. of male filters | Avg peak amp of filters | Overall weight |
|---|---|---|---|---|---|
| 0–0.3 (low) | n × 7 | Mean (f1–f7) | 4 (12%) | 0.88 (66%) | |
| variance (f8–f14) | |||||
| 0.3–5 (med) | n × 109 | Mean (f15–f123) | 17 (54%) | 0.36 (28%) | |
| Variance (f124–f232) | |||||
| 5–20 (high) | n × 396 | Mean (f233–f628) | 11 (34%) | 0.08 (6%) | |
| Variance (f629–f1024) |
The frequency response of the human auditory system is not linear in nature. This nonlinearity is represented in a perception-based frequency unit called Mel. By using the Mel filter bank, the audio signal gets converted from the linear frequency to the perceptual domain. This conversion from the linear scale to the Mel scale is mentioned as:
Here, fm and f are the frequency in Mel and linear scale, respectively. The triangular filter shaper is used after this conversion stage. The shape of the Mel auditory filter bank is plotted for the frequency range of 0 to 20 kHz in Fig. 2. It can be observed that the shape and number of filters vary from one region to another. To identify the importance of each region, a comparative weight is calculated as: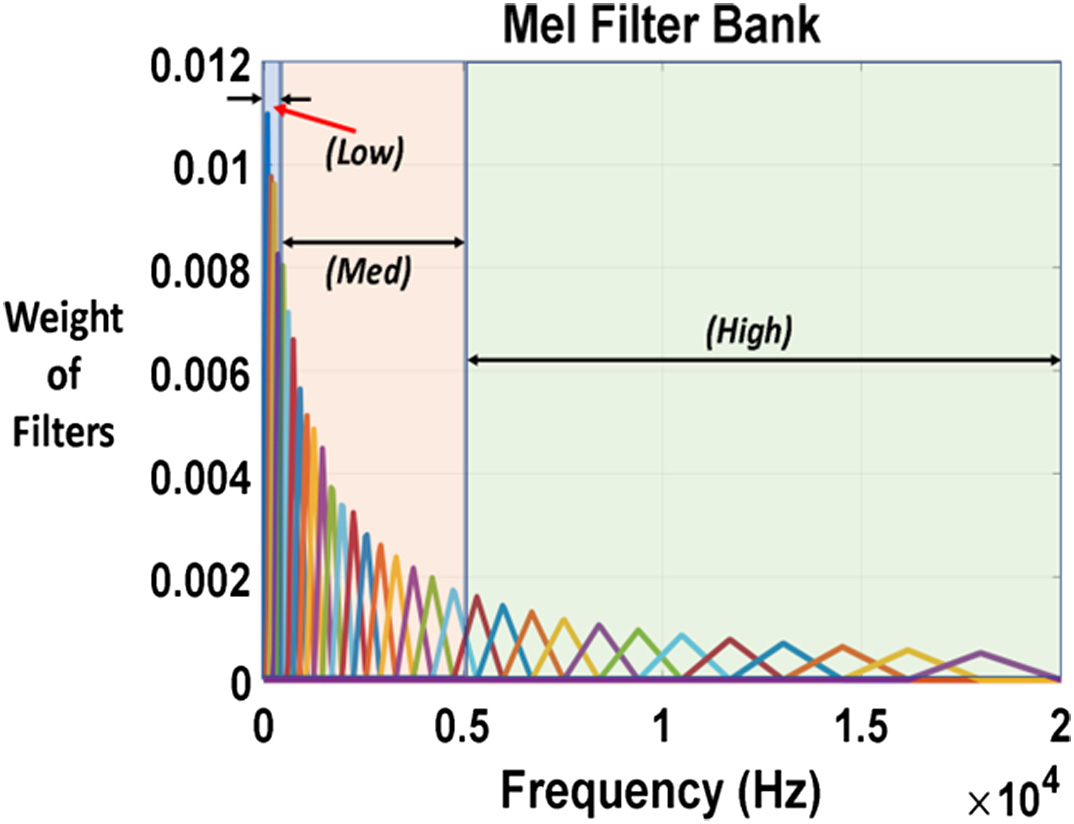 Fig. 2. Mel filters with low, medium, and high-frequency regions.
The normalized values are calculated for each region, and the final weights to be associated are mentioned in Table I. These weights are further used in the FLANN model for proper training of the pleasantness prediction model.
D.PERCEPTUALLY WEIGHTED FLANN MODEL
Compared to the multilayer perceptron structure, the FLANN is a single-neuron-based structure with a low computational load and faster convergence. Recently, there is a lot of deep learning-based models that are developed with higher performance, but these models are useful when the dataset size is more and there is difficulty in extracting features from the dataset. However, in the present case, the dataset size is small and the features are known. So the simple and effective method of FLANN is used [35]. In the proposed algorithm, a total of three FLANN models are used in considering one for each region (low, medium, and high), where each region output is associated with some weighted output. This modification in the FLANN model is done considering the human audio perception and named as P-FLANN. The block diagram of the implementation is shown in Fig. 3.
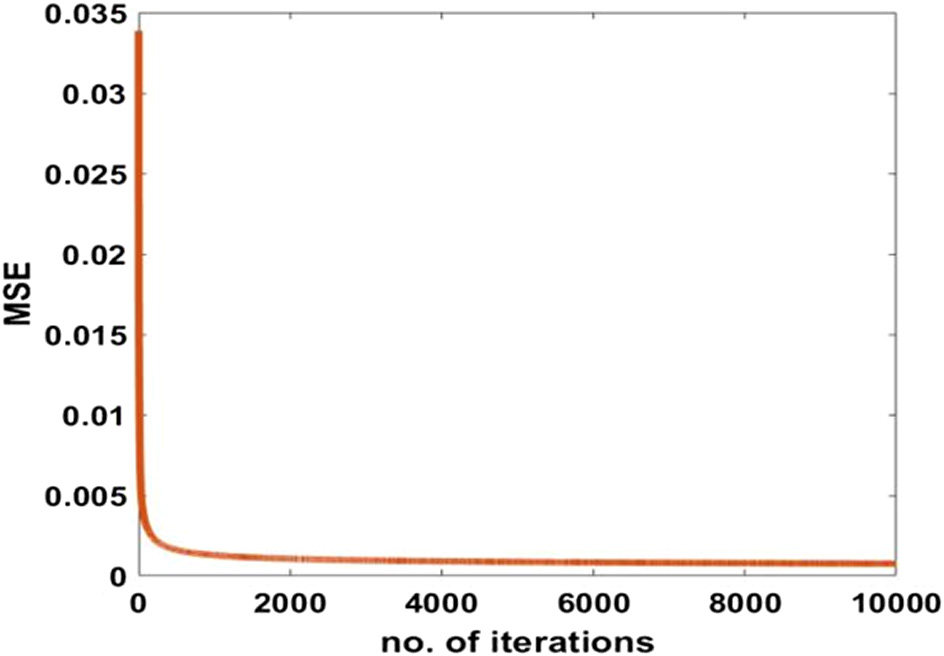 Fig. 3. Convergence characteristics of P-FLANN.
In each FLANN model, every input is functionally expanded by a collection of basis functions. To tackle complex classification and approximation problems, it is necessary to identify the weight parameters (W) that will result in the best feasible approximation using the basis functions that have been chosen (φ). A set of linearly independent functions is generated elementwise, which helps in capturing relevant information from the features. The functional expansion can be trigonometric (TFLANN), Chebyshev (CFLANN), polynomial (PoFLANN), etc. Depending on the types of features and applications, the basis functions are selected [36]. The basic functions for the functional expansion taken into consideration in the proposed technique are trigonometric (TFLANN) in nature. The relationship between inputs, weights, and outputs of the TFLANN model are as follows:
The inputs (X) are one-dimensional linear spectrum features. The number of features for the low, medium, and high regions is f1-f14, f15-f232, and f233–f1024, respectively. The details are listed in Table I. W(k) is the weight matrix multiplied by each term of the basis functions (ϕ). The pleasano values (P) are calculated thrice for each region, and the output is the weighted sum between all of them. pl, pm, and ph are the pleasano predicted values from the proposed P-FLANN model for low-, medium-, and high-frequency regions. Similarly, δ1, δ2, and δ3 are the weights associated with each region as mentioned in Table I. The predicted pleasano values are calculated as:
The actual pleasano values are calculated from the labeled dataset as mentioned below:
The error for each region is calculated as Equation (6). The values of i are 1, 2, and 3 for regions low, medium, and high, respectively:
E.WEIGHT UPDATION USING SWARM INTELLIGENCE
Typically, the gradient descent method is used for updating the weights in the FLANN model. However, there is a chance of a solution being struck at local minima. To solve this problem, swarm intelligence-based stochastic optimization algorithms are quite helpful [37]. Particle swarm optimization (PSO) is one of the effective population-based stochastic optimization techniques based on bird flocking. PSOs are simple to implement with faster convergence and few parameters to adjust. It depends on mainly two parameters: position and velocity. The calculation and update equations are described in Equation (7) [38]:
The current position and velocity of the particle i in the dimension d at time t are and . The previous best position of the particle i in the dimension d at time t and the global best are denoted as and Gt(d) respectively. w, c1, and c2 are the constants representing the inertia weight, and acceleration coefficients related to personal best and global best respectively. γ1 and γ2∈[0, 1] are two random variables. The objective function is the minimization of the mean squared error (MSE) between the actual and predicted value of pleasano numbers. W(k) represents the k-dimensional weight vector associated with the P-FLANN:
III.SIMULATION RESULTS AND DISCUSSIONS
The proposed P-FLANN model is simulated in the MATLAB platform using the steps mentioned in Fig. 4. For the development of the pleasantness prediction model, 80 % of the samples of dataset-1 is used, and the training process is stopped when the MSE attains a minimum value. The remaining 20% of samples of dataset-1 and all samples of dataset-2 are used for testing the model. The convergence characteristics of the P-FLANN model are plotted in Fig. 3. The training is continued for 10000 iterations and stopped once the mean square error remains constant and stops decreasing further.
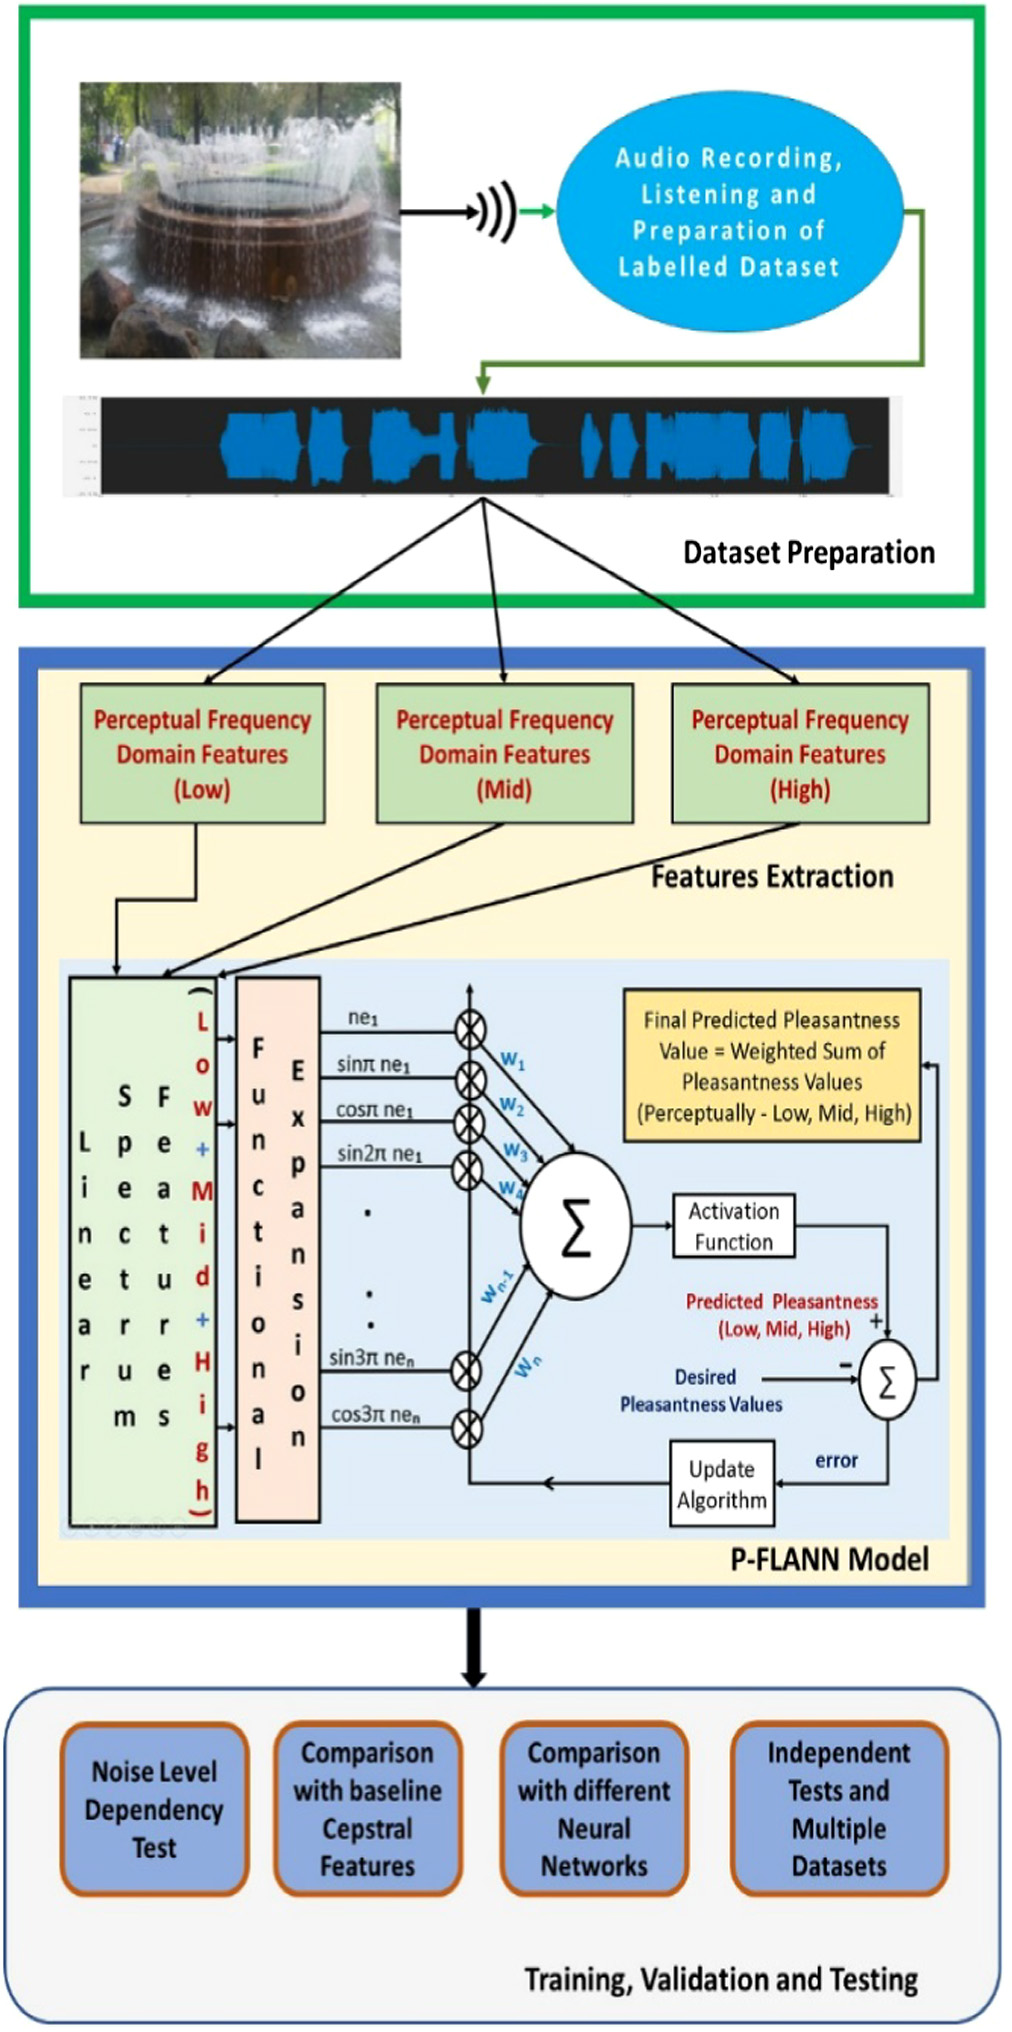 Fig. 4. Block diagram of the proposed model.
A.PERFORMANCE EVALUATION USING BASELINE CEPSTRAL FEATURES
The performance comparison of the proposed P-FLANN model is done with several standard baseline speech feature extraction techniques including Mel frequency cepstral coefficient (MFCC), Gammatone cepstrum coefficient (GTCC), and equivalent rectangular bandwidth scale (ERB). In these comparisons, the basic FLANN model was used without any weighting scheme. The results are listed in Table II. It is observed that the proposed P-FLANN is performing better than the other three models. The modifications done at the neural network works better than the feature extraction stage. The three-way training approach at different frequency regions is working better than one-way training.
Table II. Comparison of prediction performance of the proposed method with existing baseline models
| Methods | Dataset-1 | Dataset-2 | Combined dataset |
|---|---|---|---|
| MFCC + FLANN [ | 92.7 | 93.3 | 94.2 |
| GTCC + FLANN [ | 89.2 | 88.4 | 90.6 |
| ERB + FLANN [ | 87.5 | 88.7 | 89.5 |
| P-FLANN (proposed) | 97.2 | 98.4 | 99.1 |
B.PERFORMANCE EVALUATION USING DIFFERENT TYPES OF NEURAL NETWORKS
After evaluating the performance of the proposed model at the feature extraction stage, the model is compared at the neural network level with the same set of features. The one-sided linear spectrum features (f1–f1024) are used as common features in TFLANN, RBFNN, PoFLANN, and ANN-BP models, and the evaluation results are listed in Table III. It is observed from the table that the P-FLANN model is outperforming other neural networks for all three dataset options. The RBFNN model is performing as the second best model followed by the TFLANN model. The trigonometric expansion is showing improved results than the other expansions.
Table III. Comparison of prediction performance of the proposed method with different neural network
| Methods | Dataset-1 | Dataset-2 | Combined dataset |
|---|---|---|---|
| TFLANN [ | 86.5 | 84.5 | 87.6 |
| PoFLANN [ | 84.2 | 86.5 | 88.3 |
| RBFNN [ | 91.3 | 91.9 | 92.3 |
| ANN-BP [ | 84.2 | 85.3 | 88.6 |
| P-FLANN (proposed) | 97.2 | 97.4 | 98.1 |
C.TESTING WITH NOISE
To study the effect of background noise on the proposed model, testing with noisy conditions is studied. The two datasets are combined with real-life background noises of traffic at different signal-to-noise ratio (SNR) levels similar to the Noizeus dataset [46]. After the dataset preparation, the pleasano number prediction task is performed. The results are plotted in Table IV. It is observed that at low SNR values, the prediction performance decreases, and at higher SNR levels, the prediction performance is comparatively better. Out of the three noise conditions, the street noise affects the most and the babble noise affects the minimum. Still, the prediction performance is more than 93%, which demonstrates the robustness of the proposed P-FLANN model to noise.
Table IV. Testing with different noisy conditions
| Type of noise | Noise level | Prediction performance |
|---|---|---|
| Street noise | 0 dB | 93.9 |
| 5 dB | 94.3 | |
| 10 dB | 95.2 | |
| 15 dB | 96.5 | |
| Babble noise | 0 dB | 94.6 |
| 5 dB | 94.9 | |
| 10 dB | 96.4 | |
| 15 dB | 98.3 | |
| Car noise | 0 dB | 94.2 |
| 5 dB | 95.9 | |
| 10 dB | 96.2 | |
| 15 dB | 97.5 |
Figure 5 shows the comparison between the expected and the desired values of the P-FLANN model for the combined dataset. The normalized values of pleasano numbers are plotted. It is observed that the estimated values are matching with the actual pleasano values which justifies the superior performance of the P-FLANN-based approach. This approach can be successfully implemented for the prediction and classification tasks of P-FLANN. In cepstral features, the features are extracted by using the human speech perception model as well as a bank of filter model. But, in the P-FLANN model, the features are not passed through the mel scale which enables for extraction of all frequency domain features. Only, the weights are adjusted according to human speech perception. It enables the proper training of the model and superior performance as compared to the simple cepstral features.
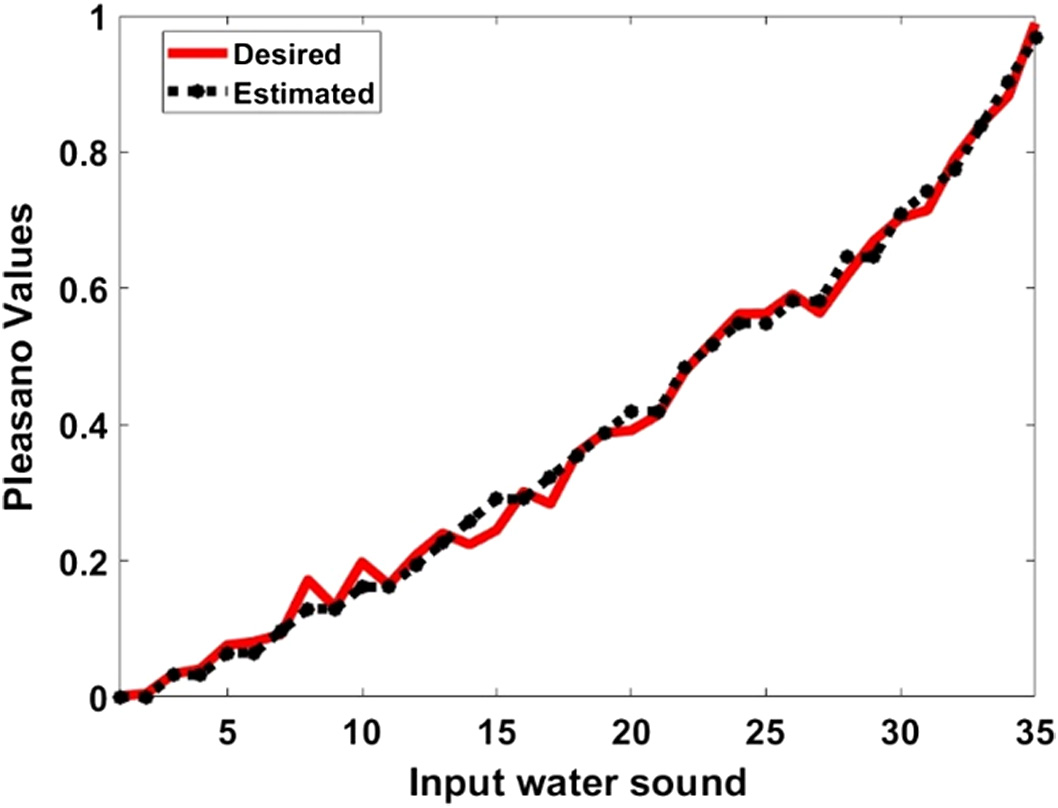 Fig. 5. Comparison between estimated and desired normalized pleasano values.
IV.CONCLUSION
In smart city design, the improvement of human health through listening to natural sounds is a key parameter. Here, the sounds of water fountains built in parks and public spaces are primarily designed to serve as a visual appeal and also affect the human health psychologically as they provide a relaxing environment to the visitors. However, direct assessment of the pleasantness of water sound is difficult and costly. For the objective evaluation, a P-FLANN model is developed in this article. The optimal weights of the proposed P-FLANN model are adjusted using bio-inspired techniques to reduce the number of computations. This model is used to predict the pleasantness of the water fountain sound by using spectral features. The simulation results have shown the effectiveness of the proposed model with more than 95 % accuracy in two standard datasets. To test the robustness of the model, it is also tested at several noisy conditions and observed that it performs satisfactorily. In the future, real-time pleasantness measurement and hardware implementation or mobile application-based implementation can be done.