I.INTRODUCTION
Retinopathy of prematurity (ROP) is a vascular disease that may cause vision impairment [1]. ROP has a challenging dataset that consists of stage 1, 2, 3, and 4 with a lot of variability in orientation, blood veins, and intensity values. ROP can be treated if good screening is available. Good screening leads to early and accurate detection, and early detection should allow for more successful treatment. There are around three hundred retina specialists in India of which only very few are ROP specialists. The automation of ROP classification will help the specialists to focus on the treatment. The software tool can be easily used by the technicians, paramedic staff, and others to classify the stages of ROP.
ROP is underdeveloped vascularization of retina in premature babies which can lead to vision loss or blindness. Premature babies with birth weight less than 1800 g or gestational age less than 32 weeks are at risk of developing ROP. Due to the incomplete development of the premature baby, a vascular delay or a vascular lesion determines the appearance of ROP. The avascular area of the retina will be delimited from the vascular area by: the absence of vessels or by a line (ROP stage I), ridge (stage II), or vascular proliferation (stage III) or a retinal detachment (stage IV or V). In advanced grades of ROP, there is a high risk of retinal detachment and bilateral blindness. For this reason, neonates are screened at 4–6 weeks after birth and then every 1 or 2 weeks until the vascularization of the retina is complete.
The retina consists of multiple blood vessels. If there is any irregularity in these vessels, then retinopathy is developed. Development of this disorder of retina happens either slowly or suddenly. This condition is treated by an ophthalmologist by studying the images taken from different cameras. Early treatment might lead to improvement in vision and avoid further degradation of vision.
Retinopathy disease development is variable in each individual. This condition can get normalized on its own or lead to permanent damage. Earlier ROP was called retrolental fibroplasias [2].
Various studies show that the leading cause of blindness is rise in premature babies, not only in developed but also in developing countries. During initial stages of ROP, there is less impact on sight. In later stages, blood vessels become more tortuous, and neovascularization occurs which is an indicator of ROP. These new vessels are delicate and may cause bleeding to impact the vision. In advanced stages, there are chances of retinal detachment that endangers the vision, thereby causing blindness [3]. Figure 1 shows the RetCam images of premature babies.
 Fig. 1. RetCam images of premature babies: (a) normal image and (b) ROP image.
Early treatment of ROP can prevent blindness. Lot of work has been exploited based on computer-aided detection of ROP to assist ophthalmologists.
Most of the research work is carried on retinal grading of blood vessels, tracing of vessels [4] diameter, curvature [5], length to chord [6], angle-based measures [7–9], Principal Component Analysis (PCA) [10], tortuosity measurement for the detection of pre-plus, plus disease, and normal and limited work on the automation of classification of stages based on severity [11,12]. The challenges faced for the development of automation of classification of stages are ROP dataset that is limited and extremely imbalanced dataset due to lack of awareness and expertise. Once the classification of ROP stages based on severity is done, timely treatment can be provided to neonates thereby preventing blindness. There is a scope to work on identifying the presence of ROP and assessing the severity of ROP and classifying them using machine learning, which will help not only to provide early treatment but also help to reach more number of patients through telemedicine.
The rest of the paper is organized as follows. Section II discusses related studies. Section III describes proposed methodology adopted in the study, whereas Section IV discusses proposed classification. Section V explains about the imaging modality, dataset, experiments, and outcomes/results. Section VI summarizes the findings of the study, and finally, section VII ends with future scope of the study.
II.RELATED WORK
International Classification of ROP (ICROP) was published in 1984 and 1987. The ICROP document was about the treatment, observations, and different phases of the disease [13,14]. The ICROP document was revisited in 2005 with the addition of aggressive posterior phase and pre-plus disease. Last stage of ROP results in retinal detachment and blindness [15]. The four features are evaluated based on ICROP classification: Location, Severity, Extent, and Presence or Absence of plus disease. There are three zones based on the location: Zone I, Zone II, and Zone III. The identification of Zone I based on the optic disk (OD) and macula structures were calculated as per the ICROP using deep learning algorithm [16]. The study demonstrated the Zone II ROP at low-, moderate-, and high-risk level. The incidence of type 1 Zone II ROP that has significant decrease of severe ROP in China might be due to awareness and risk of vision loss due to ROP [17]. RetCam imaging can be used for the characterization of retinal hemorrhage in neonatal babies, found mostly in Zone II with grades II and III. During the process, there are minor systemic symptoms that may be recovered on their own indicating the safety and efficacy of the imaging tool [18]. The assessment of retinal lesions found in premature infants and its implication are crucial in the clinical practice of ophthalmology [19]. The paper addresses the regression of stage 3 ROP and the growth of blood vessels in Zone III of the retina, which can provide valuable information for healthcare practitioners when making decisions in borderline ROP cases [20].
The artificial neural network is used to overcome the nonuniform distribution and low quality of retinal fundus images for the better visibility by improving the four features contrast, brightness, gamma factor, and cliplimit of retinal blood vessels to support the ROP diagnosis [21]. The more advance automated network like convolutional neural network is used for complicated task of grading the retinal blood vessels. The transfer learning approach along with pretrained Inception V3 feature for attention network is adopted for automatic diagnosis of vessels [22]. The automated quality evaluations of images were classified as acceptable, possibly acceptable, and not acceptable using deep convolutional neural network to detect the presence of ROP confidently [23].
A technique on a curvature-based estimation algorithm for automatic evaluation of tortuosity in retinal image was addressed [5]. The author proposes the multiple instances learning method for the detection of ROP [24]. The author has discussed vessel segmentation using COSFIRE and evaluated tortuosity using curvature method [25]. The matched filter plus kernel performance was better compared to the matched filter and first-order derivative of Gaussian [26]. A new approach to measure the tortuosity based on principal component analysis was proposed [10]. Author assessed vessel tortuosity using Gabor filter and morphological methods [7].
Another set of studies discuss image localization, feature extraction, and classification using neural network and could classify only three stages: stage 1, stage 2, and stage 3 [11]. They could establish use of segmentation of vessels to develop a supervised classification for ROP. The extracted feature set comprises multiscale vesselness and texture features. Describing about vessel segmentation and accuracy of 97% is achieved [27]. Manual segmentation of the vessels and extraction of image-based features, such as tortuosity and integrated curvature, are discussed where the accuracy was 90% [28]. Author used vessel centerline extraction for vessel tracing and achieved sensitivity of 0.78 with 0.15 false detection rate [4]. For authors, a major challenge was of nonagreement of experts while diagnosing the tortuosity of ROP than with the metrics [29]. A detailed review on applications of image processing to diagnosing ROP and comparison of different methods is discussed [30]. Author analyzed not only width but also arteriolar and venular tortuosity in advancing ROP. They concluded that tortuosity makes the difference and not the width of vessels for the screening of ROP [31]. An algorithm was developed for measuring tortuosity of vessels, but they used images with manual tracing of blood vessels [32]. Author extracted distinctive invariant features of images with a method development that is named as scale-invariant feature transform (SIFT) [33].
Artificial intelligence algorithms aid in the clinical practice of ROP for improving the accuracy and efficiency of the ROP with proper handling of image acquisition, feasibility, and validation. Real-world challenges in implementation, development, and strategies of artificial intelligence were discussed to bring the technology for the prevention of blindness due to the ROP [34]. In rural areas, there is a scarcity of ophthalmologists and unavailability of specialized facilities, so telemedicine will aid in the screening of ROP. The geometric features like area and diameter were extracted first using Hessian analysis, and then SVM classifier is used for detection and classification of ROP images as normal, stage 2, and stage 3 [12].
The detection of the first three stages and plus disease is done with the help of back propagation network (BPN) and a combined model of BPN and radial basis function (RBF) network [35]. Moreover, in the diagnosis of diseases, computerized image processing technologies not only help to save time and reproducibility but also often more accurate than human experts [36]. Transfer learning framework has been discussed for the screening of ROP. There are very few ophthalmologists available for the screening of ROP. In addition, there is a shortage of staff, medical equipment, and policy for ROP screening [37]. Author has discussed the calculation of Arteriolar-to-Venular diameter Ratio (AVR) by segmenting the vessel center line into arteries and veins and then classifying them [38]. The author has proposed the convolution neural network for the classification of severity of ROP and also compared mean aggregate operator. Moreover, the author concluded that the illumination has an impact on image recognition and result [39]. A novel approach was introduced by the author using a matched filter. The author presented a semiautomated CAD method for plus disease assessment [40]. Vessel segmentation which is one of the important features is extracted using convolutional neural networks [41]. The optimization framework is adopted to address the significant challenges and early detection of ROP using convolutional neural networks with perfect sensitivity score [42]. Different deep learning models [43,44] are employed for the identification of ROP, NOROP, mild severe, and plus disease. Article [45] provides a detailed review of several deep learning algorithms that have been employed in recent years for the detection of various eye disorders.
III.PROPOSED METHODOLOGY
The flow chart of the proposed methodology is shown in Fig. 2. RetCam imaging system is used for ROP screening. Once the images are acquired, preprocessing is done for further enhancement and noise removal. The feature extraction and summarization process is comprised of the following techniques:
- 1.Pyramid histogram of words (PHOW) features (dense multiscale SIFT descriptors) computation on images.
- 2.K-means for visual word dictionary construction, that is, bag of words (BoW) on PHOW features. Training and evaluation are done using various machine-based classifiers. Three different classifiers are used, and finally four stages are classified.
 Fig. 2. Block diagram of proposed workflow.
In this proposal, we developed a novel framework which consists of successive steps.
A.PREPROCESSING
Preprocessing consists of resizing, contrast enhancement, illumination equalization, and noise removal. The images are resized to 512 × 512 × 3 in the proposed work. Then the RGB images are converted to grayscale.
B.FEATURE EXTRACTION: SIFT
The SIFT detects and describes local features in images. Reference images are created with the extraction of the key points. These sets of reference images are stored in a database. The important stages of computation for SIFT are scale space, Laplacian of Gaussian (LoG) approximations, finding key points, getting rid of low-contrast key points, key point orientations, and generating a feature. Building the scale space, all the scales must be examined to identify scale-invariant features. The effective way to get the best scale is to compute the Laplacian pyramid. Approximations of LoG are done by difference of Gaussians (DOG). The value of sigma and k has to be decided.
Each octave has three layers [33]. The initial value of sigma is 1.6, and the numbers of octaves are computed automatically from the image resolution. Weak features from low-contrast regions were filtered out by using the contrast threshold. The sigma of the Gaussian is applied to the input image at the octave.
We looked at each point of 3X3 neighborhoods in the lower and higher scale as shown in Fig. 3 and compared a pixel X with 26 pixels in current and adjacent scale. We selected the pixel X if it is larger/smaller than all 26 pixels so that large numbers of extrema are found. Computationally, it is expensive but detects the most stable subset with coarse sampling scales. Key point localization is to localize each interest point. The use of Taylor series expression of DOG helps to avoid the outliers. Further outliers can be removed by computing the principal curvature. Now orientation of interest point is to be assigned at each of the point or direction, and then histogram of 36 bins is built as 360 degrees will give 36 bins each with 10 degrees. Sensitivity to changes in image scale of Harris detector does not allow its use for matching images of different sizes.
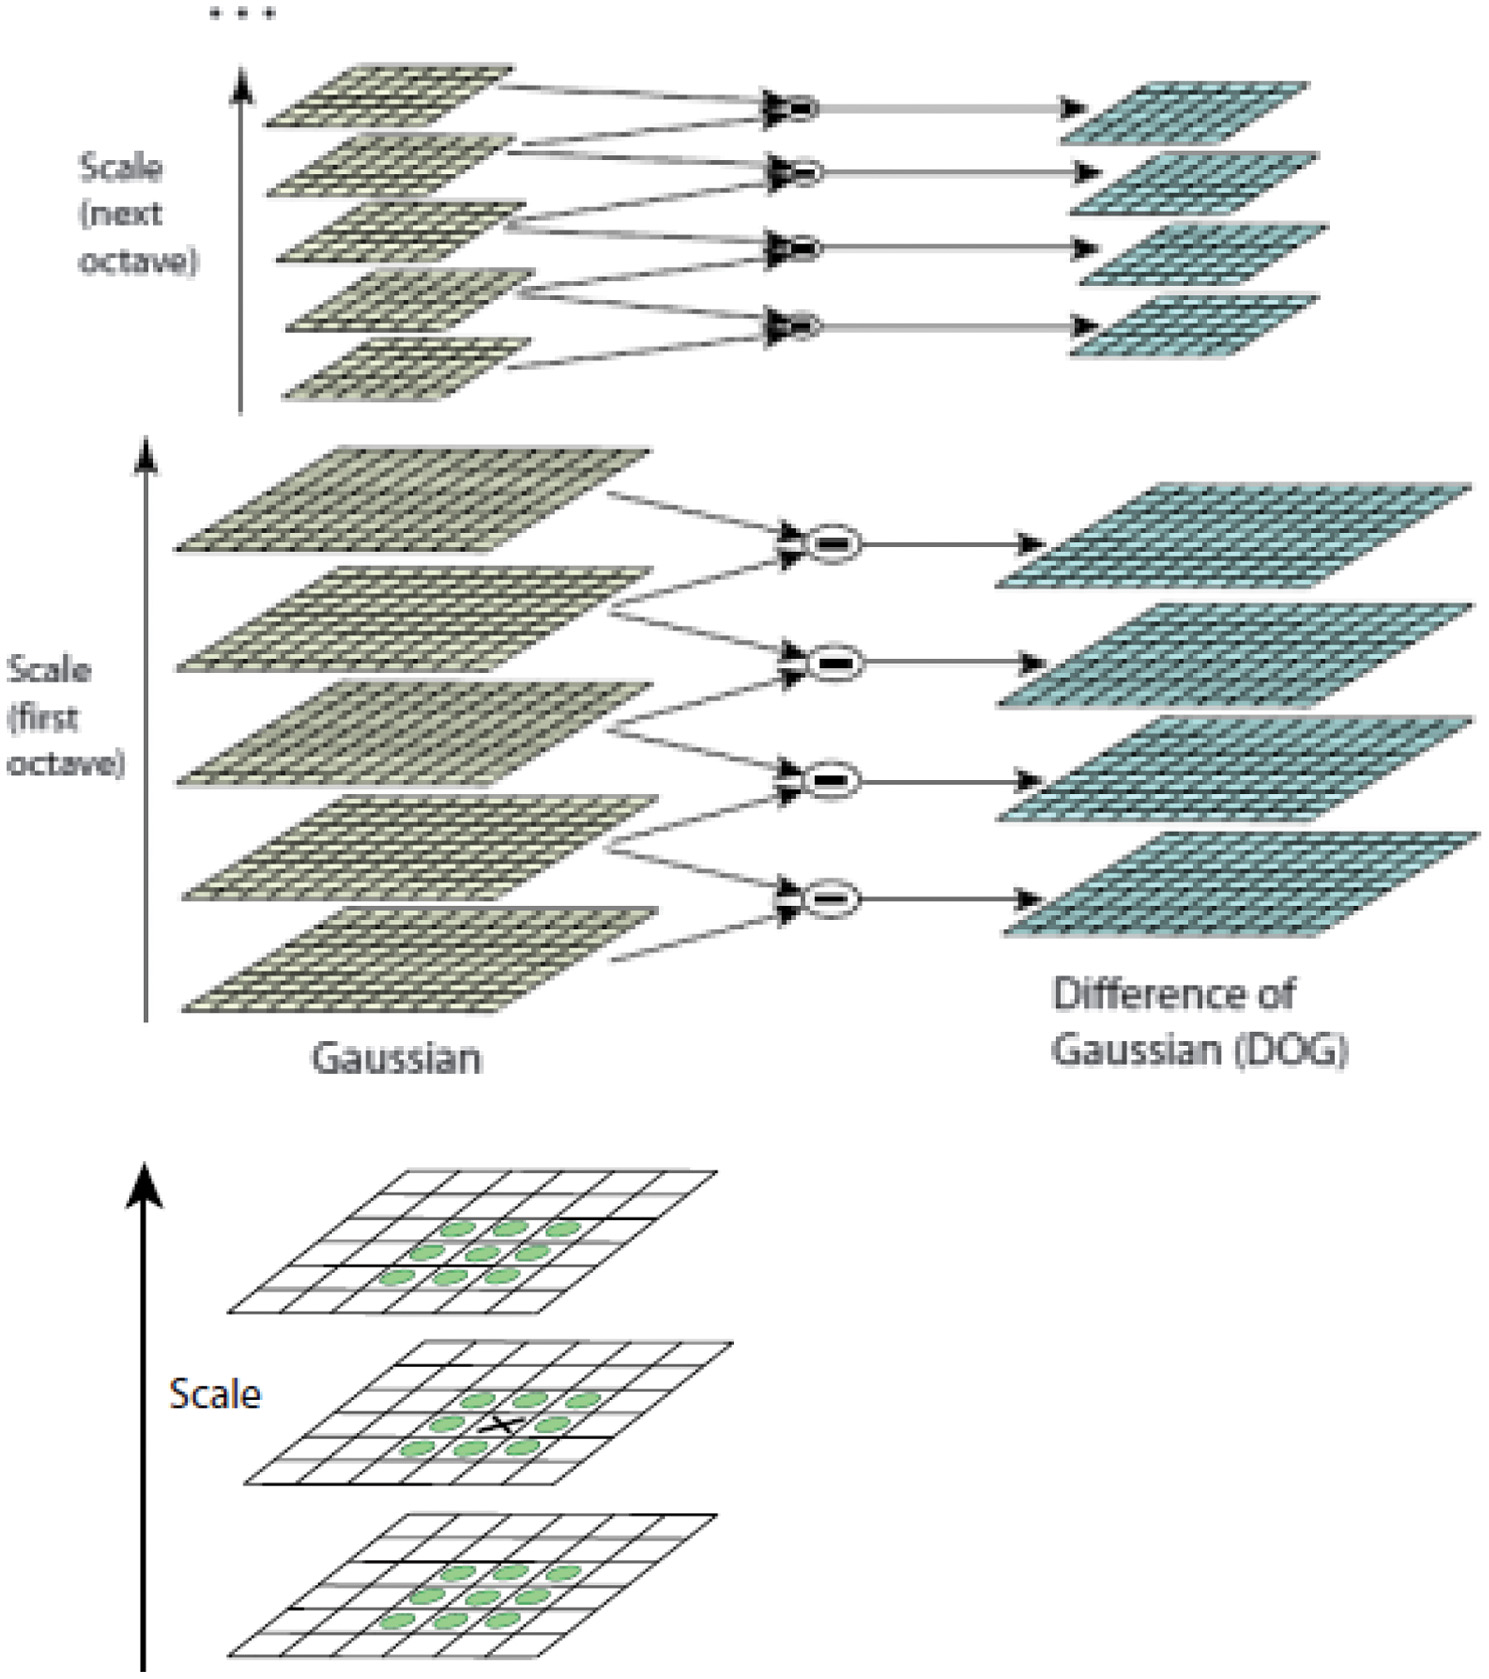 Fig. 3. (a) Generation of scale space using Gaussian and difference of Gaussian. (b) Comparison of pixels to its 26 neighbors [33].
IV.PROPOSED CLASSIFICATION
We have introduced a fully automatic algorithm in this paper for the classification of different ROP stages on the basis of severity using three different classifiers.
Classification of ROP is a multiclass classification problem. There are different stages of ROP. We have considered four stages for experimentation. It is a four-class classification problem of ROP, which will classify as stage 1, 2, 3, and 4. In multiclass classification, each image is assigned with one label. There are five stages of ROP tabulated in Table I.
Table I. Severity-based ROP stages
| Stages | Information |
|---|---|
| 1 | Fine line |
| 2 | Elevated ridge |
| 3 | Fibrovascular proliferation |
| 4 | Partial retinal detachment |
| 5 | Total retinal detachment |
We could classify the different stages of ROP on the basis of the severity. We conducted four experiments for classifying the stages of ROP which is a multiclass problem. The individual stages were graded using different classifiers. Out of 300 images, 47 were labeled as class 1 (stage 1), 47 were labeled as class 2 (stage 2), 60 were labeled as class 3 (stage 3), 38 were labeled as class 4 (stage 4), and 108 were labeled as class 5 (normal).
In this section, we briefly describe the different classifiers. The multiclass classification is addressed using three classifiers: random forest (RF), support vector machine (SVM), and extreme boosting gradient (XGBoost).
SVM is kernel-based classifier separating the hyperplane. SVM is a binary classification algorithm and is robust to variance and small sample data. The features are scaled up by using different kernel functions. Adjustable parameter sigma plays a major role in the performance of the RBF kernel and should be carefully tuned to the problem at hand. The multiclass SVM has two categories one-versus-one (OVO) or one-versus-all (OVA) [46,47]. The multiclass classification problem is resolved by multiple binary classification problems. OVA-SVM classifies one of the classes as positive and others as negative using binary classifiers in classification problems.
RF classifier can be used both for classification and regression problems. RF algorithm is a supervised classification algorithm that creates the forest with a number of trees which does not over fit the model. The trained RF algorithm is used on test dataset for classification [48].
XGBoost is a machine learning algorithm that has recently been dominating for structured or tabular data. XGBoost is an implementation of gradient-boosted decision trees designed for speed and performance [49].
V.EXPERIMENTATION AND RESULTS
In this section, we have presented the experimental setup, imaging modality, analysis strategy, and execution of the proposed method.
A.IMAGE ACQUISITION
RetCam is an alternative digital imaging tool for screening ROP conditions of neonatal [50]. The latest advancement of ultra-widefield imaging technologies and their clinical applications has accelerated the focus on diabetic retinopathy, retinal vein occlusion, uveitis, and pediatric retina [51].
The ophthalmic images taken from RetCam can be stored, retrieved, and used for further observation and analysis using a computer/laptop on board. The laptop monitor is used for viewing images with the RetCam Shuttle and RetCam Portable. Proprietary software is installed on the computers to capture, store, view, retrieve, and export ophthalmic images. The key factors of the device are photo documentation, serial imaging, portability, and financial affordability [52]. The clinically challenging features of neonatal fundus images were enhanced with the aid of inexpensive and noninvasive RetiView software specifically in the subset of Aggressive Posterior Retinopathy of Prematurity (APROP) images [53].
B.DATASET
The images required for study were obtained from PSG Institute of Medical Sciences & Research, India, after ethics committee approval. The institute has digital fundus imaging camera RetCam 120 with a field of view (FOV) of 130 degrees. Images obtained are of premature infants with gestational period between 28 and 33 weeks.
Three retinal ophthalmologists were part of this research work, two senior and one junior ophthalmologists. Retinal ophthalmologists labeled images as normal, stage 1, stage 2, stage 3, and stage 4. The chief has the experience of more than 25 years; the senior ophthalmologist has more than 20 years of experience and another ophthalmologist has the experience of 10 years.
The Indian dataset had 300 images: 192 diseased and 108 normal. The outcomes are then tabulated. Our dataset consists of different scale, viewpoint, rotation, illumination, and orientation. It was a challenge to extract the features and match these images. To overcome this challenge, there is a need of distinctive, invariant features extraction that should be reliable for matching.
Table II shows the distribution of data which is unbalanced in the ROP screening. The ratio of ROP to non-ROP is 1∶2. The diseased images are approximately half of the non-ROP images.
Table II. Dataset used for training, testing, and validation
| Stages | Number of images |
|---|---|
| 1 | 47 |
| 2 | 47 |
| 3 | 60 |
| 4 | 38 |
| Normal images | 108 |
The progression of ROP has been classified in five different stages. Figure 4 shows the different images with respect to stages of ROP.
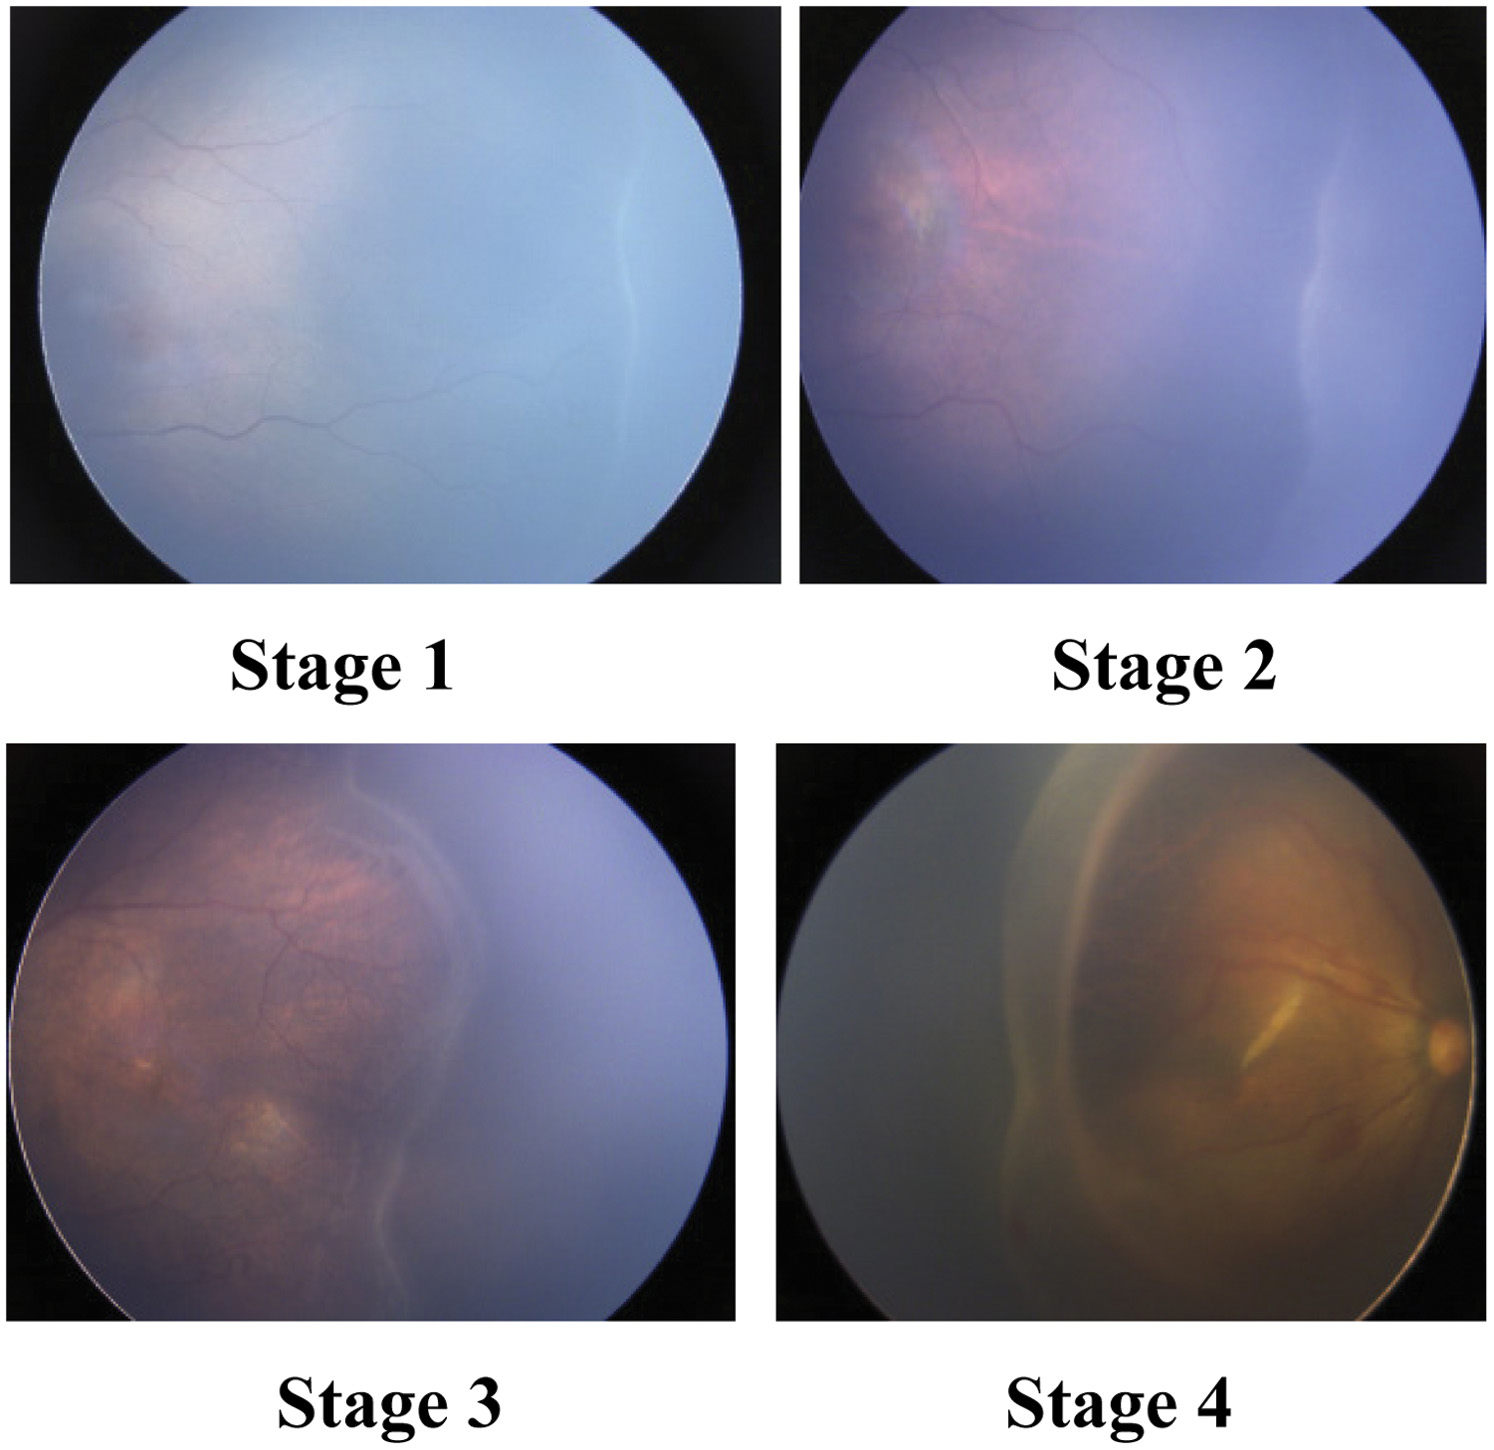 Fig. 4. Different stages of ROP.
The RGB images of the size 1600 × 1200 × 3 were resized into 512 × 512 × 3 to save the computational burden. The resized images were converted into grayscale. All four stages dataset was given as input. We divided dataset into training, validation, and testing images. The SIFT features were extracted from training. We selected ROP stage 1, 2, 3, and 4 images, namely the 300 images. We computed dense SIFT descriptors and quantized them using a visual dictionary (1000 words). This collection of a dictionary is used as training data for a parameter-tuned SVM classifier with a linear kernel, RF, and XGBoost. Finally, these trained images are given to the classifier which distinguishes the images based on the severity of ROP, that is, stages 1, 2, 3, and 4.
C.MINIBATCH K-MEANS AND PHOW DESCRIPTORS
One of the most popular clustering algorithms is k-means, but computational cost is high as the dataset increases. We have used mini batch k-means which is an alternative to k-means. It reduces the computational cost for finding the partition of clusters. All the features similar to each other will fall into one cluster. There will be four clusters for four stages and as clusters increase, the computational cost is more evident but at the cost of quality loss of cluster.
BOW is a feature summarization technique that helps in image classification. Key points are extracted using SIFT for each of the images, and then BoW is created. The PHOW is used for image description which is an extension to the BOW. The PHOW helps to overcome the limitation of BOW [54,55] where the information of spatial image features is available by partitioning the image into pyramids (subregions) and the histogram of each pyramid is concatenated to the histogram of the original image with a suitable weight.
Figure 5 shows the SIFT key points and histogram of stage 1. The BoW is used to quantize the local features and classify the images. The model generates the feature vectors and maps the vectors using BoW and then generates the histogram of key points. PHOW descriptors are computed, and then k-means is used for clustering the descriptors into centroids. The PHOW is used for training multiclass classifiers.
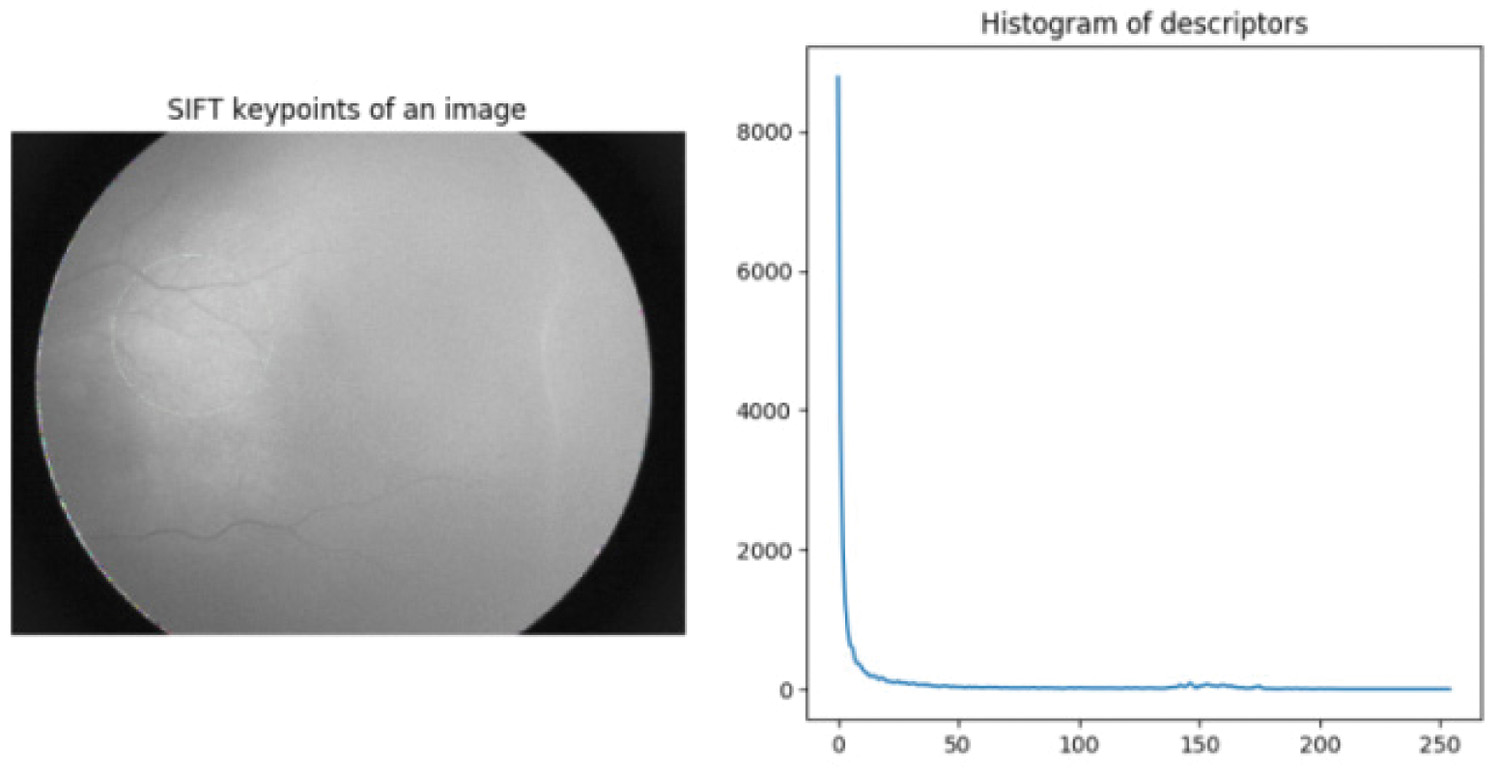 Fig. 5. SIFT key points and histogram of stage 1.
We treat the grading of ROP as a multiclass classification. We have five classes, that is, normal, stage 1, stage 2, stage 3, and stage 4, respectively. The imbalanced dataset has unequal class distribution. A total of 192 datasets which are ROP cases, 47 belong to class 1 (stage 1), 47 belong to class 2 (stage 2), 60 belong to class 3 (stage 3), 38 belong to class 4 (stage 4), and 108 belong to class 5 (normal) which is non-ROP.
D.PERFORMANCE METRICS
The study consisted of four experiments, and each experiment was performed for classification and grading of individual stages using three different classifiers. The classifiers used were SVM, RF, and XGBoost.
The training process is carried out on the training dataset, while the validation set is used to fine-tune the model. The overall performance of each model is assessed on the test dataset. Various metrics are considered like precision, recall, F1-score, and accuracy. These performance metrics are based on True Positive (), False Negative (), True Negative (), and False Positive (). The recall is beneficial than precision in most of the cases. As the data distribution is unequal, F1 score or PR will give more insights about the result and be beneficial:
The validation accuracy of normal, stage 1, stage 2, stage 3, and stage 4 for SVM is 89%, 82%, 81% 65%, and 80%, whereas for RF is 88%, 78%, 69%, 65%, and 86%, and for XGB is 92%, 78%, 69%, 59%, and 86%, respectively. Similarly, the testing accuracy is 92%, 83%, 86%, 44%, and 100% for SVM, 90%, 71%, 86%, 56%, and 100% for RF, and 94%, 83%, 86%, 56%, and 100% for XGB, respectively. Fig. 6 shows the comparison of all accuracy using different classifiers. The accuracy of stage 3 is less due to an unbalanced data, quality of images, data size, and low contrast. The extraction of features like demarcation line, ridge, and vessel was challenging due to quality of image and low contrast. For the classification of the images based on location or zone wise, the OD fovea and macula are needed to calculate the Zone I, Zone II, and Zone III. The dataset had hardly any information or features like OD and macula. Classifying the images based on the extent requires minimum five contiguous or eight noncontiguous clock hours to describe the disease. OD, Fovea, and the macula information was required to mark clock hours. It is very challenging to extract distinctive features from fundus images of ROP as the pixel intensity is low contrast.
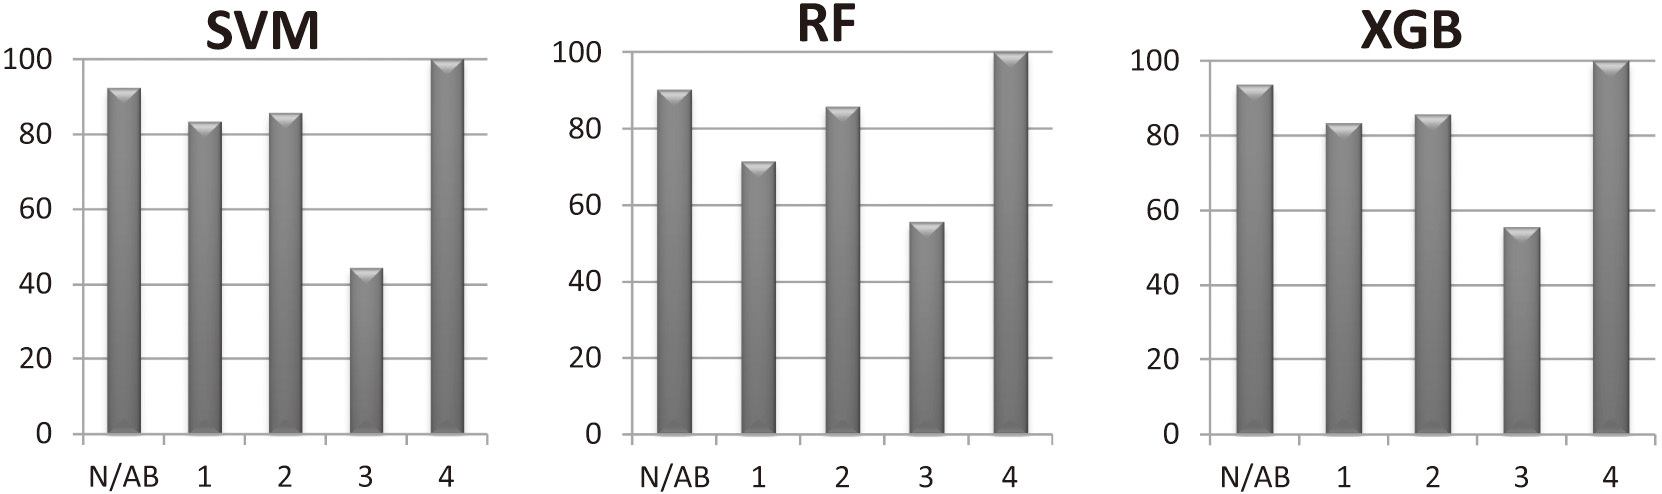 Fig. 6. Shows the comparison of accuracies for normal/abnormal, stage 1, stage 2, stage 3, and stage 4 using SVM, RF, and XGBoost classifier.
The SVM, RF, and XGB classifiers were used to evaluate the accuracy of normal vs. abnormal, stage 1, stage 2, stage 3, and stage 4. The classification accuracy is 93.33%, 90.17%, and 93.68 for normal vs. abnormal, for stage 1 is 83.33%, 71.42%, and 83.33%, for stage 2 is 85.71%, for stage 3 is 44.44%, 55.55%, and 55.55%, and for stage 4 is 100% respectively. The model had mean validation accuracy of 77.07%, 74.23%, and 72.76%, respectively, after training the dataset. The models’ performance was evaluated on the test set. The test set was randomly selected.
Table III displays mean accuracy for fivefold cross-validation for SVM, RF, and XGBoost classifier. Our state-of-the-art model was able to classify the multiclass problem with mean testing accuracy of 78.37%, 78.17%, and 81.15% using SVM, RF, and XGBoost classifiers, respectively.
Table III. Mean accuracy and standard deviation (SD) for SVM, RF, and XGBoost classifiers
| Classifier | Mean validation accuracy % (SD) | Mean testing accuracy % (SD) |
|---|---|---|
| SVM | 77.07 (0.059) | 78.37 (0.040) |
| RF | 74.23 (0.072) | 78.17 (0.052) |
| XGBoost | 72.76 (0.056) | 81.15 (0.064) |
Figures 7–9 show the precision, recall, and f1 score for different classifiers, respectively.
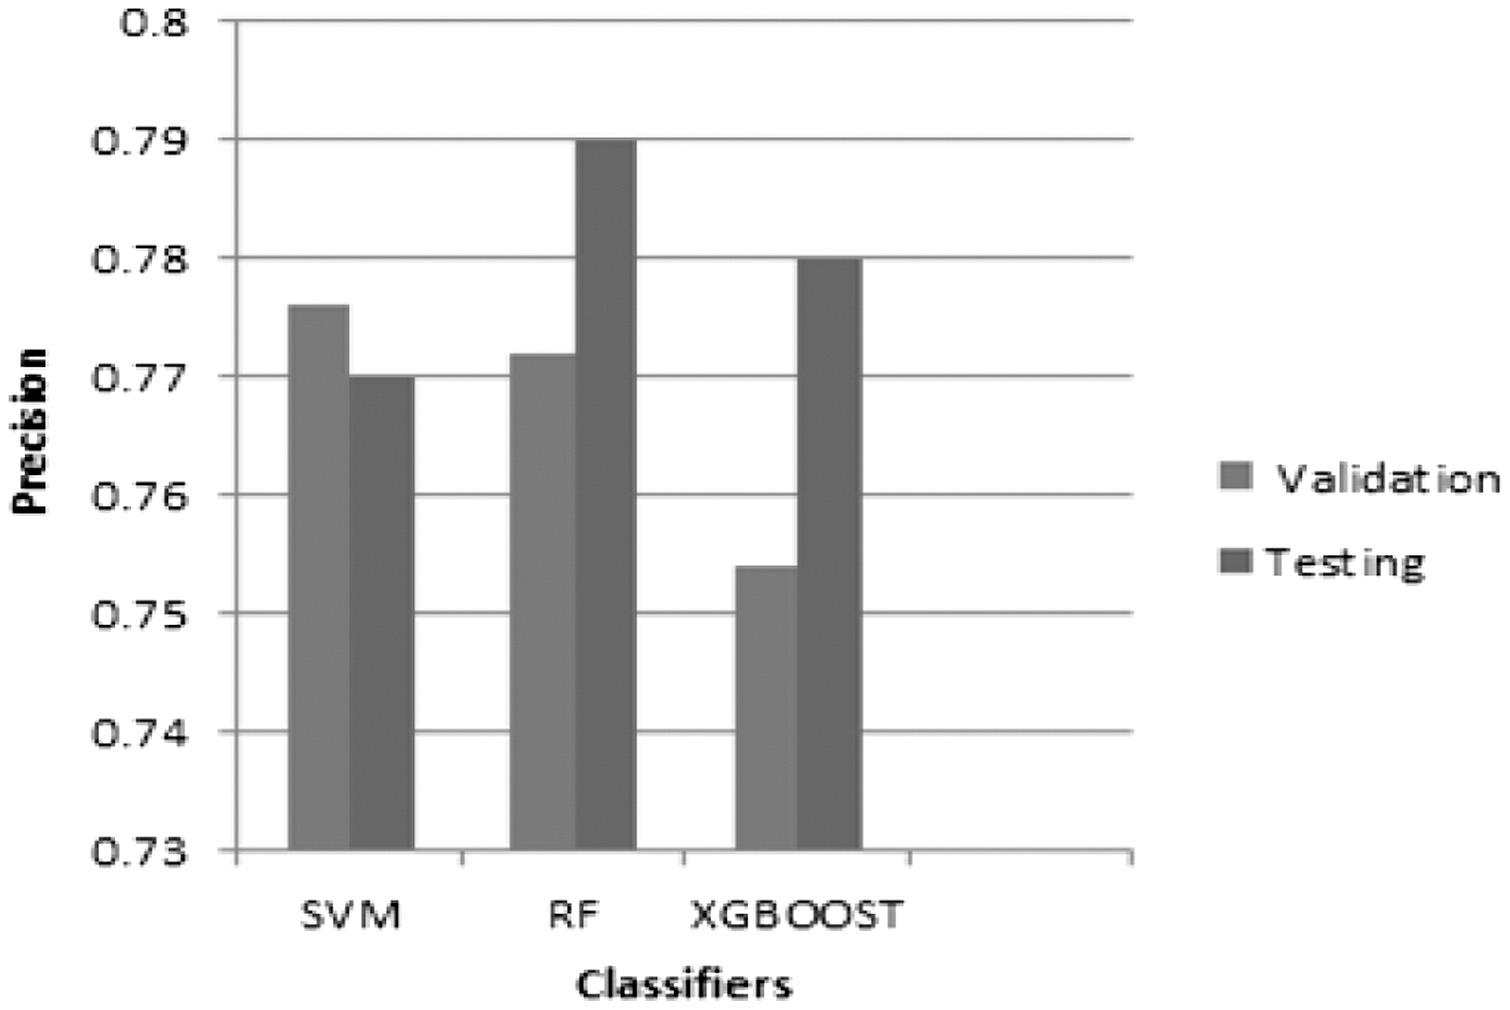 Fig. 7. The graph of precision vs. classifiers for weighted average for validation and testing accuracy.
 Fig. 8. The graph of recall vs. classifiers for weighted average for validation and testing accuracy.
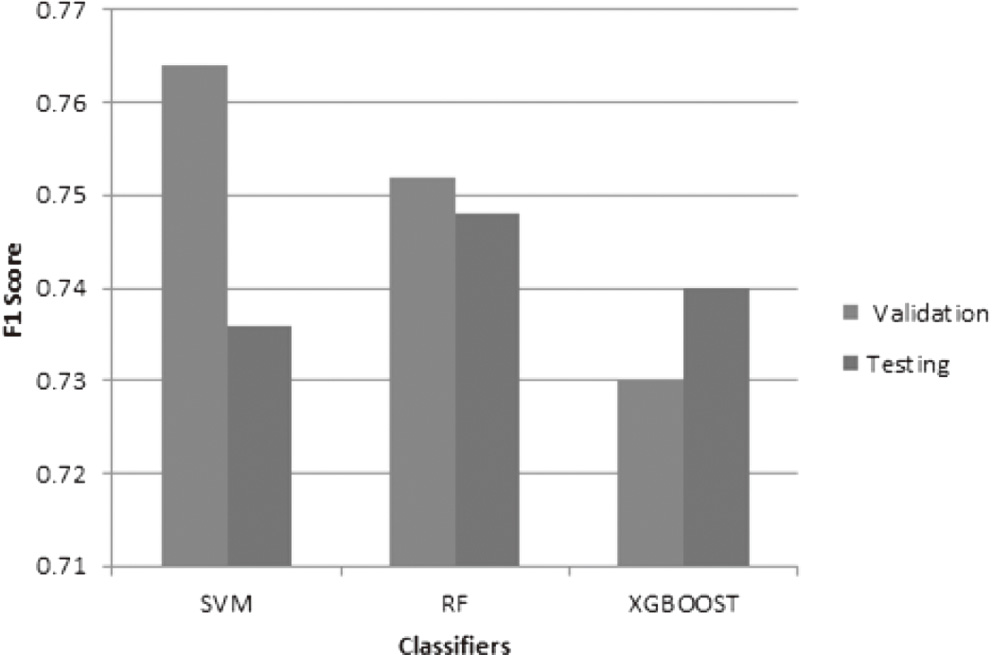 Fig. 9. The graph of f1 score vs. classifiers for weighted average for validation and testing accuracy.
RF classifier has high precision, recall, and f1 score as compared to SVM and XGBoost on the testing data. SVM classifier has high precision, recall, and f1 score on the validation data. But all the three metrics are very close to each other on the testing dataset. The model has 77%, 79%, and 78% precision for three classifiers, respectively. The RF predicts the ROP 79% of the time it is correct. It has a small number of false positives of 21%. The precision helps to understand the classifier’s ability not to misguide negative as positive. The recall graph indicates high recall for RF classifier, that is, the small number of false negatives. The model has 74.52%, 74.56%, and 73.55% recall for three classifiers, respectively. The graph shows high recall and high precision, but they are actually very close to each other. So there are a small number of false positives and false negatives, respectively. The F1 score is the balance between the precision and recall. The simple harmonic mean of precision and recall is known as f1 score. The model has 73.5%, 74.48%, and 74% f1 score for three classifiers, respectively.
VI.DISCUSSION
The proposed method results are critically analyzed. Our findings provide the assessment of normal/abnormal ROP and classification of different stages, that is, stage 1, stage 2, stage 3, and stage 4 over the Indian databases using SVM, RF, and XGBoost classifiers. The computational time, comparison of results, and limitations are also discussed here.
There are relatively very few findings for the evaluation of ROP normal/abnormal along with stages identification. Our method outperforms in the classification of different stages which are based on the severity of the disease. Table IV shows the computational time for different classifiers. Table V displays the comparison of findings by different researchers for detection and classification of ROP.
Table IV. Computational Time for SVM, RF and XGBoost classifiers
| Classifier | Training time (sec) | Validating time (μs) | Testing time (μs) | Finished (s) |
|---|---|---|---|---|
| SVM | 2.64 | 0.089 | 0.051 | 1628.467s |
| RF | 2.53 | 0.122 | 0.115 | 1863.713s |
| XGBoost | 2.83 | 0.027 | 0.022 | 1787.249s |
Table V. Comparison of accuracy for detection and classification of ROP
| Author | Method | Normal/ROP | Mild/severe | Zone I | Zone II | Stage 1 | Stage 2 | Stage 3 | Stage 4 | Others |
|---|---|---|---|---|---|---|---|---|---|---|
| Prabakar et al. [ | Histogram approach | — | — | — | — | — | — | — | — | 25 images with classification of stage 1, 2, and 3 |
| Rebecca Rollins et al. [ | Multiclass SVM | F1 = 73.33 (NR,RNT,RT) | — | — | — | — | — | — | — | — |
| Priya Rani et al. [ | MIL | 83.3 | — | — | — | — | — | — | — | — |
| Worrall et al. [ | CNN | 94 | 73 | — | — | — | — | — | — | — |
| Vijayalakshmi C et al. [ | Hessian analysis and SVM | 91.8 | — | — | — | — | — | — | — | Normal, stage 2 and stage 3 |
| Junjie Hu et al. [ | DNN | 97 | 84 | — | — | — | — | — | — | — |
| Xin Guo et al. [ | CNN | 98 | — | — | — | — | — | — | — | — |
| Yinsheng Zhang et al. [ | DNN | 98.8 | — | — | — | — | — | — | — | — |
| J. Zhao et al. [ | DNN | — | — | 91 | — | — | — | — | — | — |
| Ni, Ying-Qin et al. [ | Student’s t test and ANOVA | — | — | — | 69 low risk, 18 high risk, 13 moderate risk | — | — | — | — | — |
| Y.P Huang [ | DNN | 96 | 98.8 | — | — | — | — | — | — | — |
| Y. Peng et al. [ | DNN | 98.27 | — | — | — | 53.84 | 84.25 | 81.13 | 88.52 | — |
| Proposed approach | SIFT with SVM | 92.33 | — | — | — | 83.33 | 85.71 | 44.44 | 100 | — |
| SIFT with RF | 90.17 | — | — | — | 71.42 | 85.71 | 55.55 | 100 | — | |
| SIFT with XGB | 93.68 | — | — | — | 83.33 | 85.71 | 55.55 | 100 | — |
SVM takes less time as compared to RF. Computational efficiency of SVM is better than RF, but precision, recall, and f1 score is better for RF.
Table V depicts the accuracy comparison by different researchers. As per our knowledge, work done by the researchers is focused on blood vessel detection and tortuosity and limited work has been reported on the classification of stages based on the severity of the disease. Prabakar et al. [11] used the histogram approach using limited dataset for classification, and no performance metrics were discussed in the results. Rebecca Rollins et al. [56] classified the images into three categories No ROP (NR), ROP not requiring treatment (RNT), and ROP which required treatment (RT). Priya Rani et al. [24] and Yinsheng Zhang et al. [37] discussed the disease as normal and ROP. Worrall et al. [57], Junjie Hu et al. [39], and Y.P Huang [43] reported the disease as normal, mild, and severe. The geometric features like area and diameter were extracted using Hessian analysis for the study of normal, stage 2, and stage 3 by Vijayalakshmi et al. [12]. The convolutional neural network was adopted to classify positive and negative samples by Xin Guo et al. [42]. Deep fusion feature [58] approach has been used to classify different stages. Even though the cost prohibitive concern has been resolved by MII RetCam, made in India [52], early diagnosis remains the challenge due to unavailability of automation and less number of pediatric retina ophthalmologists. So the research can be carried out for the ease and automation required for ROP stage diagnosis. The ability to image entire retina and representation of 3D to 2D would help overcome the limitations in the ROP research [51]. The evolution of Zone II features was analyzed and found that there was gradual decrease in the risk with time and responded well to the treatment [17]. The identification of Zone I is subjective and inaccurate, so Deep Neural Networks (DNN) algorithm was developed [16]. The implications of retinal lesions are also important in the diagnosis and might overcome the inaccuracies and vison loss [19].
Our paper not only focuses on normal and ROP disease but also on the classification of stage 1, stage 2, stage 3, and stage 4 on the basis of severity if ROP is present. Our proposed work has fourfold advantage. First, we are able to classify whether ROP is present or absent. Second if ROP is present, we could classify the stages of ROP on the basis of severity like stage 1, stage 2, stage 3, and stage 4 along with normal and ROP. Another advantage of the proposed approach is that it is robust to intensity variation due to the SIFT feature. Fourth advantage is computational complexity which is less compared to other methods. Stage 4 outperforms as compared to other stages. Stage 3 results can be improved further.
Here are the few limitations. The ROP being challenging disease and limited dataset is the hindrance in ROP research system. As the availability of dataset is less, so do the images to be trained and validated. Second limitation is the different scale, viewpoint, rotation, illumination, and orientation of the images. Another limitation is the low-quality images. The proposed method demands special hardware such as high-speed computer or GPU.
VII.CONCLUSION
This research proposed a simple and efficient framework for unique ROP staging based on SIFT and three separate machine learning classifiers. In comparison to previous state-of-the-art classification approaches, the suggested method employed SIFT features which focused on lesion-related regions of ROP and effectively increase ROP staging accuracy and model generalization capacity. The results revealed that classification may considerably increase ROP staging performance and classification accuracy. Our technique tended to misclassify misclassified samples into the adjacent next severe stage of ROP image classification, which was consistent with clinical staging standards for ambiguous samples. Our suggested approach obtained an accuracy of 93.68%, which is comparable to other quantitative metrics. However, when compared to existing classification systems, our proposed method has higher recognition accuracy for stages 1, 2, and 4. The stage 3 performance was quite low when compared to the other stages’ performances. In our study, 55% of ROP fundus images with stage 3 were correctly recognized, whereas the other 45% were all incorrectly classified as stage 2 and 4. There are two basic causes behind this: (1) scarcity of ROP data in the training phase. Although we have lessen the influence of imbalance categories by altering the weight of the loss function and employing learning, we still cannot effectively fix the problem caused by data imbalance. (2) Extraretinal fibrovascular growth or neovascularization spreads from the ridge into the vitreous is the clinical criterion for stage 3 ROP. However, ridge identification was difficult to detect in some ROP fundus images for both clinical labeling and computerized ROP staging. As a result, learning the small distinctions between them were challenging for the depth network, resulting in prediction mistakes. Despite the fact that there were few ROP data from stage 4 in the training process, ROP detection accuracy in stage 4 was quiet high. In terms of our test data, the suggested technique successfully predicts all ROP fundus images in stage 4. One probable reason is that the retina in stage 4 has a retinal detachment, which is seen in the fundus imaging. As a result, our depth network can precisely learn its effective characteristics.