I.INTRODUCTION
Recent studies summarized that breast cancer is one of the most prevalent forms of cancer, among women worldwide. From the knowledge of the cancer mortality survey, this disease is the leading cause of death with 5,24,000 deaths and 2.4 million new cases per year [1]. Early diagnosis and accurate medical treatment play an important role to minimize the mortality rate. Generally, inevitable mutations of breast cells result in the development of a mass called tumor or cyst. These tumors are usually categorized into two classes; carcinoma namely malignant and non-carcinoma namely benign [2]. Few blossoming methods for purpose of screening and diagnosis of tumors are magnetic resonance imaging [MRI], mammography, and histopathology [3]. Despite all other approaches, cancer detection from histopathology is the gold standard. Generally, pathologists examine the cell shapes, tissue structure, and density to define malignancy degree and cancerous locality, by analyzing a narrow slice of biopsy sample with a microscope. This manual analysis needs enormous domain knowledge; also, it is an error-prone and time-taking process [4–6]. By using whole-slide digital scanners, histological slides of the suspected tissues can be computerized and preserved in form of a digital image. Digitalization figures out other advantages such as better visualization, quick storage, and analysis of images that in turn lead to automatic image analysis methods [7]. In recent years, the use of deep learning in conjunction with image processing techniques has grown quickly. To address challenges like identifying specific areas of infected organs, defending the classification of tumors, corresponding treatment, and disease stage, deep learning-based algorithms are particularly adaptive. Particularly, deep learning techniques based on convolutional neural networks (CNNs) have made room for integrating CAD methodologies with image processing jobs [8]. In the case of medical data analytics, AI and ML techniques are frequently for speech-based COVID-19 detection from speech signals [9,10].
The use of deep learning in conjunction with image processing techniques has grown quickly. To address challenges like identifying specific areas of infected organs, defending the classification of tumors, corresponding treatment, and disease stage, deep learning-based algorithms are particularly adaptive. Particularly, deep learning techniques based on CNNs have made room for integrating CAD methodologies with image processing jobs [11–14]. The origin of the aforementioned methods directed the path to researchers in developing CAD models assisted by CNN for several medical applications such as breast cancer, skin cancer, lung cancer, brain cancer, and liver cancer [15]. In contradiction with hand-crafted methods, CNNs have the ability to learn features from the given medical images. Ting et al. [16] developed a CAD system by cascading pre-trained networks and obtained an accuracy of around 90.5%. Xu et al. [17] performed feature extraction by using fine-tuned CNN for image classification regarding colon cancer and brain tumor. However, there is a lot of space provided for the development of pre-trained networks in the context of breast cancer histopathological images. As the task of breast histological images is much complicated, recent studies started using pre-trained networks such as AlexNet, VGG-16, and VGG-19. For the problem of classification, these pre-trained networks are accompanied by other classifiers like logistic regression, KNN (K-Nearest Neighbor), SVM (Support Vector Machine), and decision trees.
Although the fast interventions of CNN models are increasing day by day, in point of the accuracy of the proposed CNN model, the hyper-parameters have a great impact on the performance. Selecting feasible hyper-parameters can be considered as an important step during the training of the CNN model. Hence, it is required to undergo optimization of CNN’s hyper-parameters to achieve good performance and success rate. For the process of optimizing the CNN model, bio-inspired algorithms can be used to produce desired optimal hyper-parameters. Particle Swarm Optimization (PSO) [18], Artificial Bee Colony, Gray wolf optimization, and Ant Colony Optimization are some of the familiar algorithms used for optimizing deep learning models [18–21].
In this study, we introduce a novel method of CNN for breast image classification. Since training the CNN model from scratch is a time-taking process, we use the concept of transfer learning. Transfer learning by using VGG-16 with logistic regression as a binary classifier is the major part of the proposed classification method. In this way, this study decreases time complexity for training the entire network and makes it more reliable. This developed model is further optimized by using the PSO algorithm. The desired classification model produces better results and also avoids the over-fitting problem. The major contributions of this study are listed below
- •Optimizing hyper-parameters of CNN using PSO algorithm
- •An optimized CNN architecture to classify breast histopathological images
- •Comparison of the proposed model with existing CNN models used for breast image classification.
The remainder of this paper is organized as follows. Related works are discussed in section II. Section III denotes the preliminary concepts, and the proposed methodology is explained in section IV. Section V illustrates the dataset. Performance metrics and results are described in section VI. In last, we conclude our study in section VII.
II.RELATED WORKS
For the last four decades, CAD systems for cancer detection have been the developing field of research with its intrinsic complexities of histopathological images, but it is yet a tedious task. Considering the classification of histopathological images into malignant and benign subtypes, many techniques have been developed in the leaflet of medical image classification. The classification of histological images has been reviewed precisely with their relevant works of research in this section.
In recent years, deep learning methodologies have been widely used in the classification of images. Even they are applied in various fields that include image recognition, drug discovery, automatic speech recognition, and bioinformatics [22,23]. The profound AlexNet CNN [24] was developed in the year 2012, which has shown admirable results in an application with a dataset named ImageNet. This success invited deep learning-relied approaches that used CNN to develop a path of attractive performance. Thus it extended its root, even to the area of medical tasks [25].
Spanhol et al. [26] investigated the pre-trained LeNet model that relies on a deep learning framework for the classification of breast cancer. The classification accuracy was 72%, in this method. In addition, they used a modified AlexNet model that includes two fully connected and three convolutional layers to train the network. This lead to the improved classification accuracy of 80.8%.
Wei et al. [27] developed an enhanced CNN architecture that inspects individual image labels as former knowledge as well as information of subclasses of the images. The authors reported that resultant CNN can provide improved binary classification in learning features. Rao et al. [28] have proposed a modified CNN that includes a fully connected layer, convolutional layer, and pooling layer. For the task of BreakHis Image classification, several hyper-parameters were examined to figure out the most appropriate framework. This study reported that binary image classification accuracy of 90%.
Simonyan et al. [29] proposed the architecture of VGG which lead to a new era of CNN methods. In a recent study, several architectures based on VGG lead to excellent results in the analysis of histopathological images [30,31]. Various cancer classification methods such as skin cancer [32], colorectal cancer [33,34], and breast cancer [29] have made use of VGG-19. In addition, fundus image classification has taken the opportunity to use the singular value decomposition along with principal component analysis complemented VGG-19 [35].
A magnification independent method was developed by Bayramoglu et al. [36] that has dual CNN architectures namely multi-task CNN and single-task CNN. Malignancy of the image and magnification factor was evaluated by multi-task CNN, whereas malignancy was evaluated by a single-task CNN model. The range of accuracies that used multi-task CNN methodology was between 80.6% and 83.3%; further, the range of accuracies that used single-task CNN methodology was between 82.1% and 83.0%.
Hamindineko et al. [37] developed a Nottingham grading system that classifies the image samples into three subclasses. Zhang et al. [38] investigated a class Kernel principal component analysis (KPCA) for feature extraction. Further, a KCPA method is trained on the individual feature that is extracted. The same procedure is repeated for every image in the provided dataset; thus eventually, the pre-trained KPCA architecture has the ability to make the decisions. This study reported the accuracy of binary classification as 92%.
Sudarshan et al. [39] have proposed a novel approach for the analysis of histopathological images known as multiple instance learning (MIL). This study uses two different types of scenarios such as Patient as a bag and Image as a bag. The authors in this study examined several methods of MIL namely algorithms based on Diversity density, Seminal axis Parallel rectangular method, SVM, K-Nearest Neighbor, CNN, and non-parametric algorithm. Their study claimed the accuracies of binary image classification ranging from 83.4% to 92.1%.
Like other neural networks, even DL-based models suffer from the issues such as multiple local optima, lack of hyper-parameter tuning, and increased time complexity. To overcome the above problems, optimizing hyper-parameters and the preferred NN architecture has become a challenging task. The evolutionary algorithms are widely used in regular optimization problems in the area of medical diagnosis that cover the selection of cancer pathway genes [40], estimating ultrasonic echo [41], DNA microarray’s classification [42], reducing bioinformatics data dimensionality [43], localization of retinal blood vessels [44], and detection of diabetes disease [45]. The aforementioned algorithms have been not frequently utilized in optimizing outputs of feature extraction, segmentation, and classification of CNN. Henceforth, our work interrogates to enforce hybridization of the proposed CNN architecture that classifies breast histopathological images with help of evolutionary algorithms.
To optimize the hyper-parameters and kernel, Rubio et al. [46] proposed a novel method that uses an evolutionary approach. In addition, FABOLAS [47], which was Bayesian optimization-based method, was designed for hyper-parameter selection in architectures of SVM and CNN. Stoean et al. [48] proposed a newly designed method that fine tunes the convolutional layers by taking the advantage of evolutionary algorithms. To optimize the hyper-parameters of the LSTM model, Riegler et al. [49] proposed a structure that makes use of RS, GS, and BAO approaches.
Senthilpandi & Mahadevan [50] used CNN for brain tumor detection and diagnosis. Renith & Senthilselvi [51] improved the performance of diabetic retinopathy detection using deep learning network. Mohammed Thaha et al. [52] proposed extended CNN for brain tumor detection and segmentation. Deep learning network plays vital role in all area of research such as food adulteration [53], noise removal [54], mobile phone recycling process [55], and sign language understanding [56]. The optimization algorithm provides an optimized solution in all area of researches such as noise removal [57,58], micro-grid protection [59], food adulteration [60], etc.
From the above discussion, it is clear that the average accuracy of the machine learning-based models is not up to the mark in all the datasets. Additionally, the hyper-parameters are selected manually, and no optimization techniques are applied. Bio-inspired techniques have been used in the applications of signal processing more specifically speech processing for selecting the best parameters. This problem has been taken in this paper to perform hyper-parameter optimization regarding CNN that may produce excellent results in the field of medical diagnosis. As the throughput of CNN is directly related to efficient disease classification, in this study we carry our work to improvise the performance of CNN by optimizing it with help of bio-inspired algorithm; thus, our study will be used to expertise performance of CNN used for breast histopathological images.
III.PRELIMINARIES
In this section, we explore the background concepts used for our proposed model. We clearly explain the basic CNN model, basic idea behind transfer learning, and standard form of PSO algorithm.
A.CNN
In a recent study, CNNs achieved enormous adoration in the leaflet of deep learning [61,62]. CNNs are a special variant of ANNs that are designed to handle a large amount of multi-dimensional data. The primary elements of CNN are as follows: convolutional layer, fully connected, and pooling layer [63].
The images are considered as input to the convolutional layer that further produces a corresponding feature map. The major parameters of this layer are the number of filters, filter width, and stride [64]. The * symbol defines the convolutional operation. The feature map x(t) is obtained with given input I(t) when applied with the filter K(a). The following eq. 1 represents the resultant matrix after the convolution operator is applied on the input feature map. The below Fig. 1 clearly exhibits the convolutional operation more precisely.
The most common activation function that is used for CNNs is rectified linear unit (RELU) that turns the input values, which are in negative form to zero. The below equation represents the RELU activation function in mathematical form, where x is the input to the neuron. Even other activation functions, like sigmoid, leaky RELU, tanh, etc.., can be used depending on the designed architecture of CNN. The primary motive of the pooling layer is dimensionality reduction of the given input image. This layer is infused in between RELU and convolutional layers and has complete authority on spatial invariance. Based on the requirement of the CNN model, max-pooling or average pooling operation is performed at this layer. Figure 2 clearly illustrates the max-pooling. As learnable parameters are not present in the pooling layer, it is often referred to as a component of the convolutional layer. Fig. 1. Convolution operation in CNN.
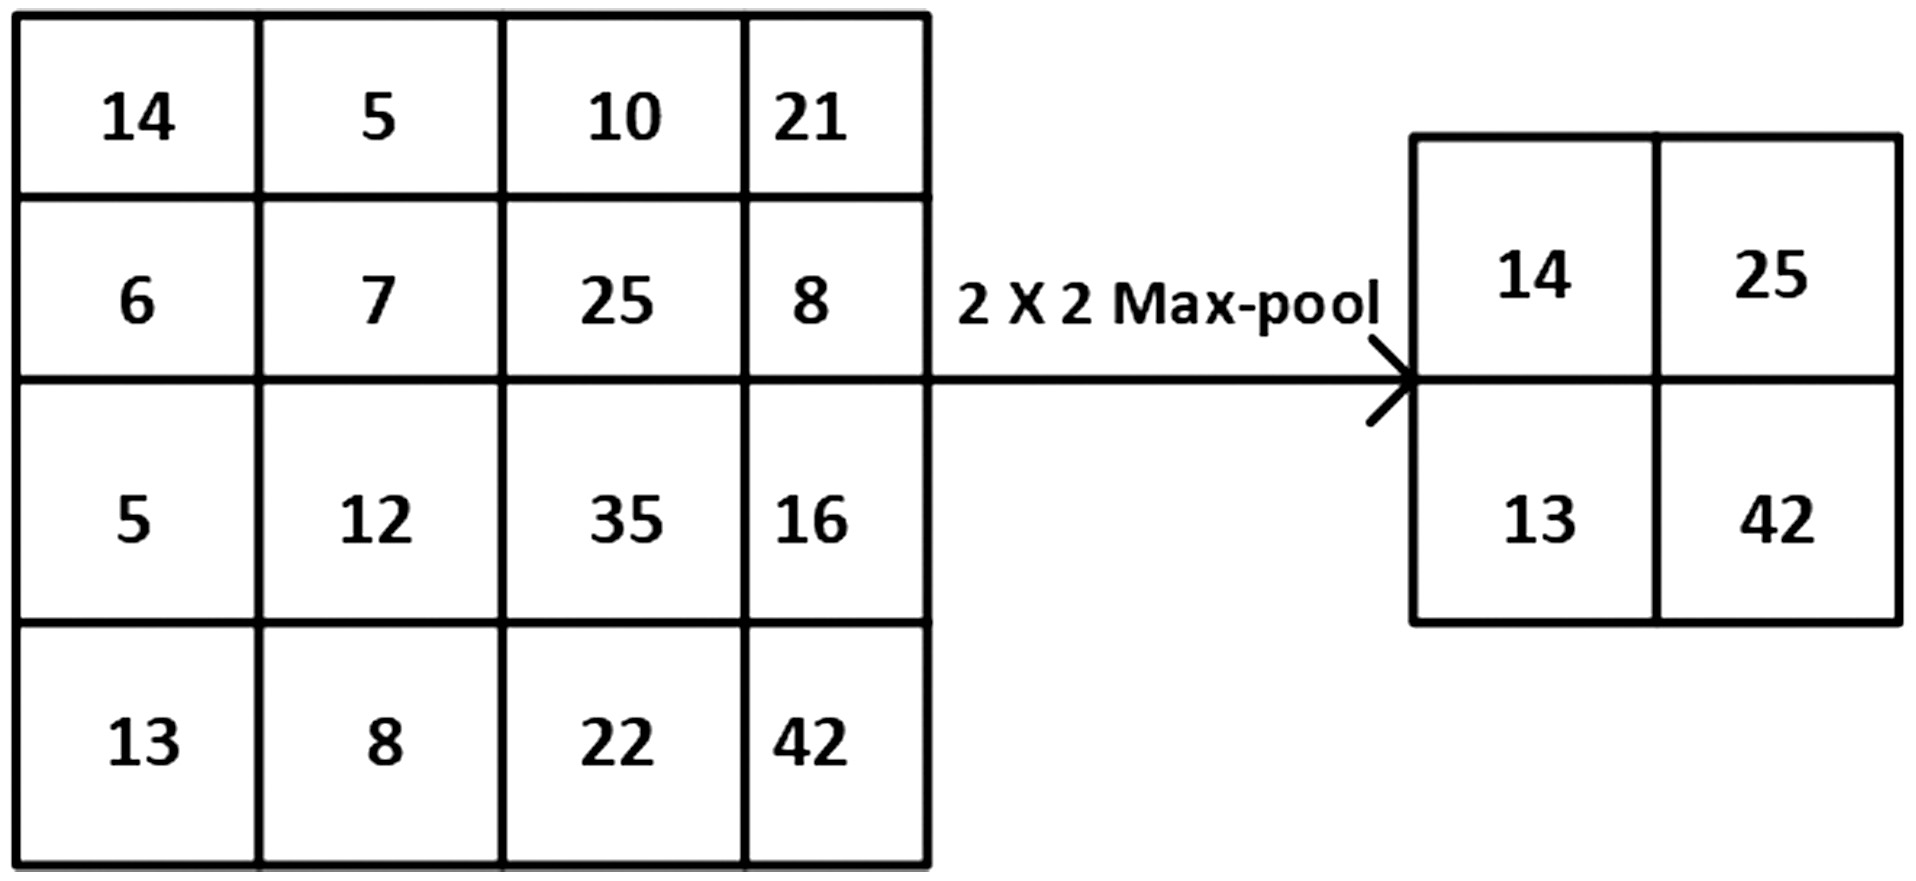 Fig. 2. Max pooling operation in CNN.
The fully connected layer is located beside the pooling layer and designed in such a way that all neurons in the previous layer are connected to all neurons in the FC layer. The final output is determined by the Loss function associated with the FC layer, which helps in identifying the actual and the predicted labels. Softmax is a highly recommended loss function for most CNN models.
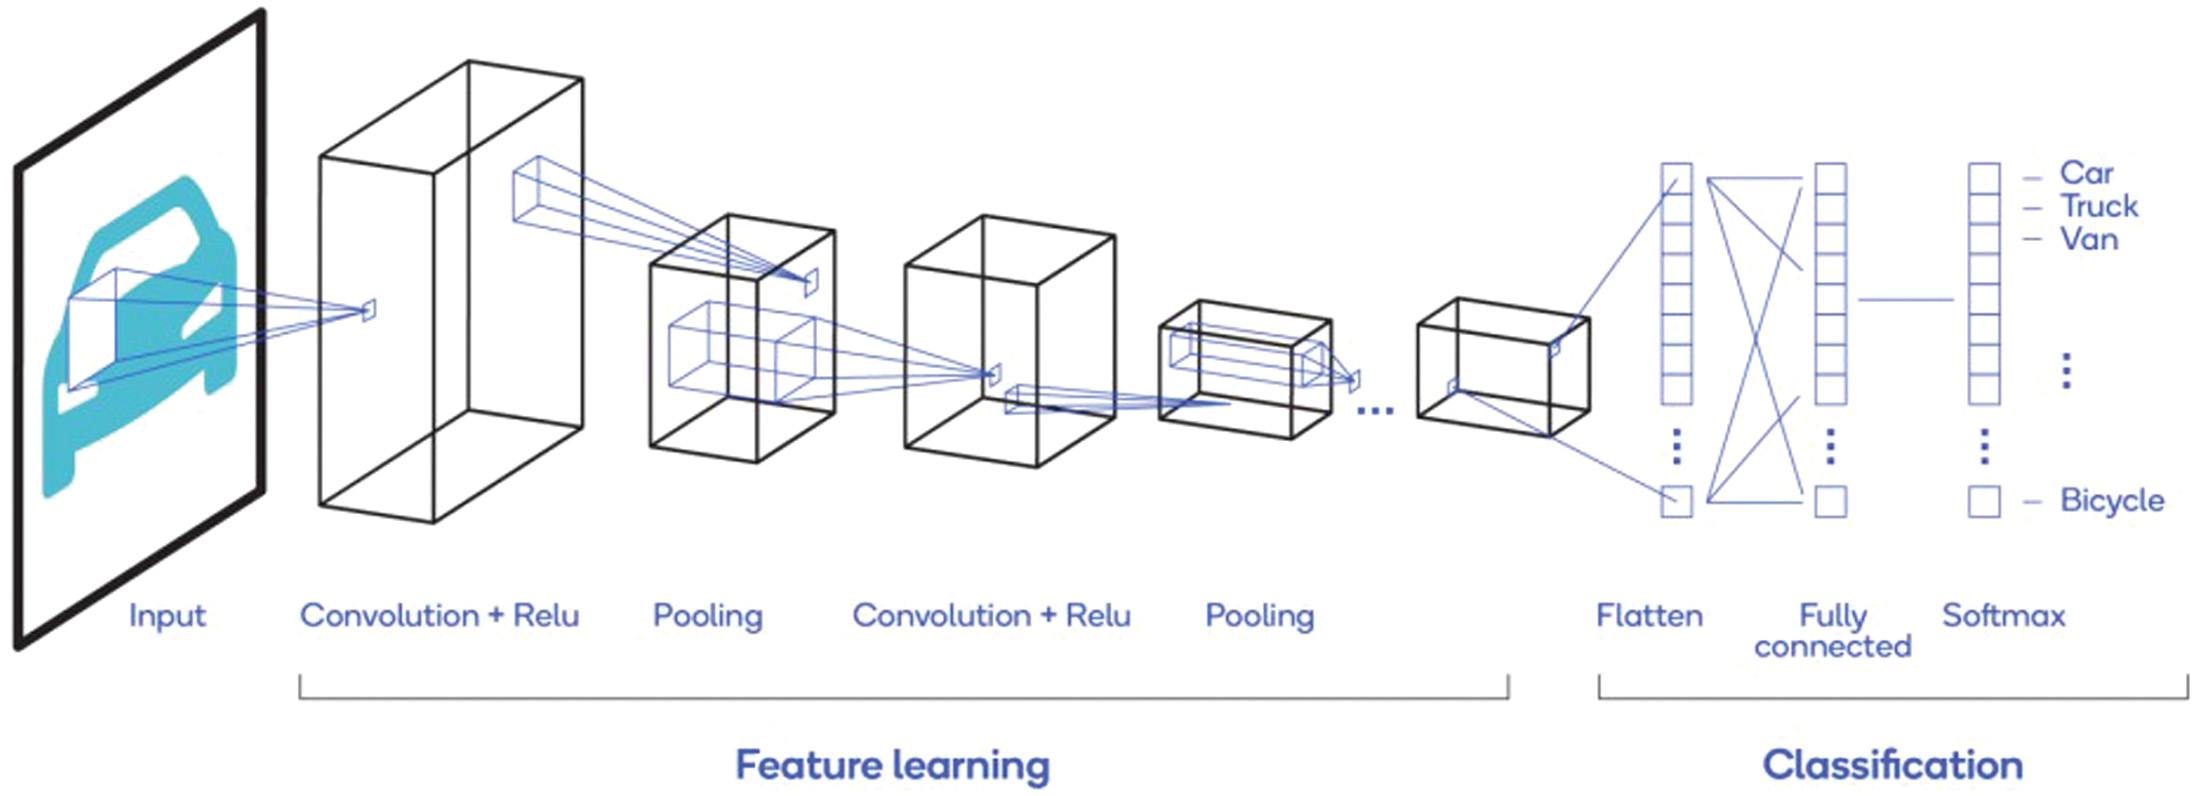
The problem of over-fitting is resolved by regularization methods. Two prominent regularization methods are Drop-connect and Drop-out [65]. Figure 3 demonstrates a CNN model that holds the fundamental components [66]. VGg-16 [29], ResNet [67], AlexNet [13], and GoogleNet [68] are most considerable variants of CNN models when compared to other architectures. The basic hyper-parameters of CNN are learning rate, mini-batch size, regularization parameter, maximum epochs, momentum, and shuffle type.
B.TRANSFER LEARNING USING VGG-16
The provided datasets are small to make the network learnable and produce more efficient results of accuracy. The solution to overcome this issue is achieved with the help of transfer learning. The process of dumping the information from the precedent source to the target is known as transfer learning [69–71].
The steps involved in the process of transfer learning are very simple and easy to implement them for any application. Initially, the pre-trained model of ConvNet is loaded. This model is further classified into the following categories. The first class incorporates layers for minimum standards of learning such as edge, shape, and color, whereas the high-level standards of learning are included in the second class. Considering class 1, some particular layers are merged with it and applied for general problems like cancer classification. The resultant model is used to train the available training dataset. In the next step, the pre-trained network model is applied to test data. Finally, accuracy is calculated by the task of transfer learning. The architectural flow diagram of transfer learning is denoted in below Fig. 4 [72].
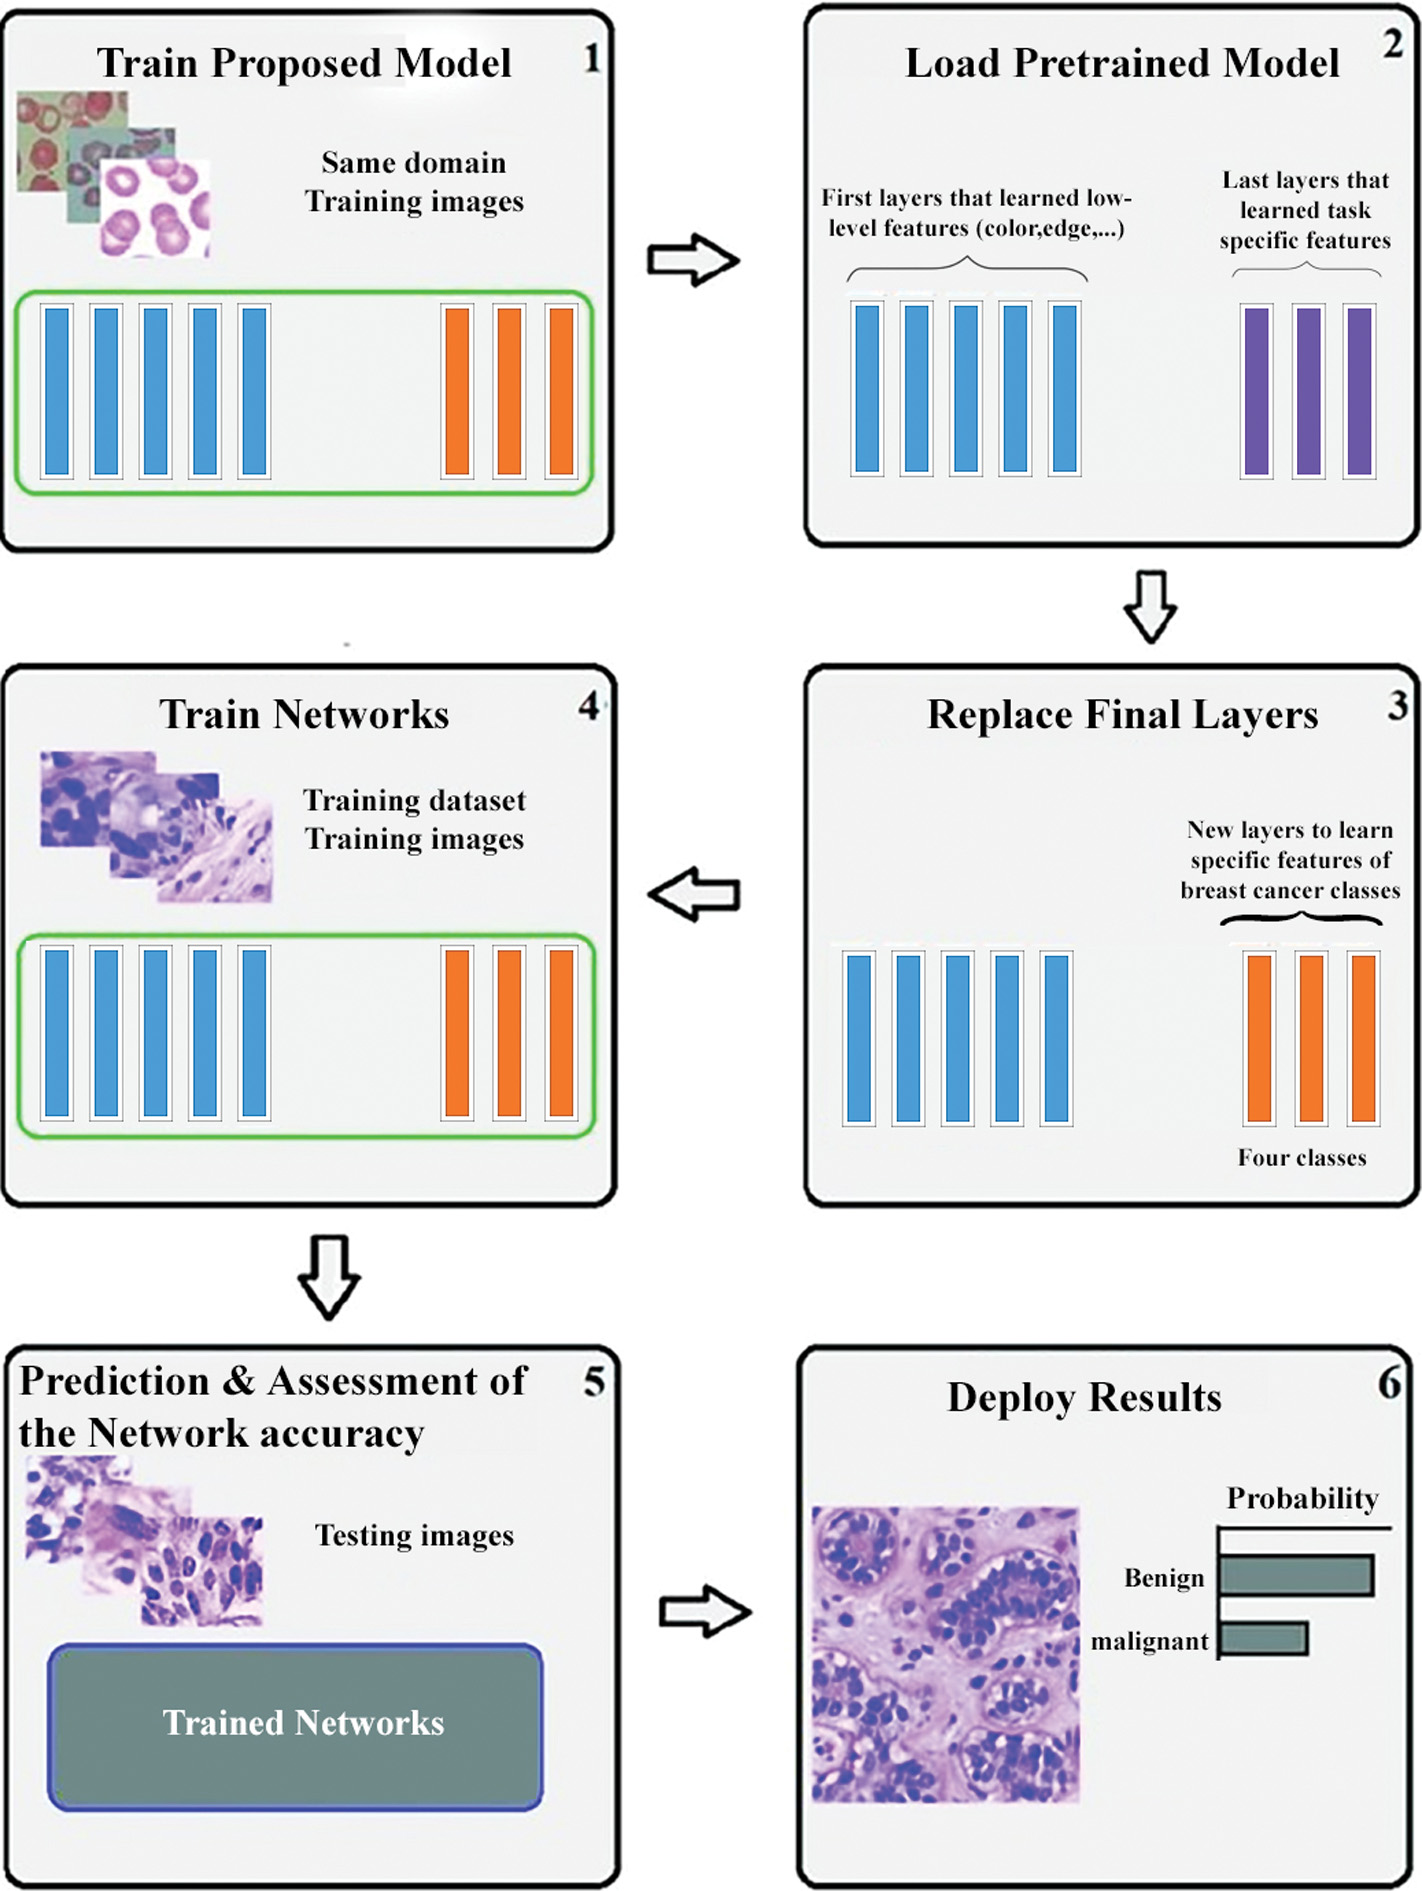 Fig. 4. Transfer learning pipeline.
VGG-16 is a pre-trained network model proposed by simonyan et al. [29]. This model achieved 92.7% classification accuracy for the ImageNet dataset.VGG-16 can be used for the tasks of pattern detection and image recognition. The terminology 16 indicates that it holds 16 learnable layers. In our study, the BreakHis dataset with a 7909 image sample is the target that is lesser when compared to the Source dataset ImageNet.
C.PSO
In 1995, Kennedy and Beernaert proposed a novel evolutionary algorithm, namely PSO [73]. The cognitive and social behavior of the swarms is the motivation of this algorithm. This method is influenced by the flying of the herd of birds. According to the terminologies of PSO, a particle is defined as an individual solution, and a swarm is a collection of total solutions. Generally, PSO is associated with a particle that includes velocity and position [74], as explained in Fig. 5. Considering the present position and velocity of the particle, the next position of the particle is updated.
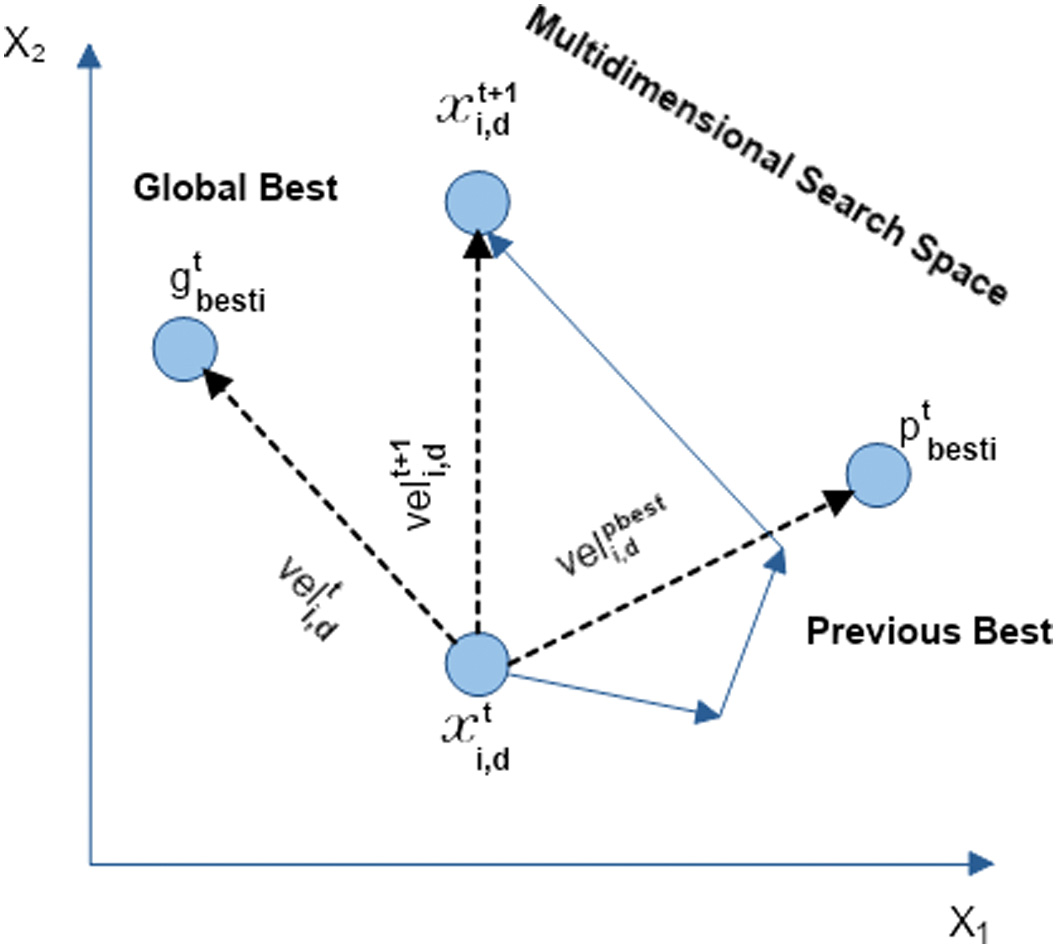 Fig. 5. Parameter updation in PSO.
In this optimization algorithm, all particles recollect and utilize their past best position (pbesti) and the global best (gbesti) in the swarm. Using the below equations, the position and velocity of the particles are updated.
In the above equations, xi,d, and Veli,d represent the position and velocity of the particles, ith particle’s best position is given by pbesti, whereas gbesti represents the current best position of the particle, where d denotes the D dimensional space. The terms c1 and c2 are considered as learning factors that represent the social behavior of the swarms. The parameters r1 and r2 are the randomly generated integers that range between 0 and 1. The major advantage of PSO is that its convergence rate is higher than Genetic Algorithms [75]. This characteristic of PSO helps in finding optimal CNN models.IV.THE PROPOSED METHOD
In this section, we discuss the proposed working procedure of the developed model and also clearly demonstrate the correlation between PSO & CNN.
A.WORKFLOW
The recent pieces of literature have determined that the CNN model shows promising results in the problems of medical image classification. We employ a novel approach for building the CNN model by the task of transfer learning. Using pre-trained networks for transfer learning tasks is a simple methodology. Adjusting the accurate set of hyper-parameters is a challenging task since dynamic relation holds among the parameters. The process of selecting hyper-parameters could be solved by considering it as an optimization problem. For this, robust optimization algorithms that find the global optimum solutions are necessary for selecting hyper-parameters, as they consequently affect the entire performance of the CNN model.
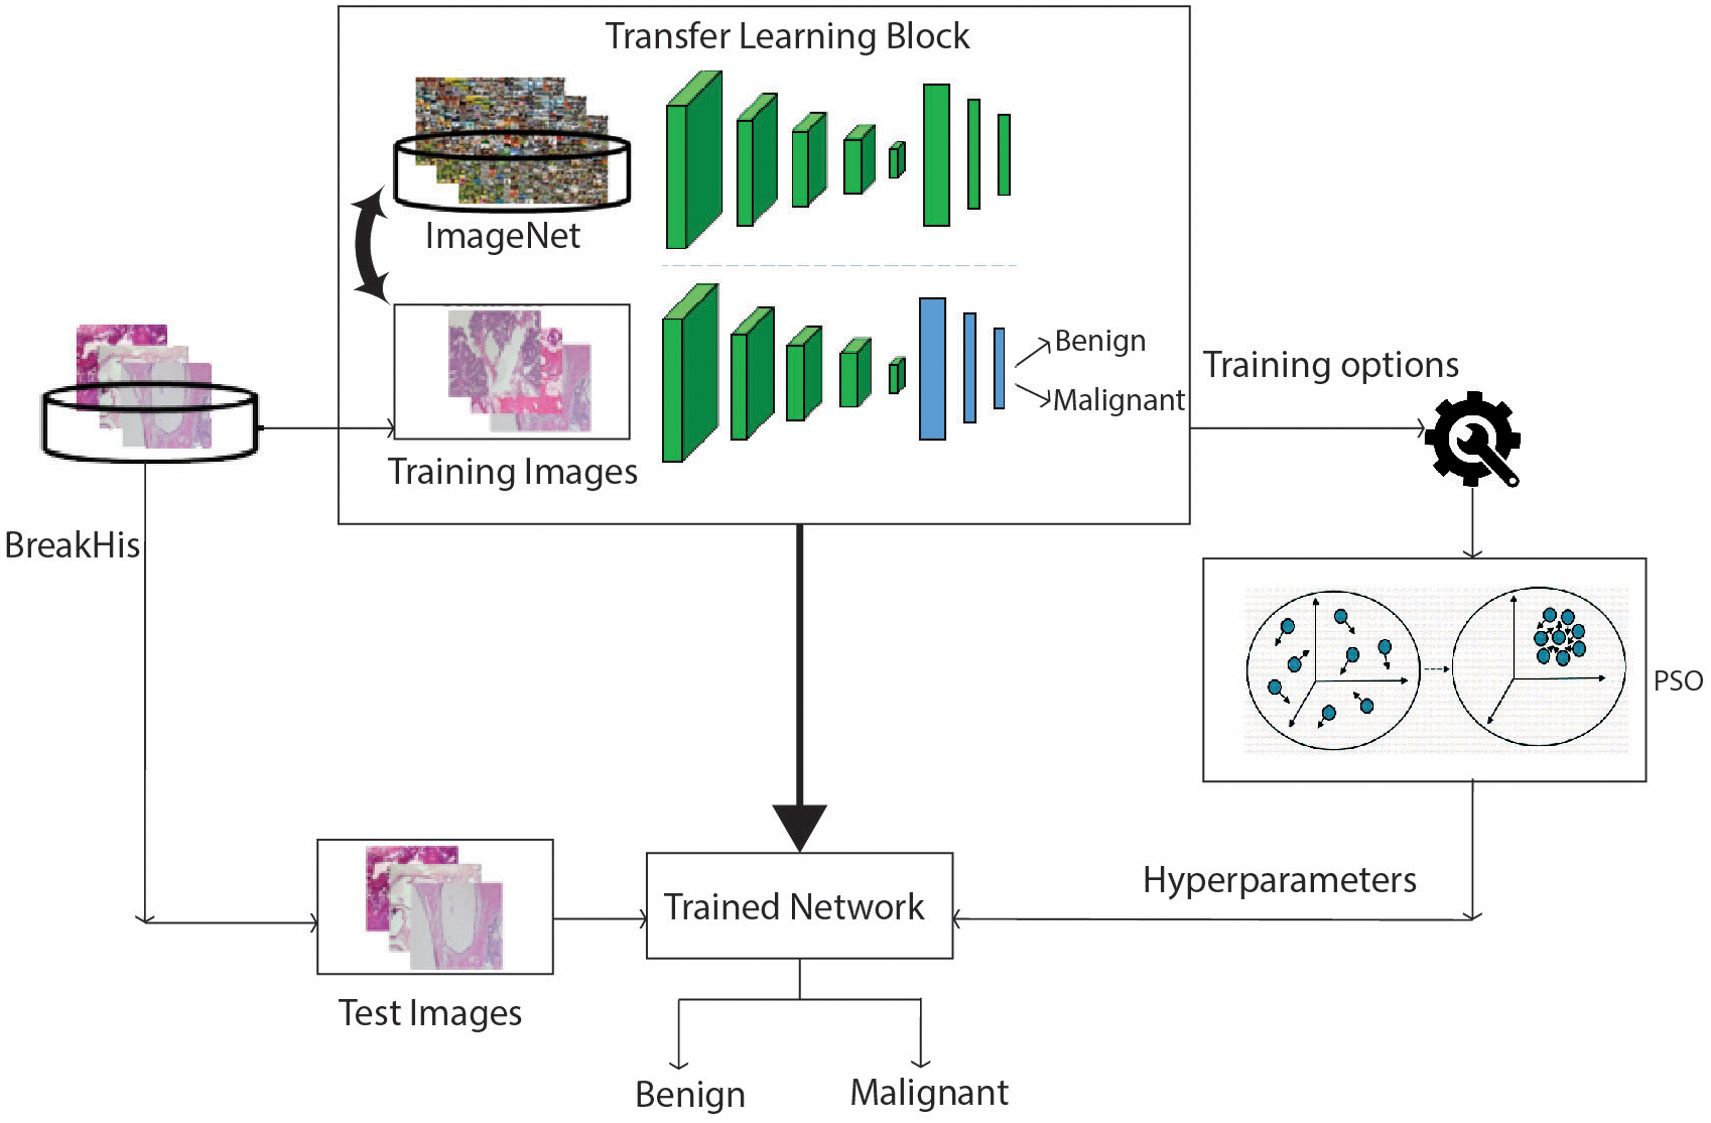
The important steps of the proposed method are listed in algorithm 2. The familiar BreakHis dataset of breast histopathological images is loaded as the primary step of this algorithm. Further, the data are split into training set and test set. The training dataset is then divided into trainopt and testopt datasets. In the next step, the pre-trained network VGG-16 model is loaded for the task of transfer learning. These new datasets along with the basic model are considered as input parameters for the PSO algorithm. In the training process of the proposed CNN model, the optimized hyper-parameter values obtained from the algorithm are used as parameters of the training. The loss function can be used to evaluate the fitness of the given algorithm. Equation 3 represents the mathematical expression of the loss function.
In the above expression, N is the number of classifications categorized, pij is the prediction probability that sample i belongs to category j and yij is the integer 0 or 1 (0 if i and j belongs to the same class, else 1).The workflow of the proposed methodology is described in the following Fig. 6. Once the termination criteria are satisfied, the algorithm returns the best solution that is optimal values for hyper-parameters. Then, new training is performed with the resultant optimal hyper-parameter values with the initial training dataset loaded on the VGG-16 model. Further, the test dataset is used to calculate the overall performance of the proposed method.
B.MAPPING PSO & CNN
In this study, we apply PSO for parameters of CNN to derive optimal hyper-parameters, so it is necessary to understand how we correlate our neural architecture with the evolutionary algorithm. Every vector X of the given particle P denotes a CNN, and dimensions residing in vector X denote hyper-parameters of the proposed CNN model. Variables of vector X, x1, x2…x15, correspond to hyper-parameters of CNN. Table I lists out the relation between variables and hyper-parameters, with their distinct purpose.
Table I. Particles in PSO mapped to CNN
| Variable | Hyper-parameter mapped in CNN |
|---|---|
| x1 | Number of filters in the first layer of convolution |
| x2 | Filter size of convolutional layer-1 |
| x3 | Activation function used in convolutional layer-1 |
| x4 | Type of pooling layer-1 |
| x5 | Number of filters in the second layer of convolution |
| x6 | Filter size of convolutional layer-2 |
| x7 | Activation function used in convolutional layer-2 |
| x8 | Type of pooling layer-2 |
| x9 | Number of neurons in FC layer-1 |
| x10 | Activation function used in FC layer-1 |
| x11 | Drop-out of FC layer-1 |
| x12 | Number of neurons in FC layer-2 |
| x13 | Activation function used in FC layer-2 |
| x14 | Drop-out of FC layer-2 |
| x15 | learning rate |
As we know that vector X is the representation of CNN’s hyper-parameters, hence every dimension of it has a unique meaning and also varying range. Initially, a few of them are denoted by integers, like the number of convolutional layers, number of FC layers, and number of neurons. Further, Kernel size, pooling type, and type of activation function are presented by discrete values. We may encode these discrete values with any integer, for instance in the context of activation functions, Tanh is denoted by 1, Sigmoid with 2, and so on. The remaining hyper-parameter such as learning rate and drop-out is considerably real numbers. From Table I, we clearly understand the particle encoding mechanism for different dimensions. To update the velocity and position, we use Eq. (3) and Eq. (3). Additionally, we decode them with hyper-parameters of CNN to get the required results.Algorithm 1: The proposed optimized CNN algorithm for breast histopathology image classification
| Input : Breasttraining : training set of BreakHis dataset |
| Breasttest : testing set of BreakHis dataset |
| Output: Classification of BC images |
| Step 1: Load Breasttrainig and further split it into TrainBC and ValidationBC |
| Step 2: Load the VGG-16 model |
| Step 3: Send TrainBC and ValidationBC and pre-trained VGG-16 model to the algorithm 2 as functional parameters. |
| Step 4: Initialize vectors of hyper-parameters. |
| Step 5: Get optimized hyper-parameter values of VGG-16 obtained by algorithm 2. |
| Step 6: Embed the resultant optimized parameters as Hyperopt into the pre-trained VGG-16 model. |
| Step 7: Train the network with Breasttraining |
| Step 8: Evaluate the performance of the network using Breasttest. |
| Input: tm : maximum number of iterations |
| TrainBC : training set |
| ValidationBC: validation set |
| Ns: swarm size |
| Output: optimal hyper-parameters |
| Step 1: Initialize the parameter set of PSO algorithm. |
| Step 2: Randomly generate an initial population xi using Table |
| Step 3: for i=0 to Ns |
| calculate fitness(xi) using Equation |
| pbesti = xi // Particle best position |
| gbesti = pbesti // swarm best position |
| end for |
| Step 4: for t = 1 to tm |
| for i = 1 to Ns |
| update velocity of the particle Veli using eq. ( |
| update position of the particle using eq. ( |
| if fitness(xi) < fitness (pbesti) then |
| update best position of particle : pbesti = xi |
| endif |
| if fitness(pbesti) < fitness(gbesti) |
| update best position of swarm : gbesti = pbesti |
| end if |
| end for |
| end for |
Table II. BreakHis dataset image distribution
| Class | ||
|---|---|---|
| Magnification factor | Benign | malignant |
| 40× | 625 | 1370 |
| 100× | 644 | 1437 |
| 200× | 223 | 1390 |
| 400× | 588 | 1232 |
V.DATASETS
A.BreakHis DATASET
The proposed method is employed on the publicly available dataset, namely BreakHis to evaluate the performance of the model. This dataset comprises 7909 breast histopathological images which are collected from 82 patients. In this, 2480 images are from the class of benign, whereas 5429 images are from the class of malignant. These acquisition of breast images are with four types of magnification factors such as 40X, 100X, and 200X. These samples are collected from breast biopsies and then performed H&E staining [76]. The original images of this dataset are the 3-channel RGB images of the pixel size 700 × 480. The samples of breast histopathology images with different magnification factors are visualized in Fig. 7. Statistical data of the dataset are briefly listed in Table II, which includes the number of images classified according to the cancer class and also with different factors of magnification. Out of these samples, benign data were collected from 24 patients and malignant samples were taken from 58 patients. The web link for accessing the dataset used in this study is as follows which is used in various works: https://web.inf.ufpr.br/vri/databases/breast-cancer-histopathological-database-breakhis/.
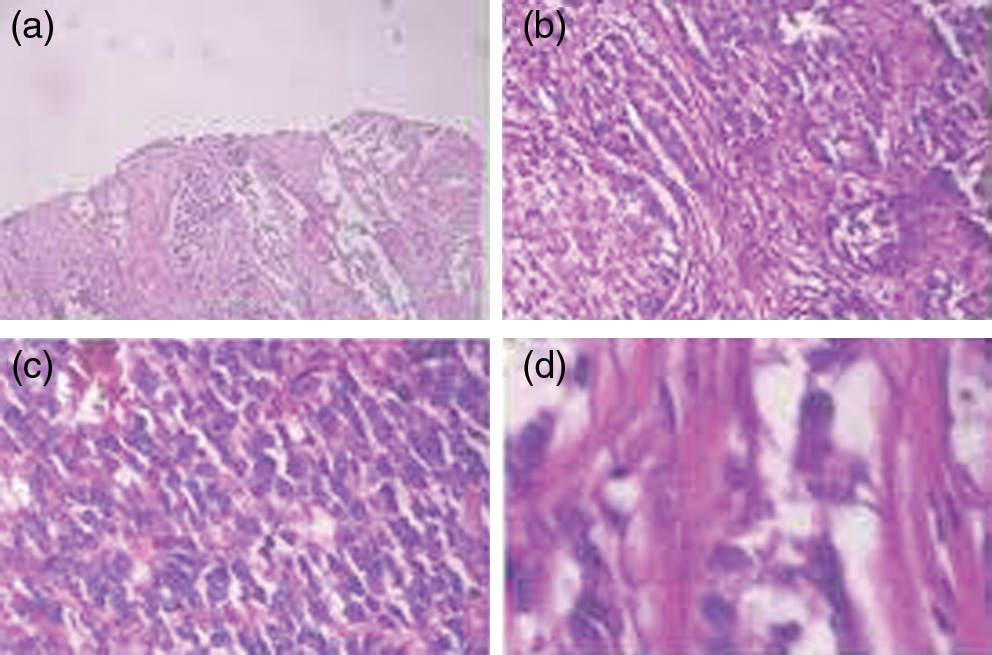 Fig. 7. Breast histopathological images from BreaKHis dataset with magnification factors 40×, 100×, 200×, and 400×.
B.DATA AUGMENTATION
The throughput of the CNN models is highly reliable on the size of the dataset to be trained. Hence, the augmentation of the provided data could be considered as a major step in improving the cardinality of the dataset [77,78]. Each image of the training dataset is initially resized to images of size 224 × 224. The Augmentor python library [79] performs the additional data augmentation methods that include rotating, flipping, and cropping methods. The following Fig. 8 demonstrates the resultant images of data augmentation. In the next step, all the images are transformed into matrix form and undergo normalization. On the other hand, the test set is loaded to the model, such that images are normalized with specific input size without any further change; that is, raw image will be input for the test dataset.
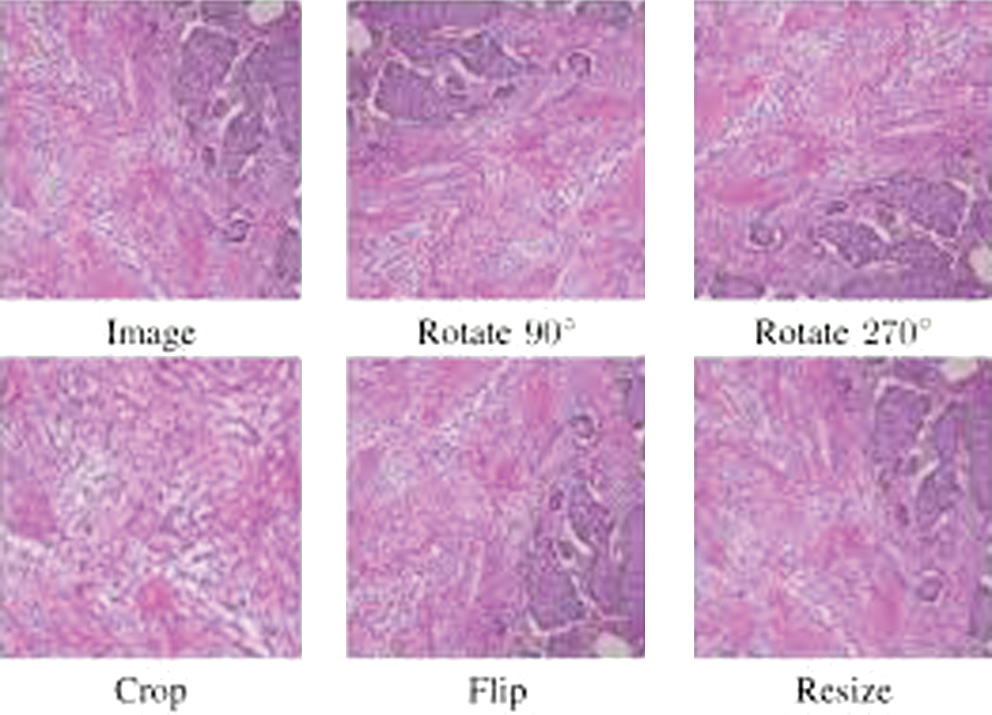 Fig. 8. BreakHis images after applying data augmentation techniques.
VI.EXPERIMENTS AND RESULTS
Experiments of the proposed model have been implemented on a system that has built-in NVIDIA GEFORCE GTX. The VGG-16 model pre-trained with ImageNet is performed by the Keras Deep Learning framework. The VGG-16 model with the last layers replaced and logistic regression is used to classify the histopathological images from the publicly available BreakHis dataset, and the proposed CNN model is optimized in the selection of hyper-parameters. Hyper-parameter optimization uses the particle swarm optimization algorithm. We split the training and test data in a ratio of 80∶20. The parameters of PSO algorithm used in this study are as follows: inertia weight w = 0.7298, population size and number of iteration are taken as 20 and acceleration coefficients c1 and c2 are considered as 1.496.
A.PERFORMANCE METRICS
For evaluating the performance of the proposed system, there are certain aspects that help in a good analysis of the proposed model in comparison with other existing methods. Accuracy is determined by the number of images that are correctly classified, divided by the total number of images. Equations 1, 2, 3, and 4 represent the mathematical expression of Accuracy, Precision, F1-Score, and Sensitivity.
In the above equations, true positive presents the number of images that are correctly classified as malignant, false-positive denotes the number of images that are miss-classified as malignant, true negative shows the number of images correctly classified as benign, and false-negative shows the number of images miss-classified as benign.B.RESULTS
In this study, we used a pre-trained CNN model along with optimized hyper-parameters to achieve the best performance of the model. We have experimented with the model with optimized hyper-parameters and classified whether the collected biopsy sample belongs to benign or malignant. We conducted our study in a magnification-dependent manner with 40×, 100×, 200×, and 400× as distinct magnification factors.VGG-16 model is used to classify the images, and the hyper-parameters of this model are obtained with the help of a bio-inspired algorithm namely PSO, during the training phase of the model. Further, to the resultant trained VGG-16 model, test images are provided as input, and also, the parameters of the model are previously optimized. Further, the proposed model performs feature extraction and undergoes image classification tasks, thus classifying them into respective cancer classes using fully connected layers and LR classifier.
The performance of the proposed optimized CNN model is illustrated with the confusion matrix as shown in Fig. 9. From Fig. 9, it is clear that there is several image classification that is correctly classified and miss-classified with different magnification factors. The confusion matrix presents 752 correctly classified images among 785 test images with 40× magnification factor, whereas images with 100× magnification factor 786 images are correctly classified out of 835 images. Also, 761 images were correctly classified among 790 test images with 200× magnification factor and 666 images were correctly classified from 730 test images with 400× magnification factor. Also, we retrieve the ROC curves as mentioned in Fig. 10 for the four types of magnification factors.
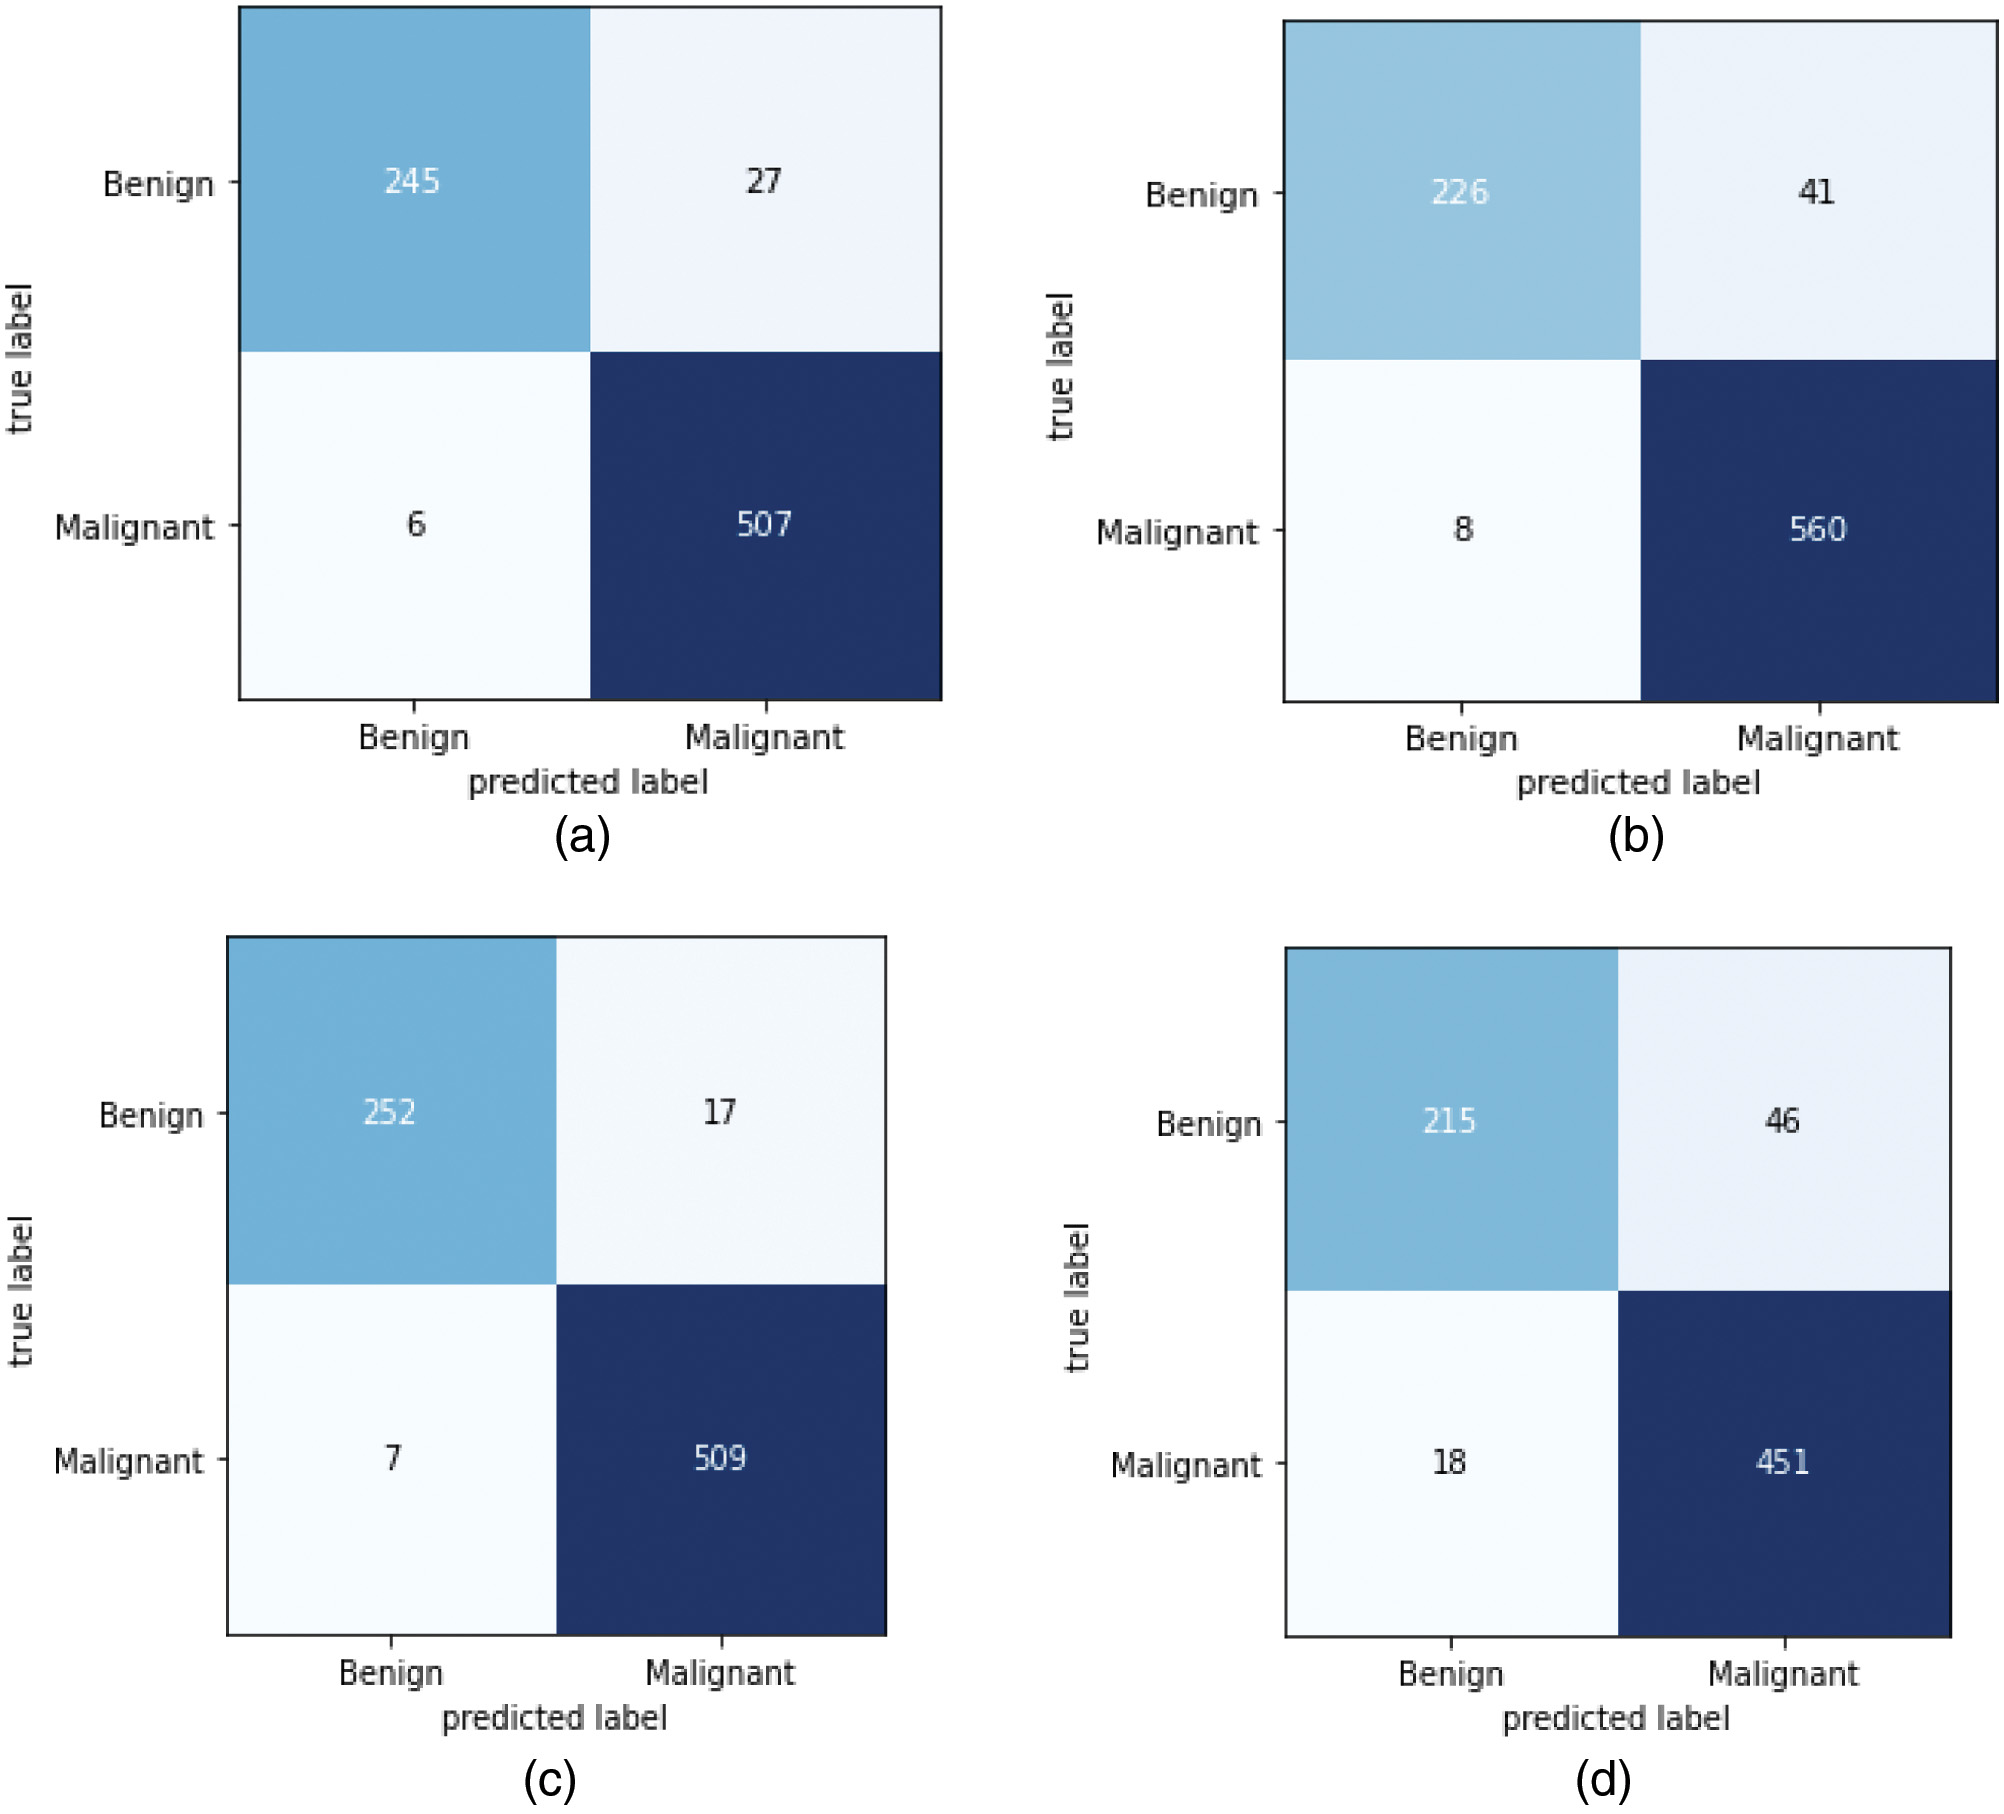 Fig. 9. Confusion matrix of the proposed model. (a) 40× images; (b) 100× images; (c) 200× images; (d) 400× images.
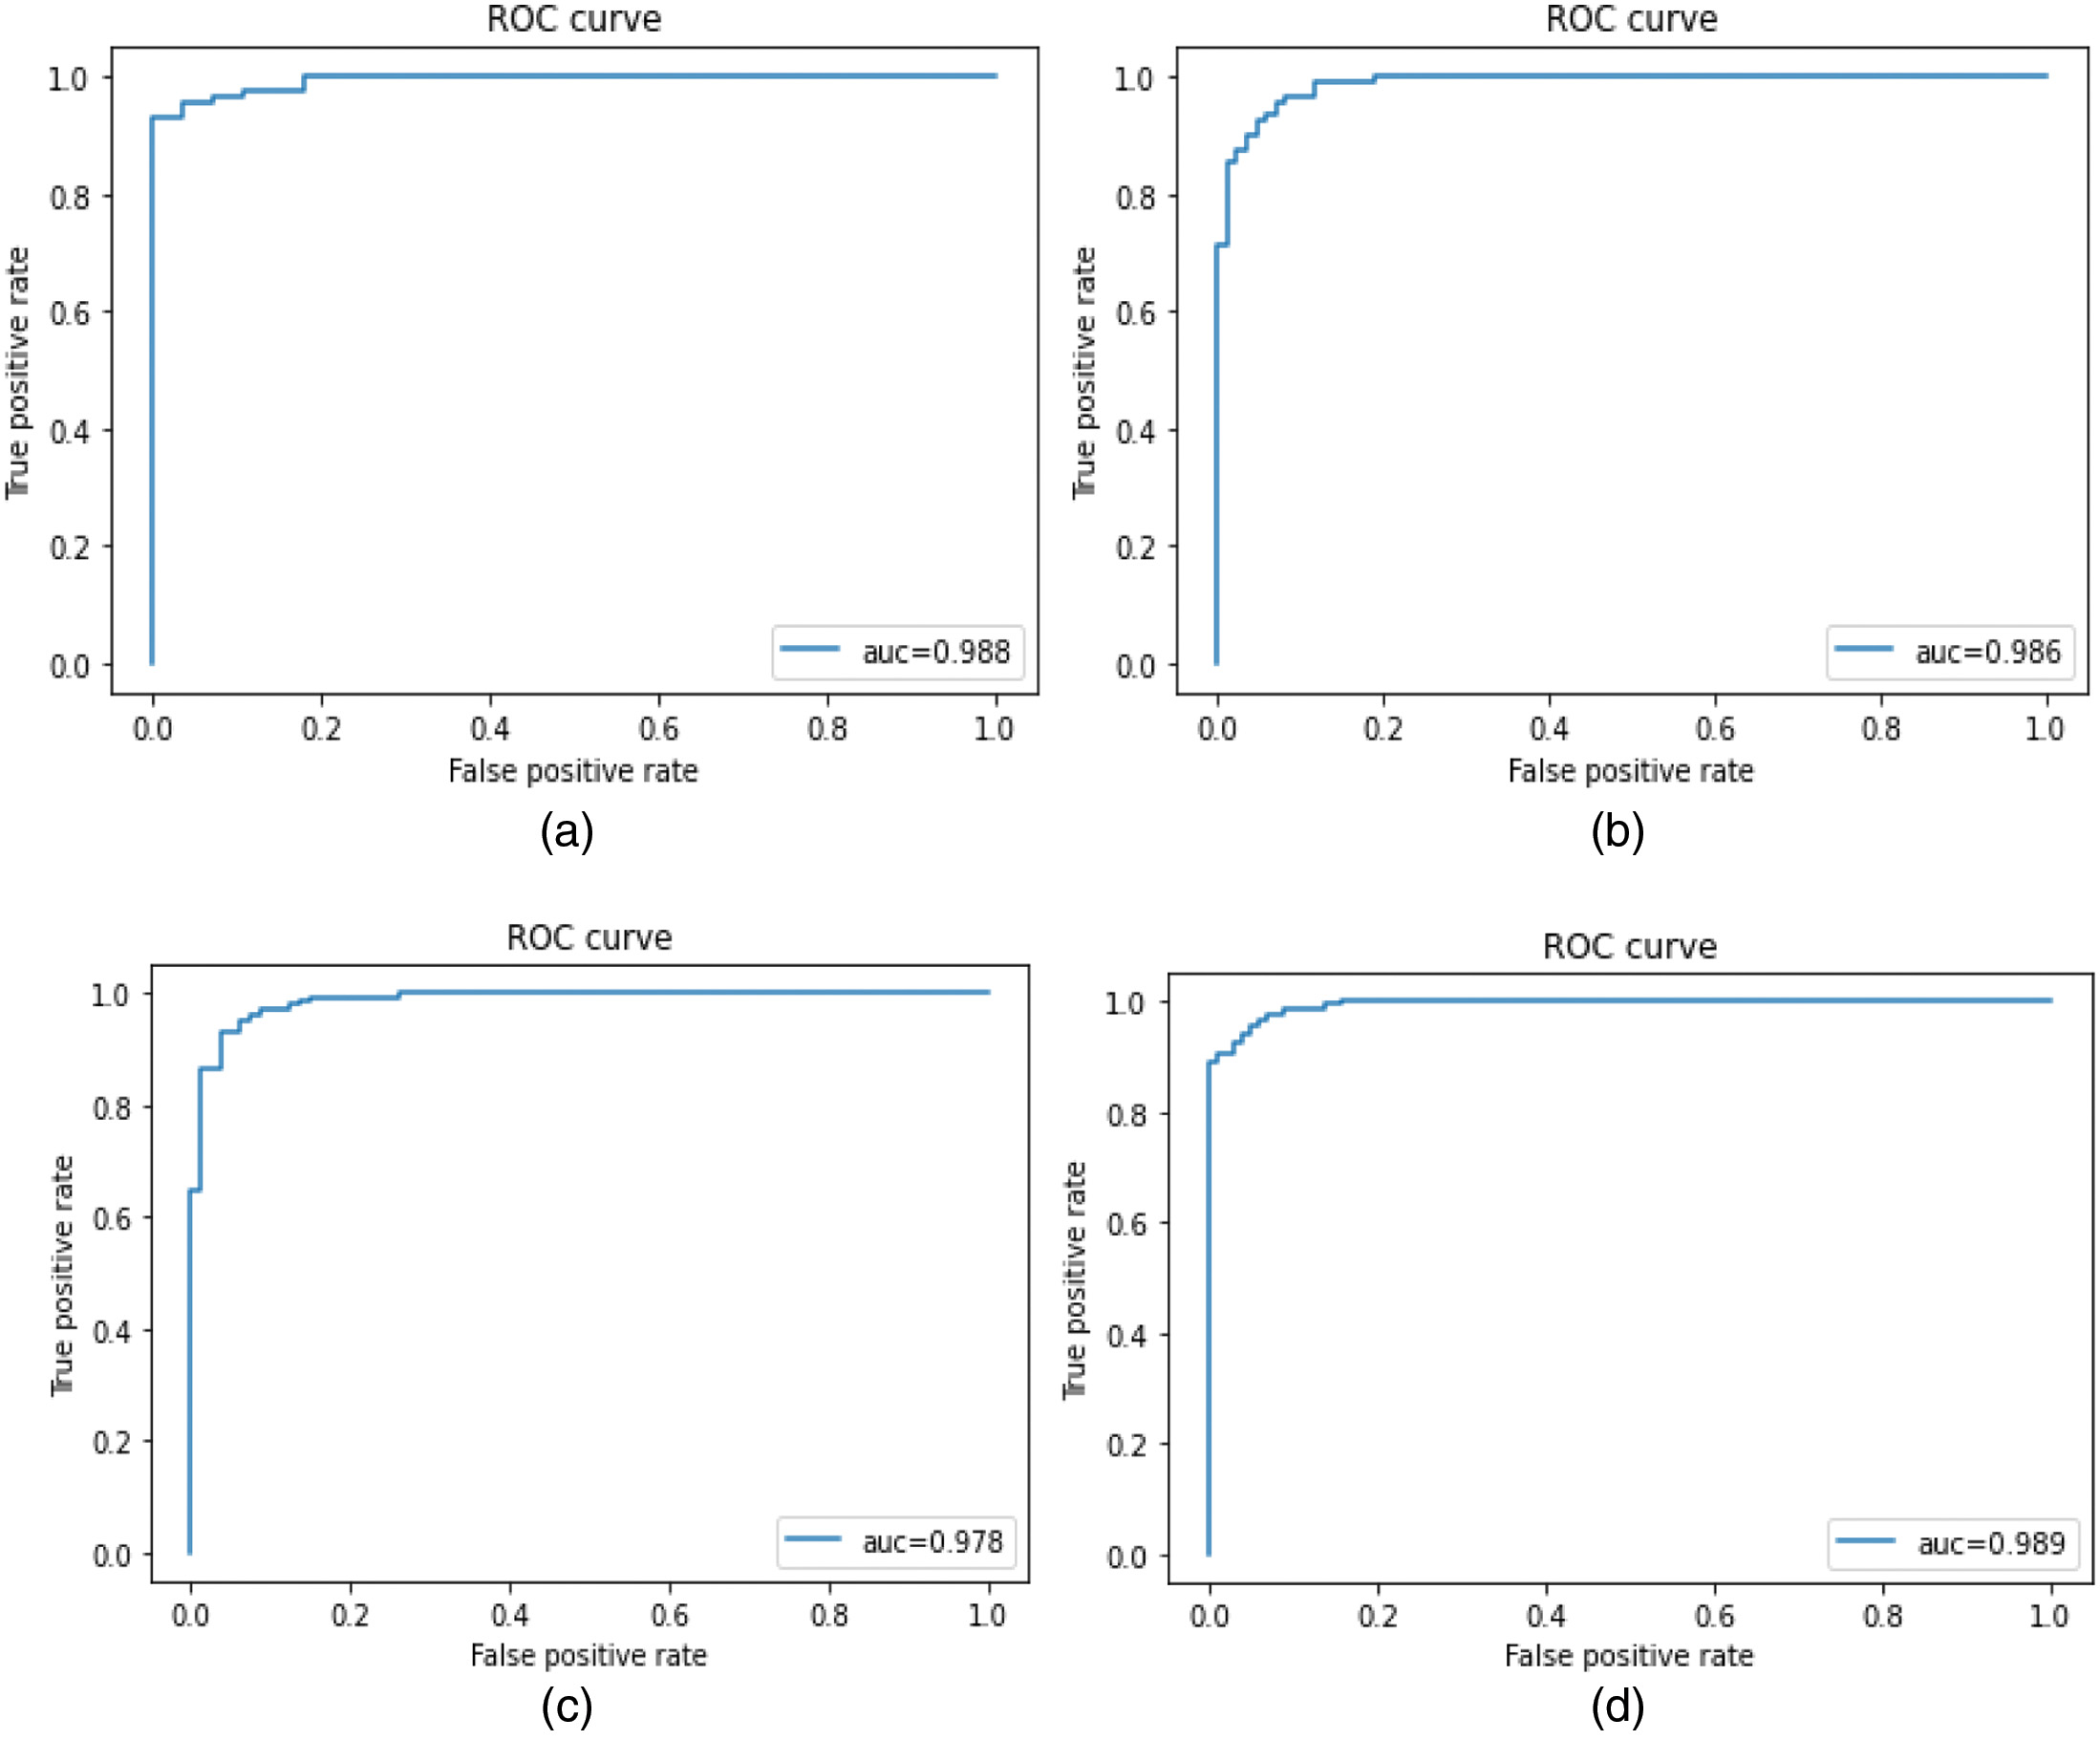 Fig. 10. ROC curves of the proposed model. (a) 40× images; (b) 100× images; (c) 200× images; (d) 400× images.
The accuracy obtained by the proposed model for distinct magnification factors is mentioned in Table III. For the images with magnification factors with 40×, 100×, 200×, and 400×, the proposed model achieved accuracies of 95.7%, 94.1%, 96.9%, and 91.2%, respectively. From the results, it is shown that the proposed CNN model obtained maximum accuracy with a magnification factor of 200×. Table IV represents the sensitivity, precision, and F1-score achieved by the proposed approach. The experiments show that our model achieved the highest precision of 97.2%, maximum F1-score of 95.2%, and recall of 93.6%.
Table III. Accuracy of the proposed CNN model
| Magnification factor | Accuracy in % |
|---|---|
| 95.7 | |
| 94.1 | |
| 96.9 | |
| 91.2 |
Table IV. Performance metrics of the proposed CNN model with different magnification factors
| Magnification factor | ||||
|---|---|---|---|---|
| Performance metric | 40× | 100× | 200× | 400× |
| Sensitivity (%) | 97.6 | 96.5 | 97.3 | 92.2 |
| Precision (%) | 90.07 | 84.6 | 93.6 | 82.3 |
| F1-score (%) | 93.6 | 90.2 | 95.4 | 87.0 |
In Table V, we compare our model with the existing methods that are defined by un-optimized CNN models to predict breast cancer. From Table V, it is clear that the obtained accuracies are less when compared to the proposed CNN model. By comparing the results of the proposed model with standard deep learning models, it can be observed that the accuracy with magnification factor 40×, the proposed model is at the first rank, and the Deniz et al. [80] model and K. Das et al. [81] models are at the second and third position. Similarly, for the magnification factor 100×, the first three performing models are proposed model, Saxena et al. [82], and Deniz et al. [80]. For the magnification factor of 200× and 400×, the best performing models are proposed model, Saxena et al. [82], and Deniz et al. [80], and the proposed model. It can be noted at lower magnification factor, and the proposed model is performing the best which justifies the use of bio-inspired techniques. Figure 11 clearly illustrates the summary of existing methods used for breast cancer classification and the proposed method. Our model achieved the best accuracy of 96.9% with a magnification factor of 200X. Also, Table VI depicts the clear-cut comparison of other VGG models. From the table, it is clear that fully trained accuracy (63.2%) was improvised to 84.28% for the pre-trained VGG-16 model. Also, pre-trained VGG-16+SVM provides an accuracy of 86.36% and VGG-16 +LR retrieves an accuracy of 92.2%. Hence, the proposed model obtains better accuracy when compared to other VGG models.
Table V. Comparison of the proposed model with existing deep learning methods
| Year | Author | Method | Accuracy with magnification factor | |||
|---|---|---|---|---|---|---|
| 40× | 100× | 200× | 400× | |||
| 2018 | K. Das et al. [ | MIL +VGG-16 | 89.52 | 89.06 | 88.84 | 87.67 |
| 2018 | S Cascinalle et al. [ | VGG_VD-16 | 87.0 | 85.2 | 85.0 | 81.3 |
| 2020 | Saxena et al. [ | ResNet-50 + SVM | 89.46 | 92.6 | 93.92 | 89.7 |
| 2017 | Han et al. [ | AlexNet | 85.6 | 83.5 | 83.1 | 80.8 |
| 2019 | Mahesh et al. [ | RestHit | 87.4 | 87.2 | 91.2 | 86.2 |
| 2017 | Spanhol et al. [ | AlexNet | 89.6 | 85.0 | 84.2 | 81.6 |
| 2019 | Sudharshan et al. [ | AlexNet | 87.8 | 85.6 | 80.8 | 82.9 |
| 2018 | Deniz et al. [ | Fine-tuned AlexNet | 90.96 | 90.58 | 91.37 | 91.3 |
| Our Proposed Model | 95.7 | 94.1 | 96.9 | 91.2 | ||
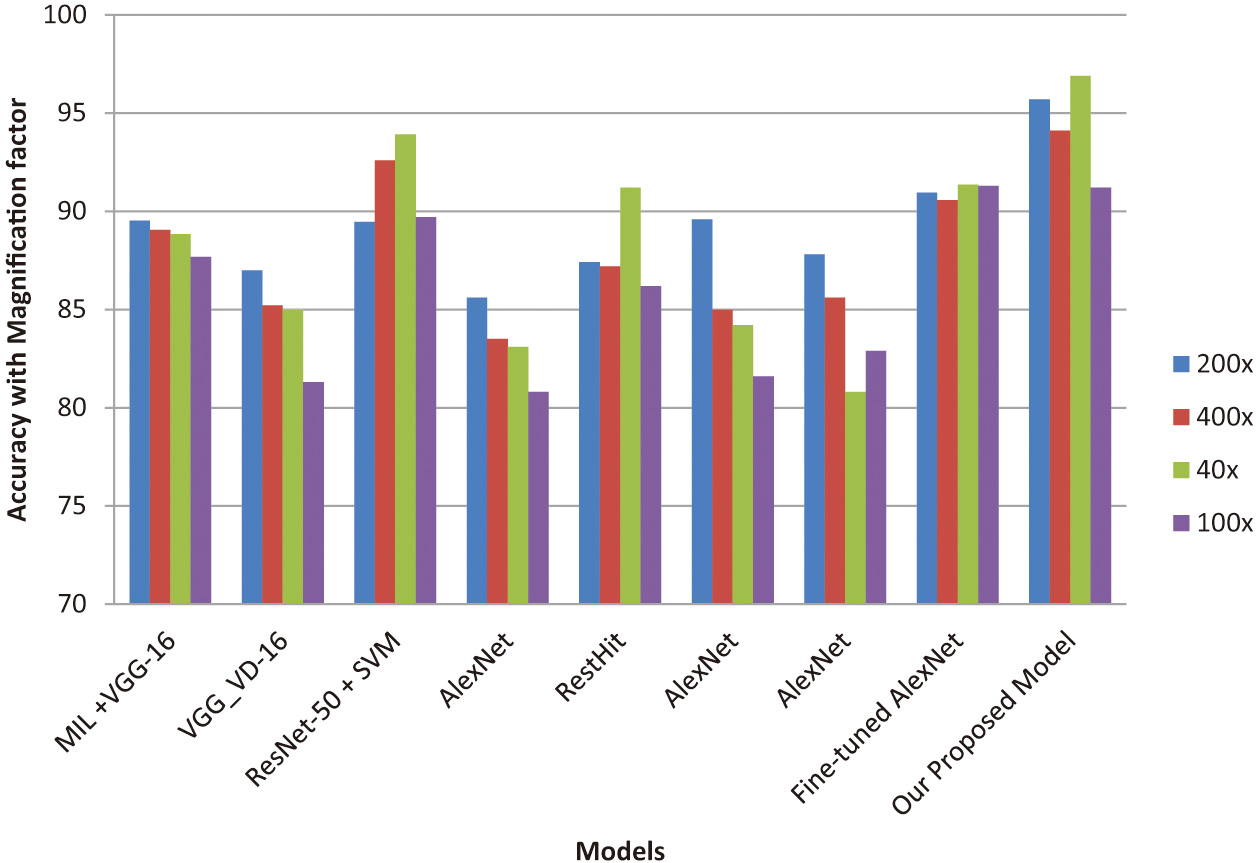 Fig. 11. Comparison summary of existing and proposed models.
Table VI. Summary of various VGG-16 models
| Model | Accuracy in % |
|---|---|
| Fully trained VGG-16 | 63.2 |
| Pre-trained VGG-16 | 84.28 |
| VGG-16 + SVM | 86.36 |
| VGG-16 + LR | 92.2 |
| Proposed optimized VGG-16 | 96.9 |
VII.CONCLUSION
In this paper, we presented a method for hyper-parameter selection of the desired CNN architecture that classifies breast histopathological images. This study uses a pre-trained network of VGG-16 model accompanied by an LR classifier to perform binary classification of breast histopathological images. The transfer learning approach makes the model simpler and easier to implement. LR classifier is placed at the end of the model which outperforms binary classification more efficiently, and the proposed model is trained separately for different magnification factors. Also, it has been observed at the lower magnification factor, the proposed model provides better results as compared to the state-of-the-art techniques. Since network architecture involves the selection of hyper-parameters, we use an evolutionary algorithm namely PSO which optimizes the hyper-parameters of the given CNN model. It often helps to decrease the time complexity when compared to other un-optimized CNN models. We use a publicly available dataset and obtain a classification accuracy of around 96.9 %. In the end, we compare our proposed optimized CNN model with various existing deep learning methods. In the future, we further study other bio-inspired algorithms that help in optimizing the CNN model. Also, future work may be designed in such a way that classifies the subtypes of cancer. Additionally, the optimized model should provide superior performance on all datasets irrespective of the selected magnification factor.