I.INTRODUCTION
There are two types of learning, which are traditional learning and online learning. Traditional learning is a learning method in which the learning content is taught by an instructor in a classroom at a prescribed time [1]. The rapid evolution of technology has paved the way for creating technologies used for learning, collectively referred to as e-learning. E-learning brings many main concepts, such as web-based learning practices. Online learning has become one of the most important e-learning platforms worldwide. With the spread of the COVID-19 pandemic, ensuring the continuity of student academic development has become even more essential. An intelligent tutoring system (ITS) is one type of e-learning system. Crowston et al. [2] claimed that ITS could increase the effectiveness of an individual tutoring system through digital resources. Moreover, the artificial intelligence (AI) aspect enables reactions as human discourse through inquiries of related elements and education [3]. It helps learners or students gain a good understanding effectively during their learning.
The key features of any tutoring system are the capability of gathering and modeling student data based on the response, motivation or emotion, metacognition, and instruction adjustment according to individual requirements [4]. The student’s performance can be predicted with the help of AI in ITS. It is crucial to provide individualized tutoring based on the student’s current mastery level or knowledge state, which can predict how well the students will perform in their courses.
ITS has four modules: expert module, tutoring module, student module, and interface module [5]. This study focuses on the student module where the prediction of the students’ performance happened. The main objective of this research is to focus on predicting students’ performance in the ITS. It is a computer-based educational system that applies AI concepts intended to improve students’ performance in the learning process. The important task in a computer-based educational system is modeling and predicting students’ performance [6]. The prediction in the student model will measure the student’s knowledge level, which can improve student performance. Therefore, it is crucial to develop an accurate student model in order to determine the learning material and the level of student knowledge [7].
Though many suitable methods exist for making predictions in ITS, the most well-known state-of-the-art methods are Bayesian Knowledge Tracing (BKT) methods [8]. BKT is a common model used to predict students’ knowledge individually and the probability that they can answer the question correctly or not based on their skill. BKT is the most used method for sequencing questions for students to enhance performance and engagement [9]. This approach follows the mastery learning paradigm, providing students with the questions expected to advance their learning, for example, the question that involves critical thinking. It proves that this method follows the mastery learning paradigm as it gives questions from a common question to a high-level one, and the students will still be able to solve it.
Despite the excellent performance demonstrated by the BKT methods, there are still problems in accurately measuring and predicting students’ performance [10]. It is due to the limitation that exists in the method used itself. One of the BKT’s limitations is that it only focuses on skills’ parameters, which refer to whether the students have mastered the learning or not [11]. Thus, extending BKT’s method by adding a confidence parameter could help enhance student performance prediction in ITS [12].
This study analyses several methods to predict the students’ performance. After analyzing it, the best method was chosen and further enhanced to predict the performance of a set of students. For studying the purpose prediction accuracy, the result generated by the enhanced method will be compared with the result generated by the original method before the enhancement.
Therefore, as a result, we propose to enhance the prediction function of the iBKT. A new parameter, confidence, is added related to the student’s confidence levels. We assumed that the confidence parameter can improve the prediction accuracy in forecasting student performance.
The remainder of this paper is organized as follows. Section II reviews the ITS and its Methods in Measuring and Predicting Student Performance in the literature. It also presents the insights gained from the extensive reviews. Section III elaborates on the proposed methodology, which is the enhancement and implementation of iBKT using two types of datasets. Section IV discusses the results obtained through the experiments done by employing the proposed method. Finally, this study’s conclusion is presented in Section V.
II.LITERATURE REVIEW
A.INTELLIGENT TUTORING SYSTEM
ITSs are sophisticated, automated software systems that apply AI concepts and methods to teaching and learning problems and needs [13]. ITS is an automated system that can provide a personalized tutor for learning [14]. It has four modules, as in Fig. 1, that consist of the expert module, tutoring module, student module, and interface module [5]. The expert model is used to bring together all the information relevant to the field of expertise required for the teaching process. This module must generate questions, explanations, answers, hints, and comments and provide standards to check on the student’s performance.
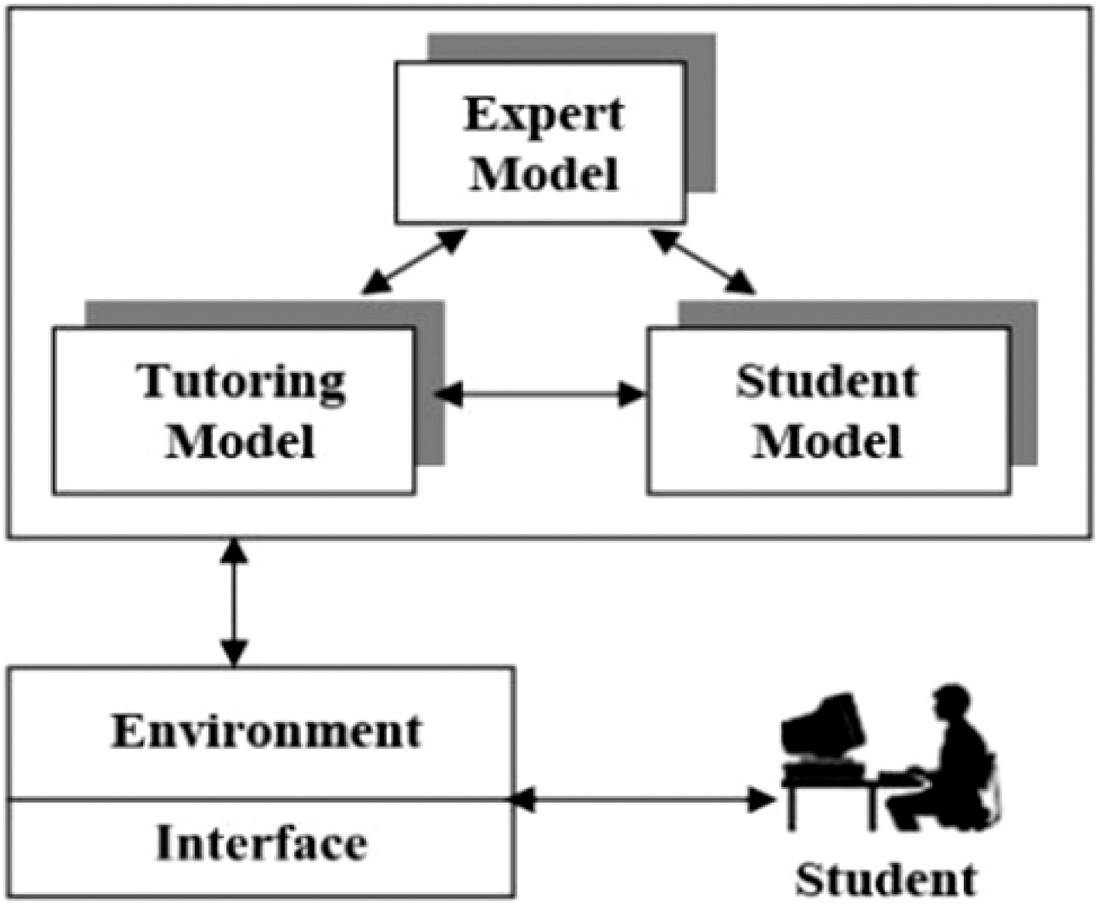 Fig. 1. Module in the intelligent tutoring system.
The student’s module must be represented by students’ answers, behaviors, and actions, which means the student’s knowledge and skills [15]. Furthermore, ITS does not work without knowing the student’s knowledge, so awareness, behavior, and all other aspects that could affect the student’s performance should be included in this module. The Tutor or Pedagogical Model puts in place pedagogical techniques to teach the knowledge of a given area. Any educational approach must be based on the psychological and pedagogical concepts of type. The learner’s needs must be defined and expressed in the teaching approach.
The interface model helps the students to communicate effectively. It involves thinking about user reasoning, handling communication, sketching graphics to demonstrate argument, displaying or detecting emotions, and describing how conclusions were reached [16]. All of these modules are important in developing the ITS.
ITS offers many benefits, one of which is the power to adjust to students’ learning styles so that students can learn at their own pace and according to their preferences [17]. The main role of the ITS is to assess the mastery learning of the student. Motivated by the issues that have attracted much attention from researchers working on ITS concerning prediction accuracy and students’ uncertainties, this study focuses on the student module. The performance prediction is based on the individual student. It is to measure the student’s mastery level of the underlying knowledge. It also determines the student’s knowledge about a specific field and how accurately and correctly a student answers the task based on their responses [18].
B.ITS METHODS IN MEASURING AND PREDICTING STUDENT PERFORMANCE
Knowledge Tracing (KT) has gained a reputation in this field of study for providing effective guidance in the learning process. KT aims to determine learned skills and use this knowledge to customize learning opportunities in applications such as tutoring programs, on the web, and even in Massive Open Online Courses [19]. By doing this, mastering a skill can be achieved. KT aims to track students’ knowledge state based on observed results from their previous practices [19]. It also can be known as student modeling. The most popular method in KT is Bayesian Knowledge Tracing [8,20].
BKT is a method to estimate mastery learning. One of the advantages of the BKT model is that it consists of both theoretical roots and efficient real-world implementation [21]. The function of the BKT model is used to track the probability of whether the student has mastered the learning and the student can answer the questions correctly [22]. The prediction of the student’s skill is based on the given set of assessments to ensure the student has mastered the learning and is able to move to the next level of learning [23].
Since BKT is the most popular method and is good at predicting mastery learning, many researchers have used it to predict student performance. Even though BKT shows a good performance, it limits on focusing on skill parameters; thus, the researcher has introduced the extended version of BKT, which is Individualized Bayesian Knowledge Tracing (iBKT) [24], Student Skill Model (SSM) [25], and Personalized, Clustered, Bayesian Knowledge Tracing (PC-BKT) [21]. Other than BKT, Performance Factor Analysis (PFA) is the other method of KT [26]. It is a new alternative to predicting student performance based on reconfiguring Learning Factor Analysis [27].
Therefore, developing an accurate method to predict students’ performance in ITS is important. The extensive review aims to identify which method can provide the most accurate prediction of students’ performance. Table I summarizes the in-depth review of the original BKT method used in approximate mastery learning. It might result in less prediction accuracy since it concentrates more on skill parameters [22]. Thus, researchers in the literature have developed a few improvements to BKT approaches to improve student performance prediction in the ITS. Several improvised BKT techniques have been researched and compared, including the iBKT, SSM, PC-BKT, and PFA.
Table I. ITS prediction using different methods
| Characteristics | Methods | |||||
|---|---|---|---|---|---|---|
| BKT | iBKT | SSM | PC-BKT | PFA | ||
| Four parameters: P(L0): Leaner (the probability of a student having the skill even before trying the lesson) P(T): Transit (the probability be able to learn it after completing the lesson by a student who did not know the skill) P(G): Guess (the probability student answering a question correctly in the lesson without knowing the skill) P(S): Slip (the probability of a student having the skill but yet reacting incorrectly) | In the iBKT models, only the P(L0) and P(T) were individualized. The four parameters in BKT which, also known as 4N divided into two components: a component per skill and a component per student. The number of parameters was 4N + 2M, where M is the number of students. | Eight parameters simultaneously: Four student parameters and four skill parameters. The number of parameters is 4N +4M, where N refers to student and M refers to skill. | This model assumes that over time, the amount of material learned that is remembered decays exponentially. where N is the degree of information, lambda is an exponential constant of decay set to 0.1, and the interval of time is t. Assumption that if a student does not try the ability within 30 days, the risk of forgetting will increase. | PFA is a variant decomposition of learning and relies on the reconfiguration of learning factor analysis (LFA). By dropping the student variable and replacing the skill variable with the question identity, it can reconfigure LFA on its independent variable, for example, one parameter per question. Its model estimates a parameter that represents the difficulty each of the items and two parameters reflecting the effects of previous failures achieve for that each of skill. | ||
| BKT is a method to approximate mastery learning. The prediction of the student skill is based on the given set of assessment to ensure the student has mastery the learning and be able to move to the next level of learning [ | The individualization of BKT is done by insertion of a student node. The conditional probability table for the initial knowledge node is then dependent on the value of the student node [ | This model can be used to keep track of all the four student parameters and four skill parameters simultaneously in a single process [ | PC-BKT assumes that a skill once learned is never forgotten [ | PFA can directly handle with multi-skill performances [ | ||
| The BKT method only focuses on the skill parameter, which refers to the student having mastered or unmastered the learning [ | The individualized BKT method is only limited to students’ prior knowledge. However, it does not extend to other aspects of student knowledge such as guess and learning rates [ | The Student Skill Model can only be used when there is a large number of skills and students [ | Challenging in gaining data using a sparse matrix [ | PFA could generate a negative learning rate if it is overfitting [ | ||
| Cognitive Tutor dataset | Cognitive Tutor | ASSISTments | Cognitive Tutor | ASSISTment | ||
| KDD | KDD | KDD | ||||
| Compared to PC_BKT and other enhancements of the BKT method, the BKT method is less accurate compared to other methods. | Proven that the implementation of the iBKT model can tangibly improve the accuracy by adding the student-specific probability of learning in predicting the success of student work in an ITS. | The average RMSE shows that the Student Skill Model is more accurate than KT, which is 0.4199 compared to 0.4331. | PC-BKT model that incorporates forgetting as a time decay function proves that the decay function increases the performance accuracy by 95.9%. | PFA is at par with KT’s prediction, which deals with multi-skill questions. It can be improved with minor tweaking parameters (non-negative restricting learning rates) and KT parameter model fitting. | ||
The original BKT provides less prediction accuracy compared to the enhanced iBKT. Thus, adding confidence parameters to improve and get better prediction accuracy is worthwhile. The performance of iBKT, SSM, and PC-BKT regarding prediction accuracy is practically on par. These three techniques were successful in outperforming the original BKT. The PFA reportedly performed quite well, although some tweaking parameters are required to perform an accurate prediction. Additionally, it was claimed that PFA and BKT are equivalent in terms of prediction accuracy when it comes to multi-skill questions.
According to the comparative research, PFA is less effective than the others. In order to choose the optimal approach to use in our research, PFA excludes other methods and concentrates more on iBKT, SSM, and PC-BKT. iBKT does not consider other knowledge-related factors like learning and guess rate and only employs student-prior knowledge as the parameters. Four student and four skill parameters are employed simultaneously in the SSM, which uses more parameters to make predictions.
In the case of the PC-BKT, its prediction function includes the “forgetting” component. PC-BKT is not used in our research since we want to concentrate on predicting students’ performance on the mastery level of a subject usually finished in just one or two weeks. Additionally, researchers asserted that if a student does not use the skill within 30 days, there is a greater chance that they will “forget” it. We anticipate that the student guessing and learning rates can be incorporated into the iBKT to improve the prediction function. We know that the iBKT generates a good prediction despite not considering these factors. It will be fascinating to see if the newly proposed iBKT can outperform the SSM, which already uses all the components as parameters in its prediction function.
The confidence level analysis is crucial since it reveals whether students guess during assessments and can identify problems with student uncertainty in learning. According to a recent study [33], confidence level should be considered when evaluating a student’s performance to reduce uncertainty in the interaction of the students and improve the student model in the ITS. It is proven that a high percentage of the students in the dataset were predicted correctly. Thus, it is hypothesized that a proposed method with the addition of confidence as an adding parameter could enhance the accuracy prediction of student’s performance in ITS.
We employed iBKT with confidence parameters in our next research stage. The aim is to determine the uncertainty and enhance the student’s performance prediction. The performance of the prediction accuracy was compared between the initial iBKT and the enhanced iBKT.
III.MATERIALS AND METHODS
This section presents the prediction step based on the method analyzed during the literature review, which is the iBKT method. Figure 2 shows the study flow identified the steps involved in predicting the student’s performance. It consists of four steps in general with specific methods involved.
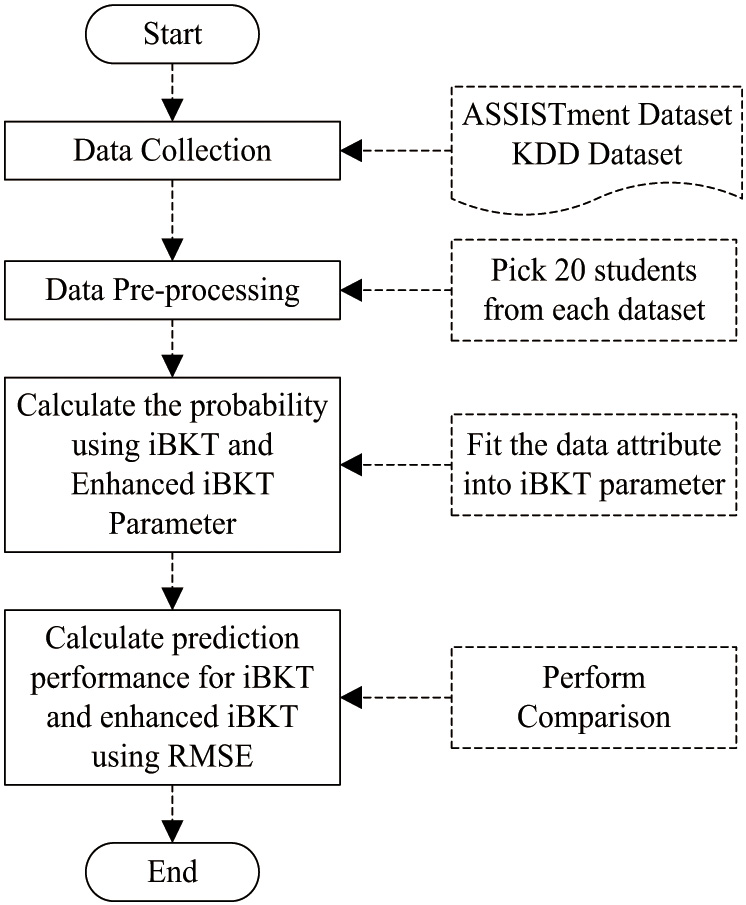 Fig. 2. Flowchart of processes to predict the students’ performance.
A.DATA COLLECTION
We collect the data using two datasets: ASSISTment and Knowledge Discovery [34] and Data Mining (KDD) [35]. It ensures that the results produced using the proposed method are consistent, thus ensuring its reliability and universality. The ASSISTment is a free online web-based tutoring framework for 4th- to 10th-grade mathematics and collected data throughout the 2009–2010 school year. This dataset, which was generated in 2015, consists of 708632 problems from 100 skill-builder sets. The data focus on skill builders is also known as data on mastery learning. This dataset consists of problem sets for skill builders (mastery learning), where a learner is regarded to have mastered a skill once they reach a particular level.
Meanwhile, KDD Cup 2010 is data on the Information Discovery and Data Mining Challenge about student performance evaluation. It is an educational data mining competition in which participants are charged with predicting student algebraic problem performance given information regarding past performance. Specifically, participants were provided with summaries of the logs of student interaction with ITSs.
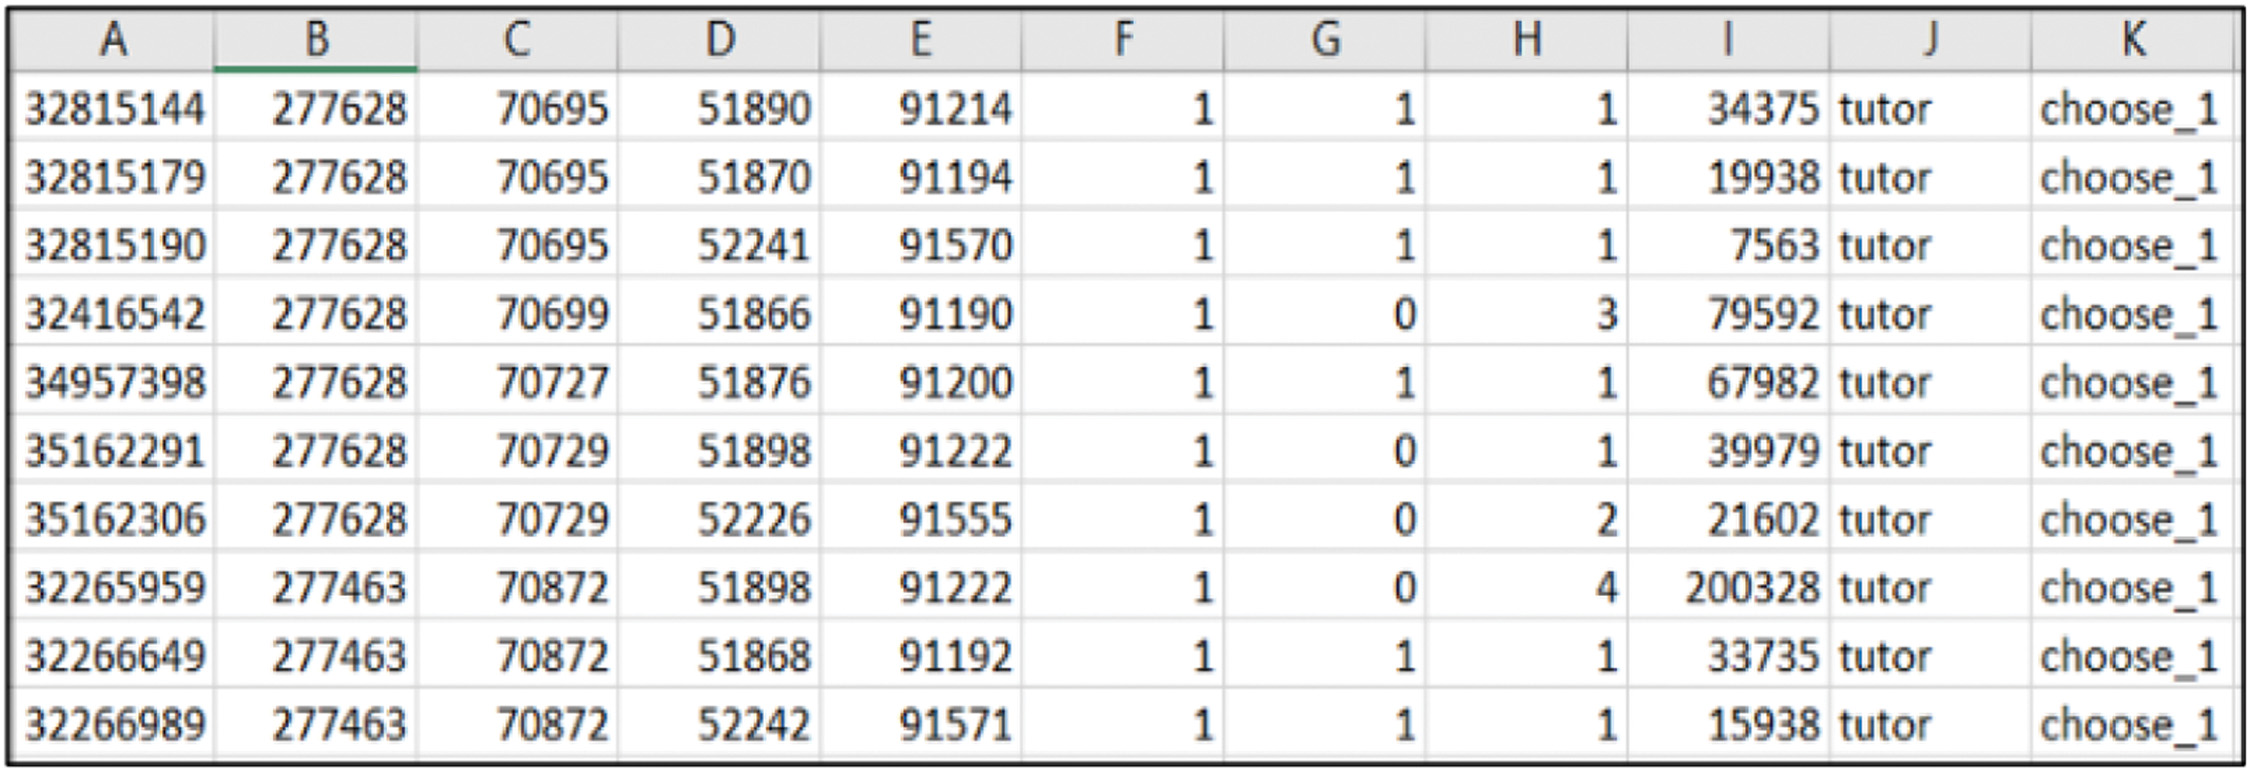
Datasets will be retrieved in this step and organized into a standardized type. A standardized dataset is essential to ensure a clear understanding of how the data are interpreted. Figure 3 shows the sample of the ASSISTment dataset, and Fig. 4 shows the sample of the KDD dataset. The collected dataset shows more than 1,000 students who worked on 708,632 problems.
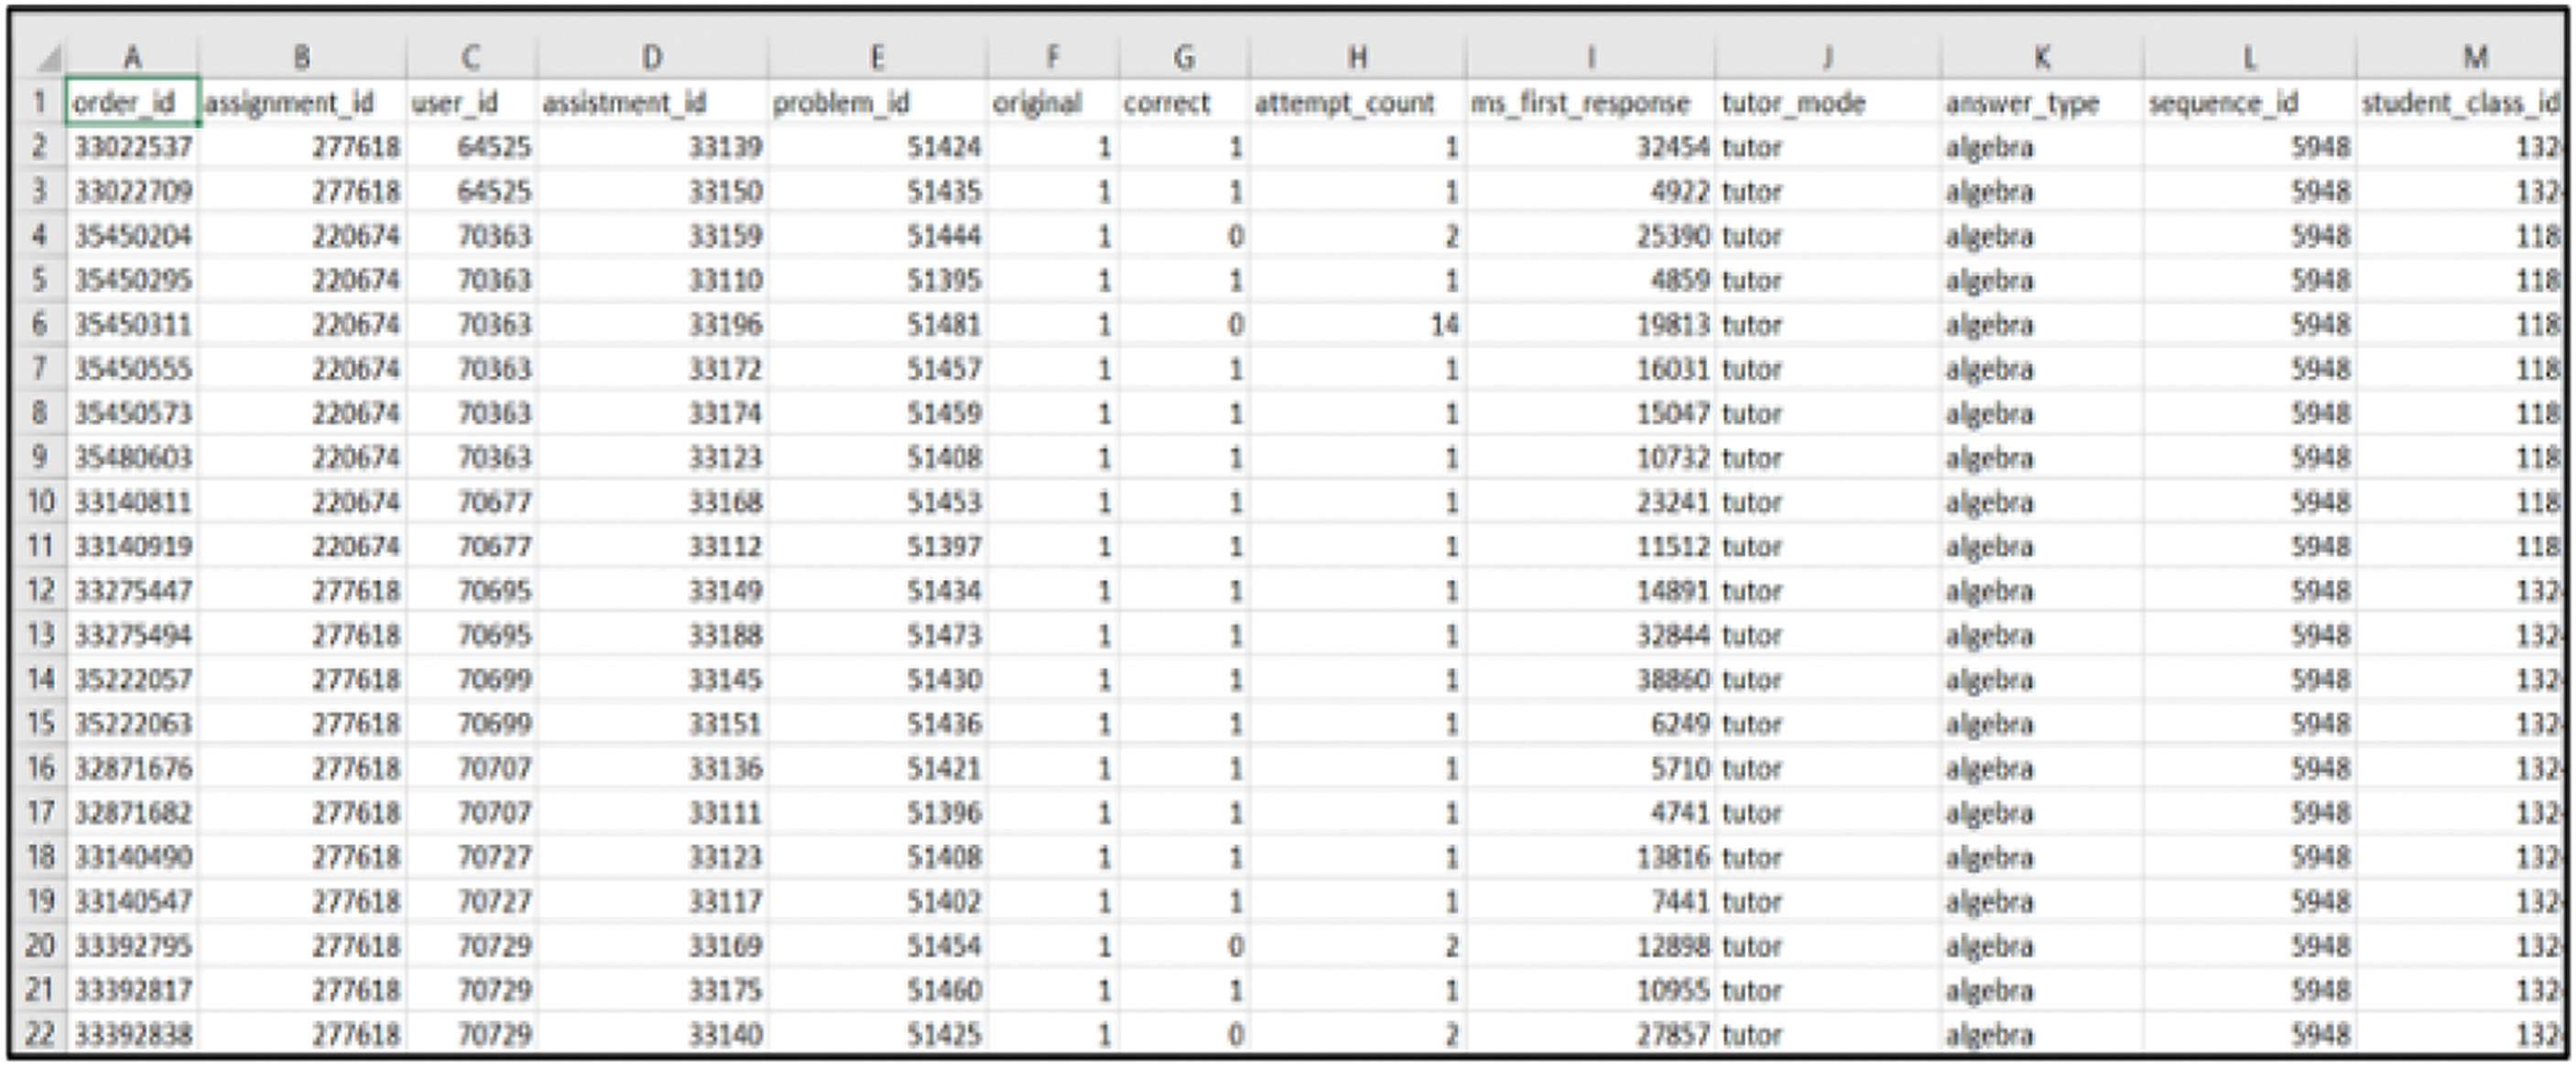 Fig. 3. Sample ASSISTment dataset.
For this research, since the original dataset is huge, first, the dataset is standardized into a simple form of a dataset, purposely to make it easier and more systematic to enhance the efficiency of predicting student performance in ITS. Thus, the first 20 students will be selected from the standardized dataset.
Based on Fig. 5, the data that will be standardized are in column K, which represent the answer type. In this research, the answer type will focus on multiple-choice questions. Therefore, the answer type will be standardized to “choose_1,” representing the multiple-choice question.
B.DATA PREPROCESSING
The following process is preprocessing data. This step is essential to select the important attributes and focus areas to predict the students’ performance. This research will focus on multiple-choice questions from the course and select 20 students from each dataset. The standardized form of the dataset in this step is preprocessed in order to select the important attributes.
Table II shows the sample of the preprocessed ASSISTment dataset, which consists of seven columns with the important label to be analyzed. The data focus on the multiple-choice question and the same Template_id, which is 50,299. It indicates a similar question for the assignment assigned to the assignment students. Table III shows the sample of the preprocessed KDD dataset, which consists of nine columns with an important label to be analyzed.
Table II. Sample of preprocessed ASSISTment dataset
| Assignment Id | User Id | Correct | Attempt_count | Hint_count | Ms_first_response | Template_id |
|---|---|---|---|---|---|---|
| 277628 | 70695 | 1 | 1 | 0 | 34375 | 50299 |
| 277628 | 70729 | 0 | 2 | 3 | 21602 | 50299 |
| 263371 | 77962 | 0 | 4 | 0 | 64048 | 50299 |
| 270284 | 78073 | 1 | 1 | 0 | 117427 | 50299 |
| 263771 | 78804 | 1 | 1 | 0 | 137349 | 50299 |
Table III. Sample of preprocessed KDD dataset
| Row | Step start time | First transaction time | Correct transaction time | Correct step duration (sec) | Correct first attempt | Incorrects | Hints | Corrects |
|---|---|---|---|---|---|---|---|---|
| 9098 | 57:07.0 | 57:16.0 | 57:16.0 | 9 | 1 | 0 | 0 | 1 |
| 9887 | 24:43.0 | 24:46.0 | 24:46.0 | 6 | 1 | 0 | 0 | 2 |
| 10039 | 42:05.0 | 42:08.0 | 42:08.0 | 3 | 1 | 0 | 0 | 1 |
| 10482 | 39:38.0 | 39:41.0 | 39:41.0 | 6 | 1 | 0 | 0 | 2 |
| 11024 | 20:24.0 | 20:27.0 | 20:27.0 | 11 | 1 | 0 | 0 | 2 |
Datasets retrieved and preprocessed are analyzed to identify which data will be set as parameters according to the BKT method. The Bayesian network learns the model’s parameters and predicts the students’ performance. In general, there are four parameters in BKT, which are P(L0), P(T), P(G), and P(S).
- •P(L0): Leaner (the probability of a student having the skill even before trying the lesson).
- •P(T): Transit (the probability of being able to learn it after completing the lesson by a student who did not know the skill).
- •P(G): Guess (the probability of the student answering a question correctly in the lesson without knowing the skill).
- •P(S): Slip (the probability of a student having the skill but yet reacting incorrectly).
We solve the uncertainty issue concerning ITS in student interaction by introducing the students’ confidence criteria as one of the parameters defined as P(C). As for the mentioned dataset, the probability of a student answering a question correctly within the given time limit will be referred to.
The time recorded, “Ms first response,” or the first response millisecond in the ASSSITment dataset and “Correct Step Duration (sec)” in the KDD dataset used for the selected students in answering a question. The number of attempts (in a time period) to answer the question can be used to measure the confidence level of the students. The P(C) parameter will be implemented in the iBKT to predict student performance.
C.CALCULATE THE PROBABILITY USING iBKT AND ENHANCED iBKT PARAMETER
Analyzing the dataset to fit the data attribute as an input parameter to the prediction function is crucial. Our study’s prediction function, based on the ASSISTment dataset and four BKT parameters, is represented by Equations (1)–(4). Equation (1) can be interpreted as the proportion of students correctly answering on their first try without assistance, demonstrating that they understood the subject. The number of students who correctly answer the same question a second time is represented by Equation (2). The student does not know the lesson when they answer the question poorly the first time and ask for a hint, but they do after receiving the hint.
The number of students who attempt the question multiple times is shown in Equation (3). If the student repeatedly alters his response without understanding the lesson, the answer may be correct or inaccurate, showing that the learner is simply guessing the question. The percentage of students correctly responding to the first question on their first try is shown in Equation (4). The students gave the same response wrong the second time, indicating they might have made a careless error.
In order to more accurately anticipate the students’ performance, P(C) is added to the original function to improve the iBKT approach in our study. According to Equation (5), it can be described as the proportion of students who correctly answer the question the first time on their first try and do so quickly, showing that they are very confident. Next, Equations (6)–(8) are the predicting function based on the KDD dataset. The data assigned is the same term in Equations (1) and (2). Equation (8) is the number of students who answered the question incorrectly.
However, there is a slight chance the student will answer correctly by making a guess. In the KDD dataset, the student cannot afford to make a silly mistake as they can view the question or problem several times before answering the question, so P(S) is not considered in the KDD dataset. Equation (9) is for enhancement of the iBKT method using the KDD dataset regarding confidence level. It is determined based on how many students answer the question in less step duration. However, if the student answers it correctly, we considered the student answers the question confidently.
Only two distinct priors of student information, which are high and low, can be used in the iBKT approach. It can make use of a student’s initial response. Students who respond incorrectly to their first question are placed in a low category. In addition, if they gave the correct answer, they thought they fell into a high category. Setting them as ad hoc is one potential strategy for forecasting it. The high prior ad hoc, conditional on the initial response, is justified by an intuition of about 1 minus the probability of a guess [36]. Low prior should match the probability slip in terms of value.
D.CALCULATE THE PREDICTION PERFORMANCE OF iBKT And Enhanced iBKT USING RMSE
Root mean square error (RMSE) is used to calculate the performance accuracy of iBKT and enhance iBKT by adding P(C). In particular, skill model evaluation frequently uses the RMSE statistic [37]. Any anticipated and actual values (observed values) are compared using RMSE. The iBKT method is on the RMSE presented in Equation (10) to measure iBKT’s performance, and Equation (11) is used to measure the iBKT with the addition of P(C).
Following that, we compare the two RMSE values. A lower RMSE score is considered to have a higher degree of prediction accuracy [37]. The discrepancy between the predicted and actual values increases with increasing RMSE, indicating that the model is less accurate:
IV.RESULT AND DISCUSSION
Analyzing the data from the dataset is important as it will be implemented in the prediction function to predict the student’s performance. Two bar graphs were plotted to show the difference. For clarification, the standard BKT approach, in this case, is the iBKT without P(C). In contrast, the improved iBKT method is the iBKT with P(C). Table IV shows the dataset result for each parameter from the equation in the methodology phase. As mentioned, the KDD dataset for P(S) is not considered. Thus, we mark the value as NA. The final value to be evaluated is the RMSE result without and with P(C).
Table IV. Dataset result for each parameter
| Parameter | KDD dataset | ASSISTment dataset |
|---|---|---|
| Value | Value | |
| P(L0) | 0.6670 | 0.4670 |
| P(T) | 0.0000 | 0.1330 |
| P(G) | 0.0670 | 0.4670 |
| P(S) | NA | 0.0670 |
| P(C) | 0.2000 | 0.1330 |
| iBKT | 1.6000 | 1.2000 |
| iBKT with P(C) | 1.4000 | 1.0670 |
| RMSE without P(C) | 0.2826 | 0.2319 |
| RMSE with P(C) | 0.2590 | 0.2119 |
Using the final RMSE value, we plot the bar graph to see the comparison. The bar graph in Fig. 6 depicts the RMSE value for iBKT without P(C) using dataset ASSISTment with 0.25060 and dataset KDD with 0.25062. Figure 7 depicts the RMSE value 0.21190 for dataset ASSISTment iBKT with P(C), and the RMSE value for dataset KDD iBKT with P(C) indicates 0.23519.
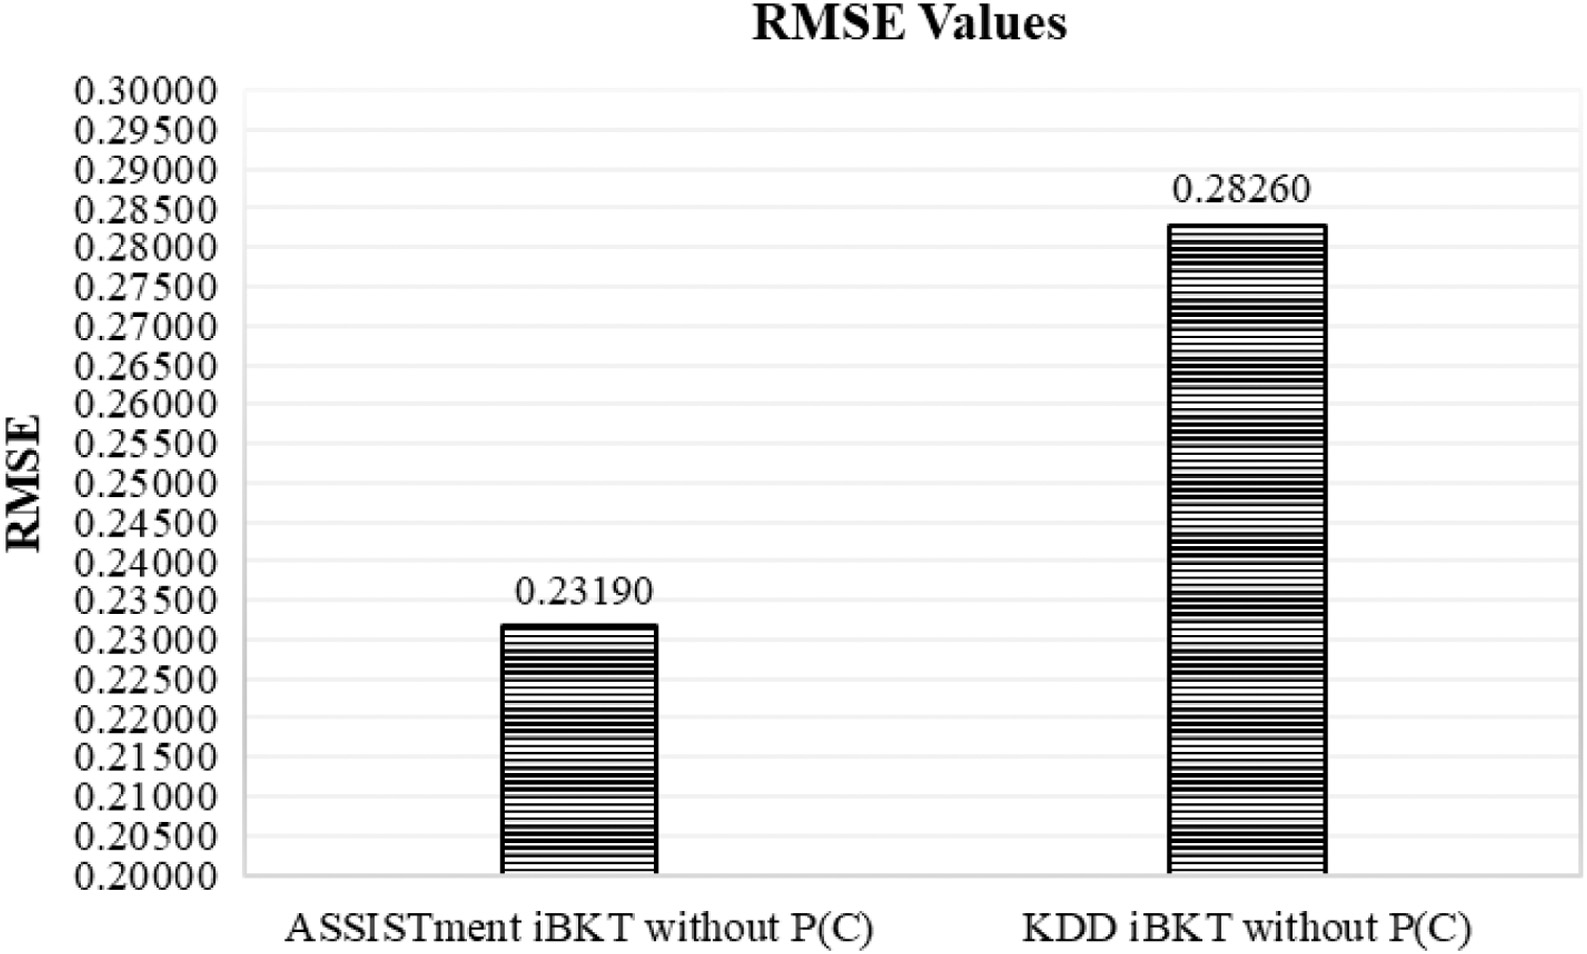 Fig. 6. RMSE value for dataset ASSISTment iBKT without P(C) and KDD iBKT without P(C).
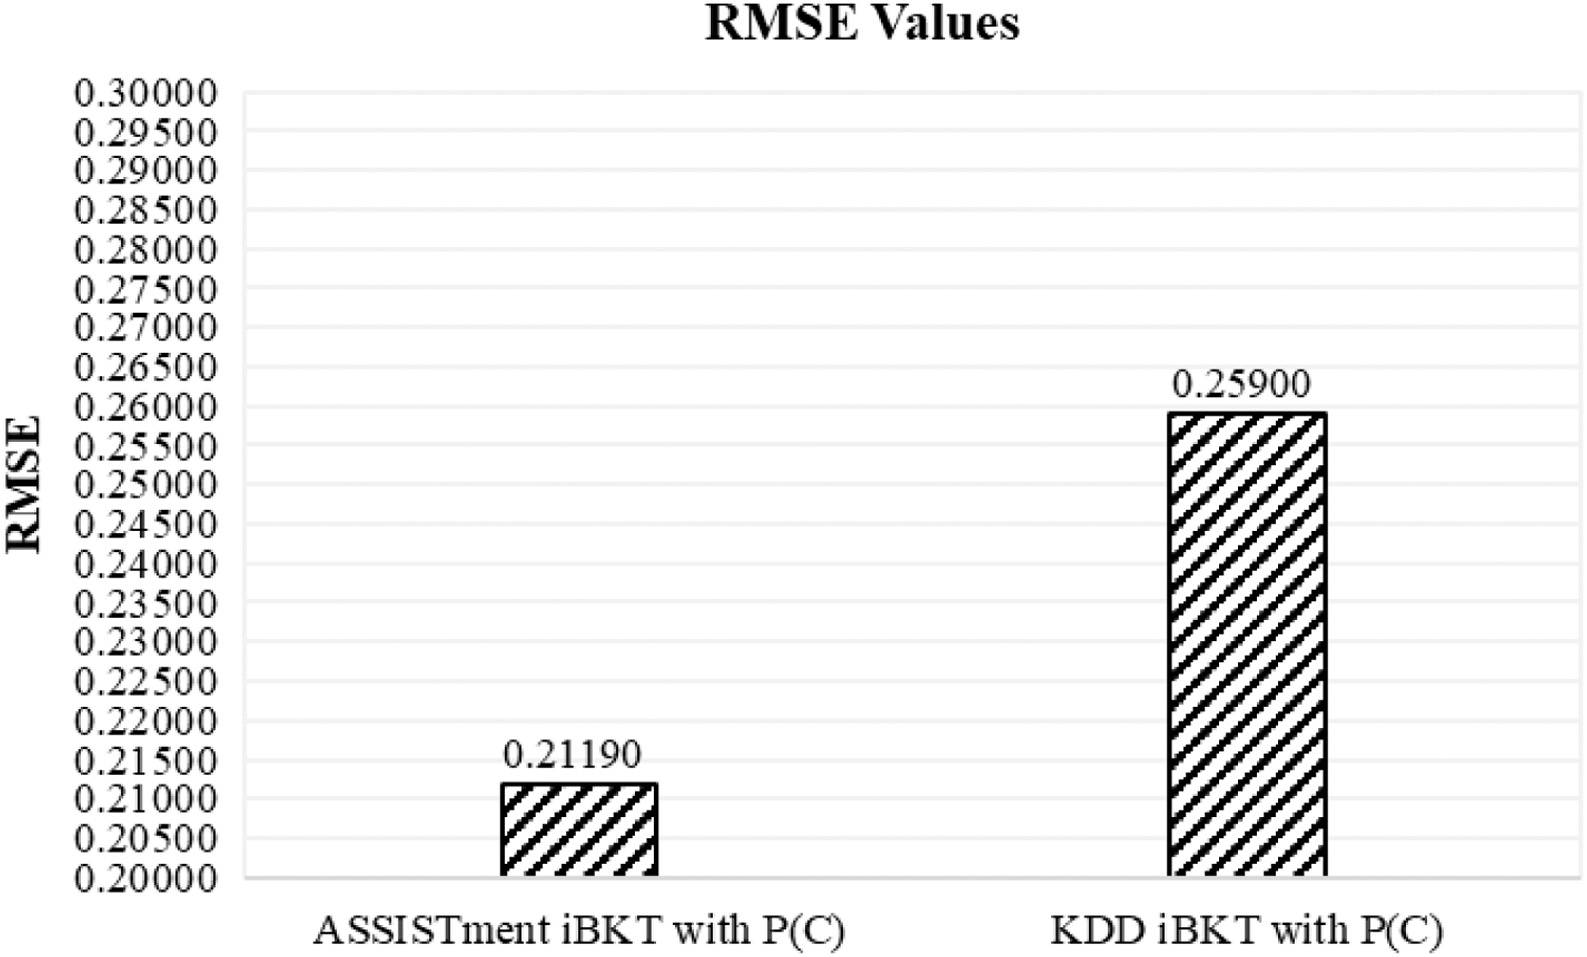 Fig. 7. RMSE value for dataset ASSISTment iBKT with P(C) and KDD iBKT with P(C).
We analyze the result by focusing on a few angles, as in Table V. First, we compare the results based on a specific individual dataset, ASSISTment and KDD. RMSE result for dataset ASSISTment iBKT without P(C) shows 0.25060, which is higher compared to ASSISTment iBKT with P(C), 0.21190. As a finding, since the ASSISTment iBKT with P(C) shows a low RMSE score, it is considered to have a higher degree of prediction accuracy. RMSE result for dataset KDD iBKT without P(C) shows 0.2826, which is higher than KDD iBKT with P(C), 0.2590. Again, the result reflects the same finding: a higher degree of prediction accuracy where the RMSE for dataset KDD iBKT with P(C) shows the lower RMSE score.
Table V. Details analysis of comparison
| Comparison | Findings |
|---|---|
| Specific individual dataset, ASSISTment and KDD | ASSISTment iBKT: RMSE dataset ASSISTment iBKT without P(C) is 0.23190. RMSE dataset ASSISTment iBKT with P(C) is 0.21190. Conclusion: ASSISTment iBKT with P(C) shows a low RMSE score. Thus, it is considered to have a higher degree of prediction accuracy. KDD iBKT: RMSE dataset KDD iBKT without P(C) is 0.28260. RMSE dataset KDD iBKT with P(C) is 0.25900. Conclusion: KDD iBKT with P(C) shows a low RMSE score. Thus, it is considered to have a higher degree of prediction accuracy. |
| Specific iBKT, without the new parameter P(C) and with the new parameter P(C) | RMSE value difference in Fig. RMSE value differences for both datasets with P(C) shows 0.04710. Conclusion: The RMSE with confidence parameter P(C) clearly shows which dataset can provide higher prediction accuracy. The ASSISTment dataset provides a higher prediction when applying the new parameter, which is 0.21190 |
Second, we compare the RMSE differences based on specific iBKT, without P(C) and with P(C). The result for RMSE value differences for both datasets (Fig. 6) without P(C) is 0.0507. However, the result for RMSE value differences for both datasets (Fig. 7) with P(C) shows 0.04710. Based on the findings, we conclude that the proposed P(C) solution clearly shows which dataset can provide higher prediction accuracy. In this study, the ASSISTment dataset provides a higher prediction when applying the new parameter, which is 0.21190. Therefore, this will affect the value of iBKT from both datasets when implementing each value of parameter received to the formula of iBKT.
To ease the visualization, we plot the line graph combining the result as in Fig. 8 to compare the RMSE values of the iBKT without and with P(C). The RMSE value of iBKT with P(C) has a narrower range value than iBKT from both datasets, ASSISTment and KDD. As a result, it is concluded that utilizing iBKT with a confidence level to predict student performance is more accurate and reliable than using standard iBKT without P(C).
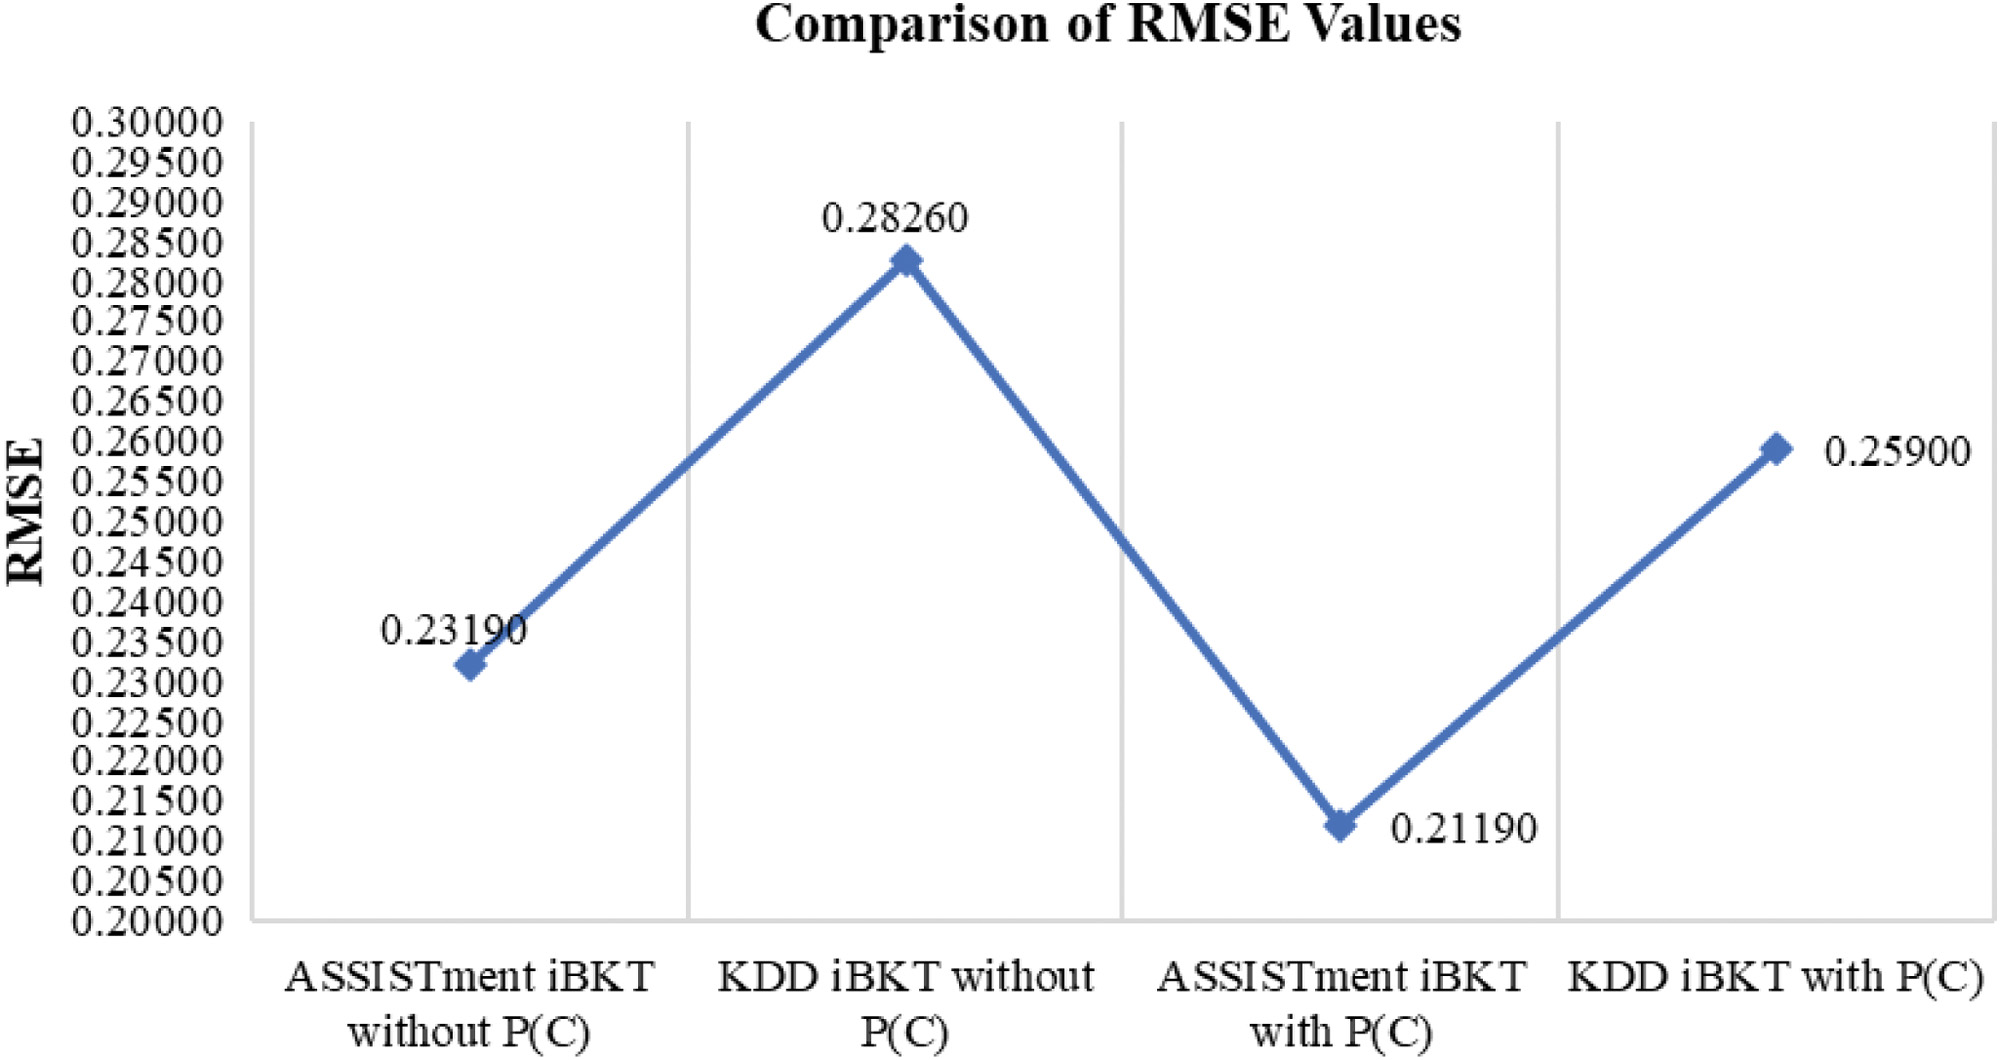 Fig. 8. Comparison of RMSE values for dataset ASSISTment iBKT and KDD iBKT without and with P(C).
V.CONCLUSION
In conclusion, this research analyzed that ITSs are computer systems that aim to improve students’ performance in learning by providing personalized instruction and feedback to the user using AI technology. ITS contains four modules, and this research only focuses on one module, the student’s module, where the prediction and measurement of the student’s performance happened. Predicting student performance in ITS has always been a highlighted issue stated by other researchers. This paper analyzed the available methods to predict students’ performance. We found that iBKT can fill the gap regarding students’ performance prediction. Then, we proposed a new prediction approach by adding a parameter regarding confidence, P(C), to iBKT. We compare the performance accuracy of the iBKT and the enhanced iBKT with the confidence parameter using ASSISTment and KDD datasets. It is observed that since the value of RMSE is lower, the iBKT method with P(C) is more accurate. The ASSISTment dataset shows a low RMSE value compared to KDD. With the result, it is proven that the proposed prediction approach is more reliable and precise. For future studies, we plan to explore ITS predictions apart from student performance in student modules and also to consider other parameters aside from the confidence level to deal with the student uncertainty problem in measuring and predicting the students’ performance in ITS.