I.INTRODUCTION
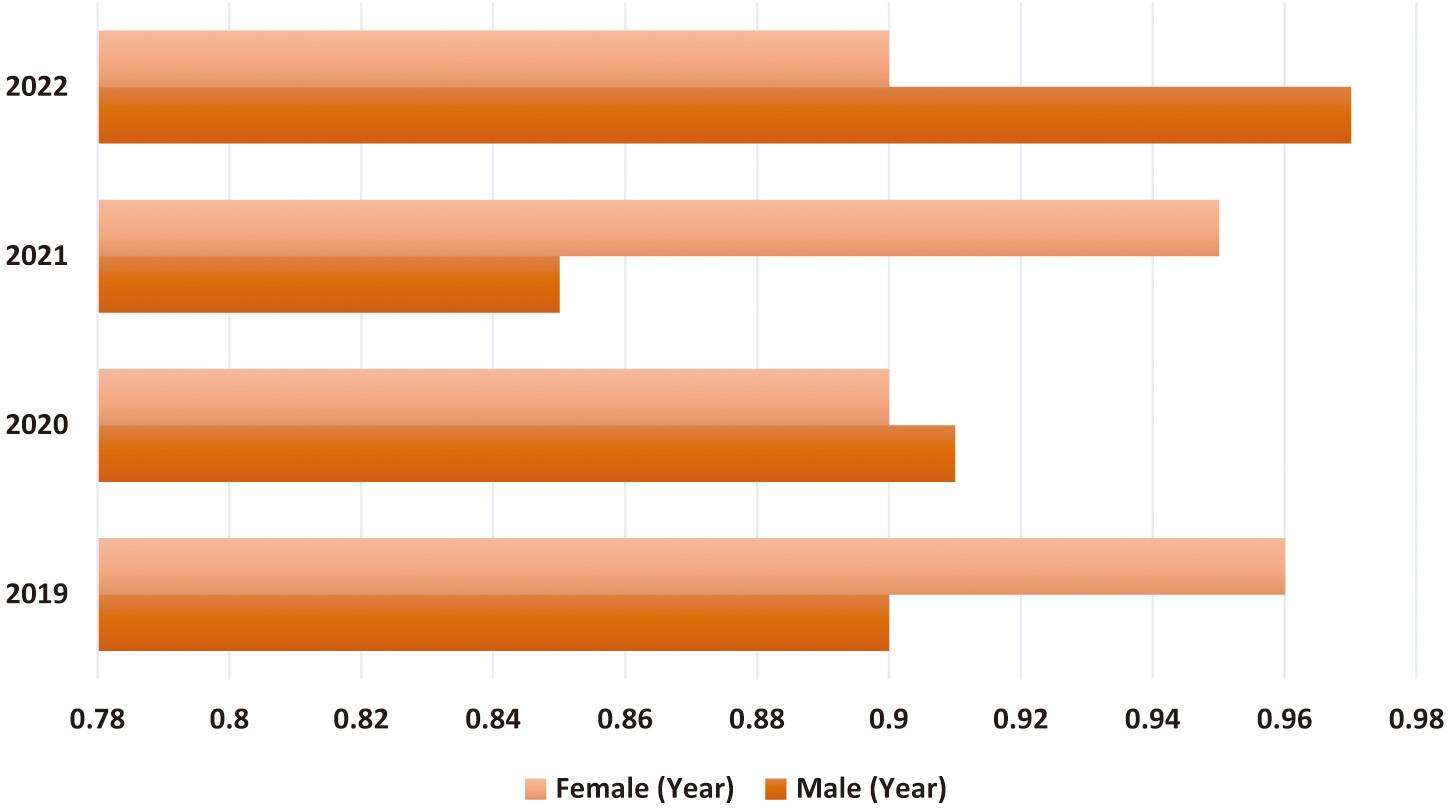
Cancer is the leading cause of death worldwide, surpassing even cardiovascular disease. This year, the United States is projected to have 1,688,784 new cases. That is the same as announcing a cancer diagnosis to around 4,600 individuals daily. Figure 1 is a time series graph depicting the rise and fall of cancer mortality rates in the United States. The annual incidence of new lung cancer cases has been falling over the last decade, and this trend has recently increased. Male lung cancer incidence rates dropped by almost twice as much as female rates. One of the three most common cancers in men and women is lung cancer. Cancer is the most significant cause of death worldwide, with lung cancer being the leading cancer killer for both men and women. The overall cancer survival rate has improved, while the death rate due to lung cancer has stayed constant. The survival rate after five years is far lower, at just 18%. The earlier lung cancer is detected, the higher the chance of survival; this ratio is expected to rise significantly as more is learned about the topic [1].
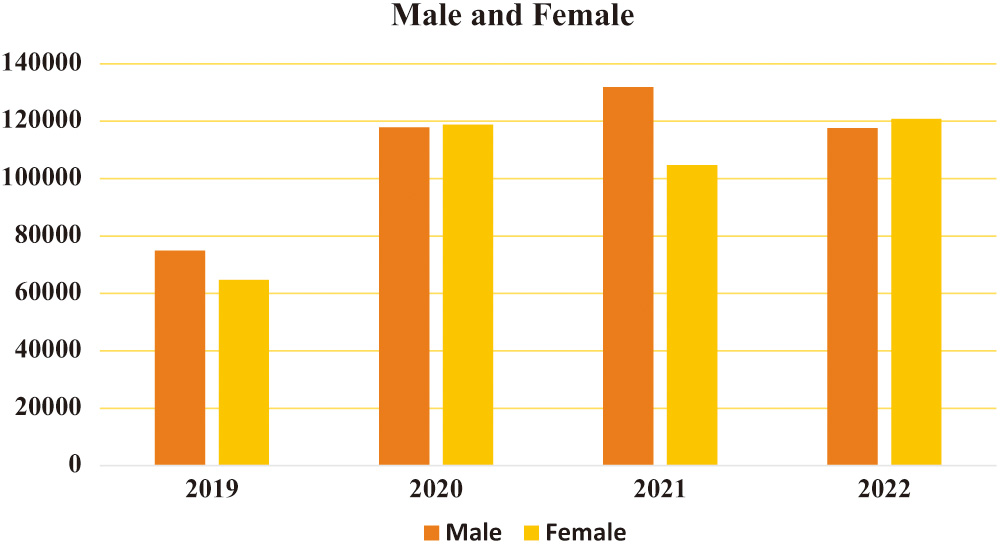 Fig. 1. Rates of occurrence of various malignancies in the United States, 2019–2022.
The primary purpose of the research project “Combining Handcrafted Features and Deep Learning for Automatic Classification of Lung Cancer on CT Scans” is to design and test an all-encompassing strategy for the reliable and automated classification of lung cancer using CT scans. This is possible only by combining deep learning with more conventional, artisanal image characteristics. The study expects that by combining these two approaches, early detection and diagnosis of lung cancer utilizing medical imaging technologies may be improved via increased classification accuracy, sensitivity, and specificity. The abstract should quickly highlight the benefits to clinical practice and how combining these strategies will increase accuracy in identifying lung cancer.
More and more people are turning to low-dose computed tomography (CT) to check for lung cancer. The capability of computed tomography (CT) to identify even the most minor and lowest-contrast nodules is only one of its many advantages over more traditional imaging methods. Detection of lung nodules on CT scans at an early stage is crucial for proper diagnosis and treatment [1]. A person’s chances of living for at least five years following a cancer diagnosis are often called their “five-year survival rate.” The term “five-year survival rate” paints a clearer picture of the situation than any other. This word draws attention to cancer therapy’s multifaceted and continuing nature, highlighting that superior care may result in longer lives. The disturbing fact that cancer treatment success is measured primarily by how long patients live after diagnosis rather than by the concept of a permanent “cure” is reflected in the prevalence of reporting the five-year survival rate. This is made worse by the fact that the success of cancer treatment is often measured by how long a patient lives following diagnosis. This reality reflects the five-year survival rate, a brutal fact mirrored in this reality.
It is standard practice for physicians to look at lesions, investigate, and make inferences based on the nodule’s morphology and the patient’s clinical history. However, there are three significant drawbacks to this strategy. It is remarkable how many instances have been recorded. Given the range of lesions radiologists see, it may take work to provide accurate diagnoses. Inefficient systems might cause patients to lose the best window of opportunity to get treatment [1]. Specific diagnoses are probably given arbitrarily due to differences in the knowledge and experience of individual doctors. The diagnoses made by several medical professionals may not always agree. Because of their physical limitations, doctors cannot fully use the data provided by CT scans. Several things may interfere with a person’s vision, including the human visual system, tiredness, and lack of focus.
As a result, there is a need for an automatic mode that could help clinicians analyze CT images. Less effort would be required to locate and use the nodule, which even seasoned chest radiologists occasionally overlook. This would increase diagnostic accuracy [1]. Nuclear medicine methods such as positron emission tomography (PET) and single photon emission computed tomography (SPECT) are examples of current molecular imaging modalities utilized in clinical practice. Other options include contrast-enhanced computed tomography (CT), magnetic resonance (MR) imaging, and MR spectroscopy. Radiologists routinely examine these pictures visually before reaching any diagnostic findings. Due to the low target-to-background ratio in molecular pictures, subtle differences may be challenging to see by eye. Due to the wide variety of interpreters’ ability levels, clinical visual interpretation is time-consuming and infamously wrong.
CAD technology may help physicians provide more accurate diagnoses based on patient histories. The first step in treating coronary artery disease is diagnosing the problem. Image anomalies may be highlighted for closer inspection using CADe. Doctors have a better chance of detecting and keeping tabs on the issue because of CADx technology. The CADx system does not use information not directly related to making a diagnosis [2]. A CAD for lung cancer screenings consists of three main parts: data collection, nodule candidate segmentation, and nodule type categorization. The nodule type categorization is crucial since it gives clinicians the most relevant data for making a call. Scientists in the field of radionics, a subfield of computer-aided diagnostics, use massive amounts of patient data to derive various quantitative image attributes, which they then use to study different physiological processes. Figure 2 reveals that CAD is used in 23% of lung cancer diagnoses. Therefore, it may be concluded that the diagnostic approach is commonly used by doctors [2]. The line graph shows that CAD has become more helpful in detecting lung cancer. This shows how crucial CAD has become throughout the years. A significant factor in this change might be the growing interest in and use of CAD tools to improve lung cancer diagnosis in clinical imaging.
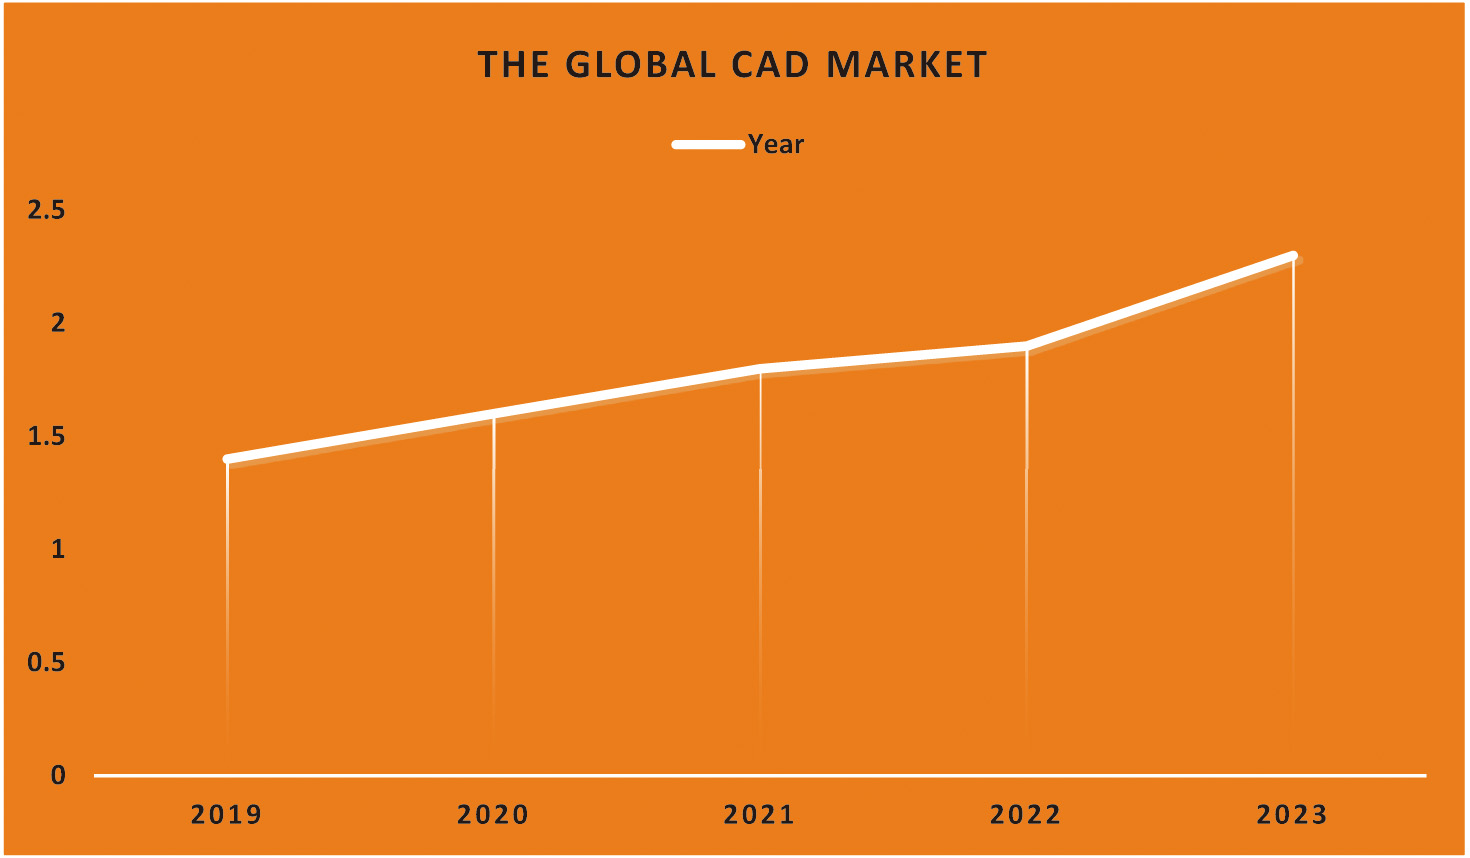 Fig. 2. Demonstration of the CAD market trend and its market share of lung cancer.
For instance, the percentage of those diagnosed with lung cancer using CAD may be shown along the y-axis. A steady and substantial line or bar graph might show the expansion of CAD-based projects. The increasing visibility of CAD implies that it will be used more often in the battle against lung cancer. Due to CAD’s rising profile, it is feasible for more medical facilities and practitioners to use it. Due to its capacity to aid in detecting subtle abnormalities, help radiologists provide more accurate interpretations, and reveal situations that a human inspection alone might have missed. As the graph’s upward trend indicates, CAD is becoming more vital in detecting lung cancer. Clinicians put a premium on CAD because of the potential for early detection to improve patient outcomes (Fig. 3).
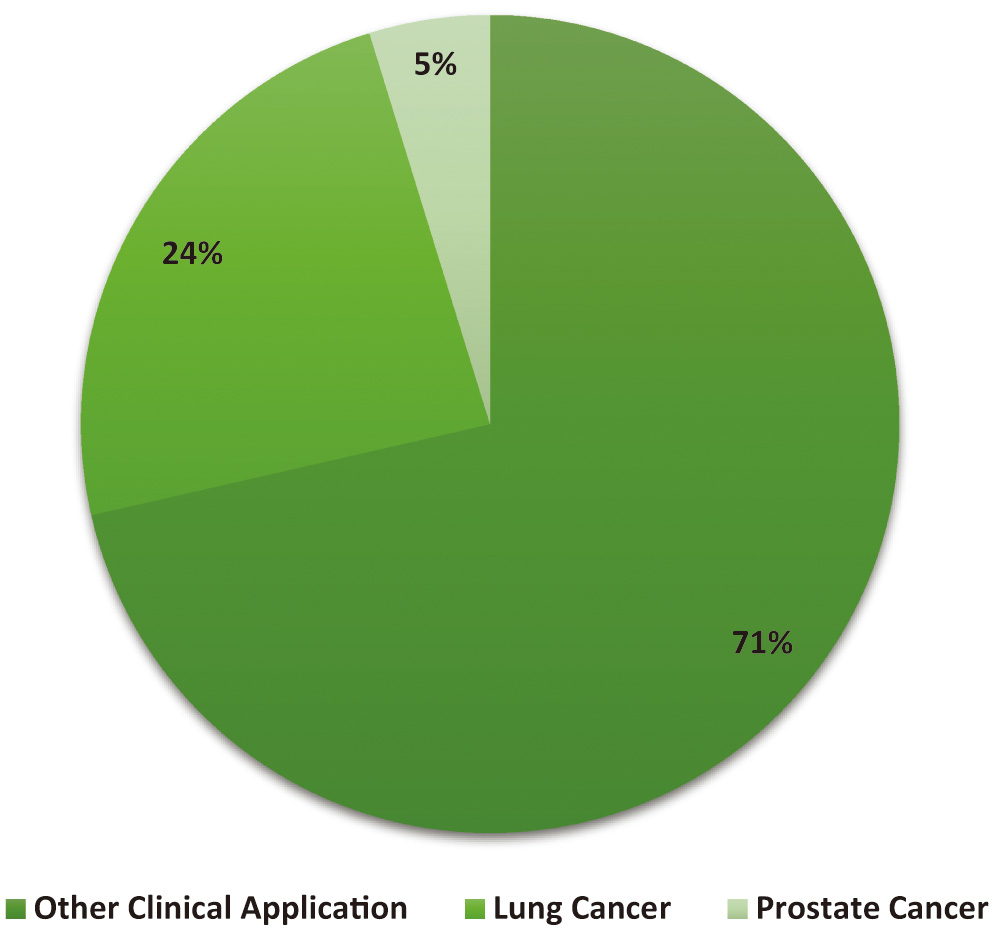 Fig. 3. The growing importance of CAD in the lung cancer industry is show.
This paper investigates CT-based automated classification algorithms for their potential in classifying lung nodules, a crucial sign for identifying lung cancer. Feature extraction and the refinement of classification methods are the main areas of concentration. To begin, they search academic resource aggregators like DBLP and Web of Science for works analogous to those already used in the field. Due to the wide variety of nodules, a categorisation system has been developed [2]. The primary goal of this research is to categorise patients into those with low malignancy who can be treated non-surgically and those with higher malignancy who need surgical treatment. Typical database types are also broken out in great depth. Then, they break down each work of art and explain how it was made. All texts are analyzed and classified using several criteria. They also analyse the methodology’s advantages and disadvantages and discuss how it may be enhanced in the future [2]. As a result of our investigation, we must ensure that the study’s data makes sense and that the research topic is maintained consistently. This is necessary because of the impact on the study’s robustness and repeatability. Paying close attention to these details can increase the trustworthiness of study findings and pave the way for future advancements in automated lung nodule categorization.
II.Literature Review
According to Xie et al. [3], Epidermal growth factor receptor (EGFR) mutations are particularly useful in treating lung adenocarcinomas, one of the most frequent histological subtypes of lung cancer. Patients with EGFR mutations in lung cancer candidates for EGFR tyrosine kinase inhibitor treatment should be identified as soon as feasible. The current gold standard for identifying EGFR mutations is the mutational sequencing of samples. Sun et al. [4] considered that significant advancements have been made. Although EGFR status may be determined by biopsy testing, it may be more challenging due to the vast diversity of lung tumours and the necessity to characterize particular tissue sites. This is due to the broad variety of lung cancers.
Furthermore, there is the possibility of cancer spreading during the biopsy procedure itself. Several factors, such as the rarity of tumour samples, difficulty obtaining tissue samples, low DNA quality, and high cost, may restrict the use of mutational sequencing. In these cases, it is crucial to have access to a simple, non-invasive way of testing for EGFR mutations [3]. The potential for automatic classification to help doctors identify lung nodules has never been more significant. Interest in the research on CT image classification has been sparked by the possibility that it may reduce the need for human labour thanks to the use of computer vision and machine learning methods. In this study, we review the present state of automated lung nodule classification and provide some context on generic frameworks and algorithms. Our results show that deep learning-based approaches are currently preferred for identifying and categorizing lung nodules. Data collection and analysis are pushed to be as consistent as possible. In a time when automated categorization can provide clinicians with expert assessments, collaboration between designers, medical specialists, and other stakeholders is vital.
Wang et al. [5] argue that, for instance, computed tomography (CT) is a non-invasive technique that is increasingly employed in cancer diagnosis and might be used to evaluate lung cancer. Researchers have shown that gene expression patterns in lung cancer may be predicted using CT scans, specifically EGFR profiles. Sun [6] explained that Biopsies have their role, but image analysis is meant to supplement existing knowledge. If they consider the heterogeneity within the tumour itself, for instance, using CT imaging, they may be able to forecast EGFR mutation status. Additionally, they may use CT imaging to ascertain which of the patient’s tumours is more likely to contain an EGFR mutation and, therefore, warrants a biopsy. This procedure is carried out when a significant number of tumours are present. CT imaging requires no special equipment and is widely accessible [6]. In a system that combines expert-defined image characteristics with automated pattern detection using deep learning, lung cancer may be identified from CT scans. To accomplish the intended categorization, this is done. While the interpretability and flexibility of handcrafted features shine brightest in the face of little data, the usefulness of deep learning resides in its power to sift through massive datasets in search of subtle patterns. This synergy makes it more likely that a correct lung cancer diagnosis will be made since it draws on expert knowledge and data-driven insights. Precise segmentation of the tumor is one of the most significant aspects to consider when it comes to planning treatment and assessing how well radiation is acting to treat the illness. This is one of the most critical components. Studies have focused on tumour segmentation based on deep learning and molecular imaging to create powerful tools for clinicians to detect malignancies automatically and consistently enhance diagnosis and therapy [7]. This has been the primary focus of the research. These studies were carried out to develop practical tools for clinical practitioners. These investigations are being carried out to enhance the tools available to clinical practitioners. Post-contrast T1W-MRI is molecular imaging that is of great aid in differentiating necrotic regions from enhancing lesions. This distinction may be made thanks to the use of this imaging technique. This is because it assists in distinguishing between the two distinct kinds of lesions. The company’s name comes from Philips Healthcare, which also developed this imaging strategy. Deep learning models have been trained to utilize multimodality MRI data, including contrast-enhanced T1W, to increase their performance in segmenting brain tumours. This was done to improve the accuracy with which the models could identify brain cancers. This was done to improve the models’ ability to detect brain tumours more precisely.
According to Suresh and Mohan [8], It has been suggested that “radiomics,” a word that incorporates both semantic features and quantitative measurements, might be used to predict whether or not a CT scan would be able to identify an EGFR mutation. Although this strategy is sound, it needs more focus on the EGFR mutation in favour of a more holistic approach. Feature engineering-based radiomics methods depend on human labelling efforts for precise tumour boundary annotation. Because of this, the method’s usefulness is severely limited. Remember that while determining radiomic features, neither the tumour’s microenvironment nor any adjacent tissues are considered.
On the other hand, complex AI models can sidestep these problems by using self-learning strategies like deep learning. Li et al. [7] Deep learning models have shown performance levels on par with human practitioners’ skin cancer recognition, diagnosing eye abnormalities, and forecasting non-invasive liver fibrosis. The reason is that these models readily adjust to new conditions and data. Another area where deep learning algorithms show great promise is identifying lung cancer.
In contrast to feature engineering-based radiomics, deep learning-based radiomics can autonomously train features from image data, removing the requirement for exact tumour border annotation. When compared, radiomics uses a technique based on feature engineering. Deep learning-based radiomics may extract features that are flexible to particular clinical outcomes; in contrast, feature engineering-based radiomics may only represent general traits without the specificity essential for result prediction [9].
The state of automated lung nodule categorization and its recent developments, existing techniques, and current problems are discussed. This research aims to shed light on how well-automated systems can identify lung nodules from medical images, as well as their strengths, weaknesses, and future prospects. This research aims to understand better how automated categorization systems may aid medical diagnosis and decision-making. Saba et al. [10] argue that Lung cancer has a high death rate. How a disease is treated may be radically altered if subgroups of patients are identified. Predicting the results of clinical trials and individual patients may be possible using the histologic phenotype. The non-small-cell subtype of lung cancer accounts for over 80% of all cases (NSCLC). The two most prevalent histological subtypes of non-small cell lung cancer are adenocarcinoma (ADC) and squamous cell carcinoma (SCC), which may arise from small or large airway epithelia. In histopathology, tissue is commonly classified based on visual evaluation under a regular light microscope. This tactic has often proven successful. However, a biopsy may only be able to capture part of the morphological and phenotypic picture of the disease due to the possibility of diversity across and within tumours.
A pathologist may only gain a partial image of the tumour’s surroundings by looking at one or two slides from the tissue block submitted for diagnosis. Afshar et al. [11] Described that the pathologist’s job is now more difficult due to this development. Although diagnostic molecular pathology has the potential to aid in the identification of distinct oncogenic driver mutation patterns for precision oncology in lung malignancies, it has not yet been fully integrated into the standard pathology workflow due to a lack of experienced practitioners and high costs [11]. The study used many metrics, including accuracy, precision, recall, specificity, F1-score, and area under the receiver operating characteristic curve (AUC-ROC), to see whether the combined technique was superior to the individual strategies. Some of the obstacles that deep learning has had to overcome include the complexity of feature engineering, the need for fine-tuning hyperparameters, and the difficulty of obtaining a varied dataset. The high data and resource requirements of deep learning mean that it still needs to be widely used despite its capacity to discern complex patterns. Traditional methods are used because of their interpretability; however, they may need help to detect more complex patterns. There may be historical precedents for addressing these concerns. By analyzing these issues, we can determine whether the combined strategy produces a balanced solution that overcomes the limitations of both methods.
According to Nasrullah et al. [12], given the difficulties in making a correct diagnosis of lung cancer and the limitations of current methods, innovative clinical data evaluation tools are needed to supplement biopsies and help better detect disease features. Computer-aided diagnosis, used in analyzing pathology slides, is one area with the potential to reduce reader variability. Existing methods only partially use the vast quantities of new data available in contemporary clinical practice despite the widespread use of CADx-friendly systems and advancements in digitalising 2-D pathology slides and 3-D microscope photographs. Histologic classification, if updated with routinely obtained radiologic pictures, can modify diagnostic and treatment choices drastically [12]. This introductory section will serve as a foundation for future literature study, which will comprehensively analyse all relevant materials. This research aimed to summarize what has been learned about automated lung nodule categorization recently. In this article, we examine the significance of image processing and CAD in lung cancer diagnosis and the most relevant studies and findings in this area. By systematically reviewing the relevant literature, the field’s current status may be determined, and new areas of study, knowledge gaps, and opportunities for innovation can be uncovered. The context provided here is crucial for understanding the study’s aims and the need for further research.
It has been shown that deep neural networks (DNN), which can integrate input from a wide variety of data modalities, are effective for task-specific high-level feature learning. Several experiments have shown this to be true. For example, consider the training needed to distinguish MRI brain disease findings. This kind of education is crucial. To foresee the evolution of cancer in four patients with brain tumours, we used incremental manifold learning and DNN models. All of these individuals were in the late stages of their illness. First, statistical sampling is used to choose landmarks. Next, the landmarks are used to figure out the manifold skeleton [13].
Finally, the Locally Linear Embedding (LLE) algorithm fits out-of-bag samples into the skeleton. This is the feature extraction process in an incremental manifold learning system. The classifier was trained using a GMM, and features were prioritized based on their Fisher scores. Feature extraction, feature selection, and classification may occur in real time if the data used to retrain the DNN model are unsupervised [14]. Because of this, both processes can happen at the same time. The subsequent supervised modification of the model’s parameters using label information makes this possible. Because of this, the planned outcomes may be realized. When a good training set that has been manually labelled is unavailable, CNN-based models are severely limited in their use. This is because no training set was made available. The most common kind of learning is supervised learning, but there are two alternatives: unsupervised and weakly supervised. A method based on poorly supervised stacked denoising autoencoders was created to separate brain lesions and reduce false positives. The realization that auto-encoder-based models work well for training models with unlabeled data made this feasible. Given the limited size of the LGG data set, transfer learning is essential. Initially, a large quantity of HGG data was used to train a network, and then the network was fine-tuned using data from just 20 instances of LGG. This was done to find the best way to divide LGG into component elements [15].
Regarding tumour segmentation, deep learning models outperform those trained using shallow structures. Deep learning models may derive a more generalized or granular representation of characteristics from visual input. A model’s performance improves compared to those that utilize deep structures or only use shallow structures. This is because the complexity of deep structures exceeds that of shallow ones. Cutting down on the time needed for training deep learning models and preventing their models from being overfit are of the utmost importance.
Singh and Gupta [16], argue that radiomics has advanced in recent years as a method of obtaining quantitative radiographic signals to determine the phenotype of solid tumours. The research supporting such variables’ predictive value and practicality for stratifying patients continues to grow. However, lately, researchers have shifted their focus from manually extracting features to deep learning, particularly to convolutional neural networks (CNNs), which automatically learn representative features from data. After several years of research, scientists have decided to shift their focus away from character trait extraction by hand. Naik and Edla [17] presented that modern multi-parametric algorithms have been developed with the intention of being employed in therapeutic settings where cognitive decision-making is crucial. Integrating such advanced computer vision algorithms into standard medical imaging can significantly enhance the quality of care by assisting with diagnostics and treatment planning for oncologists and pathologists. This aim might be attained by using such strategies. Deep learning frameworks could accurately categorize lung nodules with over 70% sensitivity and specificity. New studies show that CT can identify and diagnose lung nodules with a sensitivity and specificity above 98%. Pathological response of chemo radiation-treated NSCLC was predicted using time-series radiography and deep learning models, with an area under the curve (AUC) of up to 0.7429. Further, radiomics based on deep learning has shown promise in analyzing many anatomical areas linked to disease. With an area under the curve (AUC) of 0.91, our method for predicting the mutational status of low-grade gliomas beats the existing gold standard [17]. Since the combination of deep learning and user-generated characteristics is expected to be more resilient than either method alone, we predict the final accuracy will be greater. This is the best estimate we have at this time. Handcrafted features have the advantages of domain-specific expertise and interpretability, but they may fail to pick up on specific subtle patterns because of this. This holds despite the use of artisanal touches. Despite its complexity and seeming opaqueness, deep learning can accurately identify even the most subtle patterns. If the two are combined, the model may reap advantages from both features, those developed by humans and those learned by the model via deep learning. By integrating these two models, the accuracy of the resultant model will increase. This is based on studies done in the past. This is because the model might pick up insights from the traits and representations already created by professionals in the industry.
III.Methodology
Two main avenues of inquiry may be used when deciding how to categorize nodules seen on CT scans of the lung. The size, form, and position of nodules may be used to classify them into at least six distinct categories, with two additional classes being feasible (based on the rating of malignant). See Fig. 4 for a discussion of their challenges when classifying lung nodules. Possible resolutions to these two problems are explored further below [18]. In this study, researchers used CT images to classify lung cancer using convolutional neural networks (CNNs). Since CNNs can automatically learn hierarchical features from raw data, they excel in image analysis applications. The research most likely used variants of well-established CNN architectures for the picture categorization tasks. These systems utilize numerous layers of convolutional and pooling procedures to capture more abstract characteristics. In order to make use of insights gained from other domains, it is possible that transfer learning was used. This is a method where pre-trained models on massive datasets are fine-tuned for particular tasks. To correctly categorise lung cancer, this selection of deep learning models is meant to efficiently capture complicated patterns within the CT scan pictures.
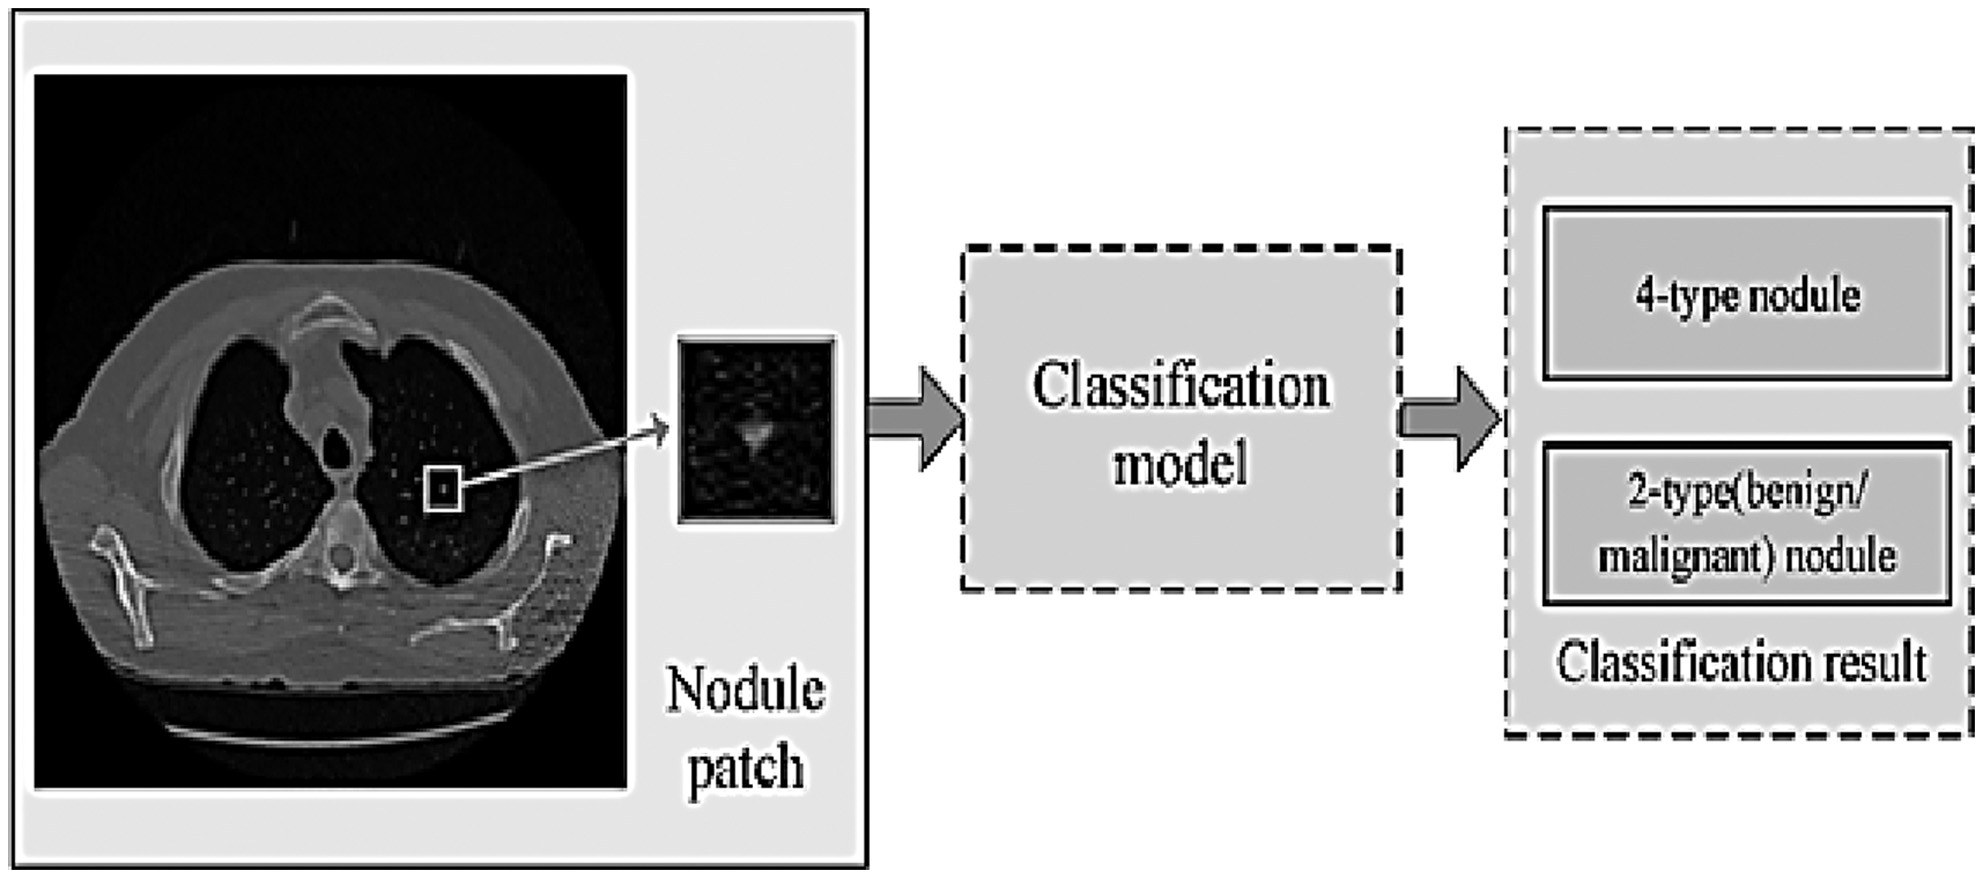 Fig. 4. These are the problem statements about the categorization of lung nodules in this investigation.
A.FOUR-TYPE NODULE CLASSIFICATION
Spherical nodules, sometimes known as tiny lumps, may occasionally be seen on a scan of the lungs. Nodules can distort the natural forms of essential organs and the pleura due to their proximity to these structures. Because of this, the most typical way to recognize this abnormality is based on the visual characteristics of the lung nodule and the areas around it. Pleural-tail nodules (P) are located adjacent to the pleural but are only connected by a thin tail, in contrast to juxta-pleural nodules (J), which are attached to the surface of the pleura. This particular form of organization is used by the great majority of individuals (Fig. 5) [18].
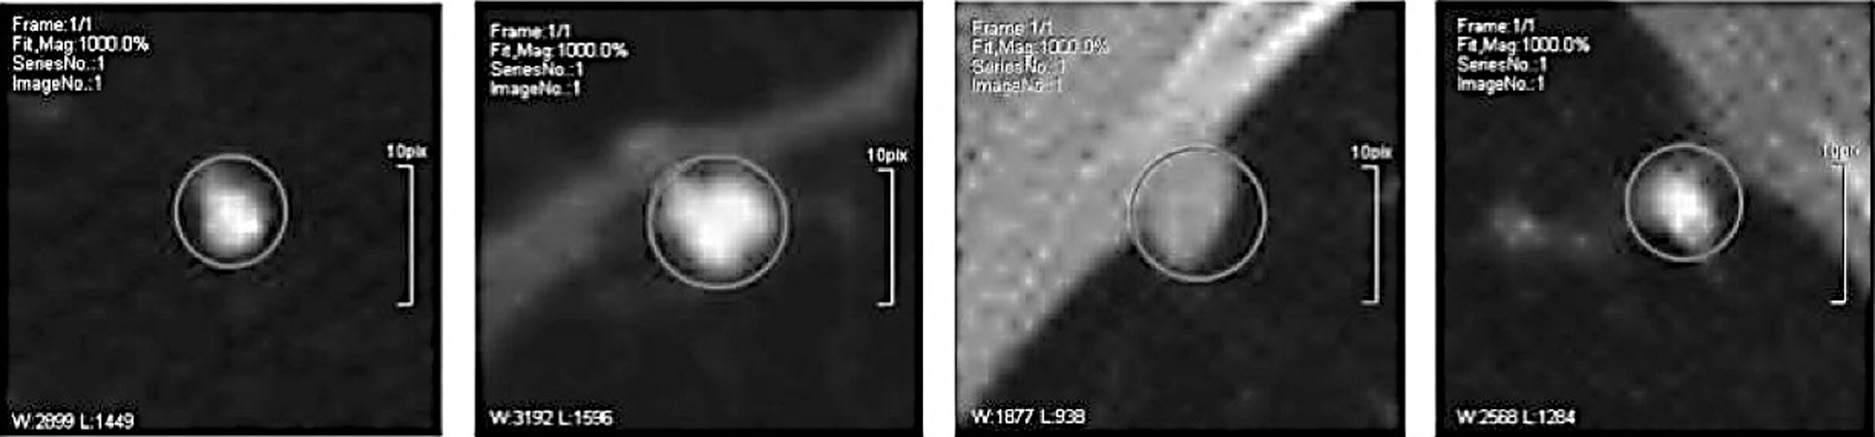 Fig. 5. CT images of four distinct lung nodules are shown.
As a direct result, one can infer that a sizable number of professionals working in the medical field support the use of computer-aided diagnosis (CAD) in the process of making diagnoses. This finding is likely the direct result of the greater emphasis that medical professionals place on CAD technology to assist them in providing accurate diagnoses. This conclusion may be deduced as a direct consequence of the increasing reliance that medical professionals are placing on CAD technology. CAD plays a vital role in the interpretation of medical pictures and in offering insights that enhance the knowledge and skills of medical professionals since CAD is now an essential component of the diagnostic process. This is abundantly clear because CAD is now an integral component of the diagnostic process. This discovery demonstrates the rising realization that computer-aided diagnosis (CAD) has the potential to boost diagnostic accuracy as well as patient care across a vast spectrum of medical subspecialties.
This problem has been the subject of several documented efforts to find a solution. The input patches are images of lung nodules; the output is the kind of nodule detected. Formally, as shown by the following equation (1) [18].
B.TYPE NODULE CLASSIFICATION
Nodule classification (benign/malignant grade) has been studied extensively because of its perceived complexity. They also have a method for determining whether or not a nodule in the lungs is cancerous. Equivalent with y representing the nodule’s cancerous. Figure 6 depicts many distinct malignant nodule forms [18].
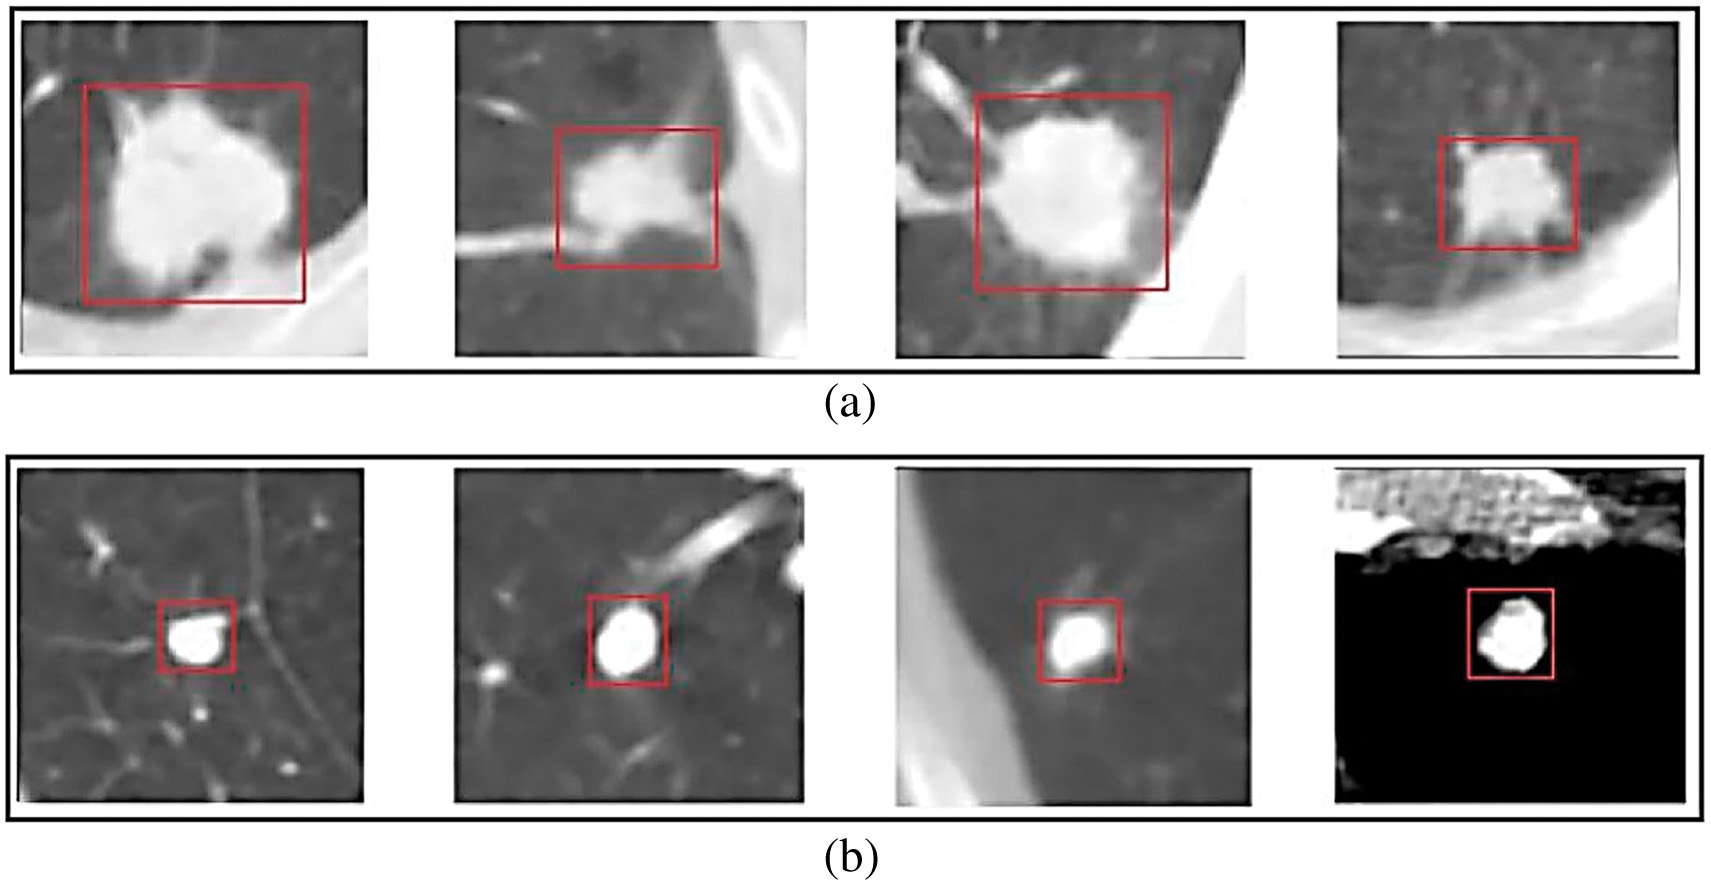 Fig. 6. Suspect patients with a high malignancy rate.
Figure 6 depicts the apparent connection between suspicious person detection rates and cancer incidence rates in populations where such rates were identified. The link is graphically shown in this article. Patients with blatant signs of illness or abnormalities on diagnostic imaging are called “suspects. Some people with cancer diagnoses are instantly assumed to be guilty. When a patient’s cancer is suspected, more testing is performed. The figure likely depicts a distribution of individuals with their respective malignancy rates, showing the diversity in these rates among those suspected of having the condition. This graphic may be helpful for pattern recognition since it shows how specific characteristics and experiences are associated with higher or lower cancer rates. Since we do not have ready access to Fig. 6, we cannot comprehensively analyse the correlation between complex patients and cancerous growths. (The availability of the ground truth dataset is essential for training and evaluating proposed algorithms for lung nodule image categorization. Due to regulations and patients’ rights to privacy, the healthcare sector has a more challenging difficulty than other businesses getting datasets. In light of this, some studies aggregate data from public and private resources like databases and hospitals.) [19]. The primary goal of this work is to categorize the many kinds of lung nodules that might appear on a CT scan. We closely examine the Type Nodule Classification and the Four-Type Nodule Classification to see which works best for categorizing nodules. According to the Type Nodule Classification, nodules may be benign or cancerous. According to the Four-Type Nodule Classification, nodules are divided into benign, intermediate, and malignant types. Based on their size, form, and location, nodules may fall into one of six categories in the Four-Type Nodule Classification system (with two more categories possible depending on the nodule’s malignant potential). There are many risks associated with this treatment, and one of them is that the nodule might distort and change the shape of the nearby organs. It takes more experience to tell the pleural-tail nodules apart from the juxta-pleural nodules. Using the Type Nodule Classification system, it may be challenging to tell whether a nodule is benign or malignant. It is difficult for the study team to acquire access to the information they need because of the rigorous privacy laws that apply to the healthcare industry.
C.LIDC-IDRI AND LIDC
This data repository was built by the National Cancer Institute (NCI). Data from seven academic institutions and eight medical imaging businesses were used in this study of lung cancer in its earliest stages.
In LIDC 1.0, there were 399 distinct scans. LIDC and IDRI pooled their resources to scan 1,010 persons. A panel of four experienced radiologists reviewed each CT scan twice, once using an XML file to document their findings and once referring back to the original picture and making notations like LIDC. It used to be the case that during the blind read, each radiologist was responsible for doing their reading and assigning their scores [19]. Once the first blinding phase was complete, the data was collected and sent back to the original radiologists. The radiology team concluded after comparing their results with those of the other three specialists. After reviewing the data and making detailed notes, the radiologists concluded. Lung nodules may be named in two stages without requiring consensus. Nodules more prominent than 3 millimetres in diameter were classified separately from smaller nodules and those that were not nodules at all (greater than or equal to 3 mm in size) [19].
Four radiologists’ reports were pooled into a single XML file detailing the CT series. Outlines and quality ratings were supplied for all nodules more prominent than 3 mm, whereas smaller nodules received just 3-D centre-of-mass and location estimates. “The figure in Fig. 7 is easily understood since it employs common symbols. Table I displays the most prevalent forms of nodules [19].
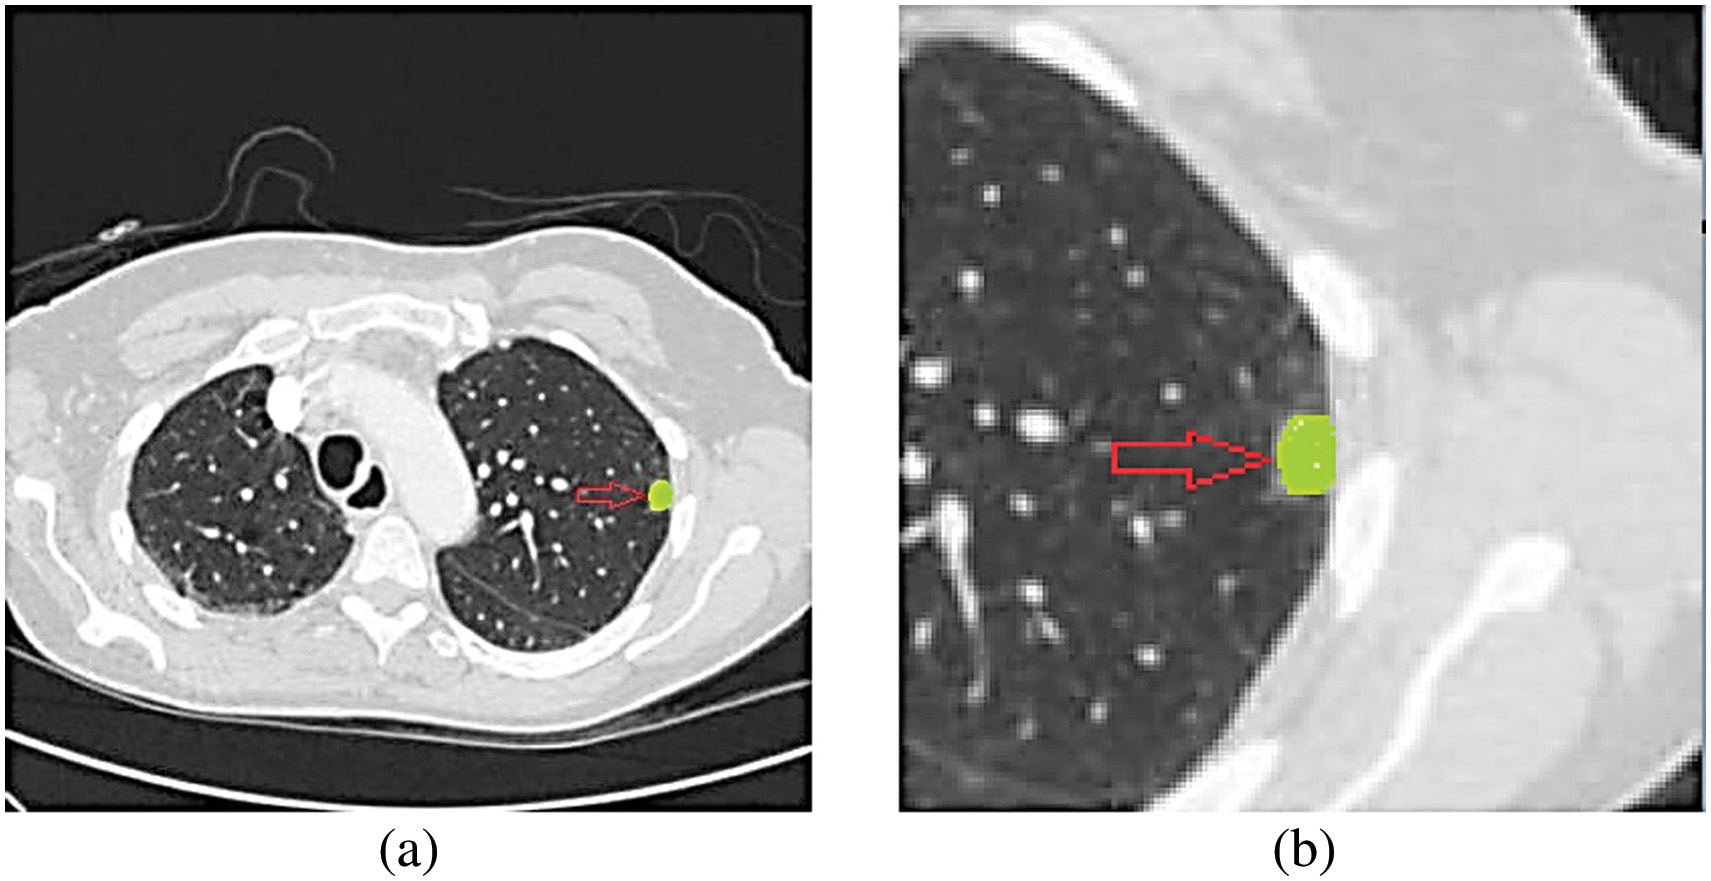
Table I. Description from LIDC-IDRI
| Case | Nodule ID | X Loc. | Y Loc. | Z Loc. | Detailed nodule outline | Cancers |
|---|---|---|---|---|---|---|
| Nodule 002 | 195 | 291 | 38 | (189,279), (188,279), …, (190,282), (189,282) | 4 | |
| IL057_159748 | 292 | 267 | 31 | (289,281), (290,280), …, (288,280), (289,282) | 4 | |
| Nodule 005 | 178 | 281 | 11 | – | – | |
| Nodule 006 | 362 | 331 | 107 | – | – |
Separate columns in the data table provide different information about a nodule. Principal identifiers of the patient are recorded in the first column. The numbers for the various nodules are listed in the second column. The third and fourth digits of the node ID indicate the x and y coordinates, respectively. The Z-coordinate of a nodule indicates the particular slice utilized to outline the nodule. Locations of the nodule’s edges in coordinates are listed in column 6. According to the statistics in the third to last column, radiologists are unlikely to diagnose this nodule as malignant. The top two rows represent nodules more significant than 3 millimetres in diameter, while the bottom two rows describe nodules less than that size [20].
D.ELCAP PUBLIC LUNG IMAGE DATABASE
Information from the Early Lung Cancer Action Program database became available to the public. The ELCAP and VIA research teams collaborated to build a consolidated database that can be used to evaluate the relative merits of different CAD applications. In all, 380 images of lung nodules and 51 whole-lung CT scans with verified low radiation exposures went into the creation of this database. The CT scans were performed with a slice thickness of 1.26 millimetres, and patients were instructed to keep their mouths closed and not breathe during the procedure. Additionally, the patient had access to the radiologist’s pinpointed nodule locations [20].
In ELCAP, nodule sizes were smaller than in LIDC-IDRI, and non-nodules were omitted from the study. Instead, IDRI sizes were more significant in LIDC-nodule LIDCs. A CSV file was included with each instance, providing the median positions of each nodule in Table II. Each column depicts a single lung nodule. The scan ID is shown in the first column. Using columns 3 and 4, locate the centre of the nodule. In the last column, you will get the precise location of the nodule on this slice. The ELCAP scanner was used to acquire the CT image of the lungs, as seen in Fig. 8 [20].
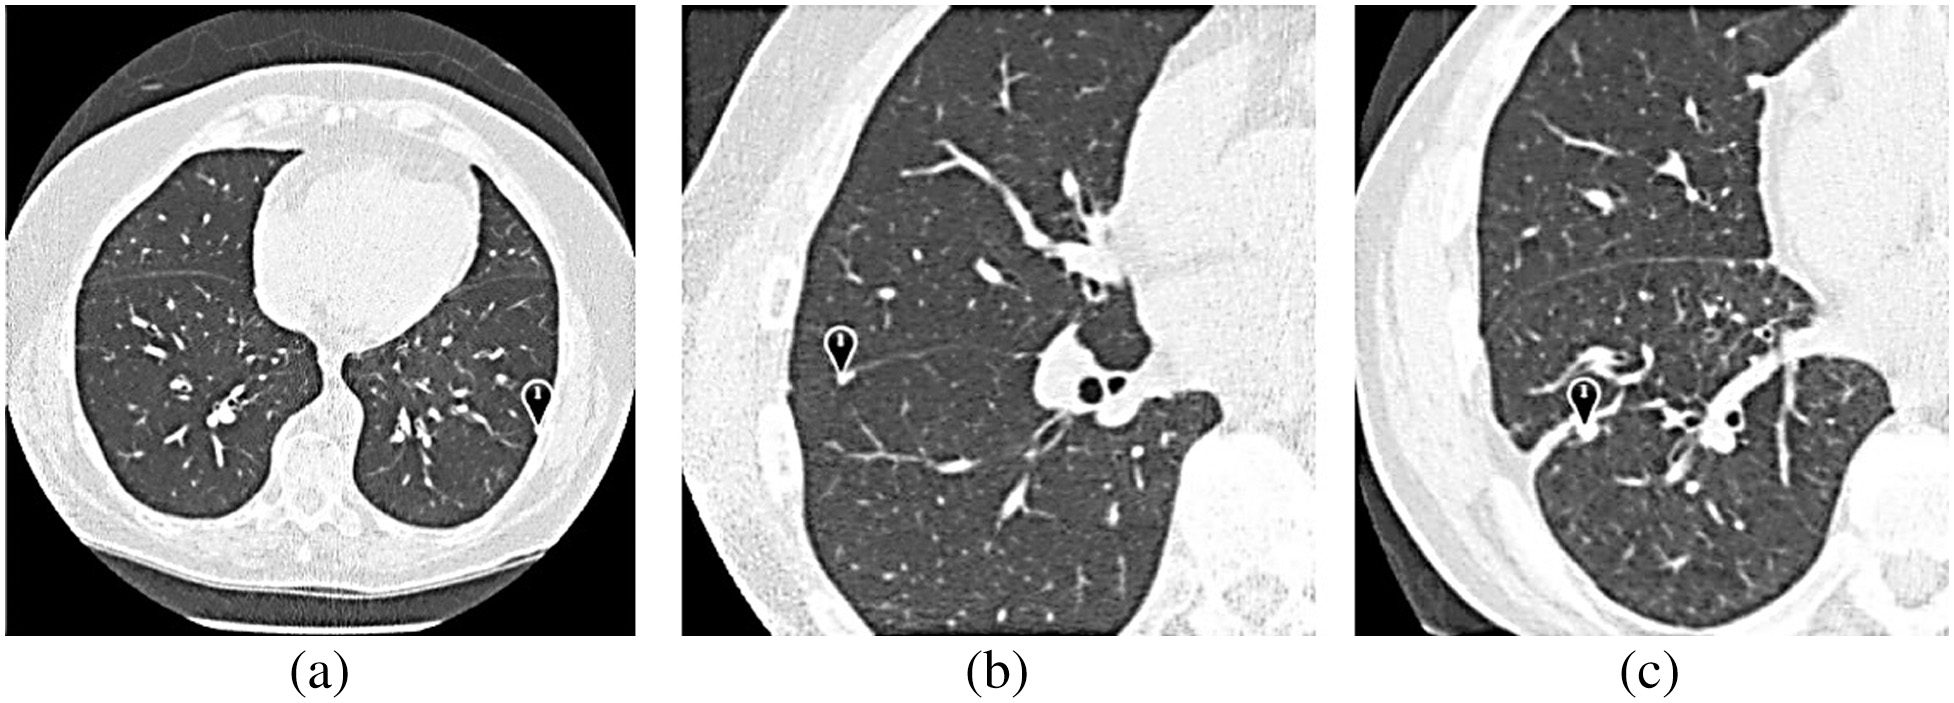 Fig. 8. Explanation and display of ELCAP CT scans of the lungs.
Table II. Positional schema for lung nodules
| Scan | Type | X | Y | Portion |
|---|---|---|---|---|
| 99 | 217 | 55 | ||
| 55 | 225 | 171 | ||
| 159 | 357 | 81 | ||
| 121 | 248 | 67 | ||
| 110 | 259 | 130 | ||
| 71 | 225 | 112 |
The ELCAP can provide lung scans, like the one shown in Fig. 8, and the findings of these scans can potentially lead to detecting abnormalities or other occurrences that were not previously detected. Using some form of visual aid makes it easier to determine the exact anomalies that have occurred. The pleural effusion could appear on a CT scan as a ground-glass opacity, a pleural nodule, a pleural mass, or pleural consolidation. There is potential for every one of these expressions. This picture might point to the outward manifestations of various diseases, which would help medical professionals arrive at a more precise diagnosis. Even though the imaging data are required for a more in-depth explanation, Fig. 8 offers a visual picture of the abnormalities. There were 155 nodules and 94 non-nodule records located in the database. The patients’ ages, sexes, degrees of subtlety, nodule sizes, and geographic locations were also recorded. It was standard practice for CT scans to be evaluated annually by a smaller, regional facility and a more extensive, centralized facility. Automatic nodule detection and segmentation, semi-automatic nodule volume assessment, categorization of nodules as benign or malignant, and measurement of nodule size difference are all possible functions. The database used by Automatic Nodule Detection consisted of fifty test scans and five instances. The method compares several nodule detection strategies. Data collected by any institution may be made publicly available online for evaluation. Research published in the literature often draws on data collected from both public and private hospitals. Users seldom use these databases, and as a result, they only provide a little in the way of depth [20].
IV.EXPERIMENTAL RESULTS
Existing research often begins with feature extraction before feeding the data into a classifier since this is the conventional procedure for studies that use traditional machine learning algorithms. The chosen works draw on deep-learning techniques, including the standard data feeding into a neural network to identify patterns. In a separate area, convolutional neural networks (CNNs) and softmax classifiers carry out the whole classification process from beginning to finish. Experimenting with feature extraction from 3D photographs may be done using either the standard ML features or the deep features offered by 3D convolutional neural networks. The methods used and findings from the studies chosen are summarized in Table III. Each table has to include a title, authors, publication date, data type, and results [21].
Table III. Primary methods and a contrastive study of the two-fold categorization
| Year | Record | Landscapes | Classifier | Routine |
|---|---|---|---|---|
| 2022 | LIDC-IDRI 1 | U, D 1 | ANNs 1 | 0.8130 |
| 2022 | LIDC-IDRI 2 | U 2 | Spectrum grouping 2 | 17.4% |
| 2022 | LIDC-IDRI 3 | G 3 | CBIR 3 | 91.9% |
| 2022 | LIDC-IDRI 4 | D, 3D 4 | CNNs 4 | 0.9549 |
| 2022 | LIDC-IDRI 4 | U, D, 3D 5 | CNNs 5 | 91.7% |
V.RESULTS AND DISCUSSION
Since many papers are already showing interest in the classification of lung nodule photos, it is clear that this is a vital field of research with a bright future. Over the last several years, there has been a clear and consistent rise in the efficiency of various reported algorithms. Some systems now have an accuracy above 91%, thanks to recent improvements. While much progress has been made, there are still specific concerns to remember, such as when comparing the findings of different datasets. Most performance measurements are based on petite sample sizes, making it difficult to assess the efficacy of various approaches. The significance level test concludes that more is needed. In some instances, anonymized data analysis is required. Re-implementing it would be challenging, creating more work for scientists in the long run [21]. The studies that analyzed CT images of lung cancer patients and classified them into different types relied on manually generated characteristics. Essential aspects of the images were captured using these characteristics. Some examples of these features include the statistical measures of the pixel intensity distribution, the size and shape of nodules, and the anatomical and physiological environment of the lungs and blood vessels. These elements were handcrafted and provided essential information on the peculiarities of cancer-related lung nodules. The classification procedure will benefit from adding these characteristics to better distinguish between cancerous and healthy tissue (Fig. 9).
Tagging photos of lung nodules is a straightforward machine-learning classification task. Extraction and expression of features are more crucial than developing a classifier for this classification problem. As a result, feature engineering is receiving much attention in the scientific community. Figure 10 depicts the essential patterns in the development of technology. Prior to 2019, user-defined feature-based techniques were often used. Recent research has seen an almost complete shift toward feature-based methods. Advances in computer vision and machine learning have been the primary factors behind the evolution of lung nodule picture classification [21]. According to the supplementary text, low-dose CT scans are gaining ground as a diagnostic tool because they may be able to identify even tiny, low-contrast lesions characteristic of lung cancer. Lung nodules are more likely to be correctly recognized and treated if they are discovered at a younger stage. There are limits to what can be learned about a patient’s health from a medical history and physical examination. CAD software might enhance patient care to speed up diagnosis and decrease waiting times. The three main pillars of lung cancer screening are information gathering, nodule segmentation, and nodule classification. The classification of nodules is emphasized as a crucial step in making well-informed choices concerning lung cancer and CAD management. Researchers have identified a variety of quantitative image qualities from patient data that may be used to enhance the accuracy of CAD algorithms. Before feature extraction and deep learning can occur, CT images undergo pretreatment therapy. The report’s appendices might include helpful ideas for preprocessing. The importance of various preprocessing procedures varies with the study’s goals, the nature of the data, and the model’s design.
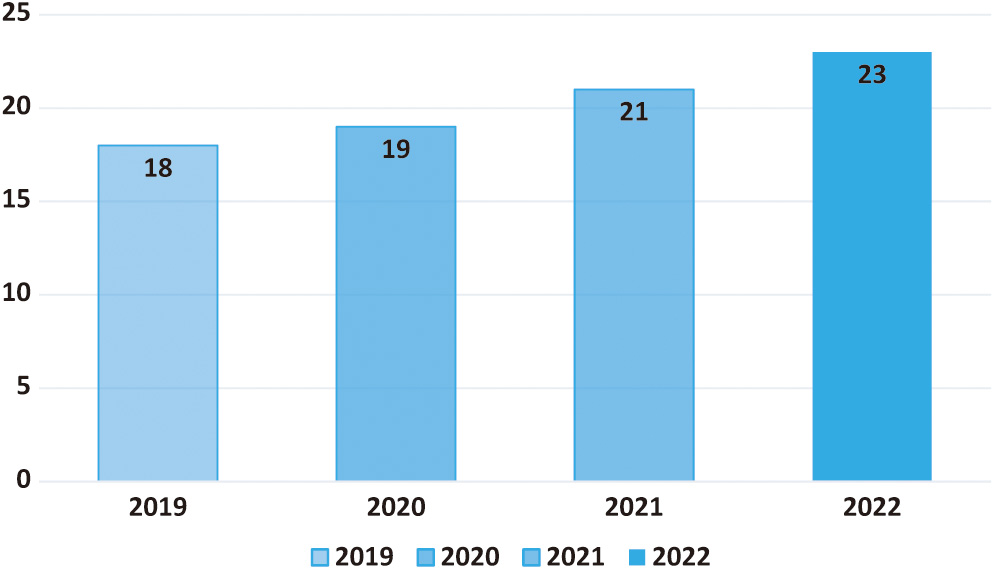 Fig. 10. Trends of the technology used in this field.
One advantage is that they are simple to implement, and another is that they may interpret user-defined characteristics. They could infer a 92.3% success rate from the available data and the characteristics of the effort intensity. When texture and semantic characteristics were used, the AUC was 0.918, and the accuracy was 91.8%. Accuracy is achieved just via understanding of texture. Research suggests that using nodule regions in addition to the surrounding space may improve classification accuracy since nodule areas alone do not offer the extra context information that surrounding space does [21]. Several studies have shown that considering patients’ age, gender, and ethnicity may improve decision-making. These methods have shortcomings because of their dependence on experts’ subjective interpretation and analysis of the nodular image. Not all of these approaches are universally applicable, and they are not all standardized. Specialist knowledge is required since handcrafted variables extract features from nodules. It makes too many assumptions and is often dogmatic because of an excessive reliance on one’s senses. There are many unproven assumptions, and the fact that it was condensed and fine-tuned from so few medical imaging samples makes it very unlikely to be extremely useful [22].
Generalized image features are used to derive intermediate-level information from a lung nodule. A growing number of computer scientists and engineers are interested in this area since it is theoretically expressible and rigorous. These methods have limitations and cannot be used to create intricate patterns. However, many of the characteristics produced by broad approaches are irrelevant to the work or purpose, reducing the classification accuracy of chosen features compared to other techniques. The fact that the criteria used to evaluate generic features are not specific to any application space does not help the situation. Adding custom characteristics from the user might improve almost every one of these methods [22].
The overall incidence of lung cancer has been decreasing at a similar pace for men and women, but the fall has been almost twice as quick for men. These figures show that men are faring better than women regarding the number of newly reported cases of the illness. One’s genetic makeup, the health of one’s family, and one’s smoking habits are all potential contributors to this disease. Because of this striking difference, studies must be conducted to create cancer prevention and treatment strategies tailored to men and women. An image of a lung nodule is analyzed using deep features to determine critical information about the lesion. They may acquire remarkable representational power by giving them a vast amount of training data and a sophisticated framework. Deep learning theoretically beats classical machine learning techniques. This is how the visual cortex of both animals and humans works. In tests, nodules proved to be almost 100% accurate [22]. It was found that 5.42% of tumours were wrongly classified as benign or malignant. When uncommon characteristics are coupled with more prominent ones, lung nodules may seem more realistic.
Techniques like multi-scale and multi-view networks are often used as examples of this. In theory, deep neural networks can never be surpassed by shallow-layer models. Each successive level of the representational hierarchy necessitates extracting and representing an increasingly complex set of features. Since the complexity of the shown componential feature structure is squared, the structure’s utility increases exponentially with increasing complexity. For classification purposes, deep learning’s abstract representation at a higher level is invaluable. The combination might be used to simplify the explanation of complex functions. At the most granular levels of feature representation, the most salient and distinguishing information is extracted, while the less crucial ones are discarded [23].
The “Experimental Results” section is crucial to the research since it gives the results of the tests in a well-organized fashion. In-depth data, statistical analysis, and quantitative evaluations are presented in the “Experimental Results” part, while a more narrative summary is provided in the “Results and Discussion” section. This section describes the experiments, methods, and accurate numerical findings achieved to meet the demand for openness and precision in scientific investigation. If people can judge whether or not research is valid, reliable, and reproducible, they will be more likely to accept its findings. Regrettably, there are some significant limitations to using deep learning with medical imaging. It is possible for overfitting to occur if there needs to be more high-quality training data. Even more concerning, deep learning algorithms are often opaque. Experts’ opinions are challenging to incorporate into these approaches and difficult to understand. Meanwhile, balancing training speed, accuracy, and model size is challenging. They need in-depth computational planning and skilled tuning specialists [23].
The standard practice also calls for retrieving user-defined and generic features separately. Innumerable investigations have shown that the support vector machine is the superior method of data categorization (SVM). During training, these characteristics are sent into a support vector machine classifier singly or pooled (bag of visual words, fisher vector). There needs to be a strategy to extract and communicate nodule properties on a regional or global scale, which is the fundamental problem. It is important to note that the most essential feature extraction and classification forms are separate. Extracting nodule characteristics using data-driven convolutional neural networks (DCNNs) offers a complete technique [23]. They might try back-propagating the loss to previous layers if they want to improve feature extraction. Automated recognition of the hierarchical relationships between attributes might replace the laborious process of manually generating each one. Typically, DCNNs have a first layer that extracts the most elementary features like edges, lines, and points. Integrating these essential characteristics layer by layer may allow for a more accurate representation of critical portions of the organ or the whole organ by small neurons at higher levels. By exchanging parameters and shrinking the data dimension, DCNNs may preserve local feature relations. Because big data is pervasive, deep learning is increasingly used in the healthcare industry [23].
The findings of this research will probably have significant implications, both clinically and theoretically, for the process by which lung cancer is diagnosed. For automated lung nodule classification, where the end aim is to detect possibly malignant nodules in medical imaging, the use of human-crafted features in combination with deep learning approaches may prove advantageous. If the diagnostic procedures could be sped up, patients may start treatment earlier, benefiting everyone involved. This one-of-a-kind technique has the potential to lay the groundwork for the creation of innovative computer-aided diagnostic tools that may be used by oncologists and radiologists in the future. The findings improved the detection and treatment of lung cancer and the patient’s overall prognosis. There has been a meteoric rise in the usage of 3D feature approaches in the last few years as more and more projects include them in their workflows. They may strive to take in more of the scene, collect stereoscopic data, and learn anything new to portray the scene’s features better. Such methods are compatible with both shallow and deep features and those chosen by the user. It has been shown that, compared to 2D approaches, 3D algorithms are both slower and provide no meaningful improvements. Ever since their introduction, scepticism about the effectiveness of these techniques has been widespread; addressing this scepticism has been a top focus. One factor propelling and another slowing industrial expansion is the difficulty of collecting and organizing 3D data sets. Therefore, to complete the classification of lung nodules, numerous state-of-the-art deep models use multi-view 2D CNNs or 2D CNNs with different views to simulate the volume of 3D images [23].
VI.CONCLUSION
This study aimed to evaluate the approaches presently used to classify lung nodules based on CT scans. The procedure starts with a literature review, during which temporal issues are recognized, and datasets are characterized by the literature. The selected works will be examined thoroughly. It is suggested that CT-detected lung nodules be classified according to their size, shape, and location. The methods and factors discussed in the context of lung nodule categorization may need substantial modification before they can be applied to other forms of cancer or other medical imaging endeavours. Imaging findings, tumour development patterns, and other pertinent parameters may vary significantly among cancer types, necessitating novel ways of categorization. However, common classification strategies, such as visual analysis and relevant traits, may aid in developing classification systems for various cancers. Changing the system to accommodate each kind of cancer’s unique characteristics and diagnostic requirements is a formidable task. The suggested categorization method has been developed for lung nodules, but its ideas may inspire comparable efforts about other malignancies or medical imaging. However, adjusting well would require contemplation of how to handle the peculiarities of various healthcare settings.
It is possible to categorize these works into many categories based on the variety of lung nodule imagery available. The findings, methods, and benchmark datasets are all described. Furthermore, some further research recommendations are offered. This discovery opens up many interesting new lines of inquiry into the early diagnosis of lung cancer. To make the classification system more accurate and easier to understand, the first step is to look into the possibility of adding more advanced deep learning architectures, such as attention mechanisms and transformer-based models. Second, its utility would increase if used not only for CT scans but also for positron emission tomography (PET) and magnetic resonance imaging (MRI). Broad ramifications for medical diagnosis might be realized if the suggested combination approach is demonstrated to be relevant to various forms of cancer or other medical conditions. Reducing dependence on manually produced features and incorporating domain-specific information into the feature engineering process may help increase production. Finally, collaboration between medical and machine learning specialists may shed fresh light on long-standing problems.
Results from this research demonstrate that deep learning-based technologies are currently the gold standard due to their superior performance. Lung nodules may be represented more accurately in 3D using a feature-based approach. More robust models and algorithms are not needed to improve understanding and interpretation; instead, there must be close cooperation between academics and medical professionals. The data utilized to train and evaluate the categorization system in the research presumably came from medical archives or databases. The researchers looked at these venues for their findings. This action was taken to improve the system with greater probability. It was made up of CT scan images of people with lung issues (both malignant and non-cancerous) and a label that explained the patient’s diagnosis. Essential selection criteria included an adequate amount of data to cover a variety of use cases, the addition of data to increase diversity, the separation of data into training, validation, and testing subsets, in-depth annotation by domain-specific experts, preprocessing that included scaling and normalization, and the correction of class imbalance. After considering these aspects, developing a deep-learning model that accurately detects lung cancer was a breeze.
VII.FUTURE SCOPE
CT scan pictures must undergo a series of preprocessing steps, including manual tumour identification, isotropic rescaling, and density normalization. The physicians used their own “seed spots” to zero down on the parts of the tumour that needed attention. After analysing each transverse slice individually, the open-source 3D Slicer application finds a seed point in the centre of the tumour region. They construct 3D volumes with the help of these seed points and then extract 2D input tiles that are 50 mm by 50 mm in size from those volumes. The image data were rescaled isotropic ally with a linear interpolator so there would be less of a chance of artefacts appearing in the final result. The end outcome is that each isotropic pixel has a consistent spatial representation of 1 millimetre. In addition, linear processing was carried out to obtain a normalized density by finding the mean and then removing it.