I.INTRODUCTION
The most prevalent form of skin cancer, melanoma, is also one of the most frequent forms of cancer overall. Melanoma, squamous cell carcinoma, basal cell carcinoma, and intraepithelial carcinoma are the four most frequent forms of skin cancer, although there are many more. Intraepithelial carcinoma and basal cell carcinoma are two other kinds. Human skin consists of three layers: the hypodermis, the epidermis, and the dermis. Melanocytes are a kind of cell that may show up in the dermis, or the top layer of skin. Rapid melanin production is a unique property of these cells [1]. Exposure to greater levels of UV radiation from light over a longer period of time, for instance, may initiate melanin synthesis. The most lethal kind of skin cancer, known as malignant melanoma, has been linked to an increase in melanocytes. The American Cancer Society has released estimates predicting that there would be 96,480 new cases of melanoma in 2019 with an associated death toll of 7,230. A proper treatment plan can only be implemented if an accurate diagnosis of melanoma has been made. There is a 92% likelihood of survival for at least five years if melanoma is caught early [1].
Despite this, the similarity between malignant and noncancerous skin lesions is one of the main hurdles to proper melanoma detection argued by [2]. This means that even for doctors with extensive experience, detecting melanoma might be difficult. Visual inspection of a lesion may not always provide clear results in terms of the lesion’s classification. In recent years, several imaging techniques have become more popular for capturing skin. Dermoscopy, which uses an immersion fluid and light magnification equipment to provide a visual image of the skin’s surface, is a noninvasive imaging approach. However, as it relies on the expert’s prior knowledge, the simpler visualization approach for recognizing melanoma in skin lesions may be prone to subjectivity, failure to repeat, or inaccuracy [1].
According to Nawaz et al. [3], the success percentage of dermoscopic images collected by nonspecialists for melanoma prognosis evaluation is between 75% and 84%. Computer-aided diagnostic (CAD) techniques are crucial for melanoma diagnosis because they offer medical professionals with an analytical system. We cannot expect to solve these problems unless we do this. The melanoma CAD model incorporates the preprocessing, segmentation, feature extraction, and classification phases of the diagnostic procedure [3]. Accurate melanoma detection relies heavily on the CAD system’s lesion segmentation method. Many different types of skin lesions may be seen during dermoscopy, and they may be identified by their size, color, location, and texture. This is an important stage, but it might be difficult to do because of the variety argued by [4]. Hair, dark frames, air bubbles, colored illumination, ruler lines, and blood vessels are just a few of the many distractions that may make lesion segmentation more challenging. Differentiating skin lesions was a major topic of discussion throughout this session. A convolutional neural network (CNN) is a recent deep learning (DL) method that has been used to improve the CAD model [5]. Alex Net, Mobile Net, and ResNet are three well-known examples of popular DL architectures. Numerous factors, including the widespread interest in the Inception film series, led to the trilogies being chosen as the theoretical basis for this investigation. Because of its low processing efficiency, the model utilized in Inception only partially and inconsistently realizes all of its parameters. It boosts efficiency, makes efficient use of computer resources, and contributes very little to the network’s total computational load, all of which contribute to Inception’s impressively powerful performance [3].
We use intelligent multilevel thresholding in conjunction with DL to build a model for the segmentation and classification of skin lesions in dermoscopic images (IMLT-DL). The relevant intelligent multilevel thresholding with deep learning (IMLT-DL) model employs top hat filtering and in painting to perform preliminary image processing on dermoscopic images. To pinpoint the damaged regions even further, we use a technique called mayfly optimization (MFO), which is based on multilayer Kapur’s thresholding-based segmentation [6]. The segmented image is then sent into an Inception v3-based feature extractor, which draws out relevant information to form a set of feature vectors [7]. The last phase involves classifying the dermoscopic images using a technique adapted from the gradient boosting tree (GBT) model. A simulation is run using data from the International Skin Imaging Collaboration (ISIC) to test the IMLT-DL model proposed, and the results are analyzed using many criteria. Following this plan will give you a general idea of how to structure the paper you are writing. In the next section, we’ll have a look at the state-of-the-art methods for segmenting skin lesions [7]. The submitted IMLT-DL model will be analyzed in Section III, and Section IV will check the simulation results. At this moment, the IMLT-DL model has reached its final stage [6].
To illustrate the findings of a study on the detection of skin lesions, we provide the following sample comparison analysis table.
| Study | Methodology | Key findings |
|---|---|---|
| Wei et al. [ | Visual inspection, dermoscopy. | Improved prognosis is associated with earlier diagnosis of melanoma. Inaccuracy and subjectivity in less complex visualization approaches. |
| Tahir et al. [ | Comparative study of carcinogenic and benign tumors. | Identifying subtypes is challenging even for seasoned medical professionals. |
| Nawaz et al. [ | Analysis of dermoscopic images by inexperienced observers, computer-aided design. | The average success percentage for those who are not experts is 75% to 84%. The value of CAD in early diagnosis. |
| S M et al. [ | Lesion segmentation issues in dermoscopy. | Segmentation is complicated by visual noise such as hair, bubbles, and lines. |
| Fraiwan and Faouri [ | CAD models based on CNN. | Enhancing CAD using Convolution Neural Network (CNN) Architectures (AlexNet, MobileNet, and ResNet). |
| Waheed et al. [ | Multi-threshold mayfly optimization. | Lesion segmentation using multi-field optimization and multilayer thresholding. |
The purpose of this table is to provide a synopsis of the methods employed and the results obtained in studies of skin lesion detection. The purpose of this table is to provide an overview of the research methods and results. New information or research may need a reorganization of the document’s content and appearance.
II.LITERATURE REVIEW
Daghrir et al. [8] argue that a variety of approaches for identifying and categorizing skin lesions are described. An overview of the Grab cut and K-means clustering algorithm-based semi-supervised approach to skin lesion segmentation is presented. After the melanoma has been segmented using graph cuts, K-means clustering is used to refine the lesion’s margins. Prior to being read in, the picture undergoes preprocessing steps including noise reduction and image normalization [8]. The image is then prepared for pixel classification. Features were extracted using a scale-invariant feature transform approach. In order to classify medical images, CNNs have been used. The artificial bee colony (ABC) approach is used in a similar way when segmenting lesions [9]. Before a digital picture can be analyzed using the swarm-based method, it must go through certain preliminary processing. Otsu thresholding is used to determine the best threshold value after the segmentation of a melanoma lesion. Delaunay triangulation is used to create a final picture, and this technique may be used to divide up the final image (DTM) [8].
Shorfuzzaman [9] argue that this technique uses a parallel segmentation strategy to generate two images that are then fused into a single lesion mask. The next step is to apply this design as a mask on the image. After the artifacts have been removed, the skin is filtered out of the image using a single model to provide a binary mask of the lesions. DTM offers the ability to reduce time compared to other approaches due to its fully automated nature and lack of need on a trained model [10]. In this work, we provide a new automated method for image segmentation by combining image-wise supervised learning (ISL) with multi-scale super pixel-based cellular automata (MSCA). The researchers eliminated the need for the user to submit a description of the seed selection process by using probability maps. The MSCA method was then used to segment the skin lesions [11]. A fully convolutional networks (FCNs)-based method is employed to accurately segment the skin lesion. Accurate segmentation of skin lesions is achieved (compared to prior challenges) without the customary preprocessing procedures since several phases of the FCN are included within the picture features to be learned (such as improving contrast, removing hair, and so on) [9].
Ameri [12] argue that convolutional and DE convolutional neural networks (CDNNs) are used for the purpose of mechanically segmenting skin lesions. This technique has an advantage over others that need several pre- and postprocessing steps since it largely depends on training methodologies. This approach encodes the likelihood that a group of pixels will acquire melanoma as a function of their location on the map. A 10-fold cross-validation method is used to train the algorithm, and a U-Net framework is then used to segment skin lesions based on a probabilistic mapping of the image’s dimensions [12].
Reshma et al. [13] argue that artificial intelligence (AI) has gone a long way in the preceding decade, notably in the domains of DL and CNNs, enabling for the creation of trustworthy image-based medical systems for screening and diagnosis. Recently, automated classification using DL as the major technique of research has supplanted image segmentation (the separation of relevant areas in an image) and feature extraction [14]. Recently, this tendency has become clear. Similar patterns have been seen in the study of skin cancer detection and screening, with the use of sophisticated DL AI replacing the more traditional approach of image processing to filter out noise (such as hair). This direction was adopted by the majority of studies. These more contemporary algorithms are typically invulnerable to picture noise and do not require the explicit extraction of characteristics. However, they are typically computationally time-consuming [13].
Arif et al. [15] argue that using digital hair removal (DHS), hair was eliminated from the skin lesion picture, and the impact of the hair removal was analyzed using intra-structural similarities (Intra-SSIM). An original technique for the segmentation of lesion pictures according to areas of interest was created utilizing DL (ROI). With the aid of trained neural networks, we developed a novel representation of intermediate features to extract information from the ROI (such as ResNet and DenseNet). CNNs were employed to differentiate dermoscopic characteristics and lesions [8], instead of utilizing a pertained model or excessive augmentation [15]. A unique approach for data separation leverages high-resolution convolutional neural networks. The suggested technique beats the other DL segmentation algorithms without the need for any further image processing, and the results were statistically significant. A new technique for segmentation is based on a deep fully convolutional network with 29 total layers [16]. CNN segmentation of dermoscopy pictures using attention approach maintains edge features. An innovative DL model is based on Gabor wavelets for distinguishing between melanoma and seborrheic keratosis. Seven separate CNN models that made use of Gabor wavelets were integrated to form the ensemble used to construct this model. More specifically, their technique combines a Gabor wavelets-based model with a CNN model for images [8]. Performance assessment findings showed that a collection of image and Gabor wavelet-based models performed better than any of the individual models. This ensemble performed better than a subset of CNN models constructed just using Gabor wavelets [8].
Kaur et al. [17] argue that recently it has been shown that deep transfer learning may be used for robust automated internal feature extraction in the field of medical imaging. There were three phases to find melanoma. The first thing to do is to make sure the dataset is error-free and resize the photographs to the right dimensions. Subsequently, feature extraction is improved with the help of deep transfer learning [18]. It compared the performance of six different transfer learning networks in classifying multiclass lesions using these characteristics to train a set of classic classification methods, including support vector machine (SVM), logistic label propagation (LLP), and k-nearest neighbors (KNN). However, their findings were contingent on a larger dataset [19]. The primary objective of picture augmentation is to enhance existing photographs without producing duplicates. Creating many variants of the same picture in the dataset with varying degrees of improvement confuses findings and does not accurately reflect the effectiveness of the system [20].
III.METHODOLOGY
The technique through which images of skin lesions were used in the process of establishing a classification system for skin cancer is shown in Fig. 1. The approaches that were employed in this inquiry did not require the extraction of features or the segmentation of data [21].
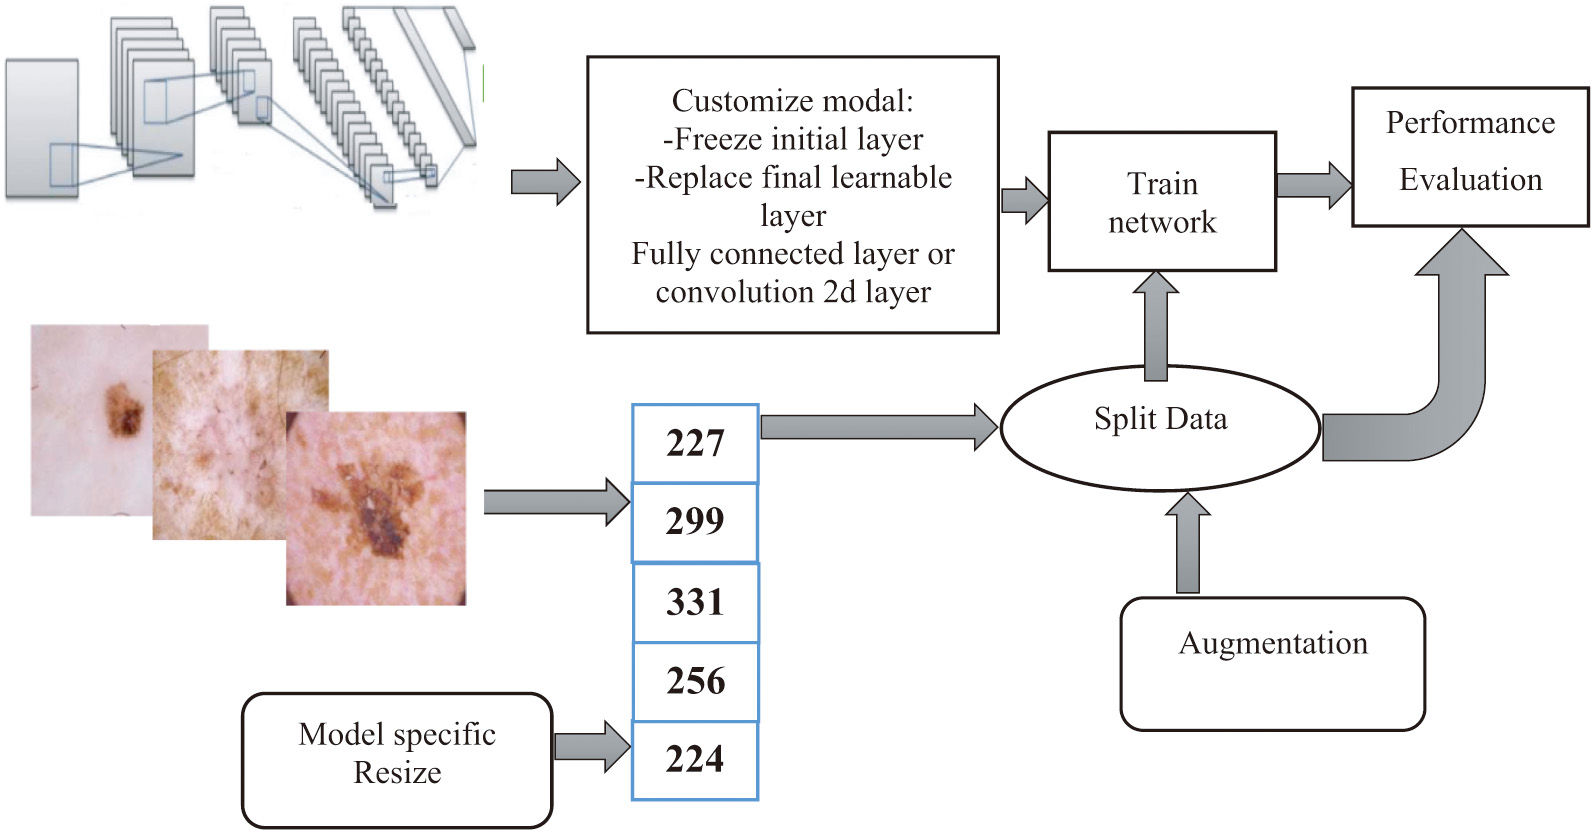 Fig. 1. A diagrammatic summary of the overarching procedures discussed in this article.
Rather, both of these tasks were performed automatically (i.e., separation of lesions from the rest of the image). The several layers and procedures that are included inside the DL model are responsible for automatically resolving each and every one of these issues. An in-depth description of each component is provided in the following passages [21].
A.DATASET
For this paper, the authors used the dataset HAM1000 (Human against Machine), which contains dermatoscopic pictures of the most prevalent skin malignancies [22]. Seven classes may be used to classify each set of pictures: there were 1113 melanomas, 6705 nevi, and 142 vascular lesions altogether. Random x-y scaling in the range and random x-y translation in the pixel range were utilized as enhancing techniques [7].
B.DEEP LEARNING MODELS
Numerous applications, especially those involving medical imaging, have shown the efficacy of transfer learning. This is accomplished by swapping out poorly constructed and tested ad hoc deep CNN architectures with more robust pretrained models [23]. These models’ bottom layers are taught to recognize and respond to common visual cues like color and brightness [24]. The layers that follow the input must be retrained and customized to account for the unique aspects of the job they perform. This method has been proved to be useful in a wide range of studies. Thirteen DL models were tweaked, retrained, tested, and compared in this study for their ability to classify skin lesions into the aforementioned seven categories from the HAM1000 dataset. This was done to find out which model was the most efficient at solving the problem [7].
C.METRICS AND FRAMEWORK FOR PROGRAM EVALUATION
According to [10], a performance’s F1 rating is based on how well it performs across four criteria: accuracy, precision, recall, and specificity. Accuracy is ranked by how many photos out of a total set were correctly labeled [23]. The accuracy of a test is defined as the percentage of true positives. In consideration of all important factors, we calculate the proportion of correct answers (as assessed by recall, also called sensitivity). A photograph’s specificity, sometimes called its selectivity, is the proportion of negative photos relative to the total number of images. Classification performance on imbalanced datasets is measured using the F1 score, the harmonic mean of the recall, and accuracy scores. The ratio of confirmed to suspected negative pictures is often accepted as the most accurate measure of precision. Definitions are provided for the following five types of quantitative research: if all goes according to plan, the reported scores for each course will be the class mean [25]. The data were successfully divided into separate datasets for research and development using three different methods. The models’ ability to generalize without becoming too particular to the input photographs will be evaluated using these. When we talk about “random axis translation,” we were referring to the process of arbitrarily shifting an image along the x and y axes [7]:
IV.EXPERIMENTAL RESULTS
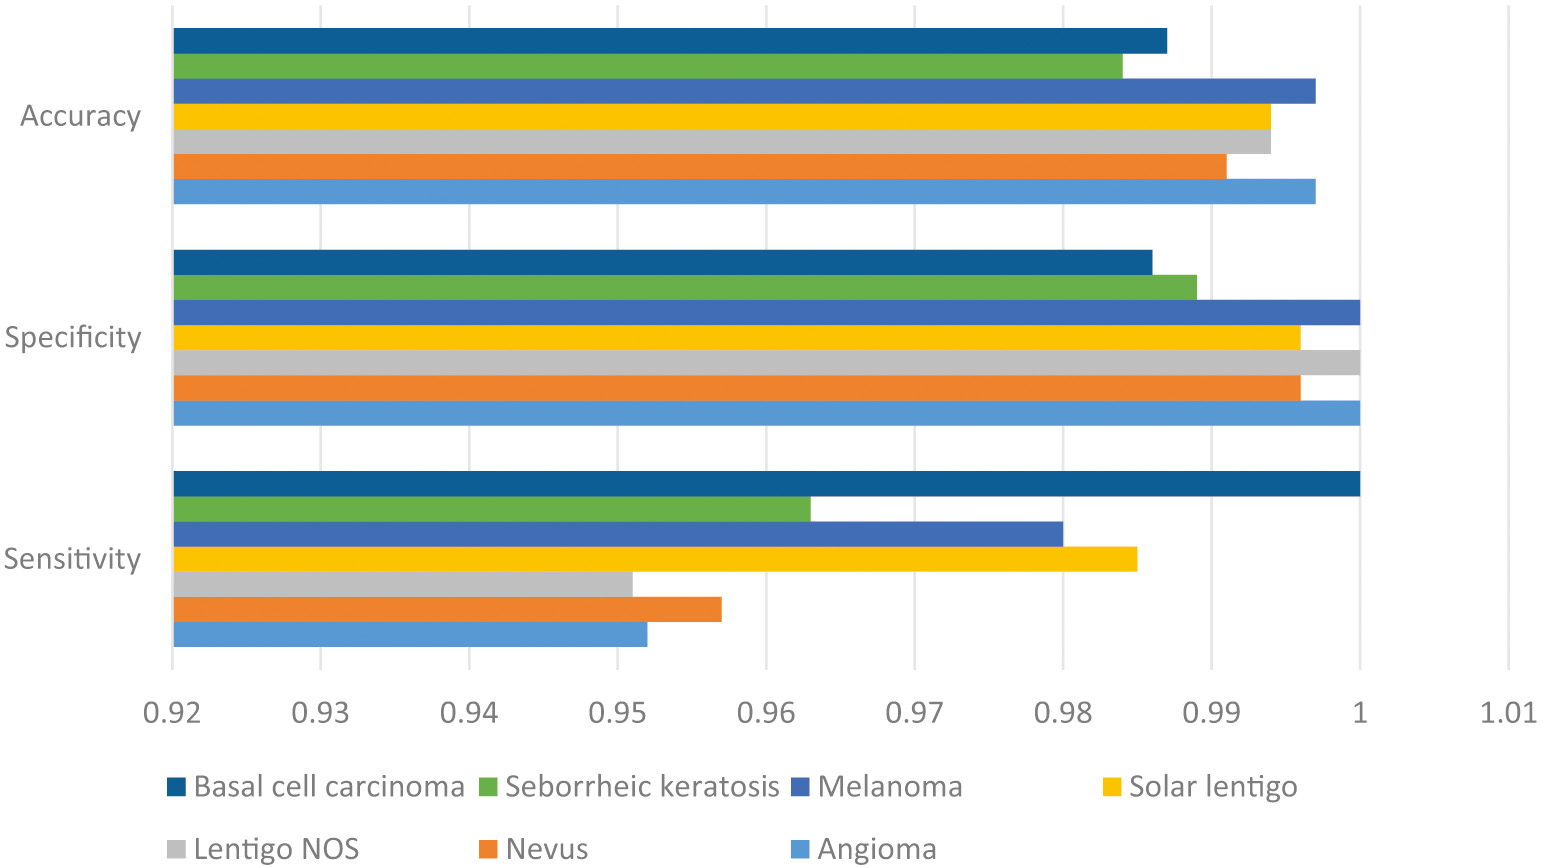
From the results of the experiments, it was determined that the IMLT-DL model accurately detected and classified photos of skin lesions. For instance, while trying to classify instances into the “Angioma” category, the IMLT-DL model has a sensitivity of 0.952, specification of 1, accuracy of 0.997, precision of 1, and G-measure of 0.976. The IMLT-DL method successfully classified the “Nevus” subset with a sensitivity of 0.957, specificity of 0.996, accuracy of 0.991, precision of 0.978, and a G-measure of 0.967. The IMLT-DL method successfully classified the “Melanoma” category with a sensitivity of 0.980, specificity of 1, acc. of 0.997, accuracy of 1, and G-measure of 0.990 [26].
In the end, the DLN model has shown even better results than the CDNN model, with a sensitivity of 0.732, a specificity of 0.754, and an accuracy of 0.743. More recently, the CDNN model has demonstrated a sensitivity of 0.825, a specificity of 0.975, and an accuracy of 0.934. The ResNets model has improved sensitivity by 0.02, specificity by 0.985, and accuracy by 0.934%. The findings of the DCCN-GC model are similarly rather good: sensitivity = 0.908, specificity = 0.927, and acc. = 0.934. As an added bonus, the DL-ANFC model has been used to provide almost optimal results, with a sensitivity of 0.934, specificity of 0.987, and accuracy of 0.979. Comparable approaches are only 0.97 sensitive, 0.99 specific, and 0.99 trustworthy, according to the IMLT-DL model [27]. Figure 2 shows the comparative result analysis of accuracy, specificity, and sensitivity.
V.RESULTS
Correctly classifying photos of skin lesions into one of two categories (benign vs. melanoma) or three groups has been shown in the past (benign, melanoma, and nonmelanoma). One such instance is as follows: this has been shown by previous research to be correct. The purpose of this research was to test the ability of deep convolutional network models to generalize their knowledge of skin lesions from one dataset to another [28]. Ten training iterations were run, and the average results were provided, to allow for any variations caused by the random distribution of data. This action was taken to guarantee more uniform outcomes. The training and validation times were taken into account in addition to the high computing cost of DL models [10].
For ease of comparison, Table I summarizes the average performance metrics from 10 iterations of each of the 13 DL models, using 70% of the data for training. All of the models performed rather well in terms of accuracy; however, Resnet101 performed best (76.7%). Sample rows and columns from a confusion matrix are summarized in Fig. 3 for in-depth analysis. The imbalance between the number of images in each category and the accuracy values causes the F1 score to be lower than the accuracy values. There is also evidence that shows smaller class sizes lead to less precision overall [29]. The bulk of the pictures were assigned to the NV class because they had the highest levels of accuracy (92.5%) and recall (see NV summary for details on the NV columns) (82.5 percent; see NV summary for more information about the NV rows). However, only 43.1% of melanoma patients were properly identified according to their specific subtype, despite the fact that 71% of patients were correctly categorized overall (recall). The gaps in accuracy and recall between the other groups are less pronounced, but they still exist [30] (Table II).
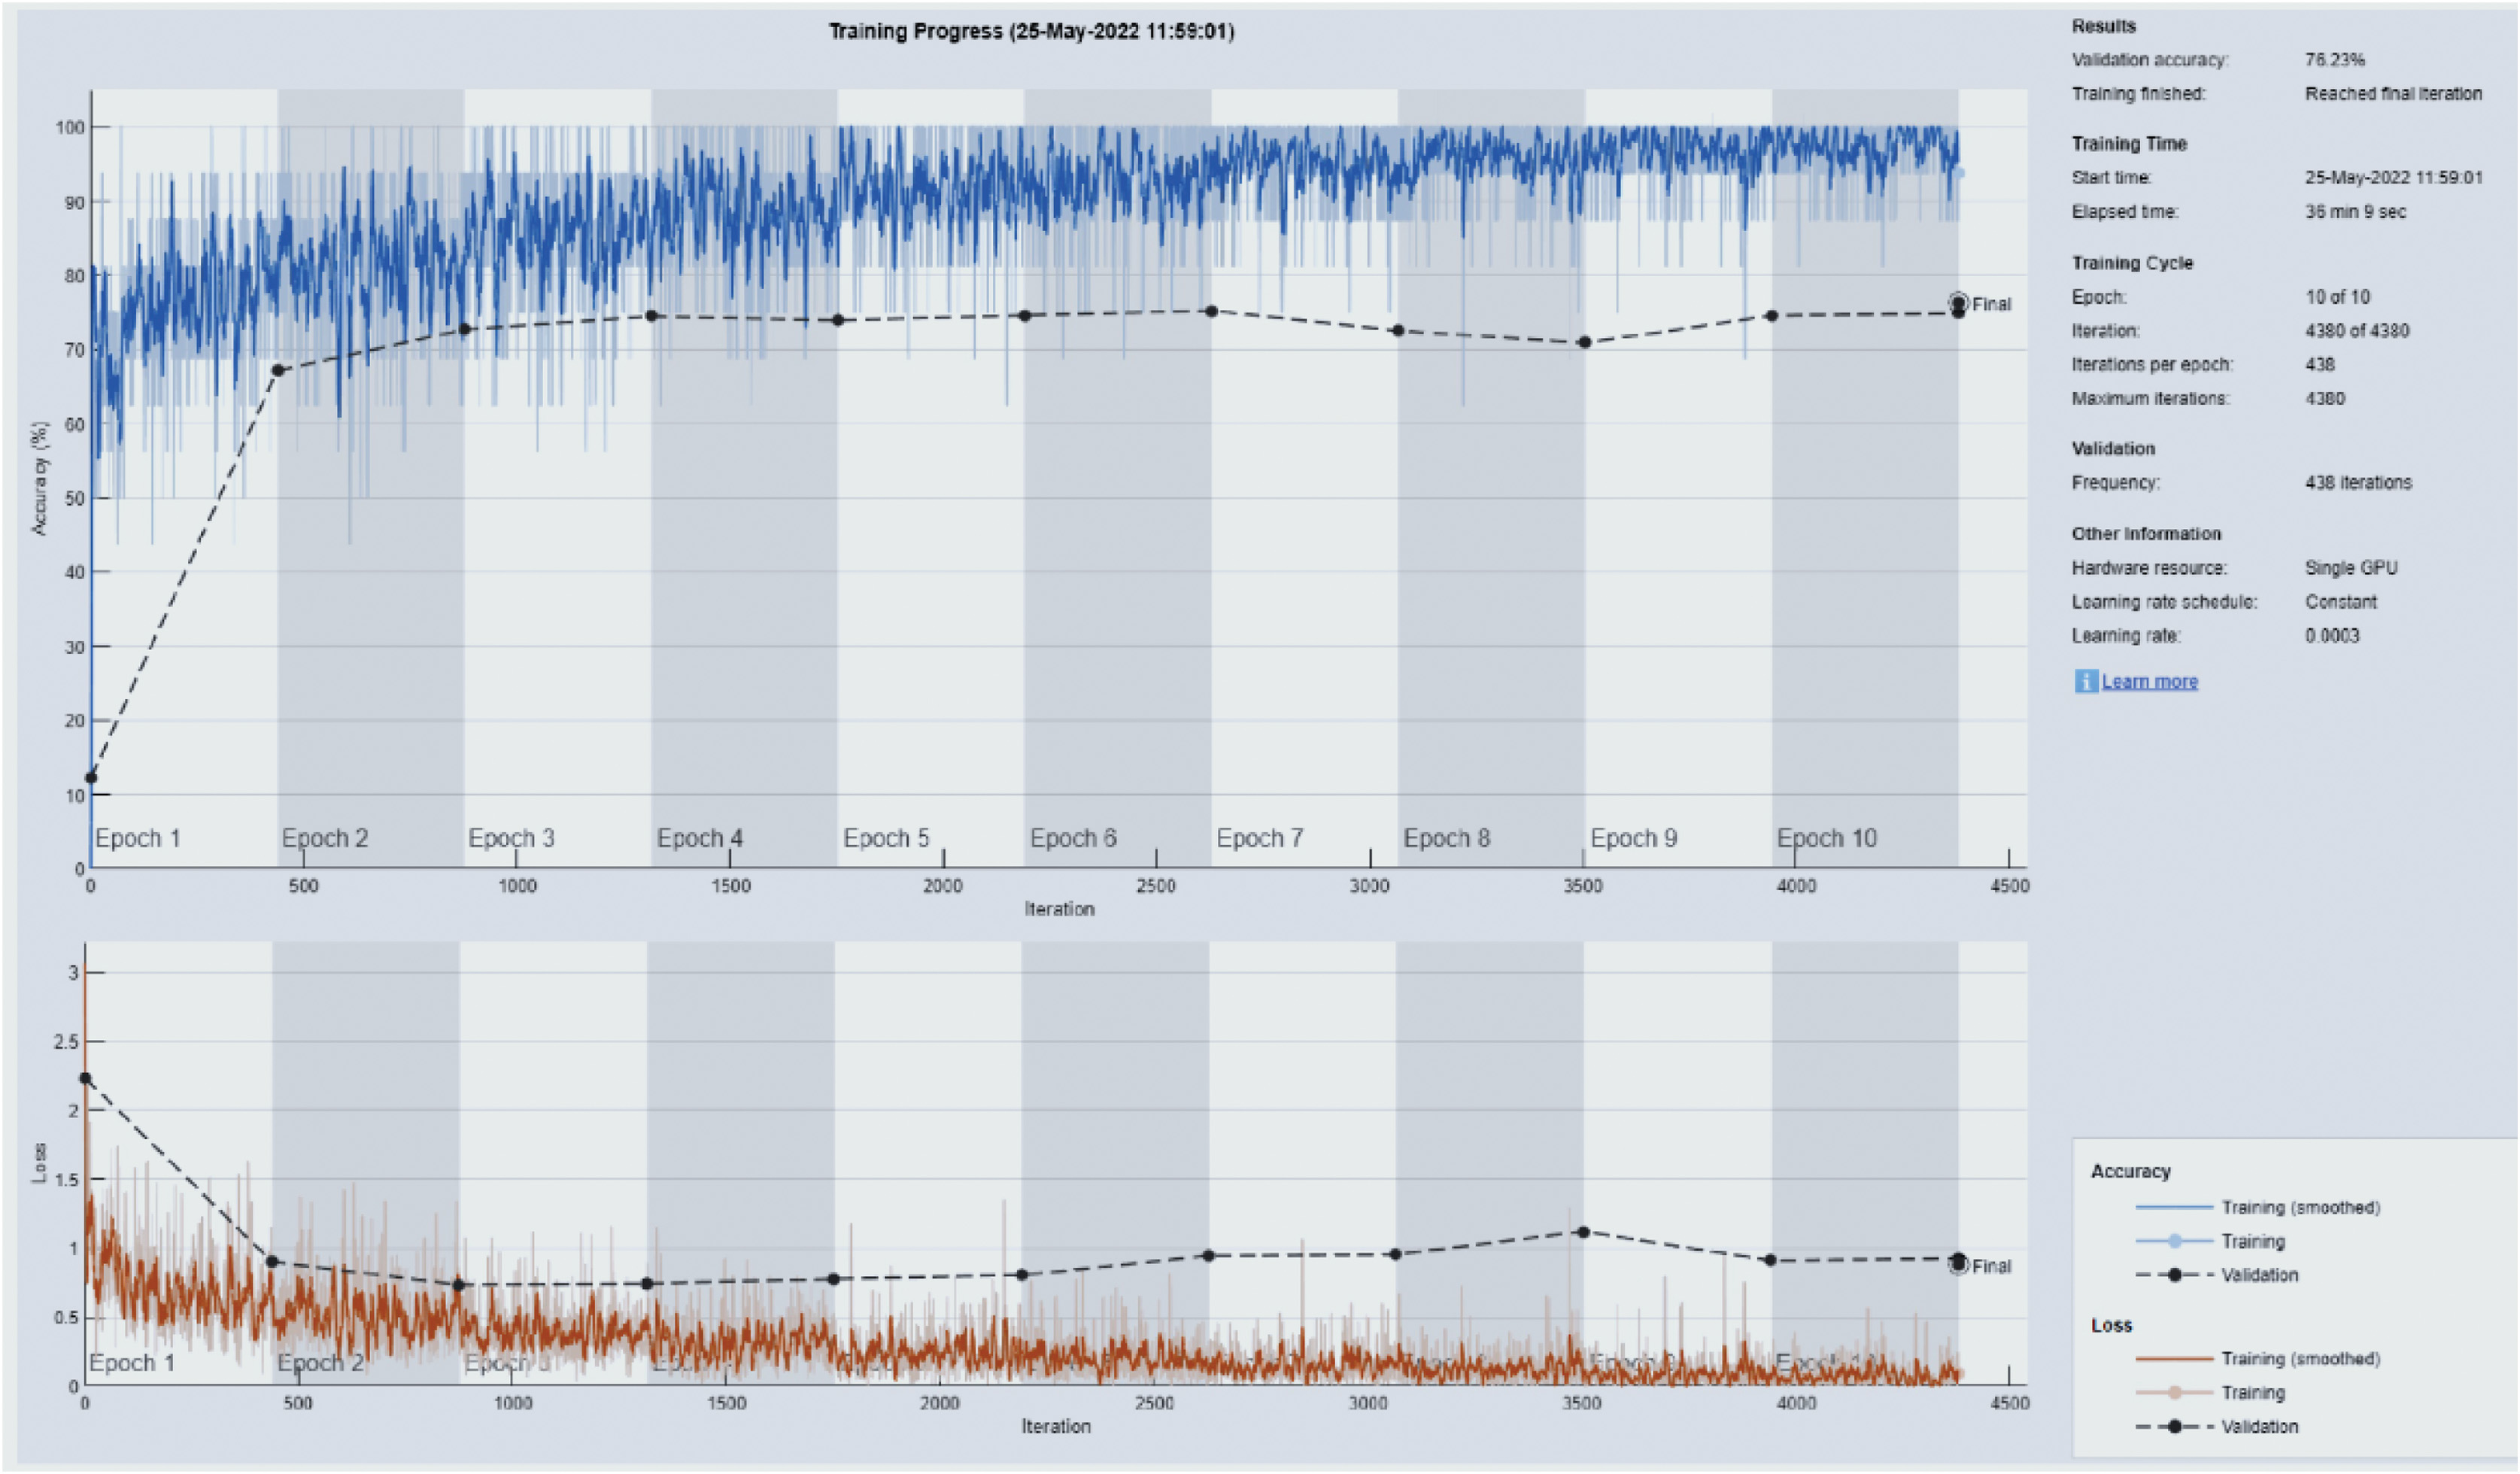 Fig. 3. A strength and conditioning curve illustration using Resnet101 and a 70/30 split of the data.
Table I. Graphs illustration for the texture model
| 76 | 7 | 19 | 2 | 54 | 66% | 33% | ||
| 45 | 47 | 76 | 4 | 32 | 7 | 68% | 38% | |
| 65 | 13 | 76 | 24 | 3 | 58% | 41% | ||
| 3 | 633 | 32 | 15 | 2 | 52% | 47% | ||
| 6 | 58 | 12 | 14 | 237 | 5 | 71% | 29% | |
| 19 | 8 | 7 | 76 | 34 | 1733 | 4 | 82% | 17% |
| 15 | 11 | 100 | 43 | 34 | 43 | 22 | 58% | 41% |
Table II. The mean values for each deep learning model’s overall accuracy, F-score, precision, recall, and specificity with 70/30 data split
| Model | F1 Score (%) | Precision (%) | Recall (%) | Specificity (%) | Accuracy (%) |
|---|---|---|---|---|---|
| 49.2 | 60.1 | 50.6 | 89.8 | 72.7 | |
| 45.4 | 60.2 | 53.4 | 93.3 | 72.0 | |
| 59.5 | 62.5 | 59.7 | 93.5 | 73.2 | |
| 60 | 69.9 | 59.7 | 93.7 | 76.8 | |
| 61.0 | 70.2 | 60.4 | 93.1 | 72.6 | |
| 62.3 | 70.6 | 59.8 | 94.0 | 71.7 | |
| 59.4 | 69.5 | 59.4 | 93.7 | 76.4 | |
| 61.3 | 65.7 | 60.8 | 93.6 | 72.3 | |
| 57.9 | 65.5 | 60.2 | 93.7 | 71.4 | |
| 58.4 | 66.3 | 59.8 | 93.4 | 74.5 | |
| 59.6 | 63.9 | 60.7 | 92.5 | 72.6 | |
| 62.9 | 62.8 | 59.9 | 93.5 | 75.6 | |
| 60.6 | 69.3 | 55.7 | 92.1 | 76.8 |
Figure 3 depicts a progress curve for training and validation that was created for Resnet101 by dividing the data into 70/30 halves. This graph implies two things:
- (a)The model is not able to consistently minimize loss and provide high testing accuracy, even when the number of epochs is raised [29].
- (b)The disparity between validation and testing performance is noticeable since there are less photos available for most classes (DL requires large datasets).
6.Discussions
The mean overall performance metrics for each of the 13 DL models are provided in Table IV; these metrics are based on 10 separate runs, with 80% of the available data being used for training purposes [31]. Because the highest possible F1 score that could be achieved was 66.1%, this indicates that increasing the size of the training set by 10% had no impact on the performance measures. The confusion matrix that may be seen in Table III demonstrates that a substantial source of mistakes was the incorrect categorization of NV pictures as melanoma [16]. The vast majority of courses were effective in attaining a high level of accuracy but only managed to get a low level of recall. Figure 4 demonstrates, in addition, the same propensity toward training and overfitting that was shown previously in the paper [31].
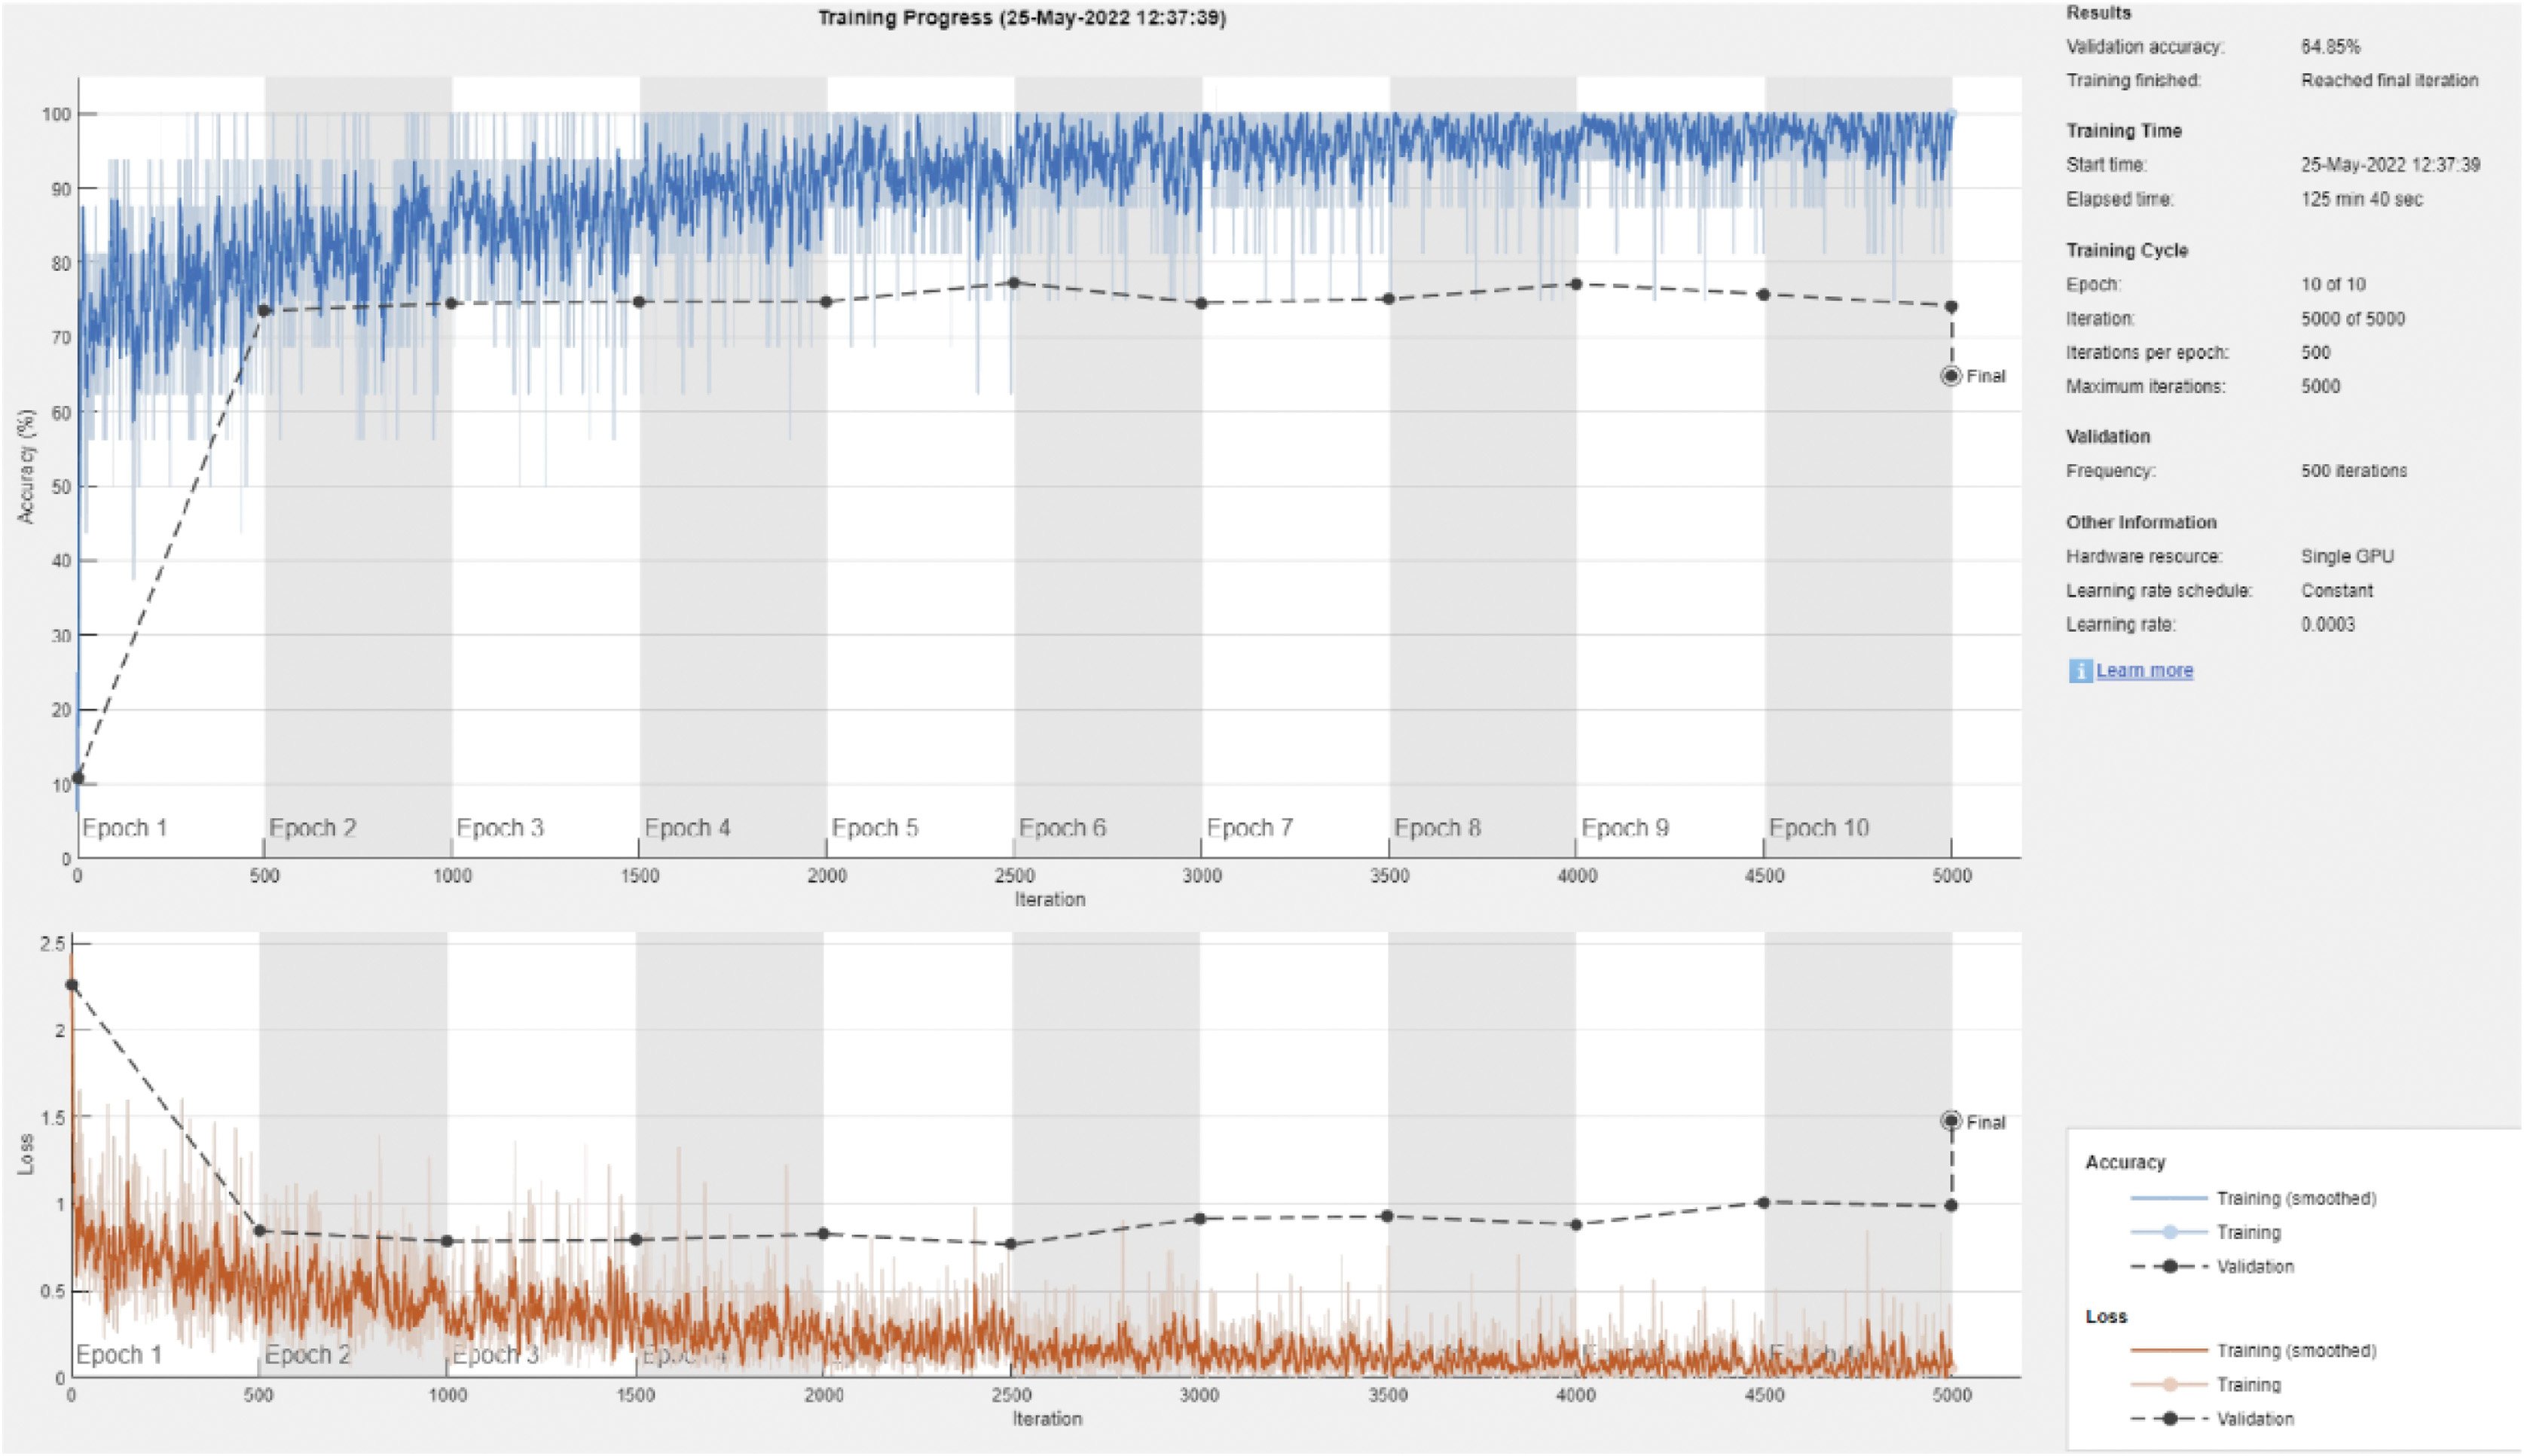 Fig. 4. This is an example of the strength and conditioning curve for DenseNet201 with an 80/20 split of the data.
Table III. The following is an example of a confusion matrix for the DenseNet201 model and the 80/20 data split
| 35 | 20 | 7 | 5 | 5 | 56% | 43% | ||
| 34 | 59 | 21 | 1 | 3 | 3 | 34 | 58% | 40% |
| 23 | 34 | 119 | 29 | 1 | 24 | 48% | 41% | |
| 13 | 21 | 21 | 42 | 53 | 52% | 41% | ||
| 12 | 1 | 10 | 11 | 188 | 15 | 71% | 30% | |
| 1 | 2 | 3 | 12 | 22 | 52 | 78% | 15% | |
| 8 | 3 | 4 | 31 | 21 | 56% | 31% |
According to Jojoa et al. [32], the ratio of test pictures to train images ended up being 90% after an additional 10% was added to both the testing dataset and the training dataset. The frequency with which each of the 13 DL models was executed is summarized in Table III, along with the models’ average overall performance metrics. When compared to ResNet101 and DarkNet53, both of these networks scored more than 70% in F1. The table indicates that the majority of models get more accurate as additional training data is used, with the exception of the fragile SqueezeNet model. DL models, as opposed to more conventional machine learning models, could gain more from larger datasets [32]. This might be the reason why DL models seem to have superior performance. The conventional machine learning models do not gain any advantage from using more extensive datasets. Figure 5 is an illustration of an example of the confusion matrix that may be constructed using DarkNet-53. In comparison to past iterations, there has been a considerable increase in the number of rows and columns in this matrix that include at least one inaccurate classification. This trend can be seen both horizontally and vertically. A training/validation progress curve that demonstrates overfitting is depicted even if it has been reduced [32].
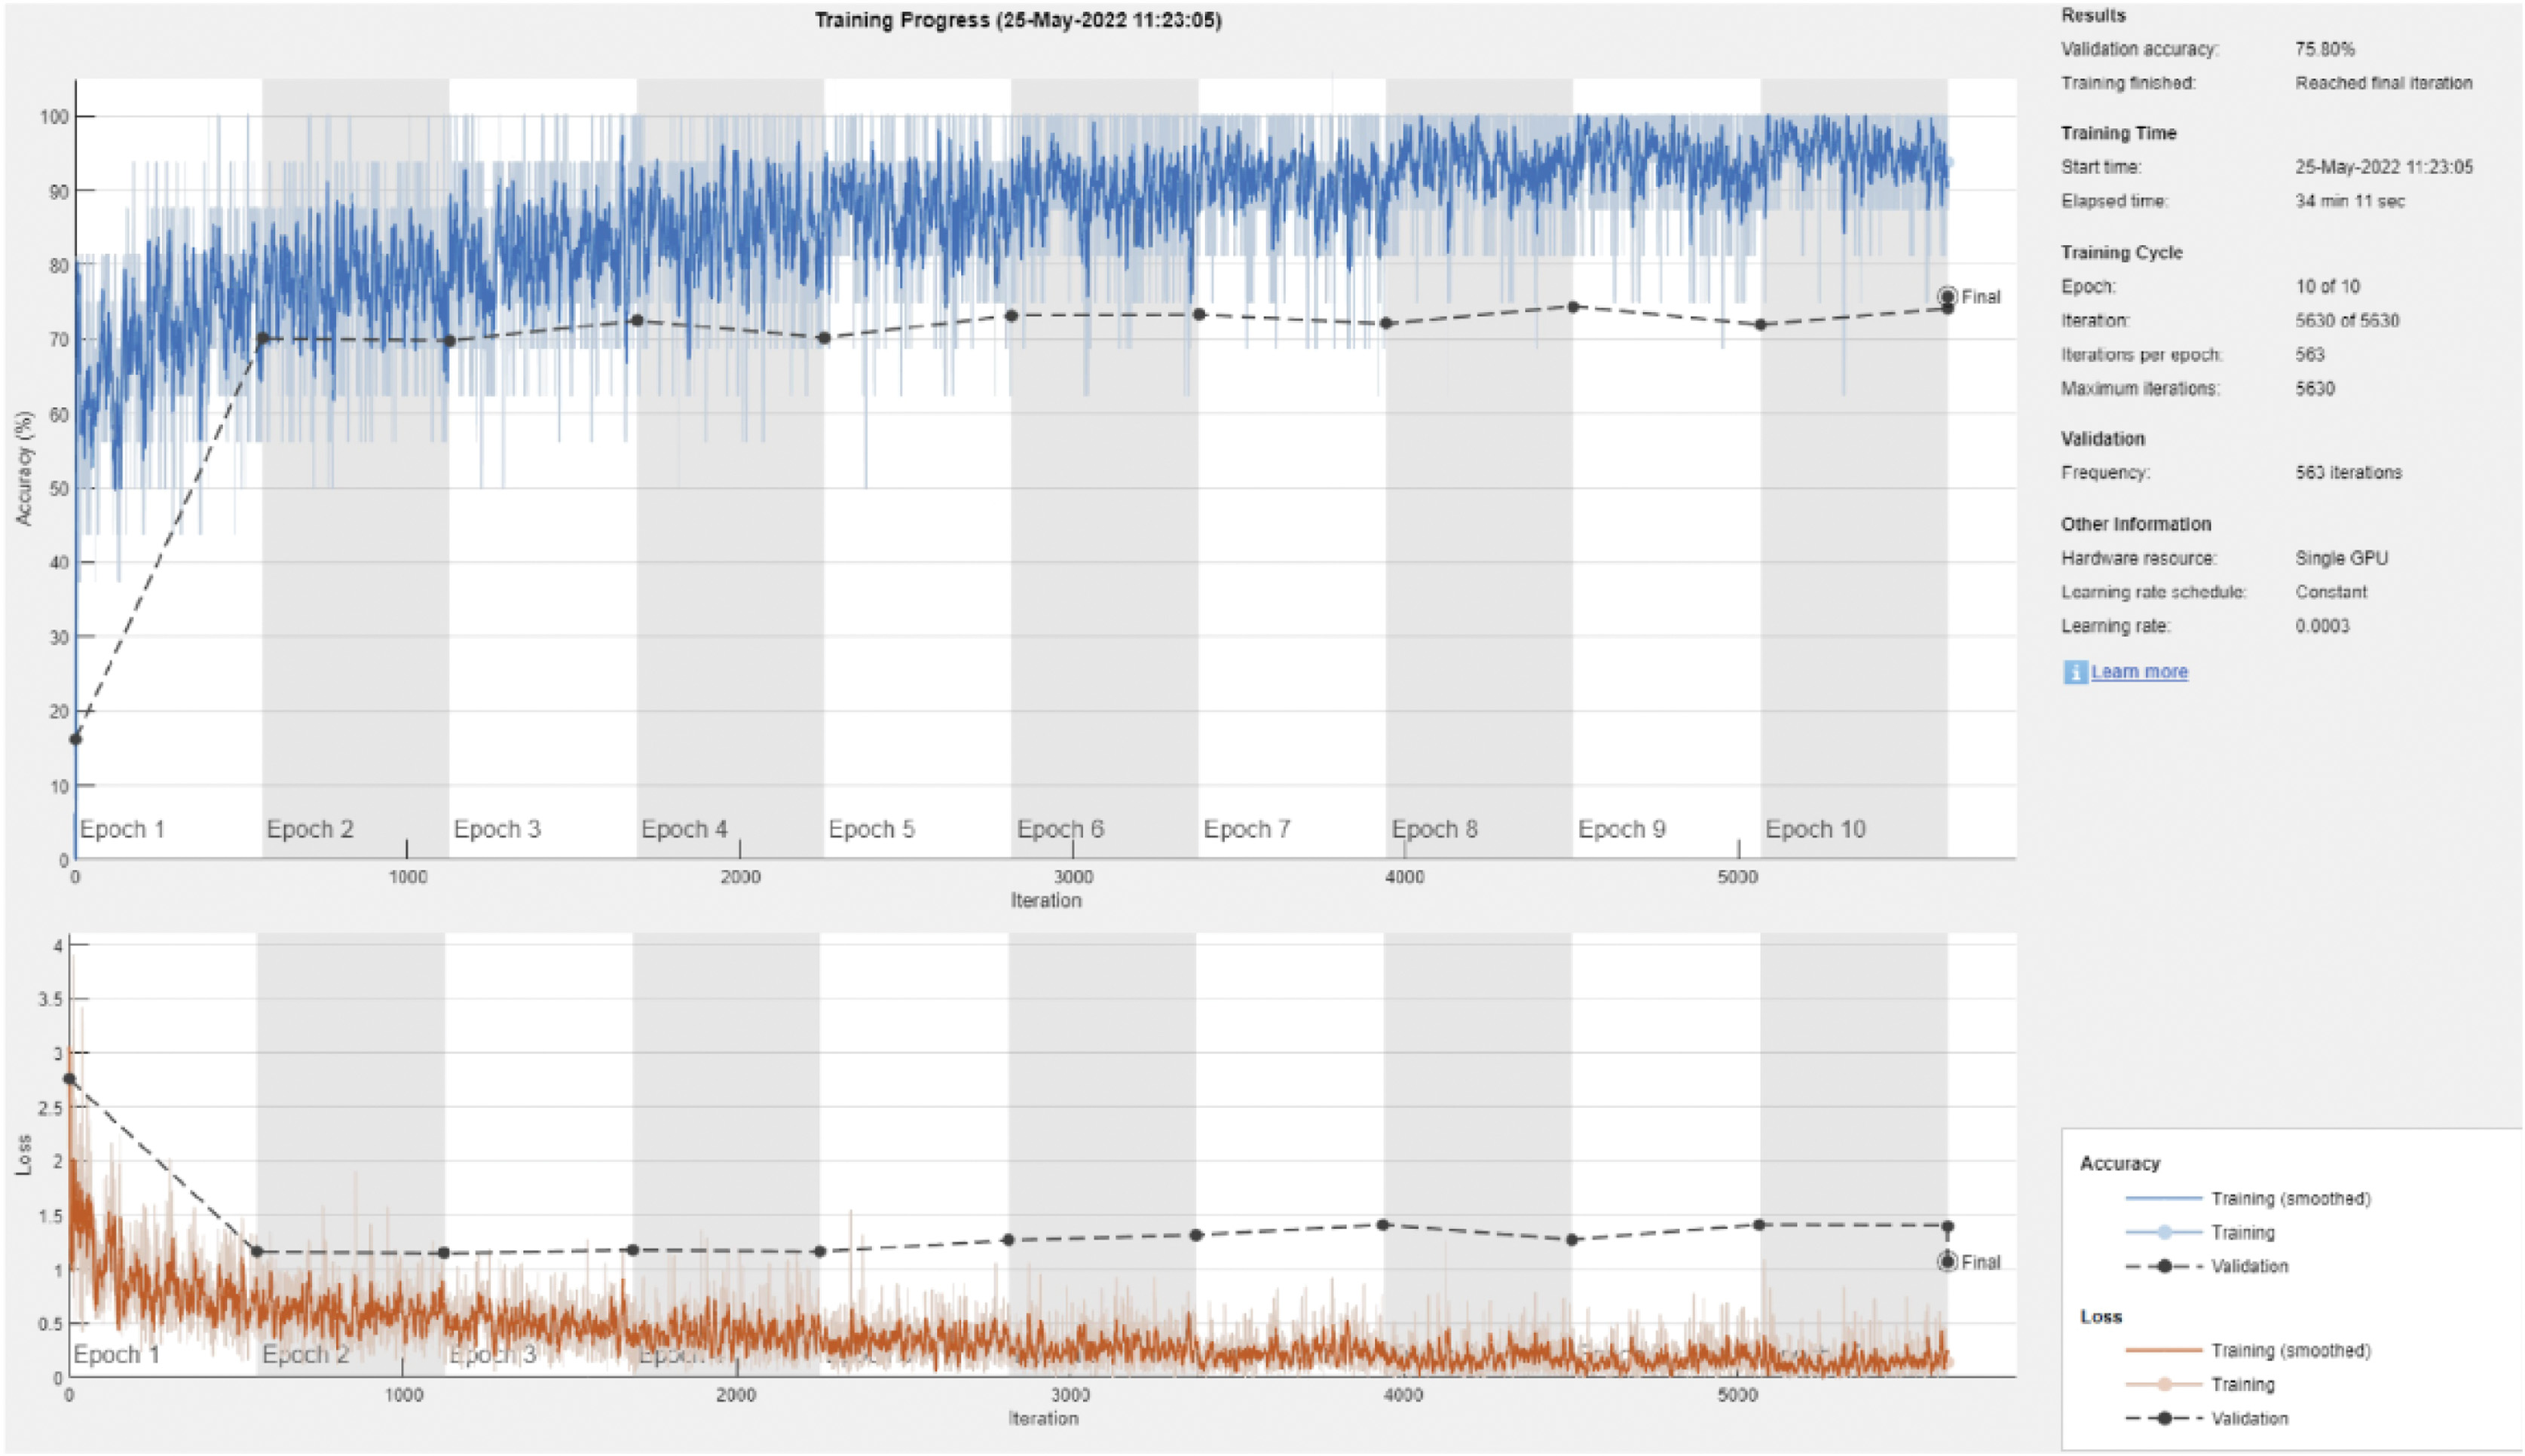 Fig. 5. Training and validation curve example for DarkNet-53 with a 90/10 data split.
According to Naeem et al. [7], even though a larger size of the training dataset showed some signals of promise, there is still more work to be done before a trustworthy diagnostic system that goes beyond the criterion of screening can be established. On the other hand, some of the findings were skewed since there were so few photographs available to represent each category. Even a little inaccuracy may have a significant impact on how well a DL model performs overall, despite the fact that the baseline prerequisites for a successful DL model are fairly simple. You can get more information by looking at Table IV, but in a nutshell, it demonstrates how much time each model required to train, divided down according to how it separates the data. In most cases, the amount of time necessary to complete a task rises in a linear fashion in proportion to the size of the training dataset, with increments of less than 10% for each order of magnitude [33].
Table IV. Mean overall performance metrics for 13 deep learning models
| Model | F1 Score (%) | Precision (%) | Recall (%) | Specificity (%) | Accuracy (%) |
|---|---|---|---|---|---|
| 49.6 | 60.0 | 49.8 | 89.4 | 58.0 | |
| 53.2 | 69.0 | 52.8 | 83.4 | 58.5 | |
| 59.1 | 63.2 | 59.6 | 84.0 | 58.8 | |
| 59.1 | 69.7 | 59.3 | 84.3 | 53.5 | |
| 59.5 | 55.9 | 58.2 | 83.9 | 53.0 | |
| 52.3 | 59.0 | 58.2 | 84.2 | 60.2 | |
| 53.2 | 60.7 | 58.8 | 83.9 | 57.7 | |
| 52.2 | 62.7 | 53.2 | 83.8 | 59.6 | |
| 46.1 | 59.3 | 49.9 | 84.0 | 60.2 | |
| 48.5 | 56.9 | 53.7 | 83.8 | 57.4 | |
| 51.2 | 69.2 | 47.8 | 83.3 | 60.0 | |
| 51.4 | 69.7 | 48.5 | 83.6 | 60.2 | |
| 49.0 | 59.8 | 42.6 | 83.6 | 62.2 |
The major contributions of this research are as follows:
- •A novel approach for evaluating dermoscopy pictures is discussed in the study titled “Model Improvement Using Multi-Level Thresholding and Deep Learning” (IMLT-DL).
- •Complex image processing methods, such as top hat filtering, inpainting, MFO, and multilayer Kapur’s thresholding, are used to precisely locate problem areas in skin diseases. MFO and multilayer Kapur’s thresholding are two further methods.
- •Dermoscopy image classification using a feature extractor built on top of Inception v3 and GBTs to generate fast, high-quality feature vectors.
- •In a comprehensive test conducted on the ISIC dataset, the suggested IMLT-DL model displayed improved performance when compared to state-of-the-art approaches for the segmentation and classification of skin lesions by a margin of 0.992%.
- •The research provides a clear and organized foundation for comprehending the methods and results through its structured approach to paper organization. The framework includes a discussion of the state-of-the-art methods, a presentation of the IMLT-DL model, and an analysis of the simulation results.
VII.CONCLUSION
Building a diagnostic system that is more accurate than the screening approaches that are now in use will need a significant amount of effort. It has been shown that encouraging results may be achieved by using a larger training sample, but there are still a number of obstacles to overcome. On the other hand, some of the assumptions were incorrect since there were not enough images to accurately portray each category. Even if there are not many variables in a good DL model, even a little piece of inaccurate information could have a substantial impact on how well the model works. Table IV presents a summary of the required training time for each model, divided down according to the manner in which it separates the data, as well as potential connections to more material on this subject. Across orders of magnitude, task completion durations have a tendency to rise in a linear fashion in proportion to the size of the training dataset, often by a margin of less than 10%. This is accurate in almost every circumstance. DarkNet-53 is the most effective model in terms of both the amount of time needed for training and the accuracy of categorization. Resnet101 is now in the position of runner-up. DarkNet-53 may have an advantage during training, but SqueezeNet is the superior model in terms of both speed and throughput.
VIII.FUTURE SCOPE
“Smart labs” and “smart imaging systems” have emerged as a result of the increasing prevalence of digitalization, roboticization, and automation in recent years. These companies are able to quickly and economically react to the expanding expectations that the healthcare sector places on them. The results of our research reveal that some new technologies are already making diagnostics better, while other technologies have the potential to completely revolutionize the area in the not too distant future. The widespread use of biosensors and the expanded use of companion diagnostics are two major developments that will define the future of diagnostics. Other major trends that will have an impact on the future of diagnostics include the increased use of liquid biopsies, direct to consumer testing, automation, and the transformation of pathology and radiology via the application of AI and sophisticated analytics. Partnerships with companies that specialize in consumer technology will be of considerable assistance in the creation of new treatments and the modification of existing regimens. Because the new value-based payment models will reward all participants for successful management of preventive care, early detection, and wellness, the only way they can be constructed is via partnerships.