I.INTRODUCTION
There are two essential factors to reach the healthy sleep, the first one is the duration of sleep and the second one is the quality of sleep. According to Dr Holly Milling [1], sleeping under 5 hours is very dangerous on health and it can cause several problems such as cardiac problem and mental problems [1]. The recommended sleep duration is between 7 and 9 hours, where 7 hours are the minimum. The even more important factor of sleep is the quality. It depends to several factors [2]:
- ✓The sleep schedule should be maintained, and people should respect the nature of sleep habits. That is to say waking up every day at the same time and going to the bed every day at the same time as well. This is strongly important for the circadian rhythm.
- ✓The bedtime must be as earlier as possible every day in order to have at least 7 hours for sleep.
- ✓The bedroom has to be reserved only for sleep and related activities. Exceptions can be made in case of sickness. The other activities like checking email, remote work, and meetings must be done outside the bedtime in order not to confuse brain cells.
- ✓The bedroom environment has to be relaxing as much as possible to make it suitable for sleep. The bedroom temperature also must be cool. And the most important thing is silence. The bedroom must be highly quiet to avoid any kind of disturbance.
The sleep duration depends on the health conditions of each person, but it is related strongly to the age, as shown in Fig. 1.
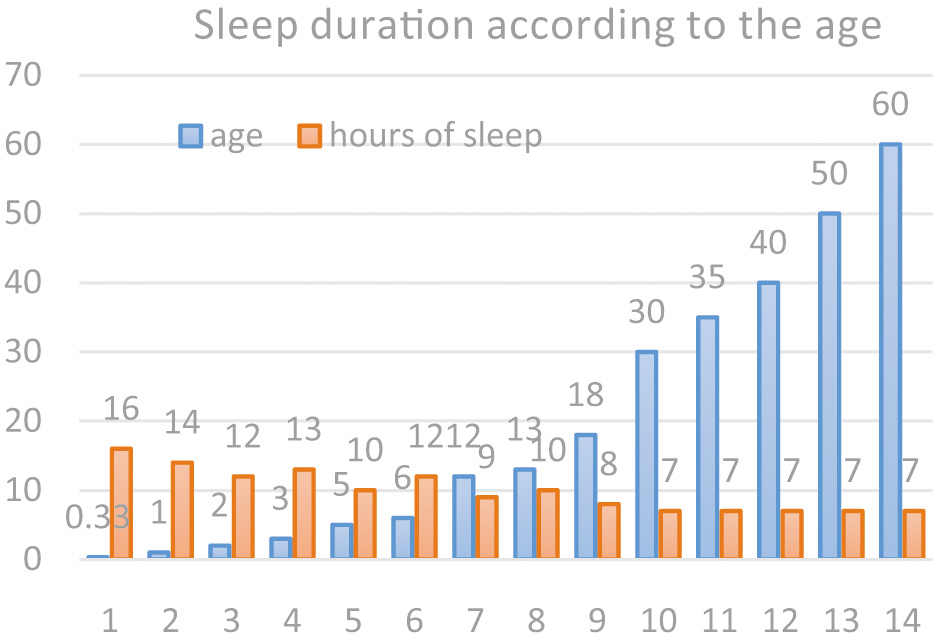 Fig. 1. The needed hours of sleep according to the age [3].
Due to several health problems, most of the time doctors need to perform a whole night sleep analysis in order to have more data about the sleep quality of patients [4]. For the sleep analysis, there is a procedure called the polysomnography (PSG), which is based mainly on the recording of several electrophysiological signals as described below:
- ✓The electroencephalogram (EEG) (the brain waves)
- ✓The electromyogram (EMG) for the chin muscle
- ✓The electrocardiogram (ECG) (to calculate the heart beats)
- ✓The oxygen saturation
- ✓The leg movements
After approximately 7 hours of recording, the medical staff stops the PSG recording and starts to deal with the interpretation. During that task, the medical staff must scroll all the time series and classify them according to the sleep cycles. However, 7 hours of recording is too much. Hence, it is difficult to analyze the number of signals visually and manually using the mouse, etc. The target behind is to see if the subject passes through the healthy sleep cycles as illustrated in Fig. 2. There are generally four sleep stages: N1, N2, N3, and the REM (rapid eye movement). If the subject has a healthy sleep, the hypnogram must respond to the normal duration for each stage and all the cycles must be completed successfully [5].
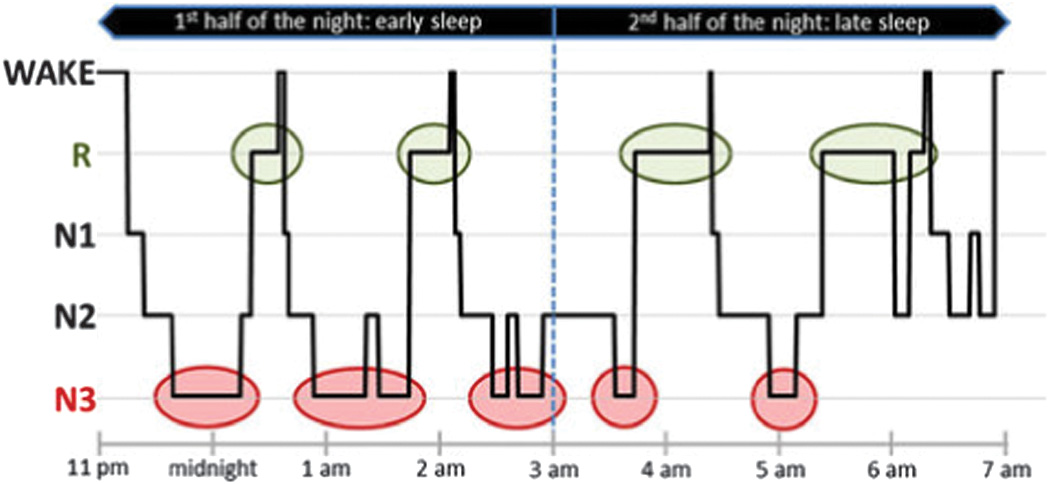 Fig. 2. The normal sleep pattern of healthy people [6].
Thus, the problem must be solved in such a way that the time series must be analyzed automatically for two reasons. The first one is to reduce the interpretation time and the second one to enhance the accuracy of interpretation as much as possible. In this paper, one machine learning algorithm is developed to scroll and classify automatically the PSG recordings. As the result, the algorithm displays the regions of interest of the whole recorded time series. Our innovation in this work lies in the development of an algorithm able to extract automatically regions of interest from the long PSG recordings and to analyze the sleep quality of the patient.
The rest of the paper is structured as follows. Section II presents the related works. Section III discusses materials and methods. Section IV presents features extraction. Section V illustrates experiment protocol and results. Section VI concludes the paper.
II.RELATED WORKS
Alexandre Domingues et al. [7] introduced a new approach to analyze automatically the hypnogram and extract the sleep parameters in that study the hypnogram estimation accuracy reached 78.3%. Actually, that value is good but thanks the new models of artificial intelligence (AI) the accuracy could be improved little bit, because the member of the American Academy of Sleep Medicine (AASM) Rosenberg et al. [8] already developed an algorithm for the same purpose with an accuracy of 83% and the study was done one year before. Unfortunately, the both previous works are based on the ECG and respiration. But the ECG does not reflect directly the sleep stages. When the heart beats slow down, that indicates a relaxing feeling. But for more estimation of the sleep stages, only the brain waves can indicate it.
In this paper, the hypnogram will be estimated using basically the EEG signal recoded during a PSG recording. The idea behind is to analyze the brain waves alpha (α), theta (θ), beta (β), delta (δ), and gamma (γ) because their frequency and amplitudes change when the sleep state changes. But this kind of EEG signal processing is too primitive. That is why it was decided to perform the hypnogram estimation using deep learning algorithm developed. In order to test the efficiency and the accuracy of our algorithm, we have 38 real PSG recordings already anonymized. Those data were recoded using an Alice 6 LDxS PSG form Philips Respironics [9]. The specifications of the recording system (RS) are described in Table I.
Table I. Alice 6 LDxS technical specifications
| Sampling frequency | 2000 Hz |
| Maximum recorded frequency | 500 Hz |
| Resolution | 16 bits |
| Electrooculogram (EOG) | Independent referencing |
| Pulse transit time (PTT) | Available |
The PSG recording sessions are essential for evaluating sleep patterns and diagnosing sleep disorders. PSG involves the simultaneous measurement and recording of multiple physiological signals during sleep, including brain activity (EEG) [10], eye movements (EOG), muscle activity (EMG) [11], heart rate, respiratory effort, and oxygen levels. These recordings provide valuable insights into an individual’s sleep architecture and help in the detection of various sleep stages and abnormalities. During a PSG recording session, a person typically spends a night in a sleep laboratory or a controlled environment, while sensors are attached to their body to capture the relevant physiological signals. These signals are then amplified, filtered, and digitally recorded for subsequent analysis. The analysis of PSG data involves several steps [12], including data preprocessing, artifact removal, sleep stage scoring, event detection, and interpretation. Visual scoring by trained sleep experts has traditionally been the gold standard for sleep stage identification, but it is time-consuming and subject to interobserver variability. To address these challenges, various automated techniques have been developed to assist in the analysis of PSG data. These techniques include automatic event detection algorithms, machine learning models trained on labeled data [13], spectral analysis, time-frequency analysis, and feature extraction combined with classification algorithms. These automated methods aim to improve the efficiency and objectivity of sleep stage detection and hypnogram generation [14]. The combination of PSG recording sessions with advanced analysis methods enables clinicians and researchers to gain valuable insights into an individual’s sleep patterns, such as the duration and distribution of sleep stages, the presence of sleep disorders like sleep apnea or insomnia, and the evaluation of treatment efficacy [15].
III.MATERIALS AND METHODS
This section consists out of three parts. The first part presents the used datasets description and their collections. The second part gives an overview on the artifacts inside the EEG signals and also an overview about the sleep stages. The last part contains the flow chart of the whole algorithm to detect automatically the hypnogram of the EEG and also the most significant figures.
A.DATA COLLECTION
Our dataset including patient’s information and PSG recordings was downloaded from PhysioNet database platform. Those data downloaded only for training and validation. We obtained the test data locally from one of the Moroccan companies which is specialized in sleep analysis and PSG systems. The name and location of the company are not published because of the ethics and data privacy requirements. PhysioNet is a widely recognized and valuable resource in the field of biomedical research and computational physiology. It is an online repository of physiological signal and time series data, as well as related software tools and resources. PhysioNet is managed by the PhysioNet Research Resource for Complex Physiologic Signals, which is a project of the Laboratory for Computational Physiology at the Massachusetts Institute of Technology (MIT) in collaboration with other institutions
B.DATA PREPARATION
Before starting any EEG signal processing, the EEG signals must be cleaned as much as possible. We know that all physiological signals are full of artifacts because the biosignals overlap to each other in terms of frequency [16]. In general, there are two kinds of artifacts: the first one is related basically to the recording device such as the power supply frequency 50 or 60 H depending on the local electricity network configuration of each country. It can be also 400 H if the RS is powered in the plane. Another RS-related noise can be the white noise caused by the resistive components and also the gaussian noise [17]. The second category of noise is related mainly to the patient like the EMG, the electrooculogram (EOG), and the ECG [18].
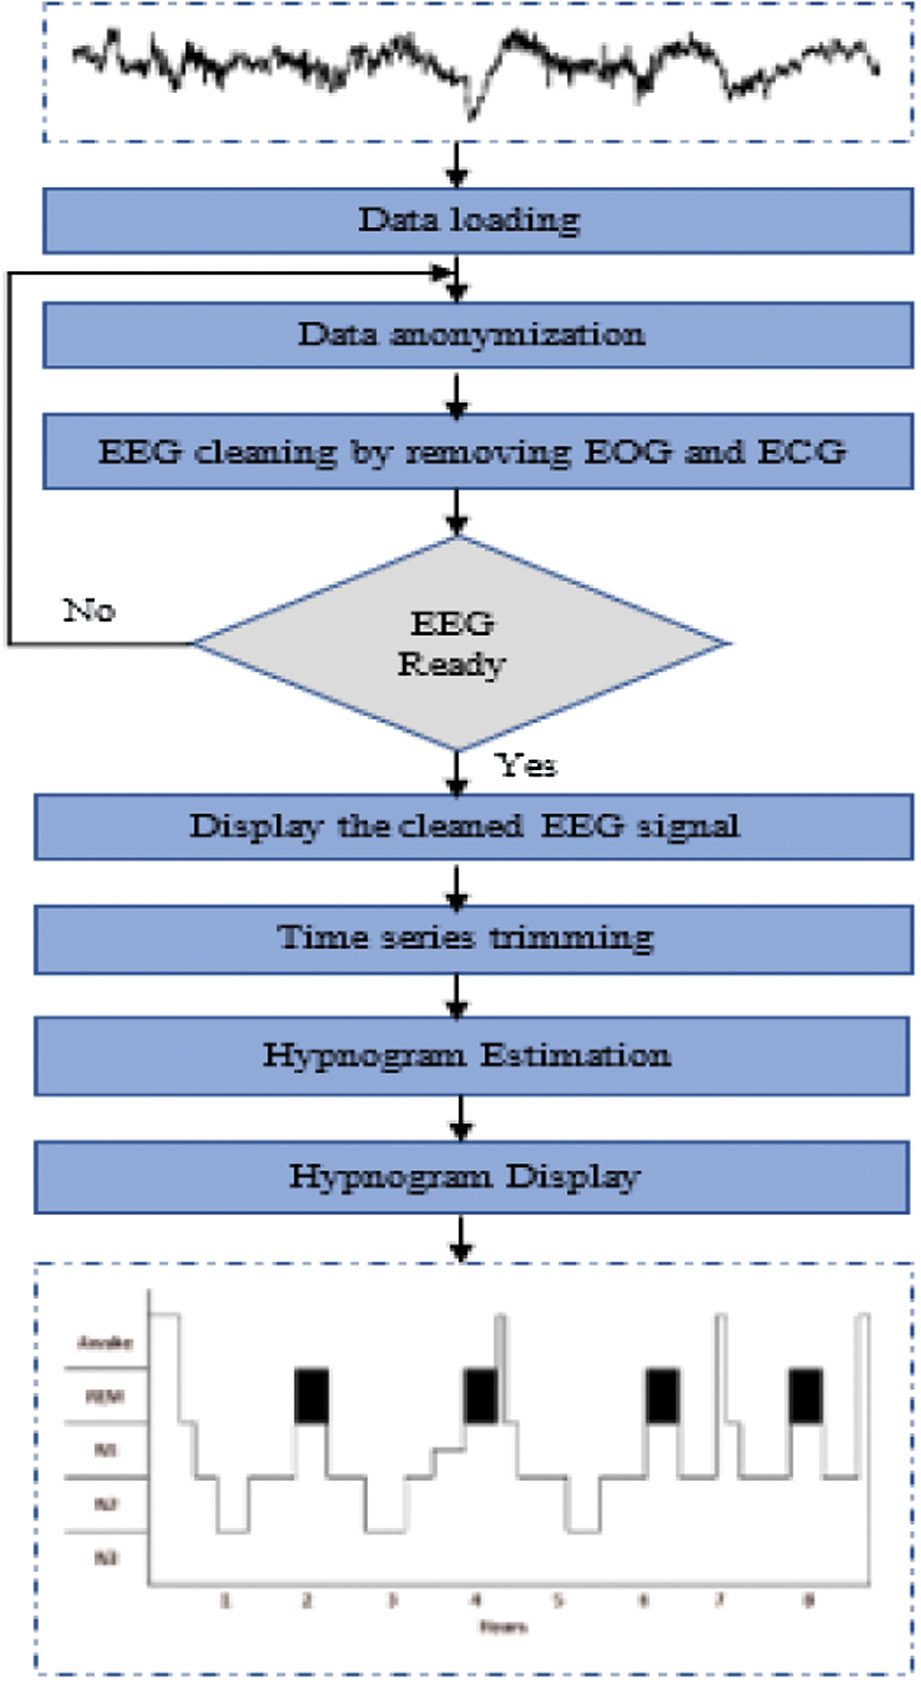
In this section, the patient-related artifacts will be removed, especially the EOG and the ECG as the main artifacts for our purpose. But this step will be done after data anonymization and annotation for the real signals as shown in the flow chart in Fig. 3. For the PhysioNet, signals are already anonymized. The EEG recording downloaded from PhysioNet contains a large range of the wake stage. For this reason, the time series must be trimmed before starting the hypnogram detection. An important step must also be performed before running the detection process. We mean here the labels selection because the downloaded dataset is annotated with eight labels [19]: Wake (W), Stage 1, Stage 2, Stage 3, Stage 4, REM sleep (R), movement (M), and Stage (?). But our target in this paper is only five stages in order to detect the hypnogram.
- Stage 1: wakefulness is the normal state with the daily activity conditions.
- Stage 2: Drowsiness is the state when the person starts to be drowsy, a transition between wakefulness and sleep. During this stage, all muscles begin to relax. Moreover, the drowsy person can be awakened easily; in terms of timing, this stage represents 5–10% of the whole sleep time. If we do like to see this stage from the brain electrical activity view, the alpha waves get slower during drowsiness in adults, that is, if the drowsiness becomes deeper, the alpha waves get slower accordingly in terms of amplitude and frequency as well.
- Stage 3: Light sleep is the stage when eye movement stops. During this stage, the brain waves slow down.
- Stage 4: Deep sleep and very deep sleep is the stage when delta waves start to appear and start to become more dominant.
- Stage 5: REM is the last stage of sleep cycle and takes up to 20–25% of the total sleep duration. It must appear 4 to 5 times of a normal sleep duration of 8 to 9 hours [20].
C.TOP-DOWN SURVEY OF THE ALGORITHM
1)FLOW CHART
The proposed flow chart will be organized into two big parts. The first part concerns data preparation and preprocessing, and the second part handles the hypnogram detection as shown in Fig. 3.
2)REVIEW ON SLEEP STAGES DETECTION
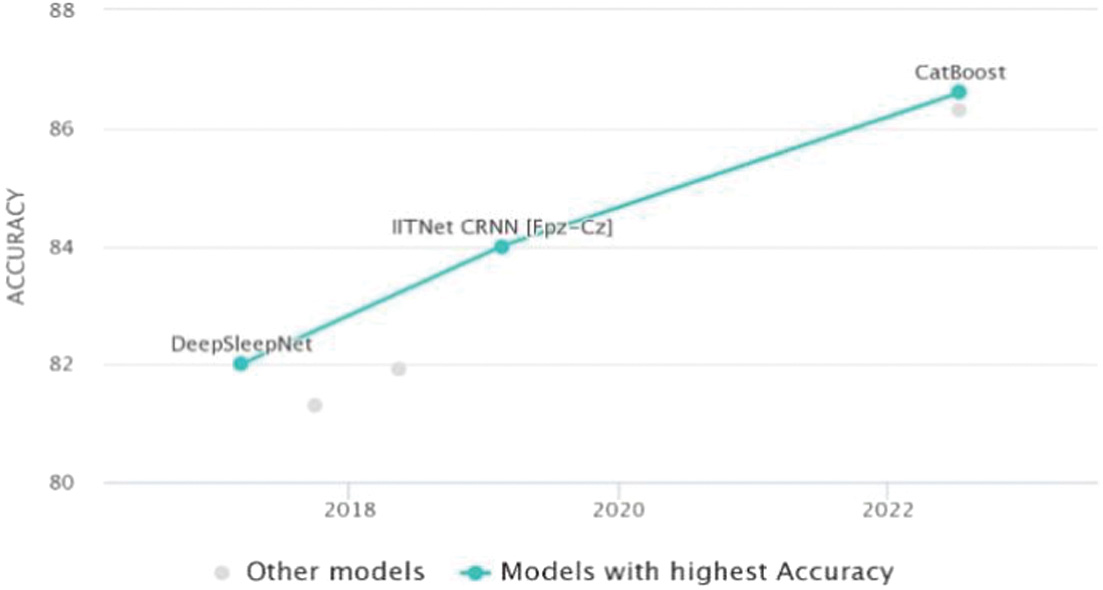
The sleep stages classification is one of the most relevant expertise areas in the last few years. Table II illustrates different algorithms to detect the sleep stages and their accuracy as well.
Table II. The accuracy of different methods
| Rank | Method | Accuracy | Year | Ref |
|---|---|---|---|---|
| 1 | CatBoost | 86.6% | 2022 | [ |
| 2 | Linear model | 86.3% | 2022 | [ |
| 3 | IITNet CRNN [Fpz-Cz] | 84.0% | 2019 | [ |
| 4 | DeepSleepNet | 82.0% | 2017 | [ |
| 5 | Multitask 1-max CNN | 81.9% | 2018 | [ |
| 6 | Deep CNN with transfer learning | 81.3 | 2017 | [ |
The accuracy has been changed significantly from 2017 to 2022 as illustrated in Fig. 4, and this is taken for granted because everything affects everything [26]. Scientists and engineers are working continuously to improve the performance of such algorithms (Fig. 4).
IV.FEATURE EXTRACTION
A.BRAIN WAVES EXTRACTION
In order to detect the sleep depth or the sleep stages, there are four features that have to be calculated. We mean here the brain waves of the EEG signal, including alpha (α), theta (θ), beta (β), and delta (δ). Those are the most indicative of the sleep changes as described by the AASM [27]. The frequency bands are illustrated in Table III.
Table III. The accuracy of different methods
| Band | Frequency (Hz) |
|---|---|
| Delta | 0 to 2.5 |
| Theta | 2.5 – 6.8 |
| Alpha | 6.8–14 |
| Beta | 14–35 |
Extracting brain waves, also known as EEG analysis, involves analyzing the electrical activity recorded from the scalp to identify and interpret different patterns of brain waves. In fact, the brain waves extraction process is done as follows:
- ‐Data acquisition: EEG signals are typically recorded using electrodes placed on the scalp. These electrodes detect the electrical potentials generated by the brain’s neural activity. The signals are amplified and digitized for further analysis.
- ‐Preprocessing: The acquired EEG data often contains noise and artifacts that need to be reduced or eliminated. Common preprocessing steps include filtering the signals to remove unwanted frequencies (e.g., high-pass or low-pass filters), removing artifacts caused by eye movements or muscle activity, and correcting for baseline drift.
- ‐Epoching: EEG data is divided into epochs or segments, typically lasting a few seconds each. Epoching is done to focus on specific events or tasks within the EEG recording, such as analyzing responses to stimuli or studying different stages of sleep. Epochs allow for a more detailed examination of brain wave patterns during specific time intervals.
- ‐Power spectrum analysis: The power spectrum represents the distribution of power across different frequency bands in the EEG signal. By applying a Fourier transform or other spectral analysis methods to each epoch, the power spectral density can be computed. This analysis reveals the strength or power of brain waves at different frequencies, as detailed in Table III.
- ‐Event-related potentials (ERPs): ERPs are specific components of the EEG signal that are time-locked to external stimuli or events. By averaging the EEG epochs corresponding to a specific event, such as a visual stimulus or auditory tone, researchers can extract ERPs. Examples of ERPs include the P300 wave, N100 wave, and N200 wave, which are associated with different cognitive processes.
- ‐Time-frequency analysis: In addition to power spectrum analysis, time-frequency analysis methods, such as wavelet transforms or spectrograms, can be applied to examine changes in EEG power across both time and frequency. This analysis helps identify transient changes and oscillatory patterns in brain activity.
- ‐Source localization: EEG signals are inherently spatially blurred due to volume conduction, meaning that signals recorded at the scalp reflect activity from multiple brain regions. Source localization techniques aim to estimate the underlying neural sources responsible for the observed scalp potentials. Methods such as dipole modeling, beamforming, or distributed source imaging are employed to reconstruct the brain sources from the EEG data.
B.HYPNOGRAM DETECTION METHODS
Hypnogram detection refers to the process of analyzing sleep data, typically obtained from PSG, to identify and classify different stages of sleep based on characteristic patterns of brain activity. Several methods can be used to detect hypnograms, including: visual scoring: in this method, trained sleep experts manually review the PSG data and visually identify and label different sleep stages based on established criteria. This approach is time-consuming and subjective [28], but it has been the gold standard for hypnogram detection. Automatic event detection [29]: automated algorithms can be used to detect specific events in sleep data, such as characteristic patterns in EEG signals, eye movements (EOG), or muscle activity (EMG). These events can be indicative of different sleep stages, allowing for automated hypnogram detection. Machine learning: machine learning techniques [30], such as artificial neural networks or support vector machines, can be trained on large datasets of manually scored hypnograms. These models learn patterns and features in the data that correspond to different sleep stages and can then be used to automatically classify new PSG recordings. Spectral analysis: this method involves examining the frequency content of the EEG signals to identify characteristic patterns associated with different sleep stages. Different sleep stages exhibit distinct spectral profiles, and these can be used to classify and detect hypnograms. Time-frequency analysis: this method combines both time and frequency information from the EEG signals to identify sleep stages. Techniques such as the wavelet transform or short-time Fourier transform can be applied to analyze the changing frequency content of the EEG over time. Feature extraction and classification: various features can be extracted from the raw PSG data, such as power spectra, entropy measures, or statistical properties. These features can then be used in combination with classification algorithms to detect hypnograms. It is worth noting that different methods may be used in combination to improve accuracy and reliability. Additionally, advancements in machine learning and AI have led to the development of more sophisticated algorithms for automatic hypnogram detection.
C.EQUATIONS
In order to deal with the calculation, will be our frequency score as described in the equation (1):
In the same perspective, is the amplitude score, that peaks at 4 μV, expresses the segment’s amplitude as expected for a spindle:
V.EXPERIMENT PROTOCOL AND RESULTS
A.PROCEDURE DESCRIPTION
The PSG was performed during the night of Monday, 8 March 2021. The following parameters were monitored: frontal, central, and occipital EEG, EOG, EMG under the chin, nasal, and oral airflow, EMG of the tibialis anterior muscle, body position, and ECG. Additionally, chest and abdominal movements were recorded by inductance plethysmography. Oxygen saturation (SpO2) was recorded with a pulse oximeter. The plot was scored using epochs of 30 seconds. Hypopneas were scored according to AASM VIII4.B definition (3% desaturation).
B.SLEEP STRUCTURE
During a PSG session, the sleep structure is typically divided into several distinct stages, reflecting different patterns of brain activity and physiological changes. These stages are collectively known as the sleep architecture and include wakefulness, REM sleep [31], and non-rapid eye movement (NREM) sleep [32]. Let us explore each of these stages. Wakefulness: this stage represents the period when a person is fully awake and alert. The PSG recordings during wakefulness show characteristic patterns of brain activity with alpha and beta waves in the EEG signal [33]. Eye movements and muscle activity can also be observed. NREM sleep: NREM sleep is further divided into three stages, N1, N2, and N3, representing progressively deeper sleep. N1 (Stage 1): this is the lightest stage of NREM sleep. The EEG shows predominantly theta waves, and muscle activity gradually decreases. This stage is often associated with drifting in and out of sleep and can be easily disrupted. N2 (Stage 2): N2 is a more stable stage of NREM sleep [34]. The EEG displays a mixture of theta waves, sleep spindles (bursts of rapid brain activity), and K-complexes (sharp waveforms). Eye movements and muscle activity decrease further. N3 (Stage 3): it is also known as slow-wave sleep (SWS) or deep sleep and is characterized by slow delta waves in the EEG. This stage represents the deepest and most restorative sleep, with minimal eye movements and reduced muscle activity. It is during this stage that the body undergoes important physiological processes, such as tissue repair, hormone release, and memory consolidation. REM sleep: it is a unique stage characterized by rapid eye movements, vivid dreaming, and a highly active brain. The EEG shows low-amplitude, fast, and desynchronized waves resembling wakefulness. Muscle activity is minimal due to REM sleep’s state of muscle atonia or temporary paralysis, which prevents acting out dreams [35]. REM sleep is associated with cognitive processing, emotional regulation, and memory consolidation.
The sleep structure during a PSG session typically follows a cyclical pattern, with multiple transitions between NREM and REM sleep throughout the night. These sleep cycles usually last around 90 to 120 minutes, with NREM sleep occupying a larger proportion in the earlier part of the night and REM sleep becoming more prominent in the later sleep cycles.
By analyzing the PSG data and visually scoring the sleep stages or employing automated algorithms, sleep experts can determine the sleep structure and identify any abnormalities or disruptions in the sleep architecture. This information is crucial for diagnosing sleep disorders, evaluating sleep quality, and designing appropriate treatment strategies (Tables IV and V).
| 21:17:21 | |
| 08:07:21 | |
| 650.0 minutes | |
| 650.0 minutes | |
| 542.0 minutes | |
| 389.0 minutes | |
| 59.8 % | |
| 100.5 minutes | |
| 160.5 minutes |
| Sleep stages | duration | % TST | Latency | |
|---|---|---|---|---|
| 88.5 min | 22.8 % | 100.5 min | ||
| 182.5 min | 46.9 % | 104.0 min | ||
| 50.0 min | 12.9 % | 111.5 min | ||
| 68.0 min | 17.5 % | 323.0 min | ||
C.OBTAINED RESULTS AFTER THE PSG ANALYSIS
Actually, the results of our algorithm as illustrated in Fig 5 is the detection of different stages of the sleep during a complete night. Afterward, the sleep quality will be determined according to the hypnogram format and also according to the percentage of each stage during the whole night (Fig. 5).
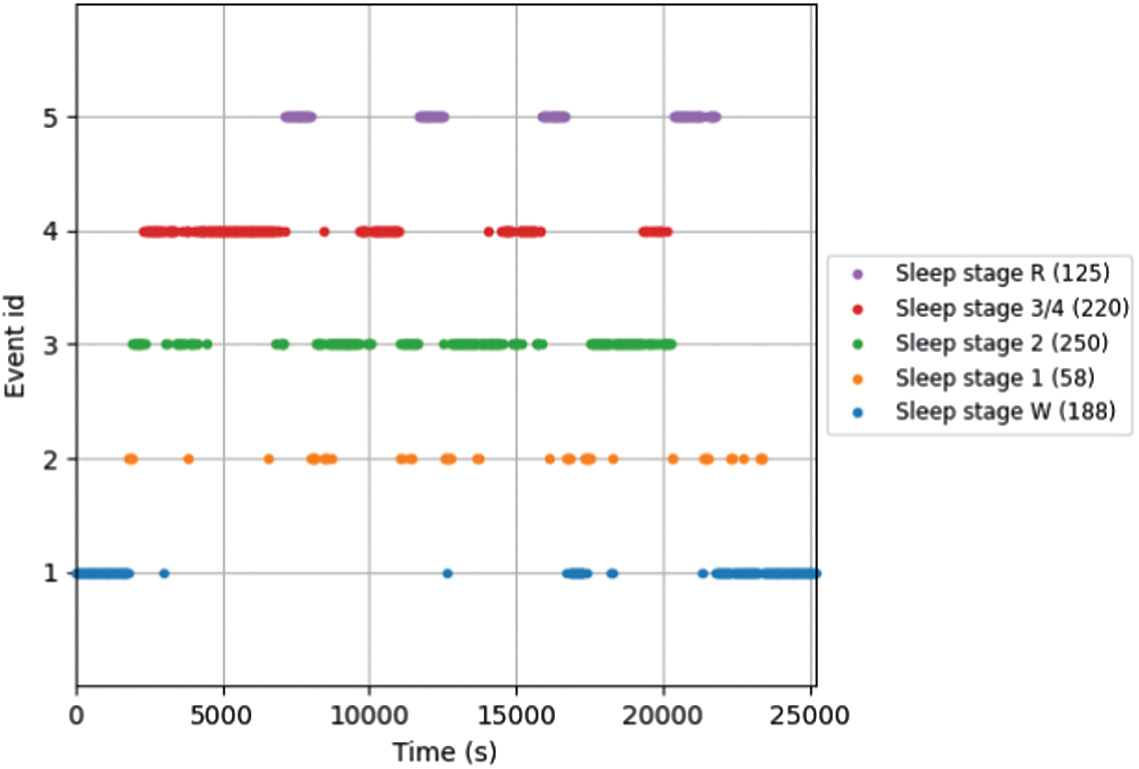 Fig. 5. The hypnogram displayed in a stage format.
For the automatic sleep quality analysis, our algorithm results are displayed in a chart in Fig. 6 to the medical staff. Afterward, they will make the proper decision accordingly, and it depends mainly on the physiological conditions of the patient. Also, it depends on predefined values of the sleep quality analysis. Sleep quality refers to the overall subjective and objective assessment of the effectiveness, restfulness, and restorative nature of an individual’s sleep. Evaluating sleep quality is essential as it directly impacts physical health, mental well-being, cognitive function, and overall quality of life. Our algorithm stills in the stage of trials and development, and for more efficiency, we must move to the stage of in vivo trials. For that purpose, we need to follow a protocol similar to the drug development [36] (Fig. 6).
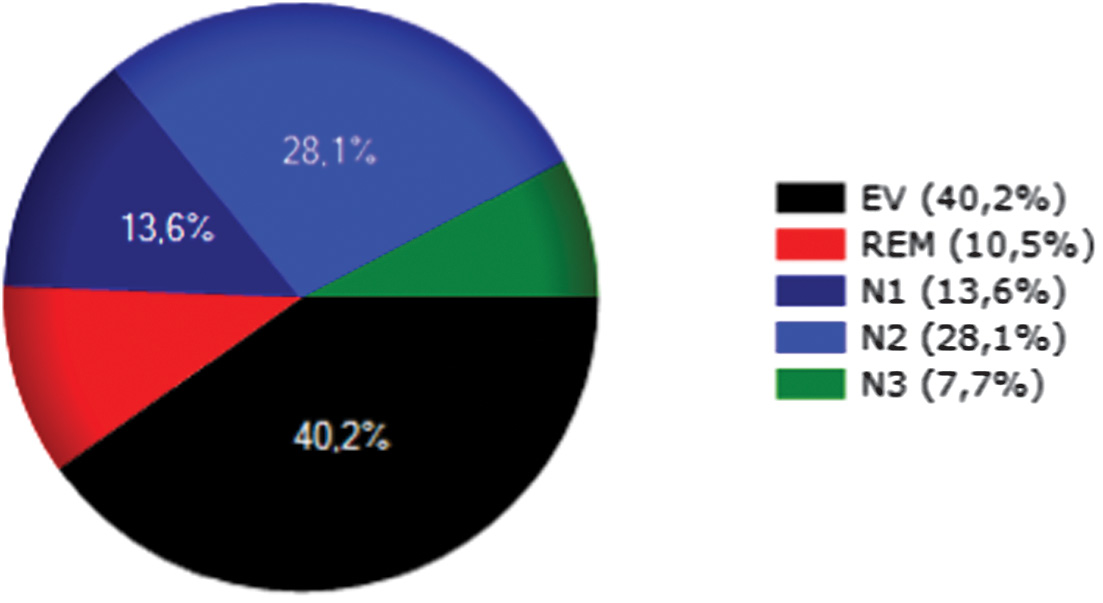 Fig. 6. Sleep quality analysis result for a complete night.
In general, assessing and ensuring good sleep quality is vital for maintaining overall health and well-being. It requires a balance of sufficient sleep duration, optimal sleep architecture, minimal disturbances, and subjective satisfaction with sleep. By understanding the factors that influence sleep quality and implementing strategies to improve it, individuals can enhance their sleep and enjoy the benefits of restorative and rejuvenating rest.
VI.CONCLUSION
PSG recording sessions play a crucial role in sleep medicine and research by providing detailed and objective information about an individual’s sleep patterns. The subsequent analysis of PSG data using manual or automated methods allows for the detection of sleep stages, identification of sleep disorders, and assessment of treatment outcomes. These insights contribute to better understanding and management of sleep-related issues, ultimately promoting healthy sleep and well-being.
Our first target was mainly to propose an algorithm for automatic sleep analysis using the EEG signal recorded during a PSG session. First, we studied all the theories and gave an overview about all sleep physiology-related topics. Second, we extracted the needed features. Finally, we conducted experiments and displayed the sleep analysis results. In fact, the most challenging task to carry out this work is to have real dataset. Afterward, we contacted a company for that. They gave us 38 anonymized recordings, and their condition was to not publish the company name because they can have some conflict problems with patients.