I.INTRODUCTION
With the development of cognitive-inspired computing and interaction systems, cognition is emerging as a promising paradigm that has the potential to transform our way of life. The process through which a system develops strong adaptive, anticipatory, and autonomous behavior that involves embodied perception and action is known as cognition [1]. These techniques are widely used in distributed denial of service defense mechanisms, sentiment analysis and classification, 5G communications, and healthcare applications [2–5]. The Internet of Things (IoT) is now widely used in various applications, and as a result, its significance in daily life is growing. For the purpose of effectively supplying patients with emergency services, IoT technology is also being developed in the healthcare monitoring system [6]. The IoT revolution has also changed how modern healthcare systems and management are organized. The greatest promise of IoT is to significantly advance the field of healthcare [7]. Several techniques including Radio-Frequency Identification, Edge Computing, Semantics, Cloud Computing, Big Data, Grid Computing, and Augmented Reality are used for IoT-based healthcare systems, and it has been observed that IoT-based healthcare will increase day by day in the upcoming years [8].
Remote health monitoring systems now have a much wider range of applications because of the quick advancement of technology. Due to the low doctor-to-patient ratio, the primary goal of this study is to make it easier for cardiac patients who live in distant areas to access the most up-to-date medical care [9]. The body area sensor network framework is intended to be adopted by a wearable IoT-cloud-based health monitoring system in support of real-time health monitoring. The heartbeat, body temperature, and blood pressure sensors are only a few of the embedded wearable sensors [10]. A real-time health monitoring system called HealthSOS is presented for stroke prognostics. Thirty-seven stroke victims who had been admitted to a hospital’s emergency room and 36 senior volunteers in good health were used to test this technique [11]. Environmental causes and associated air pollution are thought to be major contributors to the rise in respiratory disorders, particularly asthma, which is still a major issue. These disorders are frequently accompanied by symptoms like airway obstruction, chest discomfort or pain, cough, wheezes, or other strange sounds made when breathing [12].
A method for characterizing and detecting respiratory diseases is present using respiratory sounds saved in audio format with a supervised model. Two classifier models are used where a feature vector is an input for a second classifier intended to characterize the lung disease if the patient is diagnosed with a (generic) lung disease [13]. In another work, an effective deep learning framework for auscultation analysis is presented and examined in this research. This uses respiratory sound recordings to categorize abnormalities in respiratory cycles and identify illnesses. The spectrogram characteristics are then categorized into categories of respiratory abnormality cycles or diseases using a back-end deep learning network [14]. To compare the classification of interstitial lung disease patterns using shallow and deep learning, a convolution neural network (CNN) is used with six learnable layers, four of which were convolutional and two of which were completely linked.
An objective of study was to develop and validate a classification algorithm for the early identification of patients, with a background of chronic obstructive pulmonary disease (COPD), who appear to be at high risk of an imminent exacerbation event [15]. A secured custom reusable intellectual property core for the CNN using facial biometrics has been proposed in ref. [16]. A multilayer perceptron-based artificial neural network classifier model using a backpropagation algorithm is used to predict the peak events in hospital emergency departments for respiratory diseases in Dallas County of Texas due to respiratory diseases. The ANN model achieves an overall accuracy of 81% in predicting peak and nonpeak events [17].
In modern healthcare, audio classification can be used for cardiac assessment and respiratory check-ups using a stethoscope and sonography. This study is taken for heart and lung disease detection with 85% accuracy for helping doctors in making better diagnoses using the hidden Markov model [18]. Computational complexity plays a crucial role in the implementation of real-time healthcare systems. For remote cardiovascular monitoring, a simple method with low computational complexity for extracting the fiducial points from the electrocardiogram has been developed. Here, continuous sensing and processing are performed in computationally limited, low-power devices; therefore, power consumption and algorithm complexity should be kept to a minimum [19]. Big healthcare data analytics that use huge and diverse data have a trade-off between the value of conventional hypothesis-driven inference and statistical significance with computational efficiency, protocol complexity, and methodological validity [20]. In the past, decisions on patient care were solely dependent on the doctor’s professional experience, subject-matter expertise, physical symptoms, and diagnostic test results. In contrast, new tools, items, and technologies have emerged that play a vital part in healthcare monitoring and aid medical professionals in making wiser decisions. In U-healthcare monitoring system topologies, the cloud paradigm serves as the foundation for on-demand network utilization of a shared pool of reconfigurable computing resources. However, it has several drawbacks that are resolved by fog [21].
Deep neural networks have a very small computational and power budget; therefore, their adoption on low-power-embedded devices is hampered in particular by the memory and computing needs. A second rapid convolution stage is added to the first stage of computational intensity reduction using a modified Toom-Cook technique. At this point, there are far fewer powerful operations overall without any approximations that might compromise precision. Strong proof that a large speedup may be obtained without sacrificing baseline accuracy by combining optimizing the network’s topology and the underlying implementation of basic convolution operations is provided by the evaluation’s findings running on a variety of real hardware [22]. In another interesting study, it is observed that neural networks take higher computational complexity for training. The importance of computational complexity has been studied with both positive and negative results to provide new provably efficient and practical algorithms for training certain types of neural networks [23]. Using a neural network expert system, computationally effective classifiers for classifying the Frank lead ECG as normal or one of six illness states are studied [24]. The Daubechies wavelet of order 10 (dB 10) and the Symlet wavelet of order 8 (sym8) applied to a single beat of the X, Y, and Z Frank leads are two discrete wavelets included in this. These findings were obtained at a substantially lower computing cost than those obtained from neural networks trained with more than 229 scalar parameters. Cascaded neural networks are being used instead of a single neural network for higher accuracy, and it has been used for several tasks including land-use classification, improved protein contact map prediction, face detection, and speech emotion recognition [25–28].
A.RESEARCH GAP AND CONTRIBUTION
It has been observed from the literature review that in the domain of smart healthcare using IoT, cognitive-inspired computing plays a crucial role. Real-time healthcare monitoring is an important criterion specifically in the case of respiratory diseases. To achieve this, many speech recognition models are designed. However, very few works are reported in the context of reducing the computational complexity without compromising on the accuracy. To solve this problem, a cascaded neural network architecture is proposed in this paper using a perceptual functional link artificial neural network (PFLANN). Based on the research gap, the main contributions of the paper are the use of cascaded PFLANN for effectively capturing the perceptual nonlinearity of human speech perception technique, training and testing the model with eight datasets covering multiple respiratory diseases, reduction of the computational complexity of the model, and statistical analysis of the classifier models used in multiple respiratory diseases and multiple datasets.
The paper is divided into four sections, with Section I covering the introduction, literature overview, research motives, and research goals. Section II deals with the specifics of the tools and techniques used. The results analysis and contributions in terms of study findings are found in Section III. Section IV presents the research’s findings, restrictions, and areas of potential future study.
II.MATERIAL AND METHODS
A.DATASETS
The dataset-1 contains the voiced samples for the diseases such as hyperfunctional dysphonia, functional dysphonia, laryngitis, vocal fold polyps, and leukoplakia. The samples are taken from Saarbruecken Voice Database which is created by Phonetics at the University of Saarland, Germany, which includes voice samples of more than 2000 people. The vowels /a/, /i/, and /u/ at normal pitch are recorded 259 times each in healthy and sick conditions with a maximum duration of 4 seconds, sampling at a rate of 50 kHz, and 16 bits per sample with equal number of male and female voices. For the study of COVID-19, five datasets have been used, including Coswara (dataset-2) [29], Crowd-sourced University of Cambridge (dataset-3) [30], Virufy (dataset-4) [31], recorded interviews from online platforms in telephone quality speech (dataset-5) [32], and Coughvid (dataset- 6) [33]. These datasets contain speech samples of subjects from more than 52 countries. A total of 4398 speech samples have been used in the simulation study which includes 280, 796, 636, 121, 702, and 2310 samples from datasets 1, 2, 3, 4, 5, and 6, respectively, with approximately equal numbers of speech samples from healthy and diseased categories. Dataset-7 has been taken from the respiratory and drug actuation dataset which was recorded at the University of Patras under a controlled environment [34]. The audio signals have been recorded during breathing and drug actuation. A total of 370 audio files have been recorded with an 8-KHz sampling frequency and 8-bit depth in WAV format. For experimentation, in the current implementation, 193 drug actuation segments, 319 inhalation, and 620 exhalation segments are used. The dataset-8 is collected from the ALSD-Net dataset which was recorded at Fortis Hospital, India. The pulmonary sound dataset is divided into two categories: abnormal (pulmonary patients) and normal (healthy). An e-stethoscope that was connected to a laptop with an amplifier to record the lung sound was used. An electronic stethoscope with a chest piece that contacts the subject and a microphone to record the signal was used. The audio samples are recorded in WAV format with a 44.1-kHz sampling rate, 16 bits per sample, and 10 s duration of each file.
B.PFLANN MODEL
FLANN is one of the computationally efficient and effective forms of the traditional neural network model [35,36]. Recently, the PFLANN model has been developed for intelligent water fountain sound pleasantness monitoring [37]. The whole analysis is divided into three frequency regions: low, medium, and high, and each region’s output is associated with its specific weight. This modification in the FLANN model is done considering the response of human speech perception to different frequency regions. The trigonometric functional expansion is used for its impressive results in ref [37]. The human auditory system’s frequency response has been found to be nonlinear in speech processing. The frequency unit Mel, which is based on perception, serves as a representation of this nonlinearity. The audio signal is transformed from the linear frequency to the perceptual domain by employing the Mel filter bank [37]. The relationship between the linear scale (f) and Mel scale (fm) can be expressed as:
The low-frequency region (0 Hz–300 Hz), mid-frequency region (300 Hz –5 kHz), and high-frequency region (5 kHz–20 kHz) have the importance, or the weighted parameters are found to be 0.33, 0.58, and 0.08, respectively. These values are calculated by using the number of filters in each region and the average peak amplitude of filters. The weights of the PFLANN model have been updated using the particle swarm intelligence technique as mentioned in ref. [37,38].
C.CASCADED PFLANN MODEL
Instead, using a single hidden layer in the case of PFLANN model, the overall accuracy in the detection of respiratory diseases can be greatly enhanced by cascading PFLANN [39,40]. This approach has been considered in this paper with PSO as the weight updation scheme, and the details are mentioned in Fig. 1.
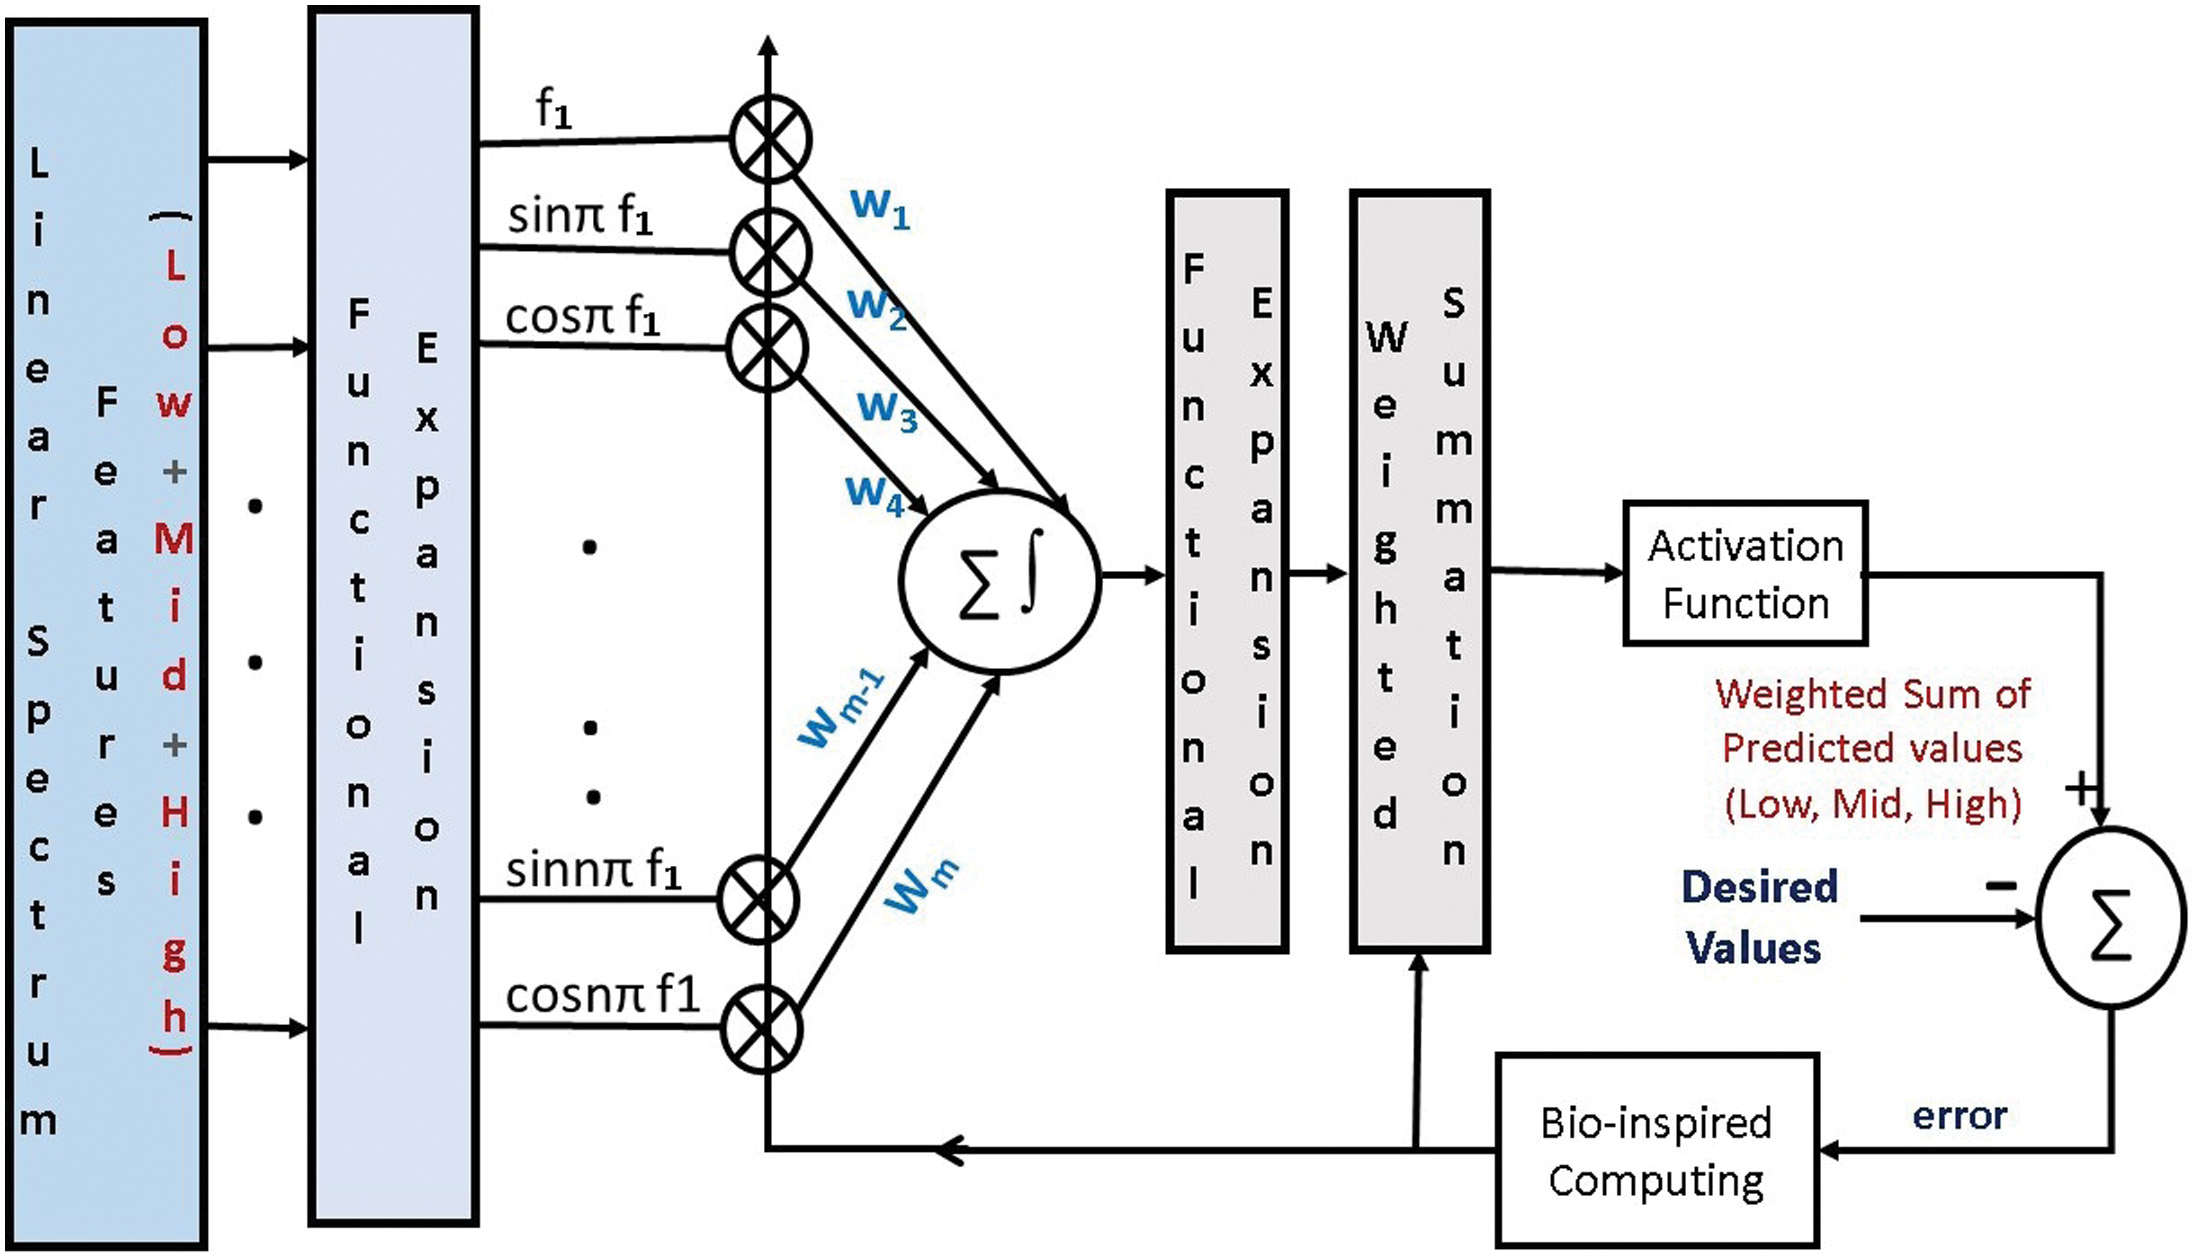 Fig. 1. Block diagram of implementation of cascaded PFLANN model.
The traditional PFLANN model has one hidden layer with weights w, input, and outputs x and y. The relevant equations of the FLANN are listed in Equation (2):
The input features are divided into three categories such as: low, medium, and high-frequency ranges. The output y has been further expanded by using another triangular expansion. Finally, the predicted output is compared with the actual output and the error is calculated. For decreasing the error, the weights are updated using the bio-inspired computing. In this case, PSO has been used for the weight updation. For the activation function, tanh has been used in the current implementation after the weighted summation at output of both the layers. The mean square error (MSE), which is derived from the error terms, is computed; once the MSE reaches the minimum value, the training procedure is terminated.III.SIMULATION RESULTS AND DISCUSSIONS
In this section, the details of the experimental design and performance evaluation measures are presented.
Step 1: Dataset preparation — In the first step, the eight respiratory datasets have been downloaded and divided mainly into two categories such as: healthy and diseased except dataset-7. For the dataset-7, three classes have been considered, including drug actuation, inhalation, and exhalation.
Step 2: Feature extraction frame-wise — In this step, framing and windowing is applied to the input speech samples. Out of different available windows, the Hamming window is used because of low spectral leakage, and the 25 ms window size is used with 50% overlapping. Then, at the frame level, one-sided linear spectrum features are extracted and divided into three categories considering frequency ranges such as low (0 Hz–300 Hz), mid (300 Hz –5 kHz), and high (5 kHz – 20 kHz). At the sample level, the two statistical features such as mean and variance are extracted.
Step 3: Classification using cascaded PFLANN and baseline classifiers — The speech sample level feature vectors extracted in step 2 are given as input to the proposed cascaded PFLANN. The classifier is then trained and evaluated using two cross-validation schemes such as leave-one-out and k-fold. The proposed model is shown in Fig. 2. The results of the proposed model are compared with the standard classifiers used in the original datasets.
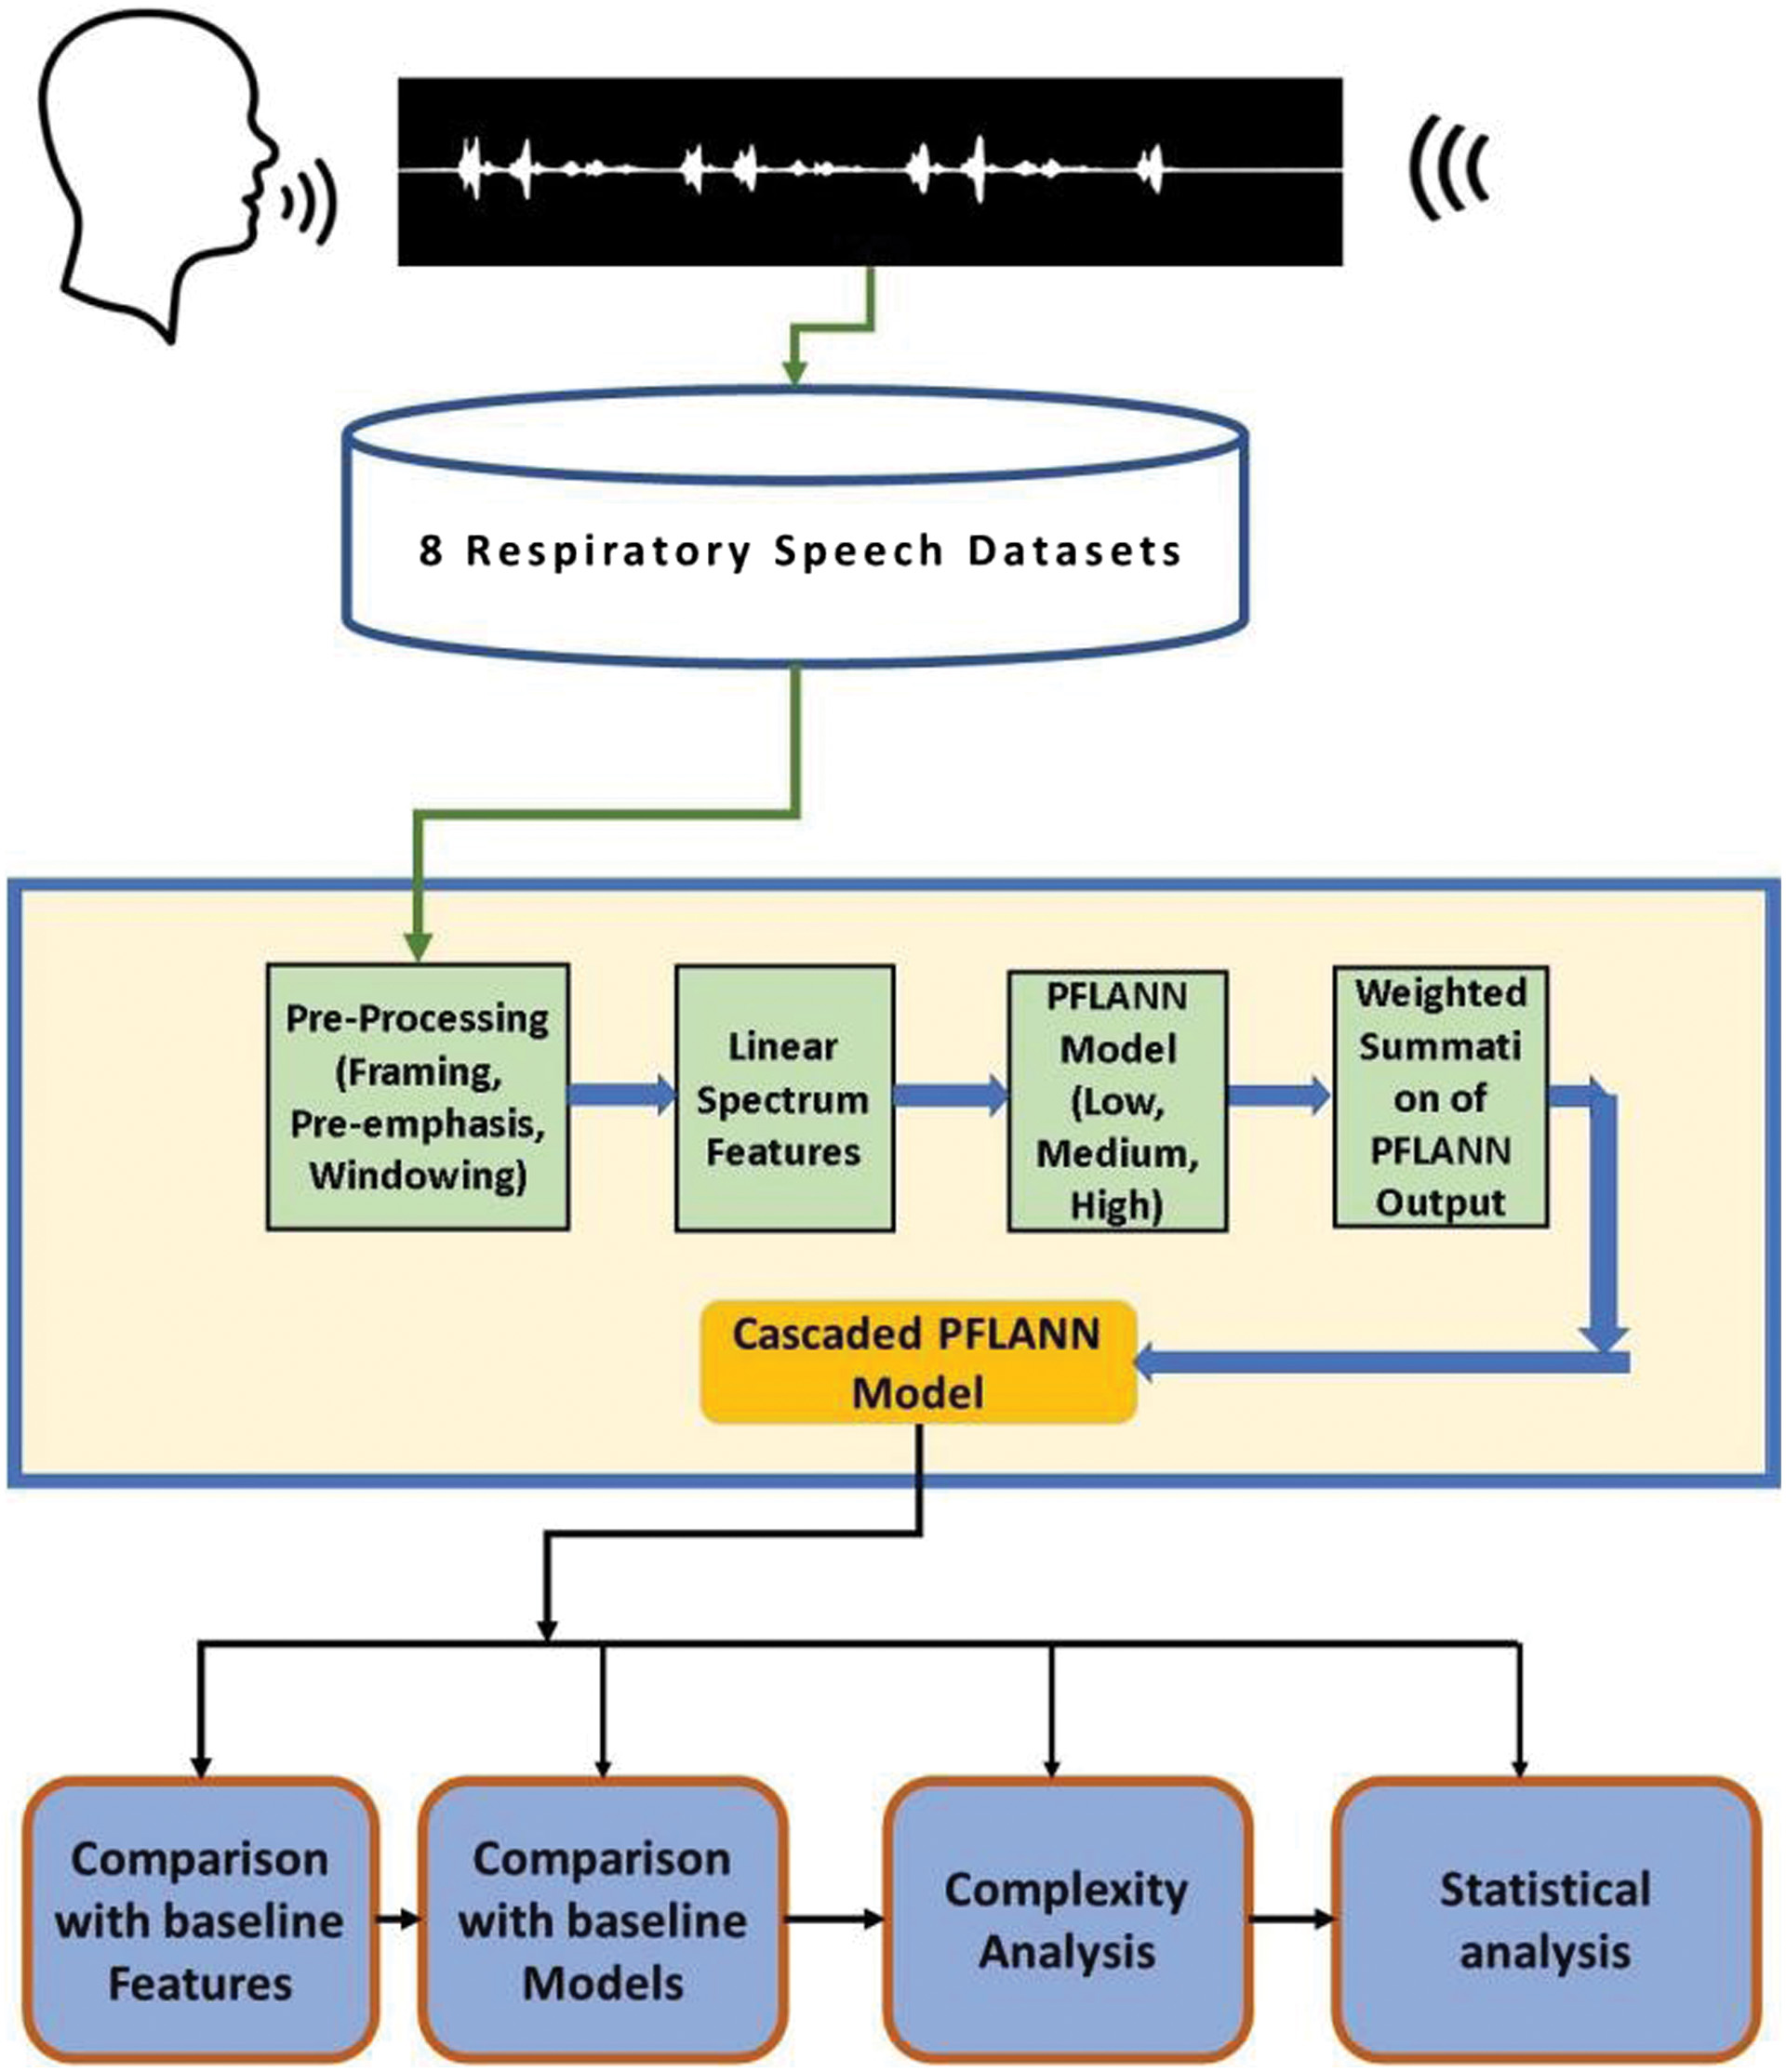 Fig. 2. Block diagram of the proposed implementation model.
Step 4: Performance evaluation and model validation — A numeric metric called confusion matrix is widely used to assess the performance of classifiers.
The confusion matrix is a classification metric that is calculated from four values: T+ (True Positive), F+ (False Positive), F− (False Negative), and T− (True Negative). In the present model, T+ is the number of diseased patients predicted accurately as diseased, T− is the number of healthy patients predicted accurately as healthy, F+ is the number of healthy patients predicted as diseased, and F− is the number of diseased patients predicted as healthy. The F− is a crucial parameter in medical diagnosis since it identifies the patients who have respiratory disease but were incorrectly classified as healthy by the model. However, the F+ is less important because the patient will go back for a second round of tests to confirm. Diseased patients, on the other hand, should not be misinterpreted as negative. Standard performance measures as reported in [41,42] such as classification accuracy (ACC), the area under the curve (AUC), precision (P), recall (R), and F-2 score (F-2) are used:
A.COMPARISON USING LEAVE-ONE-OUT CROSS-VALIDATION SCHEME
The performance of the proposed cascaded PFLANN model is compared using leave-one-out cross-validation (LOOCV) with several standard machine learning based models such as: classifier-1 (support vector machine) [29], classifier-2 (random forest) [30,32], and classifier-3 (K-nearest neighbor) [43] used for the speech classification task using same set of linear spectrum feature vectors. LOOCV provides almost unbiased estimator of statistical models’ generalization properties and makes it a useful criterion for model selection and comparison. In this technique, from n samples of a dataset, n-1 samples are used to train the model, and 1 sample is used for testing. This process is repeated n times till all the samples are tested once [44]. The overall performance of the model is dependent on the size of the dataset. When the data size is small and a reliable estimation of model output is more critical, then LOOCV is performed. As in the present paper, the accuracy of testing is more important due to the research in medical field and the size of the datasets are comparatively small, the LOOCV model is used for cross-validation [45]. To select the best parameters of the classifiers, grid search is used. The simulation results are listed in Table I. It has been observed that the proposed cascaded PFLANN classifier shows improved performance with an average accuracy of 0.94, and the classifier-2 is at the second position followed by classifier-3 and 1. Similarly, for the evaluation of F-2 score and AUC, the rankings in the descending order are cascaded PFLANN, classifier-2, 3, and 1. In the datset-2, all the classifiers are working better than other datasets. The simulation results demonstrate the superiority of cascaded PFLANN classifier. From the dataset analysis, it has been observed that the proposed classification model is working best at dataset-2 and dataset-8, while the accuracy is comparatively less for the dataset-7. For dataset-7, the classification is mainly between inhalation and exhalation rather than healthy and diseased.
Table I. Evaluation results using LOOCV for baseline models
| Category | Evaluation measures | EnFLANN | Model-1 | Model-2 | Model-3 |
|---|---|---|---|---|---|
| ACC | 0.85 | 0.91 | 0.88 | ||
| F-2 | 0.85 | 0.91 | 0.88 | ||
| Dataset-1 | P | 0.85 | 0.91 | 0.88 | |
| R | 0.85 | 0.91 | 0.88 | ||
| AUC | 0.84 | 0.92 | 0.88 | ||
| ACC | 0.84 | 0.93 | 0.87 | ||
| F-2 | 0.84 | 0.93 | 0.87 | ||
| Dataset-2 | P | 0.84 | 0.93 | 0.87 | |
| R | 0.84 | 0.93 | 0.87 | ||
| AUC | 0.83 | 0.94 | 0.85 | ||
| ACC | 0.85 | 0.91 | 0.89 | ||
| F-2 | 0.85 | 0.91 | 0.89 | ||
| Dataset-3 | P | 0.85 | 0.91 | 0.89 | |
| R | 0.85 | 0.91 | 0.89 | ||
| AUC | 0.84 | 0.91 | 0.89 | ||
| ACC | 0.83 | 0.92 | 0.87 | ||
| F-2 | 0.83 | 0.92 | 0.87 | ||
| Dataset-4 | P | 0.83 | 0.92 | 0.87 | |
| R | 0.83 | 0.92 | 0.87 | ||
| AUC | 0.84 | 0.91 | 0.85 | ||
| ACC | 0.82 | 0.91 | 0.85 | ||
| F-2 | 0.83 | 0.91 | 0.85 | ||
| Dataset-5 | P | 0.82 | 0.91 | 0.85 | |
| R | 0.82 | 0.91 | 0.85 | ||
| AUC | 0.82 | 0.91 | 0.85 | ||
| ACC | 0.84 | 0.92 | 0.87 | ||
| F-2 | 0.84 | 0.92 | 0.87 | ||
| Dataset-6 | P | 0.84 | 0.92 | 0.87 | |
| R | 0.84 | 0.92 | 0.87 | ||
| AUC | 0.84 | 0.92 | 0.85 | ||
| ACC | 0.83 | 0.90 | 0.84 | ||
| F-2 | 0.84 | 0.90 | 0.85 | ||
| Dataset-7 | P | 0.83 | 0.91 | 0.84 | |
| R | 0.83 | 0.91 | 0.84 | ||
| AUC | 0.83 | 0.90 | 0.84 | ||
| ACC | 0.87 | 0.93 | 0.88 | ||
| F-2 | 0.87 | 0.93 | 0.88 | ||
| Dataset-8 | P | 0.87 | 0.93 | 0.88 | |
| R | 0.87 | 0.93 | 0.88 | ||
| AUC | 0.88 | 0.94 | 0.89 |
The best performing model and the evaluation measures are highlighted in bold.
B.COMPARISON WITH BASELINE FEATURES
After investigating the performance of the proposed cascaded PFLANN model with baseline models, the effectiveness of the linear spectrum feature extraction technique is analyzed in this section. Here, different baseline features are used along with the cascaded PFLANN model. The baseline features used are Featureset-1 (MFCC), Featureset-2 (DFT), and Featureset-3 (GTCC). For the three feature sets, the mean values are taken at the sample level from the frame level values. But in the case of linear spectrum features, the statistical values of mean and variance are being considered. The simulation results are listed in Table II. It can be observed that the detection accuracy is comparatively higher on a consistent basis for the linear spectrum features. However, the MFCC and GTCC features are also performing well in the second position in most of the cases. The GTCC features where only mean are taken are at the last rank. Out of the eight datasets, for dataset-3, MFCC and the proposed features are in the same rank. The improved performance of the linear spectrum statistical features shows the superiority of the proposed model compared to the baseline models and features.
Table II. Comparison with baseline features
| Dataset | Evaluation measures | Proposed features | Feature set-I | Feature set-2 | Feature set-3 |
|---|---|---|---|---|---|
| ACC | 0.94 | 0.92 | 0.93 | 0.90 | |
| F-2 | 0.94 | 0.92 | 0.93 | 0.89 | |
| Dataset-1 | P | 0.93 | 0.92 | 0.93 | 0.89 |
| R | 0.93 | 0.92 | 0.93 | 0.89 | |
| AUC | 0.93 | 0.92 | 0.93 | 0.89 | |
| ACC | 0.95 | 0.91 | 0.94 | 0.91 | |
| F-2 | 0.95 | 0.91 | 0.94 | 0.91 | |
| Dataset-2 | P | 0.95 | 0.92 | 0.94 | 0.91 |
| R | 0.94 | 0.90 | 0.94 | 0.91 | |
| AUC | 0.95 | 0.92 | 0.94 | 0.91 | |
| ACC | 0.93 | 0.93 | 0.92 | 0.92 | |
| F-2 | 0.93 | 0.93 | 0.92 | 0.92 | |
| Dataset-3 | P | 0.93 | 0.93 | 0.92 | 0.92 |
| R | 0.93 | 0.93 | 0.92 | 0.92 | |
| AUC | 0.92 | 0.93 | 0.93 | 0.92 | |
| ACC | 0.94 | 0.91 | 0.93 | 0.92 | |
| F-2 | 0.94 | 0.91 | 0.93 | 0.92 | |
| Dataset-4 | P | 0.94 | 0.92 | 0.93 | 0.92 |
| R | 0.94 | 0.92 | 0.93 | 0.92 | |
| AUC | 0.94 | 0.90 | 0.93 | 0.94 | |
| ACC | 0.93 | 0.90 | 0.92 | 0.92 | |
| F-2 | 0.93 | 0.90 | 0.92 | 0.92 | |
| Dataset-5 | P | 0.93 | 0.89 | 0.92 | 0.92 |
| R | 0.93 | 0.89 | 0.92 | 0.92 | |
| AUC | 0.94 | 0.89 | 0.93 | 0.94 | |
| ACC | 0.94 | 0.91 | 0.92 | 0.92 | |
| F-2 | 0.94 | 0.91 | 0.92 | 0.92 | |
| Dataset-6 | P | 0.94 | 0.91 | 0.92 | 0.92 |
| R | 0.94 | 0.91 | 0.92 | 0.92 | |
| AUC | 0.94 | 0.91 | 0.93 | 0.92 | |
| ACC | 0.91 | 0.89 | 0.90 | 0.89 | |
| F-2 | 0.92 | 0.89 | 0.90 | 0.89 | |
| Dataset-7 | P | 0.91 | 0.89 | 0.90 | 0.89 |
| R | 0.91 | 0.89 | 0.90 | 0.89 | |
| AUC | 0.91 | 0.89 | 0.91 | 0.89 | |
| ACC | 0.95 | 0.91 | 0.94 | 0.92 | |
| F-2 | 0.94 | 0.91 | 0.94 | 0.92 | |
| Dataset-8 | P | 0.94 | 0.91 | 0.94 | 0.92 |
| R | 0.94 | 0.91 | 0.94 | 0.92 | |
| AUC | 0.94 | 0.91 | 0.93 | 0.92 |
C.COMPARATIVE ANALYSIS ON COMPUTATIONAL COMPLEXITY
In IoT networks, computational complexity plays a crucial role. To compute the computational complexity, computational speed (CS) is used, and it can be calculated as mentioned below:
where n is the time duration (length) of the speech signal and T is the execution time of the model for that speech signal [46]. The models for comparing the computational complexity are model-1 (MFCC+SVM) [47], model-2 (GTCC+KNN) [48], model-3 (MFCC+RF) [49], and model-4 (ERB+NB) [50], and the results are plotted in Fig. 3. The proposed model has been compared with standard models from the literature which are being used for speech recognition [47–50]. It can be observed that the proposed model provides the highest detection accuracy as well as lowest computational complexity. It is showing superior performance as compared to others. In terms of higher accuracy, the descending rank of models are model-3, 4, 1, and 2 and in terms of lower computational complexity, the ranking of models are model-1, 2, 4, and 3.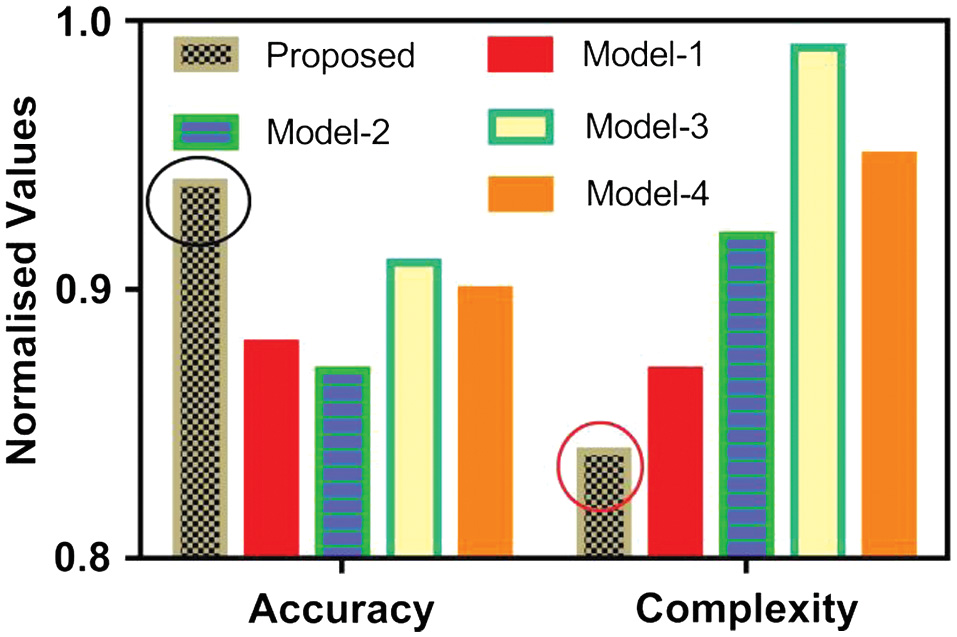
D.STATISTICAL ANALYSIS OF CLASSIFIER MODELS
For statistical analysis comparison, t-statistic analysis is used. It is computed between two classifiers as:
where and are the mean and variance of the fivefold classification accuracy of classifier 1 and 2, respectively [50]. The proposed cascaded PFLANN is being denoted as CPFLANN. Most of the t-statistic values listed in Table III are positive. It justifies the improved performance of the proposed model over baseline models.Table III. T-statistic analysis of proposed model with standard ML-based models
| Dataset | CPFLANN vs SVM | CPFLANN vs RF | CPFLANN vs KNN | |
|---|---|---|---|---|
| 1 | 4.4 | 1.3 | 3.5 | |
| 2 | 2.1 | 4.6 | 1.7 | |
| 3 | 3.2 | 2.3 | 6.1 | |
| 4 | 2.3 | 0.5 | 2.3 | |
| 5 | 3.4 | 2.2 | 6.1 | |
| 6 | 5.2 | 2.6 | 3.4 | |
| 7 | 4.3 | 2.8 | 2.6 | |
| 8 | 3.7 | 1.6 | 3.4 | |
The results of the aforementioned classification tasks with baseline models and features and statistical analyses show the superiority of the proposed CPFLANN model. The primary cause of this is using the perceptual model for capturing the nonlinearity of frequency response and application of cascaded structure with bio-inspired computing for weight updation.
IV.CONCLUSION
In the current study, a low-complexity-based health monitoring system is developed using cascaded PFLANN model with bio-inspired computing. It is mainly used for the respiratory disease detection from recorded speech signal. The major contribution of the study is the development of cascaded PFLANN model which has not been used till now by any researcher to the best of knowledge. It provides a new dimension of designing a neural network and extension to the basic PFLANN model. Another contribution is the use of bio-inspired techniques for the weight updation. The analysis of accuracy and computational complexity justifies the use of the proposed model, and it has been verified in eight standard datasets. However, it is advised that the medical practitioner can confirm the detection method in hospitals by using the proposed intelligent model before coming to the final prescription. Other speech recognition tasks can also be evaluated and implemented further using the proposed model.