I.INTRODUCTION
In recent years, the continuous development and application of education technology have led to the emergence of education management big data as a popular research topic in the field of education. Education management big data involve analyzing data related to students’ academic performance, personal lives, psychology, and other relevant factors to gather information about their learning outcomes, mental health status, and behavior patterns. This analysis enables administrators to provide customized educational and management support [1,2]. This holds great importance for the progression of students’ learning, the improvement of teaching for educators, and overall school administration. Currently, big data for education management faces numerous challenges. Student data encompass various multidimensional information, such as academic performance, behavioral data, and mental health status. Efficiently extracting useful insights from such complex data has become a critical undertaking. Large-scale datasets of student information present challenges such as prolonged training time and complex feature selection when processed by traditional algorithms [3]. To overcome these challenges, researchers have enhanced existing algorithms and experimented with integrating various algorithms to better identify abnormal student behavior. The Isolation Forest (IF) algorithm presents certain advantages as a classification-based method for identifying student behavior [4]. Its fundamental concept involves dividing the dataset into various feature subsets and classifying them based on the correlation between these feature subsets [5]. However, the traditional isolated forest algorithm faces problems such as long training time and difficulty in feature selection when dealing with large-scale datasets. In this context, this study proposes an innovative approach that aims to optimize the existing isolated forest algorithm. It is combined with neural networks to identify anomalous behavioral data of college students to enable teachers to quickly improve students’ academic performance and learning outcomes. The innovations of this study, compared with prior works, primarily include the following aspects. First, the paper optimizes the isolated forest algorithm and proposes an efficient training method to speed up the execution of the algorithm in view of its problems in dealing with large datasets. Second, the paper introduces neural networks as auxiliary classifiers to improve the accuracy and stability of abnormal student behavior with the help of the powerful learning ability of neural networks. Third, this study utilizes the algorithm to analyze college and university students’ abnormal behavior data, demonstrating its practical value in this field. Identifying and predicting students’ abnormal behaviors can aid educational administrators in promptly intervening and improving students’ learning outcomes and quality of life. Additionally, this study offers a comprehensive evaluation and comparative analysis of the model’s performance, confirming the effectiveness and superiority of the proposed method in managing big data for education.
The content of this research is divided into four parts. Section II gives a brief description of the related research topics by other scholars. Section III mainly introduces the algorithmic model used in this research. Section IV analyzes the performance of the model. Section V summarizes the relevant results and discusses future research directions.
II.RELATED WORK
In recent years, with the development and popularization of big data in education management, student behavior analysis has become a hot topic in the field of education [6]. By analyzing and mining student behavior data, schools can better understand students’ learning progress, mental health status, behavioral habits, and other aspects, thus supporting personalized education and management of students. Wu T. et al. proposed an adaptive online IF algorithm for processing online data to improve the efficiency and accuracy of data detection algorithms [7]. The algorithm can measure low-quality data quickly using an isolation mechanism, and improving data detection efficiency is possible by pairing the algorithm with different data detectors through a hierarchical subspace feature selection scheme. The experiment shows that the proposed adaptive online IF algorithm can perform data analysis without the need for system modeling and can achieve good performance. To more accurately monitor the daily activities and postures of elderly individuals, Liaqat S et al. utilized intelligent devices to record their daily activity data. They then employed various machine learning models, including random forest, logistic regression, decision tree, and neural network, as well as deep learning models, to construct a novel classification model for identifying and categorizing elderly postures [8]. Fang Y et al. developed several deep network models [9–11] for moving people localization and trajectory prediction. The research results show that the constructed model can accurately recognize and classify various postures of the elderly, with a classification accuracy of up to 98%. Veerabhadraswamy N et al. combined sensor technology with random forest algorithm to accurately measure forest coverage and forest sample classification results in a certain area [12]. The research results show that the random forest algorithm combined with multi-sensor technology has a high sample classification accuracy, up to 92.5%. Compared with traditional optical sensors, the method adopted by the research has improved the classification accuracy by 9.5%. Bag S et al. proposed a new sensor discharge location detection method [13]. To further identify the location of the partial discharge source, a random forest algorithm was further used to identify the features of the electrical signals extracted from the sensor. The experiment showed that the adopted random forest algorithm could extract the features of electrical signals well, and its feature recognition accuracy was as high as 95%.
A simple and efficient 2D convolutional neural network (2D CNN architecture) has been proposed by Khare A et al. This architecture uses small convolutional kernel for human activity recognition. The 2D CNN architecture has fewer trainable parameters and smaller memory requirements than traditional deep learning architectures, making it feasible to train on low GPU memory devices and adaptable for datasets of various sizes [14]. Hoda S A et al. have conducted an extensive literature research on the application of multi-criteria decision-making-based machine learning in healthcare systems. In today’s digital culture, medical records contain a lot of information, but transforming data into information and discovering hidden patterns is a challenging task for humans. Effective decision support technologies can aid healthcare professionals in locating essential information within large amounts of data to support their clinical decision-making and various healthcare management tasks. By conducting a thorough review and analysis of various existing studies, this paper presents a comprehensive summary of decision support techniques in healthcare systems utilizing machine learning. The objective of this study is to assist researchers in identifying areas of interest for further investigation to address the needs of the field [15]. Wang Y et al. introduced a novel biometric technique named as Ear Recognition Technique. In pattern recognition technique, feature extraction is the key step. To improve the accuracy of the classification results, a new method, i.e., complementary dual feature extraction method based on principal component analysis and Fisherface, is proposed in the paper and applied to human ear image recognition. Experimental results show that the ear recognition rate of the proposed method is significantly higher than that of a single feature extraction method using only PCA, Fisherface, or independent component analysis [16].
To summarize, current research on recognition algorithms primarily focuses on neural networks, the random forest algorithm, and other related areas. However, there is a lack of comprehensive study on the isolated forest algorithm within the random forest algorithm. The ongoing growth in educational data concerning students has made data mining a noteworthy research topic in the field of education. However, at present, there are few intelligent algorithm mining models related to student education data. Based on this current situation, the study first optimized the isolated forest algorithm and, on this basis, constructed a model for identifying abnormal behavior in student education data. This project aims to enhance the identification of unusual behavior patterns in education management big data through the optimization of the IF algorithm. Moreover, it seeks to offer schools and education management departments with more effective and precise student behavior analysis services.
III.PROBLEM AND SOLUTION DEFINITION
A model for detecting anomalies in college student education data was created by combining the isolated forest algorithm with neural networks using daily data collected during the educational process. First, a weighted optimal improved isolated forest algorithm is proposed. Then, the loss function under linear discriminant analysis is used to optimize the twin-gated recurrent neural network (RNN). Finally, the model for identifying abnormal behavior in university student education data is built by combining the enhanced isolated forest algorithm with a twin-gated RNN.
A.DESIGN OF OPTIMIZED ISOLATED ALGORITHMS
The isolated forest algorithm, as one of the most popular recognition algorithms, has been continuously optimized and improved in recent years. Each tree in the isolated forest algorithm is a system that randomly selects dimensions and segmentation points. Therefore, to improve the recognition accuracy of traditional isolated forest algorithms, it is necessary to establish a large number of isolated trees [14,15]. As the number of isolated trees in the forest increases, the running time and accuracy of the algorithm will gradually decrease. The schematic diagram of abnormal node detection in the isolated forest algorithm is shown in Fig. 1.
 Fig. 1. Schematic diagram of outlier detection in isolated forest algorithm.
Figure 1 shows a schematic diagram of anomaly detection for the isolated forest algorithm. Figure 1 shows that the isolated tree structure utilized in the isolated forest algorithm is a binary tree structure constructed on a randomly chosen dimension from the dataset. The algorithm is composed of an infinite number of these isolated trees. The isolated forest algorithm can partition the dataset based on the feature differences between abnormal data and normal data [16]. In Fig. 1, different colored branches in an isolated tree correspond to data with different values. With the acceleration of information and intelligent construction in universities, a large amount of students’ educational data has been generated in daily educational life. The research focuses of deep learning in education fields are to perform feature recognition, classification, and induction on these data, as well as to further extract useful educational information behind the data. In response to this background, the research has optimized the traditional isolated forest algorithm by identifying abnormal features of different educational data, dividing the data according to the degree of abnormality, and constructing a model for identifying abnormal educational data for college students. The weighting method of traditional isolated trees is optimized, and logistic regression algorithm is utilized to calculate weights for different data dimensions [17].
Equation (1) is the calculation formula for the logistic regression function. x represents the sample. represents the logistic regression function. Since logistic regression is essentially linear regression, . Equation (1) can be used to predict the probability that the sample belongs to the interval [0, 1]. It assumes that the matrix of a dataset is , and the matrix is shown in equation (2).
In equation (2), represents the size of the dataset. By analyzing the -dimensional dataset through logistic regression, the weight matrix is obtained as . The evaluation formula for the dataset matrix is shown in equation (3).
In equation (3), represents the score corresponding to the dataset matrix . The attribute preference matrix in equation (4) can be obtained from equations (2) and (3).
In equation (4), represents the preference value of the corresponding attribute. The weight matrix of the corresponding dimension of the dataset matrix is shown in equation (5).
By standardization of the weight matrix in equation (5), the matrix shown in equation (6) can be obtained.
By using equation (6) to correspond the weights of the influencing factors in different dimensions to the dataset, the weighting of the dataset is achieved. The final weighting formula is shown in equation (7).
After cleaning the abnormal dataset, a sample with dimension will be obtained. Due to the different numerical intervals and abnormal contribution degrees of each dimension, it is necessary to use logistic regression algorithms to weight all the weights.
After determining the dimensional weight and total weight using the formula above, a weighted random selection is required. It assumes that the probability of randomly selecting the -th dimension is . Its expression is shown in equation (9).
By using equation (9), the inequality for the selected -th dimension can be obtained, as shown in equation (10).
In equation (10), represents any number between 0 and 1. The above formula can optimize the weight calculation of different data dimensions, thereby achieving the goal of randomized weighting isolated trees. Then, it can improve the data classification effect and anomaly detection accuracy of the traditional random forest algorithm.
To avoid generating too many similar trees during the process of constructing a large number of initial isolated forest trees, the study also uses residual statistics in statistics to eliminate redundant forests and uses discrete particle swarm optimization to optimize the isolated forest algorithm. This is to ensure that the optimal tree can be selected from a large number of trees for subsequent data processing [18]. Finally, the weighted optimal subisolated forest (WOS-IForest) algorithm is proposed, and its flow chart is shown in Fig. 2.
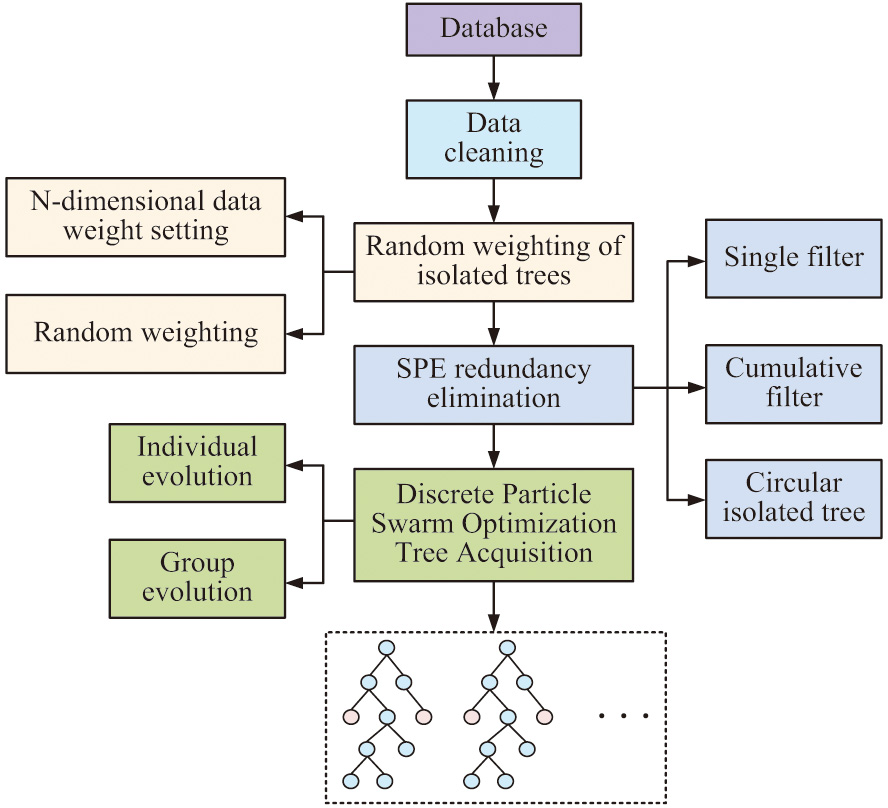 Fig. 2. Schematic diagram of weighted optimization isolated forest algorithm flow.
Figure 2 indicates the flowchart of the weighted optimization isolated forest algorithm. Although traditional isolated forest algorithms can efficiently perform data partitioning tasks, they cannot guarantee the accuracy of data partitioning. The paper proposes the optimization of weight for the WOS-IForest algorithm through the logistic regression algorithm. This guarantees that the weight settings for each tree are randomly chosen. Then, it uses residual statistics to eliminate redundant isolated trees. This reduces the system’s computational load and enables each isolated tree in the algorithm to perform the data partitioning task to its fullest extent. This reduces the system’s computational load and enables each isolated tree in the algorithm to perform the data partitioning task to its fullest extent. Finally, it uses the discrete particle swarm optimization algorithm to select the remaining isolated trees, and through continuous iterative training, the optimal tree is finally selected for subsequent data processing.
B.OPTIMIZING GRU NETWORK MODEL CONSTRUCTION
Neural networks represent a type of artificial intelligence technology. This technology simulates the workings of the human brain using computers and performs tasks by training large amounts of data [19]. Neural networks, as a widely used parallel interconnected network, are usually composed of multiple neural units. Each individual neuron possesses its unique input and output, which are responsible for inputting data into the hidden layer using nonlinear transformations. The neuron then proceeds to explore patterns and models during the course of the training process, before ultimately generating output results. In practical applications, RNN is a neural network based on recurrent units, usually composed of multiple input layers, output layers, and hidden layers. RNN can model the time series of the input sequence and control the cycle process through the control unit and activation function. Gated recurrent unit (GRU) network is a type of gated RNN, and the general network structure of GRU is shown in Fig. 3 [20].
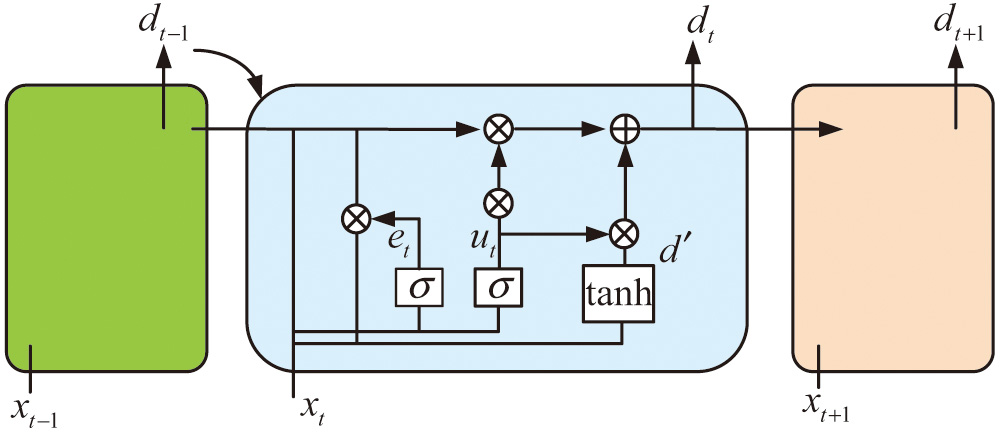 Fig. 3. GRU network structure diagram.
Figure 3 illustrates that the GRU structure generally has two gates: update gate and reset gate . It combines the output result of the previous neuron with the input of the current neuron as the calculation condition for the update gate and reset gate. It obtains the calculation formula for the update gate and reset gate as shown in equation (11) [21].
In equation (11), the calculation formulas for and gates are given, respectively. and are the weights of the two gates, respectively. represents the threshold. Although GRU has more efficient data processing capabilities compared to long short-term memory (LSTM), to represent accurate digital portraits of students, the research has optimized GRU. It uses LDA to optimize the loss function in the twin GRU network, thus proposing the twin GRU network structure (LSGRU) under the LDA-optimized loss function.
Twin networks are commonly utilized in various fields such as image recognition, face detection, and semantic analysis, as they contain two identical networks in their structure, making it essentially an aggregation network. For binary classification problems, the input samples of a general twin network are two positive samples of the same type, two negative samples of the same type, and one positive and one negative sample [22]. The network extracts features from varying input samples and proceeds to compare the feature similarities between the two samples by evaluating the output outcomes from two networks. The distance between two input samples can be calculated using distance measurement or similarity measurement. Taking the Euclidean distance method as an example, its calculation formula is shown in equation (12).
In equation (12), still represents the dimension of the dataset. and represent any two points in the dataset, respectively. The coordinates of point and point in multidimensional space are represented as and . represents the Euclidean distance between two points. If only the distance between different outputs of the twin network is considered, using the Euclidean distance calculation formula as the loss function for the twin GRU network will result in inadequate distance calculation among different samples. Therefore, LDA is used to optimize the loss function, and finally, the LSGRU network structure diagram shown in Fig. 4 is obtained.
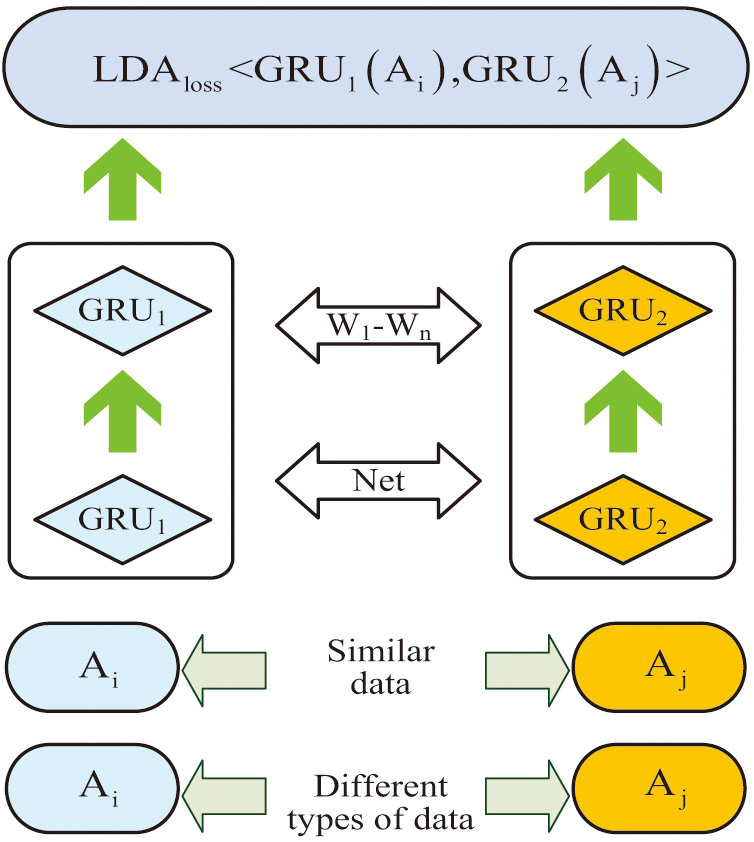 Fig. 4. LSGRU network structure diagram.
Figure 4 illustrates that since the LSGRU network structure is composed of two branch twin GRU networks, the dataset must be processed into paired data each time before input. When inputting paired data, the network filters the data based on the labels in the training set to ensure inputting the same data type into the same GRU network for training. When the network completes data training, it will reduce the distance between data of the same type using the LDAloss loss function. Meanwhile, it will also increase the distance between different types of data through the LDAloss loss function, thus improving the accuracy and efficiency of classifying similar data.
C.CONSTRUCTION OF AN ANOMALY RECOGNITION MODEL FOR COLLEGE STUDENT EDUCATION DATA BASED ON WOS-IForest AND LSGRU
Due to the diverse array and complex features of university data, it is imperative to construct a comprehensive data recognition model to attain accurate data classification and to discover its latent value [23]. In this study, the WOS-IForest algorithm with different parameters is first used to identify anomalies in university data, and outlier scores are provided for each type of data. Then, different types of anomaly detection results and outlier scores are merged, and the LSGRU network is used to deeply identify the whole data, and the final detection model is constructed. Firstly, the WOS-IForest algorithm is used with different parameter settings to identify different types of data [24,25]. The process of identifying single-class data anomalies under the WOS-IForest algorithm is shown in Fig. 5.
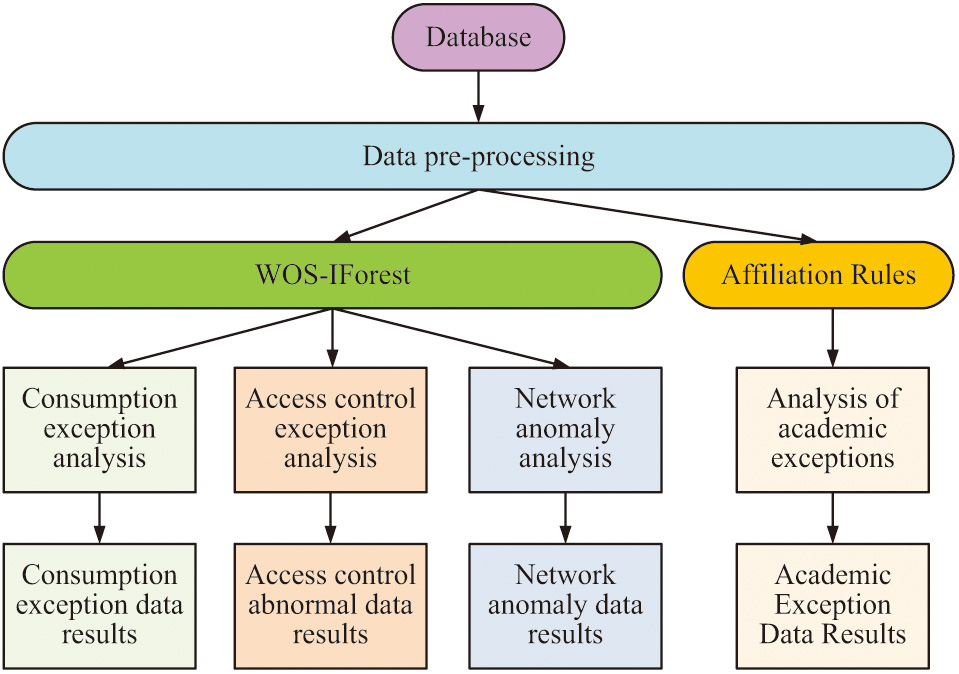 Fig. 5. Flow chart of single-class data anomaly recognition under WOS-IForest algorithm.
Figure 5 illustrates the flowchart for identifying single-class data anomalies using the WOS-IForest algorithm [26,27]. Figure 5 illustrates that the college student data must first be extracted from the database, and then the data needs to be preprocessed, including data filling, data cleaning, discretization, feature conversion, and other operations. The preprocessed data will be divided into consumption data, access control data, academic data, and network data according to different categories. For consumption data and access control data, the WOS-IForest abnormal analysis algorithm for consumption data and access control data is used. By setting the algorithm parameters, the selected abnormal usage data and abnormal access control data can be obtained [28,29]. By configuring diverse network access times, access types, and website IPs, among other factors, the WOS-IForest algorithm can scrutinize students’ network data utilizing established programs and produce network anomaly outcomes [30,31]. For academic data, association rule algorithms are used for data classification and recognition to obtain the final abnormal academic data. It integrates various abnormal data analysis results under the WOS-IForest algorithm and uses LSGRU network to analyze the overall data structure. Therefore, it obtains the overall recognition model of university student data as shown in Fig. 6.
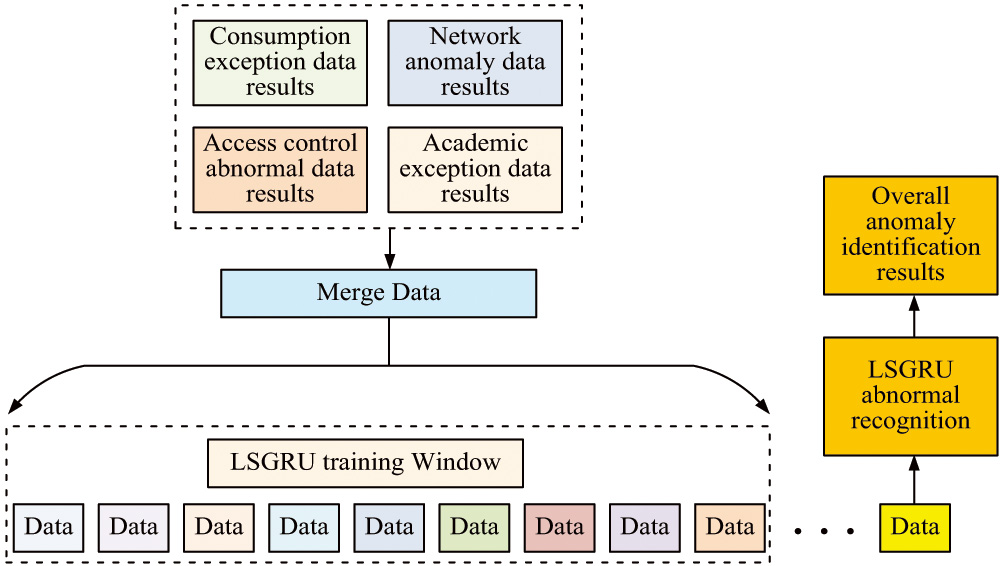 Fig. 6. Overall recognition model for college student data.
The WOS-IForest algorithm can provide analysis results for various types of abnormal data [32]. Since a single data anomaly is often insufficient in triggering abnormal behavior among students, it is the combination of multiple abnormal factors that can ultimately lead to such behavior. To better predict students’ abnormal situations and identify their abnormal behaviors, a study is conducted using LSGRU networks for joint analysis of single data under the WOS-IForest algorithm. Then, an overall detection model for student data is constructed, as shown in Fig. 6. In Fig. 6, the data for consumption abnormal results, access control abnormal results, network abnormal results, and academic abnormal results are integrated [33,34]. This integration is completed using the LSGRU network for data feature mining, resulting in overall data recognition. Finally, it obtained abnormal results under the integration of multiple abnormal data.
IV.PERFORMANCE TESTING AND EVALUATION
To test the performance of the WOS-IForest algorithm and the LSGRU network, a series of comparative algorithms are selected to compare the performance of different algorithms in the same dataset. First, based on the recognition accuracy and stability indicators of the algorithms, the accuracy values and recognition stability of the WOS-IForest algorithm and other anomaly recognition algorithms are compared in the same dataset. Then, the recognition accuracy of the LSGRU network under different loss functions and different distance weights is analyzed. Finally, it was determined that the anomaly data recognition model built by the paper has better recognition performance and can be used to identify abnormal behavior among college students.
A.WOS-IForest ALGORITHM PERFORMANCE TESTING
To test the performance of the WOS-IForest algorithm, the study compares the performance of the WOS-IForest algorithm, the traditional IF algorithm, the K-means algorithm, the K-Nearest Neighbor (KNN) algorithm, and the Local Outlier Factor (LOF) algorithm on the same dataset. The experimental parameter settings and environmental settings are shown in Table I.
Table I. Model parameters and experimental environment settings
| Model parameter | Value | Experimental platform | Parameter |
|---|---|---|---|
| Isolated forest subspace | 256 | Simulation experimental platform | MATLAB |
| Initial forest | 100 | ||
| Discrete particle swarm optimization learning factors | 1.5 | Processor | Intel Xeon Platinum |
| Minimum learning speed | −5 | 8300 | |
| Maximum learning speed | 5 | Running memory | 256GB |
| Maximum inertia weight | 1 | ||
| Minimum inertia weight | 0.4 | Graphics card | Tesla V4 |
| Iterations | 200 |
Table I illustrates the initial parameter settings of the training model and the parameter settings of the experimental platform. To improve the evaluation of the models, we have chosen four publicly available datasets to test the algorithms’ performance. These datasets, namely CreditCard, Shuttle, Breastw, and Mammography, are commonly used for conducting experiments and validating algorithms in the field of machine learning and data mining. The four datasets possess distinct characteristics and utilities, serving as means to evaluate and test various algorithms and models. Among them is the CreditCard dataset, intended primarily for credit card fraud detection. This dataset includes real credit card transaction records, with a minor portion of them being fraudulent. The performance of anomaly detection and classification algorithms is evaluated using this dataset to determine anomaly detection and classification algorithms to help banks and financial institutions to identify potential credit card fraud. Shuttle dataset is used for multi-category classification and is mainly used to test pattern recognition and classification algorithms. Breastw dataset is used for breast cancer classification. It contains measured features of breast tumors and is used to help the medical community and researchers to classify breast tumors as benign and malignant. Mammography dataset is used for the classification of mammography images. This dataset contains mammography images that are used to help doctors detect and diagnose breast cancer. The study selects the above four different types of recognition datasets to test the recognition accuracy of the following algorithms. The recognition accuracy of different recognition algorithms on the four types of datasets is shown in Fig. 7.
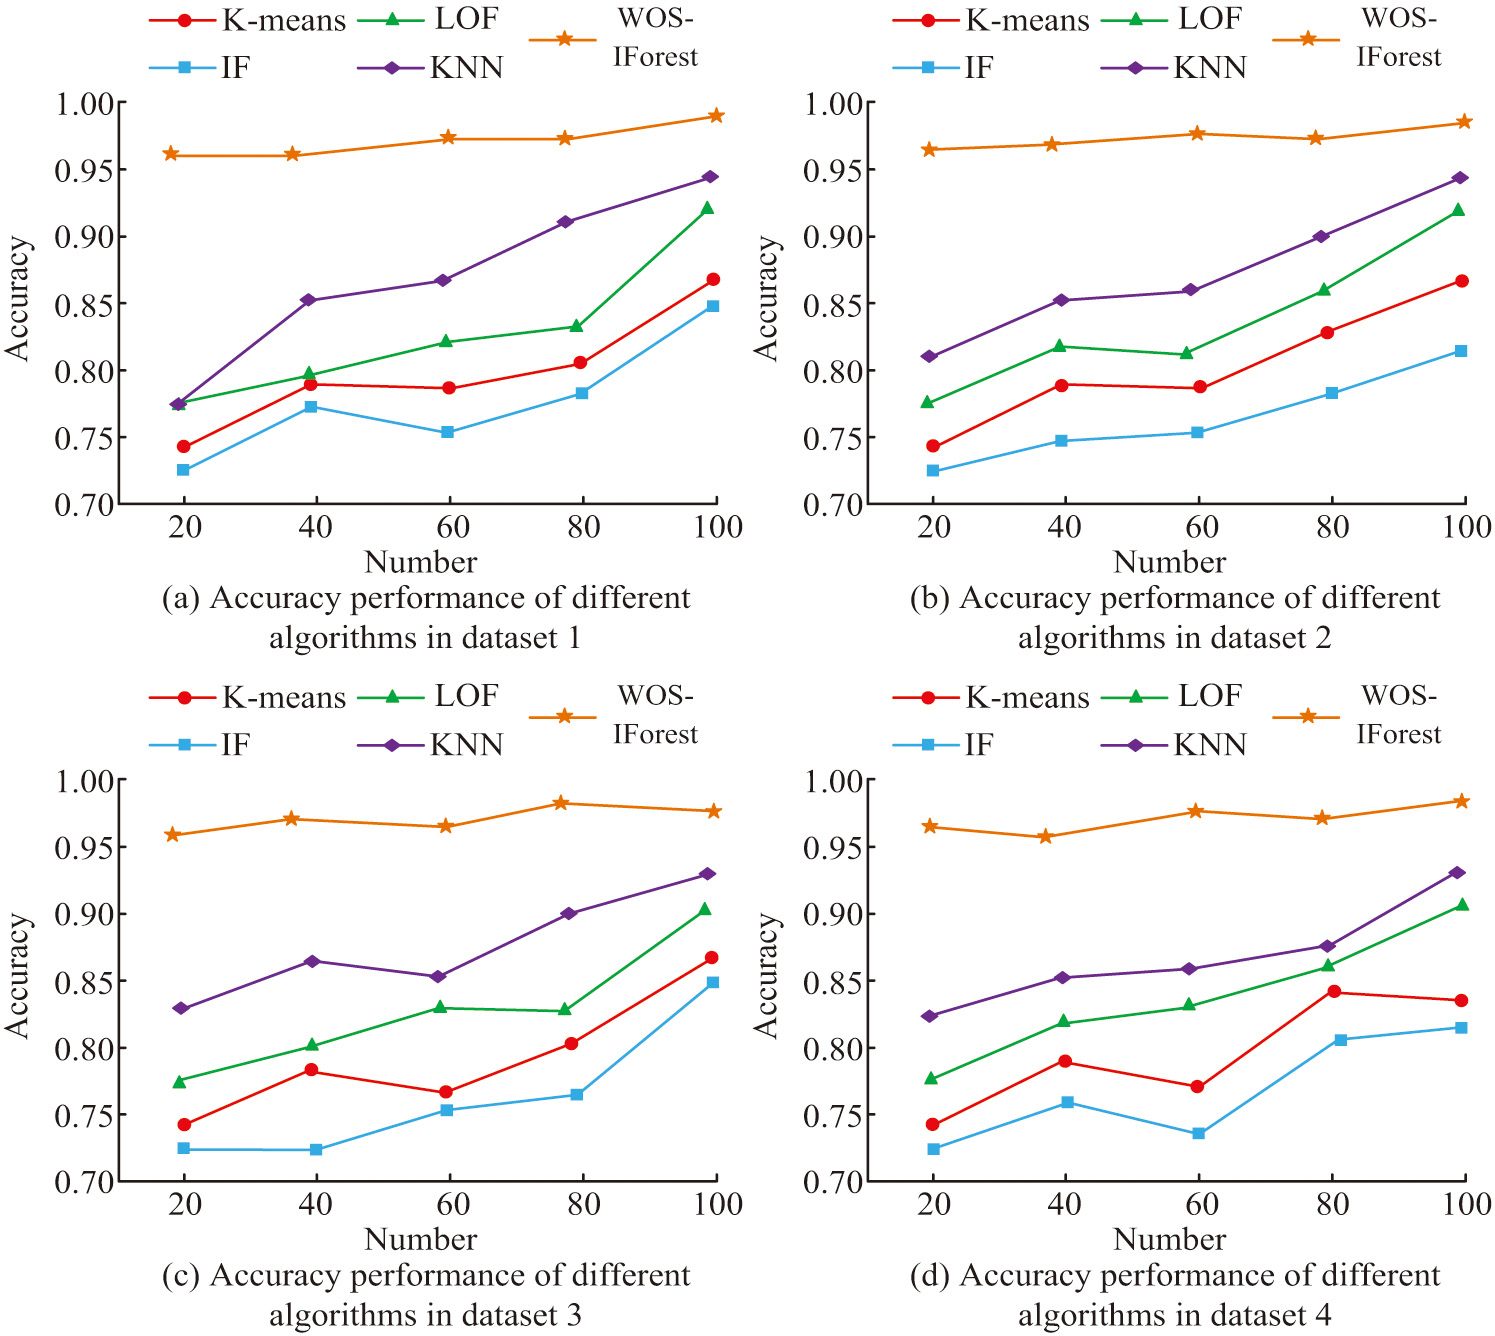 Fig. 7. Recognition accuracy of different algorithms in different datasets.
Figure 7 demonstrates the detection accuracy of several different algorithms in different datasets. Dataset 1, Dataset 2, Dataset 3, and Dataset 4 refer to CreditCard, Shuttle, Breakw, and Mammography, respectively. Figure 7(a) shows that the detection accuracy of all five algorithms changes as the number of samples in the dataset increases. However, the detection accuracy of WOS-IForest remains above 0.95. By comprehensively comparing the maximum accuracy values of several algorithms in Fig. 7(a), 7(b), 7(c), and 7(d), it is found that WOS-IForest has the highest detection accuracy on the dataset CreditCard, reaching as high as 0.986.
Figure 8 shows the detection stability of different algorithms. As shown in Fig. 8, as the number of experiments increases, the IF algorithm has the highest fluctuation amplitude and the worst stability. The K-means algorithm has poor stability, with stability fluctuations ranging from 0.86 to 0.95. The stability of the LOF algorithm is also poor, with fluctuations ranging from 0.85 to 0.96. KNN has good stability, with fluctuations ranging from 0.90 to 0.96, with a relatively small amplitude. The stability range of the WOS-IForest algorithm is 0.95–1.00. When compared to other recognition algorithms, the WOS-IForest algorithm exhibits better stability. To further explore the performance of the algorithms, Table II provides the running times of each algorithm.
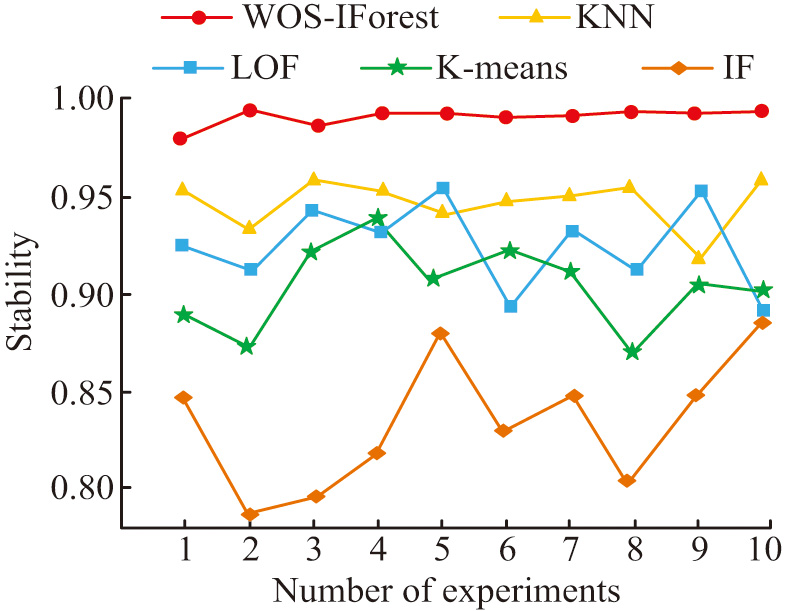 Fig. 8. Recognition stability of different algorithms.
Table II. Running time of different algorithms
| Algorithm | Dataset 1 | Dataset 2 | Dataset 3 | Dataset 4 |
|---|---|---|---|---|
| IF | 38s | 59s | 48s | 19s |
| K-means | 32s | 44s | 52s | 21s |
| LOF | 26s | 40s | 47s | 15s |
| KNN | 12s | 38s | 32s | 8s |
| WOS-IForest | 5s | 7s | 6s | 1s |
Table II demonstrates that compared to other recognition algorithms, the training time of the WOS-IForest algorithm in dataset 1, dataset 2, dataset 3, and dataset 4 is 5s, 7s, 6s, and 1s, respectively. Its training time is much lower than the other four comparative algorithms. The WOS-IForest algorithm can complete the recognition training task as soon as possible.
B.LSGRU Network Model Performance Testing
To test the performance of the LSGRU network model, the performance of four different cyclic neural networks is compared under the same dataset, and then, the recognition accuracy of the LSGRU network is analyzed under different loss functions and different distance weights. Figure 9 demonstrates the training time and recognition accuracy of four RNN models: twin GRU, twin LSTM, GRU, and LSTM.
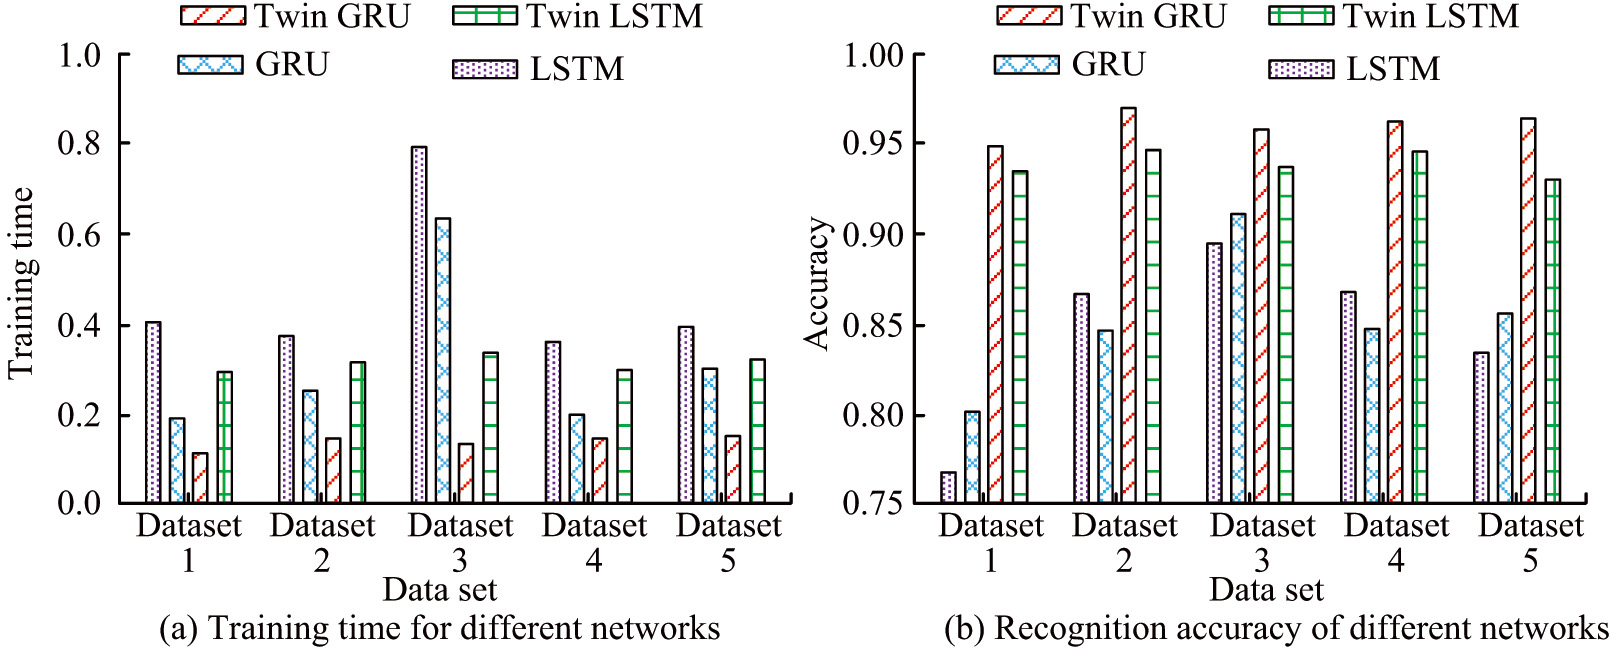 Fig. 9. Training time and recognition accuracy of different network models.
Figure 9(a) demonstrates the training time of different RNN models in different datasets. Dataset 1, dataset 2, dataset 3, dataset 4, and dataset 5 are Breakw, Shuttle, CreditCard, Pendigits, and Geography, respectively. The training time of LSTM in datasets is 0.41s, 0.38s, 0.79s, 0.36s, and 0.40s, respectively. The training time of GRU is 0.19s, 0.25s, 0.64s, 0.17s, and 0.31s, respectively. The training time for twin LSTM is 0.30s, 0.34s, 0.35s, 0.33s, and 0.35s, respectively. The training time for twin GRUs is 0.16s, 0.18s, 0.17s, 0.18s, and 0.18s, respectively. After comparing the training times of several neural networks, it can be inferred that the twin GRU network has the shortest training time and greater stability. Figure 9(b) demonstrates the training and recognition accuracy of different RNN models on different datasets. The training recognition accuracy of LSTM in five datasets is 0.76, 0.87, 0.88, 0.87, and 0.84, respectively. The training recognition accuracy of GRU is 0.80, 0.84, 0.91, 0.85, and 0.86, respectively. The training recognition accuracy of twin LSTM is 0.93, 0.94, 0.93, 0.94, and 0.92, respectively. The training recognition accuracy of twin GRU is 0.95, 0.965, 0.95, 0.955, and 0.96, respectively. Comparing the recognition accuracy of different neural networks, it demonstrated that the twin GRU has the highest accuracy and relatively stable results.
Figure 10 demonstrates the recognition accuracy of LSGRU network under different loss functions and distance weights. Figure 10(a) demonstrates that the three different loss functions, LDAloss, contrast loss, and Euclidean distance, are selected as the loss function of the LSGRU network. It is found that the LSGRU network under the LDAloss loss function has the best recognition accuracy, which is 0.97. The other two network models with loss function have low recognition accuracy, and the recognition accuracy of the models is unstable. Figure 10(b) demonstrates the recognition accuracy of the LSGRU network under different distance weights. When the distance weight , the LSGRU network has good recognition accuracy, with a maximum recognition accuracy value of 0.992. As the distance weight value decreases, the recognition accuracy of the LSGRU network model also decreases, and the fluctuation amplitude begins to increase.
 Fig. 10. Recognition accuracy of LSGRU network under different loss function and distance weights.
V.CONCLUSIONS AND FUTURE WORK
To better utilize educational big data and to analyze students’ learning status based on the information behind the data, this paper proposed to use the optimized Isolated Forest Algorithm and gated loop unit network to construct a student abnormal behavior recognition model. The results showed that the student abnormal behavior recognition model constructed by combining the WOS-IForest algorithm and LSGRU network had higher recognition accuracy, faster recognition speed, and better recognition stability. However, due to the randomness and chance of sample number selection, the model still has some errors. Therefore, subsequent studies can optimize the model performance by further expanding the number of samples. Moving forward, future research should focus on further optimization of the abnormal behavior recognition model by integrating various intelligent algorithms and neural networks. This approach aims to enhance the accuracy and stability of detecting abnormal behavior in students. It is possible to merge the abnormal recognition model with the smart campus to achieve entire real-time monitoring and teaching intervention for students using artificial intelligence, Internet of Things, and other related technological advancements.