I.INTRODUCTION
Under current technological conditions, intelligent robots are increasingly prominent in healthcare, education, children’s companionship, disaster relief, emergency deliveries, and intelligent services. In the healthcare industry, robots can reduce the burden on medical staff and increase the efficiency of treatment by performing precise assistive maneuvers during surgery or performing routine tasks in patient care. In education, robots can be used as teaching aids or child companions to facilitate children’s learning and social skill development through dynamic interactions. In disaster relief, robots are able to enter hazardous areas that are inaccessible or difficult for humans to reach to perform rescue tasks. These robots’ ability to perceive behavioral information is crucial for achieving precise operations [1,2]. The machine-human interaction interface has to organize multiple functions within a limited space. The interface design commonly employs three different glyphs in the form of “T,” “□,” and “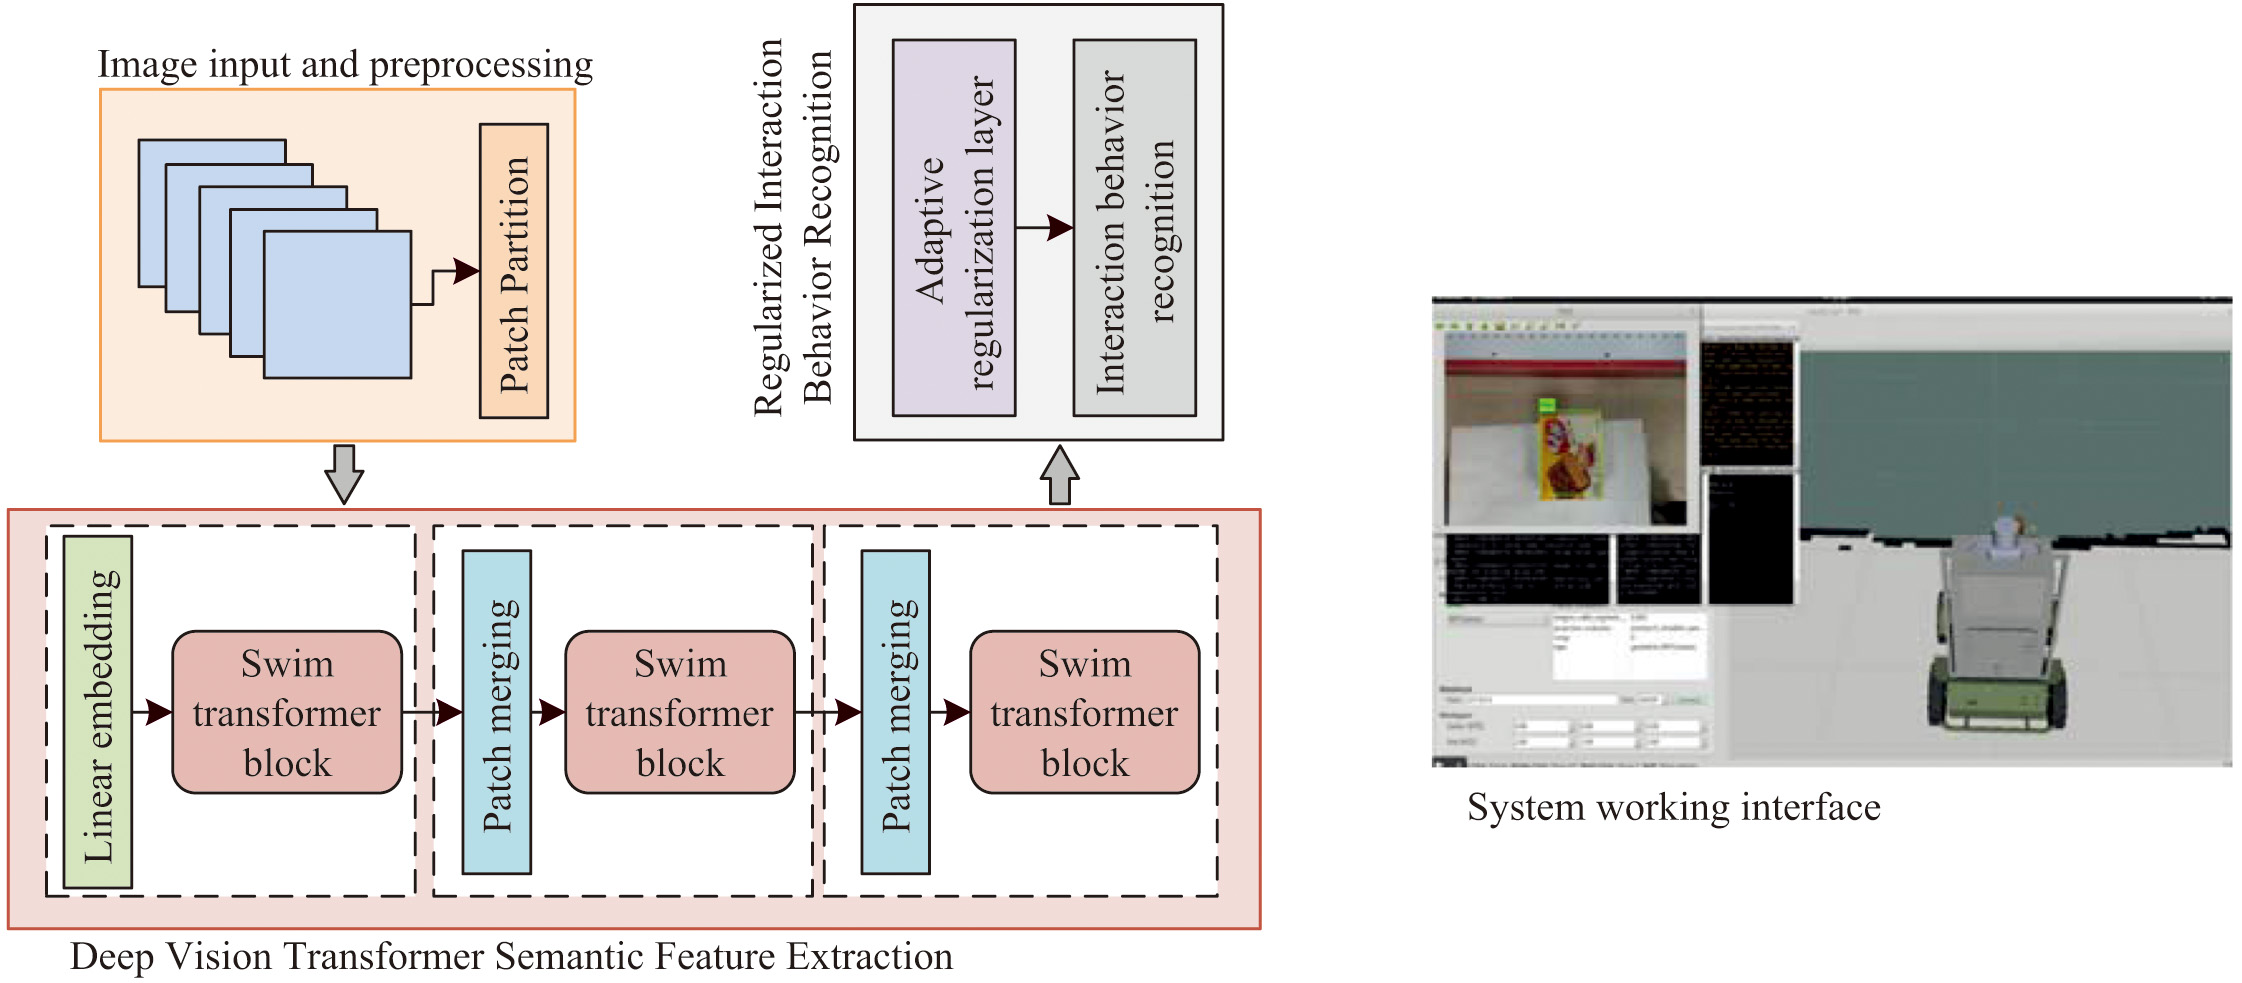 ,” as well as upper and lower symmetrical layouts. Additionally, the interface includes a combination of text and illustrations to reduce the user’s reaction time, simplify the operation steps, and lower the difficulty of differentiation. For instance, a robotic device designed for prekindergarten kids can provide accurate voice responses and behavioral interactions, utilizing visual data from the interface’s acquisition system, to address their needs for educational and companion support in diverse situations. Behavioral data from robots are obtained through both contact and noncontact approaches, with contact being the predominant method. The robot’s foremost end utilizes miniature force/torque sensors to gather interaction force and behavior with the object being manipulated [3,4]. However, this approach faces numerous limitations, including a large sensor size causing operational failure and high cost [5,6]. Based on these limitations, the study presents a Lightweight Regularized Transformer (LRe Trans), a Visual Interactive Behavioral Recognition (VIBR) model utilizing a regularized Transformer. LRe Trans overcomes the aforementioned limitations and achieves precise and rapid noncontact recognition of interaction behavior (IB).
The rest of the paper is organized as follows. Section II presents domestic and international research findings related to this study. Section III provides an exhaustive description of the LRe Trans model developed in this research. Section IV outlines experiments conducted to substantiate the model’s validity and attainable results. Section V furnishes an overall summary of the study, alongside its limitations and prospects for follow-up research.
II.RELATED WORKS
The domains of artificial intelligence, electronic information, and human-computer interaction have developed quickly, leading to rich research findings in this area. For the safety of human-computer collaboration in future factory environments, Mazhar O et al. created a real-time safe framework based on static gestures and 3D skeleton extraction. The researchers utilized a Kinect V2 depth map to eliminate the background of hand images and used random patterns and architectural templates to replace the background for data enhancement. The final experimental results proved that the framework did improve the security of human-computer collaboration [7]. Wu M et al. proposed a method called weight-adapted convolutional neural network (CNN) aimed at extracting discriminative expressed emotion features to recognize facial expressions [8]. Xiong Q and other researchers proposed an integrated approach aimed at solving the problem of human action recognition in human-computer interaction through optical flow and CNN-based transfer learning. In this study, the spatial-temporal information of human movements was simultaneously resolved by a dual-flow CNN structure [9]. Zhang R et al. proposed a system called WiGesID for joint gesture recognition and behavioral recognition through Wi-Fi sensing technology. The research method recognized new gesture categories and users by calculating the relationship scores between the features of the new category samples and the supporting samples. According to experimental results, the technique accurately recognizes new categories and performs better in cross-domain perception than state-of-the-art methods [10]. For automatic facial expression identification, Li J et al. developed a unique end-to-end neural network with an attention mechanism. Local binary pattern (LBP) features were applied to capture small movements of the face and enhance network performance; the attention mechanism could assist the neural network in better focusing on useful features. The network system consisted primarily of feature extraction, reconstruction, and classification modules [11].
Vision-based behavior detection and recognition is a significant field in human-computer interaction. It also assists in predicting the visual interaction capability for more precise human-computer interaction. A new approach to human behavior detection was presented by Jaouedi N. et al. It was based on a hybrid deep learning model that uses more powerful gated recurrent neural networks (RNNs) to classify videos and sequential data with more accuracy. The method achieved an average of 96.3% results in the KTH dataset test [12]. Yilmaz A A et al. proposed a deep learning architecture for human action recognition and prediction based on hybrid models. According to experimental findings, the suggested architecture predicted human behavior better than earlier models [13]. Abdelbaky A and Aly S proposed a new method for human behavior recognition. The method learned and fused spatial and temporal features from a simple unsupervised CNN that, simultaneously, combined a bag-of-features and locally aggregated descriptor vector coding scheme. After action recognition through the use of support vector machine (SVM) classifiers, satisfactory and comparable results were demonstrated on two commonly used datasets [14]. To create a thorough frame representation utilizing cross-correlation to capture the second-order statistics of all human-object couples within a frame, Roy D and Fernando B suggested a way to express human-object interactions using visual attributes. The outcomes demonstrated that compared with attention-based and other second-order techniques, this cross-correlation-based frame representation was more appropriate for behavioral prediction [15]. Jain S et al. designed and implemented a three-dimensional CNN (3D-CNN) architecture for real-time yoga pose recognition, which was an improved version of the C3D architecture applied to yoga pose recognition. Experiments demonstrated that this 3D-CNN architecture achieved 91.15% of the tested recognition accuracy on ten yoga poses and the execution speed was multiplied compared with the current optimal technique [16].
It is apparent upon synthesizing domestic and international research that CNN is the prevailing method for behavior recognition currently. However, the CNN architecture does not possess sufficient capability to characterize global features. Therefore, the study recommends introducing a switchable normalization (SN) layer based on the Transformer architecture to achieve precise and expeditious IB recognition.
III.VIBR MODELING OF ROBOTICS FOR PRESCHOOLERS BASED ON LRe Trans
In order to solve the challenge of the lack of global feature representation capability of traditional CNN architecture, the research constructed a VIBR model based on LRe Trans to achieve accurate recognition of robotic hand IB. The model is based on a deep LRe Trans framework to extract global semantic features and uses the LRe Trans layer for adaptive normalization of deep interaction features.
A.LRe Trans MODELING FRAMEWORK FOR ROBOTICS FOR PRESCHOOLERS
Nowadays, most of the researchers are using CNN or RNN-based deep learning frameworks to recognize the IBs of robotic hands. Both CNN or RNN-based deep learning frameworks have very strong recognition performance and can capture the characteristics of the robotic hands with the objects during the interaction very well. However, these frameworks mainly understand IB through the analysis of local properties, and sometimes focusing on local properties only does not fully understand IB [17]. Especially in the application of robots for preschoolers, it is necessary to take into account all the information in the whole scenario, that is, global information. In order to broaden these limited horizons, the research proposes a new model called the LRe Trans model. This model comprehensively understands the visual IB by focusing on both local and global information. The LRe Trans model and robot system operation are depicted in Fig. 1.
Fig. 1. Structure of LRe Trans model and robot system interface.
The image input module, the deep vision Transformer semantic feature extraction module, and the regularized IB prediction module comprise the three primary components of the LRe Trans model shown in Fig. 1. The image input module is like the eyes of the robot, responsible for receiving the continuous robotic arm sensing images and preprocessing their data. The Patch Partition tool in the image input module can cut the image into many small pieces for research. Next, these cut image chunks are sent to the deep vision Transformer semantic feature extraction module. This module is the core module of the LRe Trans model, which is responsible for receiving and processing the image information to extract the global semantic features of the image data. Finally, the IB prediction module introduced into the LRe Trans layer accurately predicts and recognizes IBs by fusing the global semantic features transmitted by the previous module. The LRe Trans IB recognition model provides a comprehensive understanding of the interaction situation and is suitable for preschooler robots to better accomplish the interaction. The interface of the preschooler robot needs to set the feedback window of key data in the focus position of people’s vision so that the user can learn the most critical data in the shortest time. As depicted on the right-hand side of Fig. 1, the robot’s system interface is active during operation. The robot’s primary function is to capture images and issue commands through various system frames. The interface style needs to be unified and at the same time requires font size adjustment and text icon personalization for easy understanding. The preschooler robot is composed of a sensing module and a main control module, with a cute appearance, smooth lines, and rounded corners. The sensing module has three intelligent cubes in blue, green, and yellow, and the surface of this module is coated with a frosted coating, and a 1.44-inch true color screen is set on the front. The main control module has a cuter design with a prominent color. The panel has more functional parts; on the left side are the speakers, which are evenly distributed by way of five slash bars and built-in metal mesh. On the right side are the knobs, with the edge section containing the volume scale lines, which are well damped. A brand label is printed in the center as well as LED indicators to show the different operating states.
It is required to divide the raw video into separate frames and give the appropriate label to the IB of each frame in order to accomplish the validity verification of the approach. The input raw data are defined as shown in (1) [18].
In (1), is the timestamp, and is the time step. In order to capture the dynamic changes between consecutive frames, as well as to reduce the impact of noise and other disturbing factors on the accuracy of the model, the study uses the time windowing approach to window the data in addition to standard deviation normalization of the data. The windowing of the data is done as in (2).
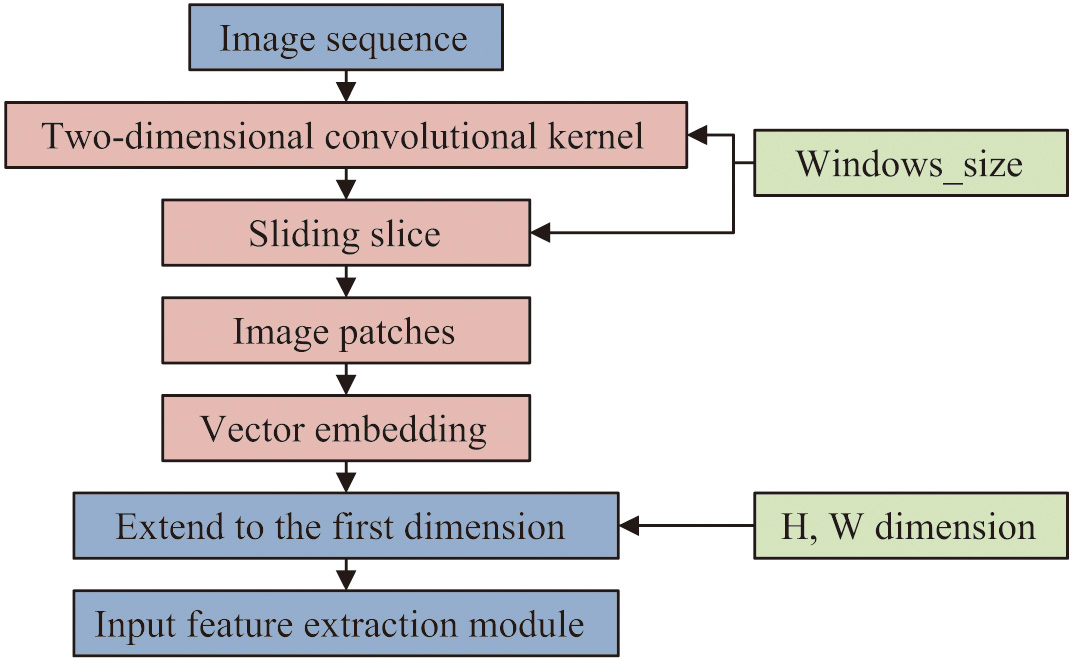
In (2), denotes the length size of the window, and is the standard deviation normalized data. is the moving step of the sliding window, and denotes the th time window data. The addition of window processing enables the model to find intercorrelations between consecutive frames for better understanding and prediction of IB. Since the baseline architecture used for the LRe Trans model constructed in the study is the Swin Transformer framework, the raw data also need to be sliced using the Patch Partition tool after the time window processing. The sliced data can then be individually feature coded for each part while preserving the original features of the image [19]. The processing flow of the Patch Partition is shown in Fig. 2.
B.SEMANTIC FEATURE EXTRACTION BASED ON DEEP LIGHTWEIGHT VISUAL TRANSFORMER
The deep lightweight visual Transformer module proposed in the study draws on and optimizes the architectural ideas of the Swin Transformer to meet the practical needs of robotic hand interaction scenarios that require timeliness. The semantic feature extraction module uses a hierarchical stacking architecture. It is composed of three-stage modules that decrease the resolution of the input feature map. Each stage is built using patch merging and block linking. With respect to the CNN structure’s local feature extraction capabilities, this design seeks to decrease the computational complexity of the model while expanding the sensory field’s range and enhancing the effectiveness of deep feature extraction. Figure 3 illustrates the variance in image dimensions for the semantic feature extraction module.
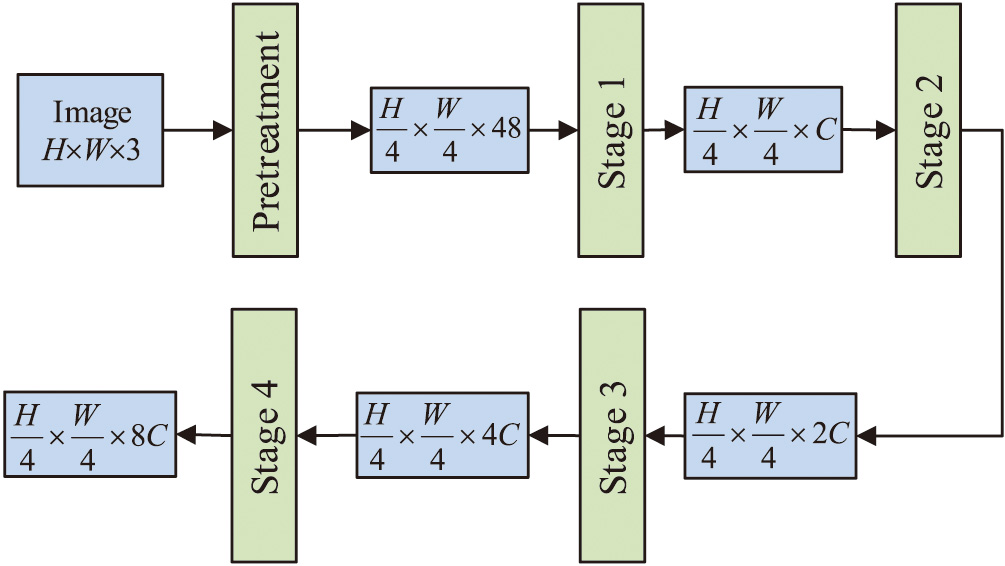 Fig. 3. Structure diagram for semantic feature extraction based on deep lightweight visual Transformer.
Figure 3 shows the process of dividing the input RGB three-channel image into nonoverlapping block feature maps of the same size. These block feature maps are then combined into a window, which is mapped to the dimensions of the feature extraction by linear embedding. Within each window, feature extraction is performed using the self-attention mechanism. It is crucial to remember that the new block feature maps ensure that the image’s dimension is divisible. For example, in the first stage, 8 block feature maps are combined, and the dimension of the mapping is set to 128. In the second and third stages, they are set to 16, 32, and 256, 512, respectively. As the depth of the network increases, the total number of feature maps decreases by half each time, whereas the embedding dimensions are doubled. The size of the feature graph decreases step by step, and the dimension increases gradually, showing a hierarchical structure similar to a pyramid. The structure of the semantic feature extraction module is shown in Fig. 2. The Swin Transformer Block is the main structure to perform global feature extraction, which mainly realizes the semantic representation of image features with the help of a self-attention mechanism. In Fig. 4, the Block structure is displayed.
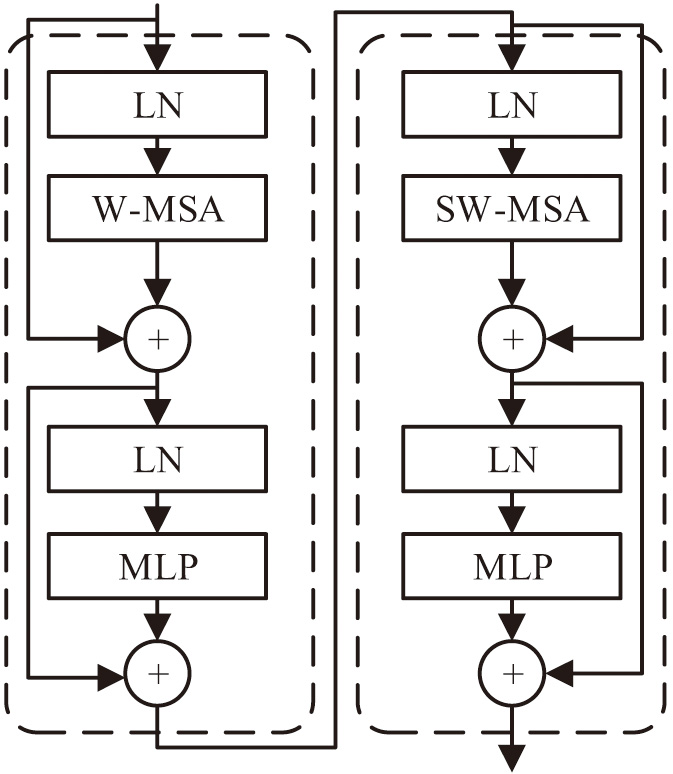 Fig. 4. Structural diagram of Swin Transformer Block.
As illustrated in Fig. 4, Block uses the window-multi-head self-attention (W-MSA) and shifted window-multi-head self-attention (SW-MSA) alternating execution strategies to maintain efficient computational power and prevent information loss at the connection when slicing images and linking feature maps. Calculating self-attention in every nonoverlapping window can significantly lower the module’s calculation. The computational amount of an image for MSA is shown in (3) [20].
In (3), is the depth obtained by linear embedding. After the feature maps are fused into windows, the computational amount of W-MSA for one image is shown in (4).
In (4), is the size of the fusion window, and the amount of computation can be controlled by controlling its size, which not only reduces the amount of computation of the model but also effectively improves the scalability of the model. Specifically, Swin Transformer uses the shifted window technique to address the problem of information exchange between adjacent windows at the same stage utilizing W-MSA. Conventional window slicing is uniformly sliced, whereas the shifted window is sliced from the center of the h and w dimensions of the feature map. The cut window will be offset so that the window information can be exchanged, which solves the problem that different windows cannot communicate with each other. Swin Transformer uses a kind of relative position encoding, specifically when calculating the similarity between the query and the key to add a relative position bias. Through this design, the window obtained is no longer regular, there is interaction between windows, and the expressive ability of the model will be enhanced. The relative position offset is shown in (5) [21].
In (5), denotes the query matrix, and is the key matrix, both of which have the same dimension . denotes the value matrix. denotes the value in the offset matrix . The number of patch in the window is . The offset matrix is defined as shown in (6).
C.INTERACTION BEHAVIOR PREDICTION AND RECOGNITION MODULE INTRODUCING SWITCHABLE NORMALIZATION
In order to eliminate the changes of feature distribution during training and inference, and to guide the model to be able to train and inference better, the study introduces an SN layer to adaptively normalize the extracted deep interaction features. In CNN, is defined to denote the data samples with channel heights and widths of and , respectively, of any normalization layer, and the number of channels of the samples is . The feature map representation of the image samples is shown in Fig. 5.
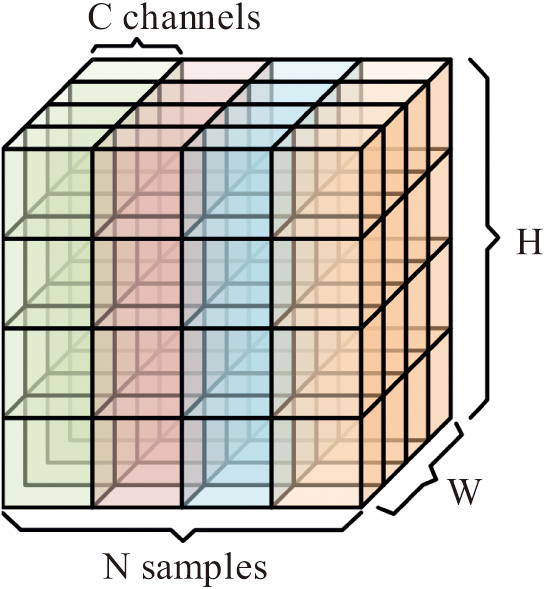 Fig. 5. Feature map schematic of multiple image samples.
is defined as the mean of the sample, and is defined as the standard deviation of the sample, and the mean and standard deviation are used to normalize the pixels in the feature map with scaling and displacement. The process of passing the sample image pixels through the regular normalization layer is shown in (7) [22].
In (7), and are the pixels before and after normalization, respectively. is the normalization scale parameter, and is the shift parameter. is a constant to control the range of the numerical shift. The only differences between batch, layer, and instance normalization and conventional normalizing are in the pixels utilized to determine the mean and standard deviation. All three methods follow the same procedure. Therefore, the mean and standard deviation are defined as shown in (8) [23].
In (8), refers to different normalization methods, is the set of pixels, and is the number of pixels in the set. Based on this, the process of normalization of image samples by SN is shown in (9) [24].
In (9), is the statistics estimated by different methods such as instance normalization, layer normalization, and batch normalization. and are both scaling ratios, which are used to control the degree of variation in the weighted mean and variance. is defined as shown in (10) [25].
In (10), , , and represent instance normalization, layer normalization, and batch normalization methods, respectively. is a control parameter, which is input into the softmax function for the calculation to obtain . In the online inference phase, the SN layer is employed for the forward inference process, and the statistics for instance normalization and layer normalization are computed individually based on each sample; however, batch normalization chooses to use the average of the batch in each iteration instead of computing the moving average [26]. To compute the batch average, the parameters of the network and all SN layers are first frozen, and then a small batch consisting of a certain number of randomly selected data from the training set is input to this network. The average inference elapsed time of the model is utilized to gauge its computational efficiency, and the most popular overall accuracy and F1 score are used in the study as assessment metrics for IB recognition models [27].
IV.BEHAVIOR RECOGNITION EFFECT OF VISUAL INTERACTION BASED ON LRe Trans
This study was modeled using the JHU-ISI gesture and skill assessment working set (JIGSAWS) large-scale dataset, and the validation method is the training-validation-test model. Apart from conducting trials to compare the study’s proposed method with various advanced techniques, the model’s resilience to various noise disturbances is also confirmed.
A.EXPERIMENTAL DATASET AND PARAMETER CONFIGURATION
The dataset used in the study is JIGSAWS, which is an open-source large-scale robot hand interaction dataset. After video frame-splitting and data cleaning, 133,168 consecutive robot hand interaction images are obtained. To analyze the IB of the robot with preschool children, the study utilizes a windowing approach. This method facilitated the creation of an interaction dataset with continuous windowed data. Each window provides a continuous sequence of robot actions, similar to the dynamic sequence during robot-child interaction. The original windowed interaction dataset is randomly sampled and divided into 10 groups for training, validation, and testing. The model is trained and tested using these sets. The ratio used is 7:1:1. The data collection process involves using a camera to capture images and various contact sensors, including force feedback sensors, to record the interaction forces between the robot and the objects. To analyze children’s IBs, algorithms and processing flows are developed to convert the multimodal data. The robot’s hand movements can be matched and simulated with those of the children during their interactions.
Using a training set and a validation set, the LRe Trans model is trained and validated for the validation experiments. While the test set is used to assess the suggested model’s performance metrics, the validation set is in charge of monitoring the model’s fitting status in real time throughout training. The image input dimensions are scaled to 224 × 224 pixels during the training phase. One is selected as the output label dimension. The model’s cross-entropy loss function serves as its loss function, and the model’s parameters are optimized using the Adam optimizer. There are 200 rounds throughout the entire training process, and the learning rate is fixed at 0.001. Sixty-four is selected as the batch size. In addition, the model performance is analyzed for three cases, , , and , in order to determine the more optimal B. Figure 6 displays the loss curves of the LRe Trans model on both the training and validation sets for robotic IB recognition. As Fig. 6 illustrates, the LRe Trans model’s loss converges to below 0.2 after iterating for approximately 20 rounds, and it can achieve a minimum of below 0.1. The experimental results validate the applicability of the model to the experimental dataset.
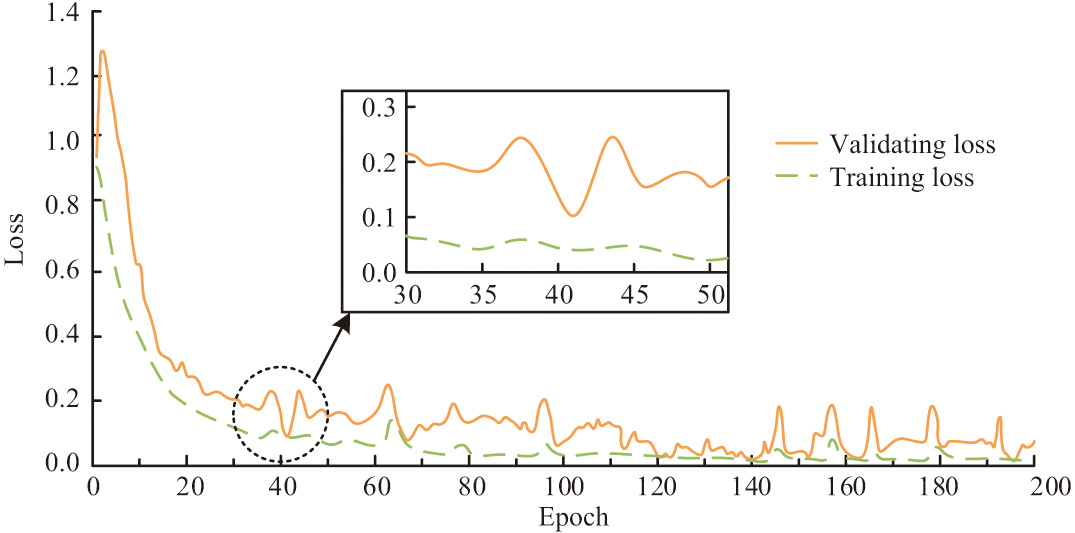 Fig. 6. Training loss and validation loss curve.
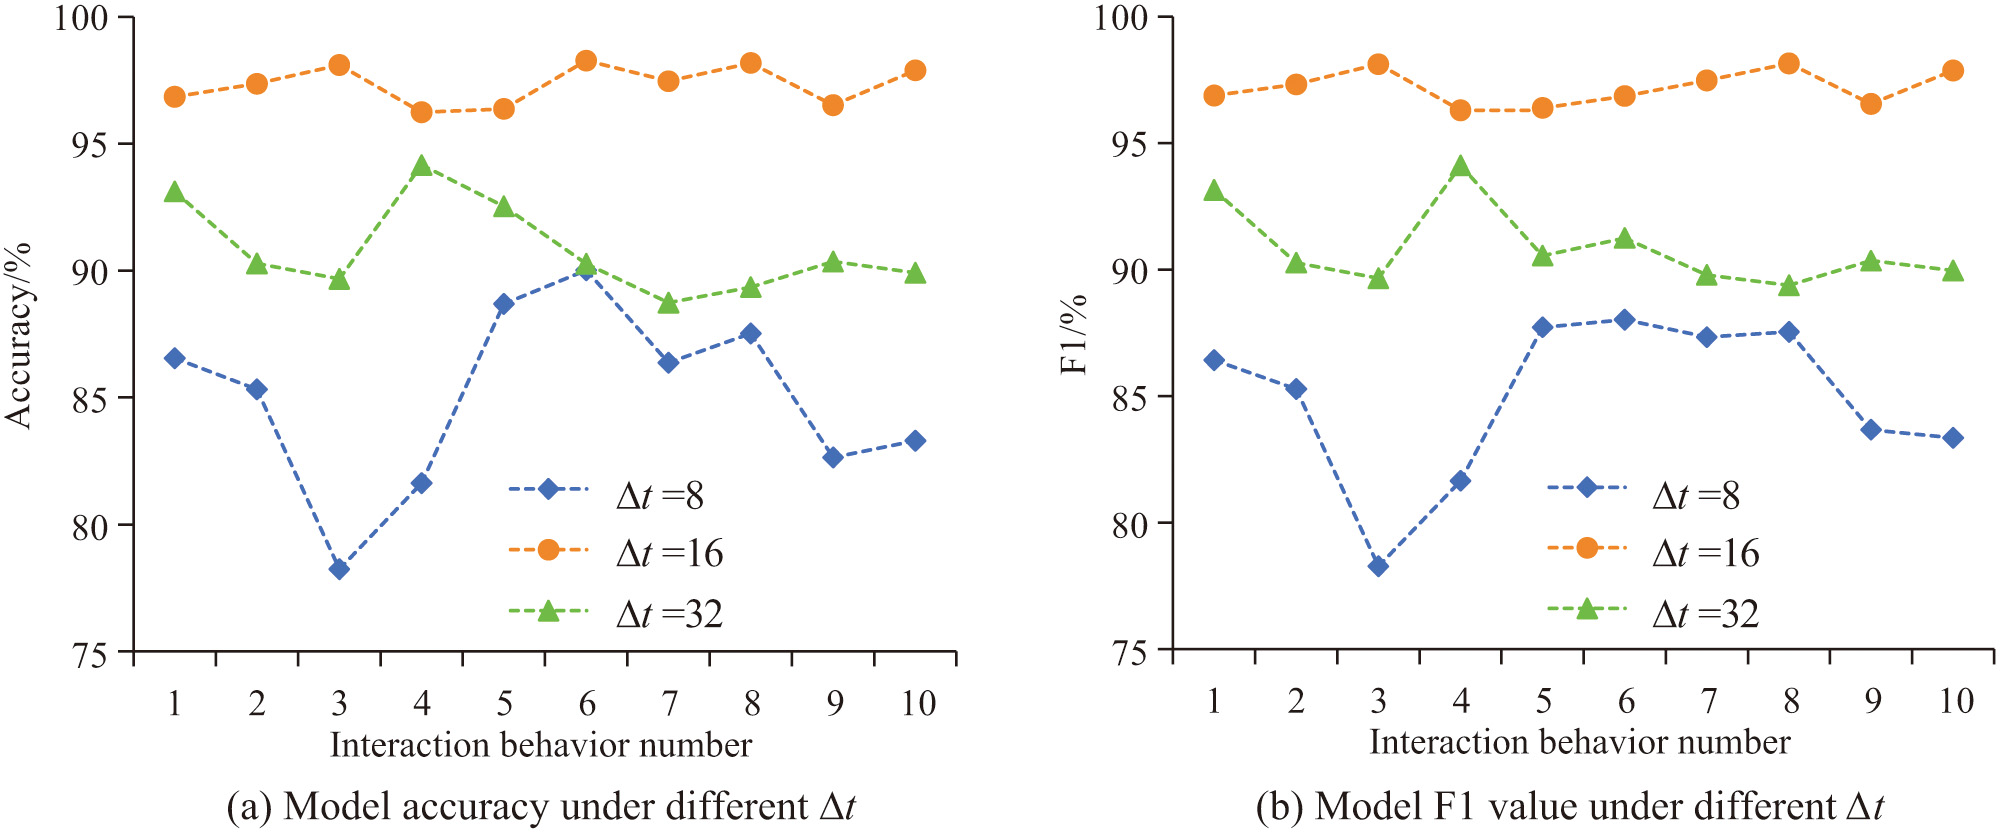
To determine a better value of , the study conducted parameter validation experiments, and the results obtained are shown in Fig. 7. In Fig. 7, when , the accuracy and F1 value of the model are low and fluctuating, and the overall value does not exceed 90%. When , the model’s recognition accuracy and F1 values are somewhat improved, with overall values between 90% and 95%, but the fluctuations are still relatively large. When , the model’s recognition effect for the 10 types of actions is more stable, with accuracy and F1 values above 95%. Therefore, the study determines that the length of the time window in the subsequent model validation is .
B.ANALYSIS OF RESULTS OF VISUAL INTERACTIVE BEHAVIORAL RECOGNITION MODEL OF LRe Trans
The size of the patch greatly affects the model’s performance in the Transformer and its related designs. Therefore, the study selects different sizes such 2 × 2, 4 × 4, and 8 × 8 for performance comparison in order to confirm the robustness of the model and to establish the ideal patch size. Figure 8 illustrates how the size of the image slice affects the LRe Trans model’s performance. As seen in Fig. 8, the accuracy, F1 score, and execution time of the visual IB approach are significantly impacted by varying patch sizes. The lowest accuracy of 96.19% is achieved when the patch size is 2 × 2. And when the patch size is 8 × 8, the accuracy is the highest, 97.63%. In terms of execution time, as the patch size increases, the execution time shows a trend of decreasing and then increasing, and when the patch size is 16 × 16, the execution time is the shortest, which is only 0.03 s. This is due to the fact that the smaller the patch size is, the larger the number of slices will be, which in turn will lead to an increase in computation. However, the LRe Trans model maintains more than 96% recognition accuracy and F1 value for multiple slice sizes, which indicates that the model has good robustness. Taken together, choosing the 8 × 8 slicing scheme can better balance the runtime and model performance; therefore, in the subsequent experiments, the study determines the patch size to be 8 × 8.
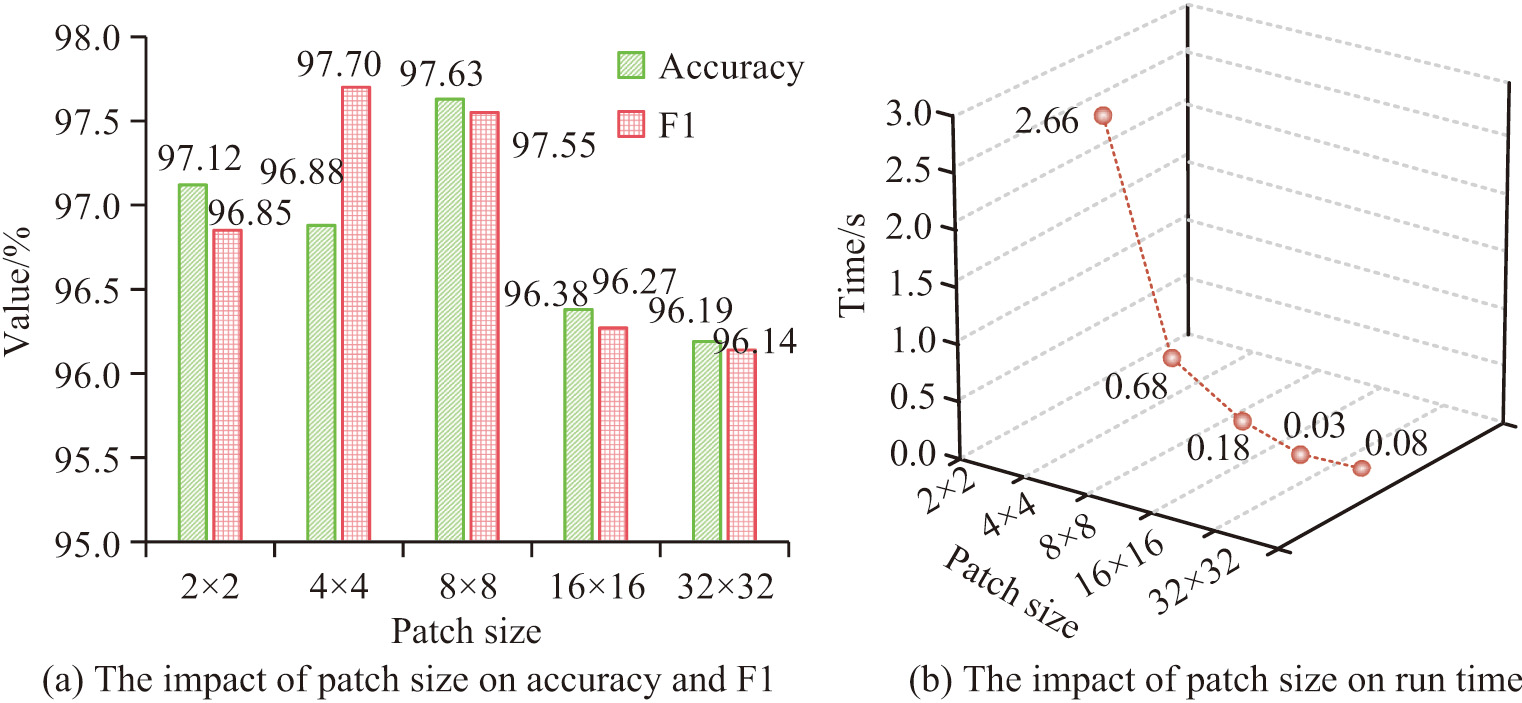 Fig. 8. The effect of image slice size on the performance of LRe Trans model.
The paper compares the LRe Trans recognition model with the most recent VIBR approaches and spatiotemporal deep learning algorithms and conducts validation experiments on a large-scale visual interaction dataset to verify the model’s efficacy. The methods used for comparison are Migration Learning Convolutional Neural Networks (TL-CNN) [9], Gaussian Mixture Models + Kalman Filters + General Regression Neural Networks (GMM+KF+GRNN) [12], Joint Graph Regularized Heterogeneous Information (JGRHI) [10], Deep Learning Genetic Algorithm Deep Neural Network (DL-GA-DNN) [13], Deep Learning -3D Convolutional Neural Networks (3D-CNN) [16], Semi supervised Conditional Random Fields (SC-CRF) [15]. The results of the performance comparison metrics between the LRe Trans method and the latest VIBR method are shown in Fig. 9. In Fig. 9, the proposed method of the study outperforms other state-of-the-art visual IB methods in three key metrics, namely, accuracy rate, F1 score, and execution time. First, in terms of accuracy, the LRe Trans model reaches 97.63%, far exceeding all other methods. The accuracy of TL-CNN is 86.52%, which is significantly lower than that of the LRe Trans model, whereas the closest performer, GMM+KF+GRNN, has an accuracy of only 96.30%. In terms of F1 scores, the LRe Trans model is also dominant at 97.55%. Among the remaining models, only DL-GA-DNN has an F1 score of 93.56% over 90%. In terms of execution time, the LRe Trans model also outperforms all other methods, taking only 0.18 s. The JGRHI method, which takes the longest time, takes 4.26 s, which is more than 23 times longer than the LRe Trans model.
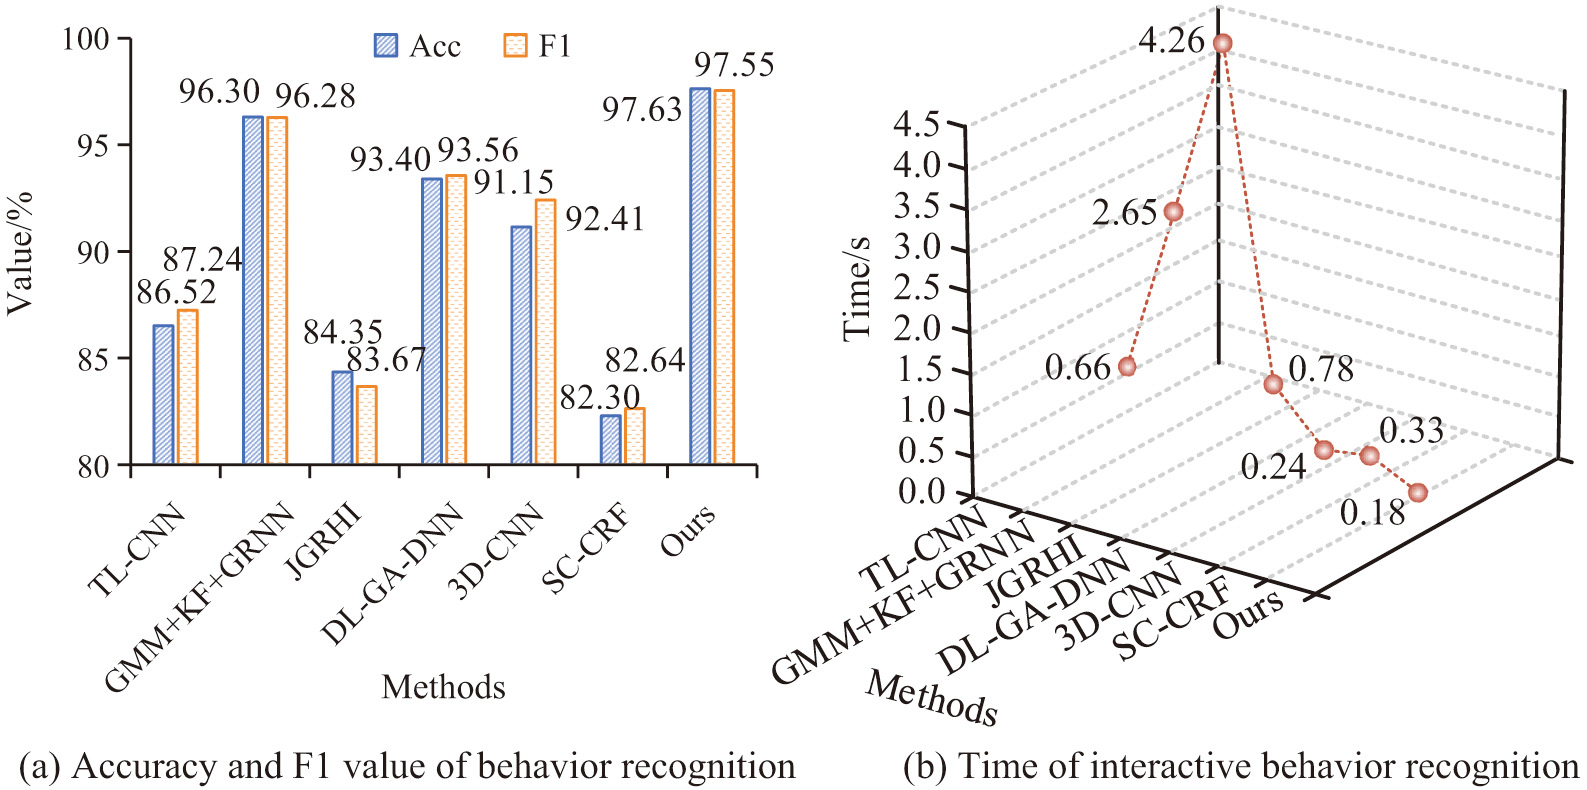 Fig. 9. Performance comparison between LRe Trans method and the latest visual interaction behavior recognition method.
Preschool robots have real-world applications; however, there are interferences brought about by the setting, acquisition tools, and other elements. To assess the LRe Trans model’s robust performance under various noise interferences, the study incorporates noise interference into the experiment. In this particular experimental setup, each sample in the original test picture dataset is subjected to random noise, pretzel noise, and Gaussian noise interference. This results in test image samples with varying levels of noise interference. The IB recognition experiments are then performed using the LRe Trans model under test conditions doped with different noises. The results of model robustness validation under noise interference conditions are shown in Fig. 10. In Fig. 10, as shown in Table I, which lists data information specific to the dataset. The training loss and validation loss of the LRe Trans model increase under pretzel noise, random noise, and Gaussian noise interference conditions, and the pretzel noise has the greatest impact on the performance of the model.
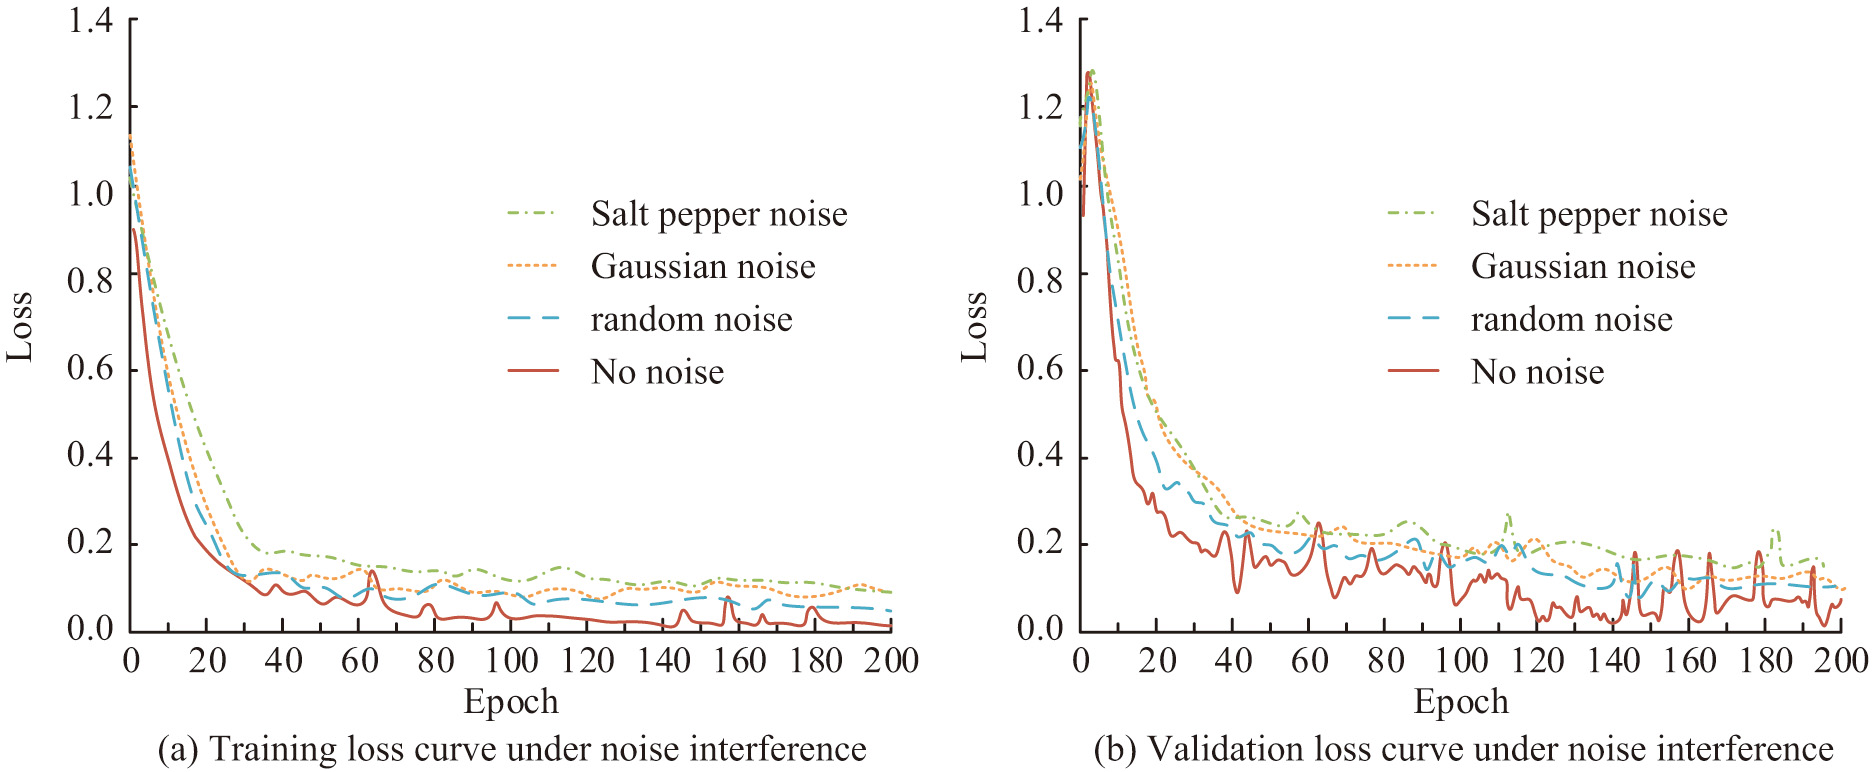 Fig. 10. Verification results of model robustness performance under noise interference conditions.
The model performance results under different noise disturbances are demonstrated in Table II. In Table II, although the performance of the LRe Trans model shows a certain degree of degradation under different noise disturbances, it still maintains a more stable recognition accuracy and F1 value. This indicates that the LRe Trans model has strong robustness and can adapt well to different noise disturbances.
Table I. Detailed information of the dataset
| Interaction behavior number | Number of training samples | Number of validation samples | Number of test samples | Total number of samples |
|---|---|---|---|---|
| 1 | 1625 | 184 | 448 | 2257 |
| 2 | 14013 | 1556 | 3870 | 19439 |
| 3 | 32114 | 3552 | 8923 | 44589 |
| 4 | 12573 | 1405 | 3511 | 17489 |
| 5 | 2668 | 302 | 732 | 3702 |
| 6 | 18082 | 2006 | 5017 | 25105 |
| 7 | 5426 | 597 | 1511 | 7534 |
| 8 | 1872 | 198 | 520 | 2590 |
| 9 | 644 | 68 | 186 | 898 |
| 10 | 6942 | 768 | 1931 | 9641 |
Table II. Model performance results under different noise interferences
| No. | Noise type | Accuracy/% | F1/% |
|---|---|---|---|
| 1 | Salt and pepper noise | 94.35 | 94.25 |
| 2 | Random noise | 96.17 | 95.86 |
| 3 | Gaussian noise | 95.62 | 95.12 |
| 4 | No noise | 97.63 | 97.55 |
The study will evaluate the effectiveness of the interactive interface of a robot for preschoolers using a self-developed questionnaire. The evaluation indicators include 10 of humanized help, efficiency, fault tolerance, esthetic simplicity, easy access principle, error-proof principle, consistency and standardization, user’s degree of control and freedom, closeness to user’s cognition, and perceivability of the system state, which are denoted by the letters A–J, respectively. The evaluators are experts in the related fields of children’s robotics and preschool children’s education. Each item is rated on a scale of 0–10, with 10 evaluators. Figure 11 refers to the relevant evaluation results of the 10 evaluation indicators. Overall, the four evaluation indicators of humanized help, esthetic simplicity, close user perception, and perceivable system status have all reached a high level, with an average rating value of about 8 points, whereas the remaining indicators have a rating value in the range of 6–8 points. Therefore, the preschooler robot still needs to be optimized and improved in other indicators subsequently.
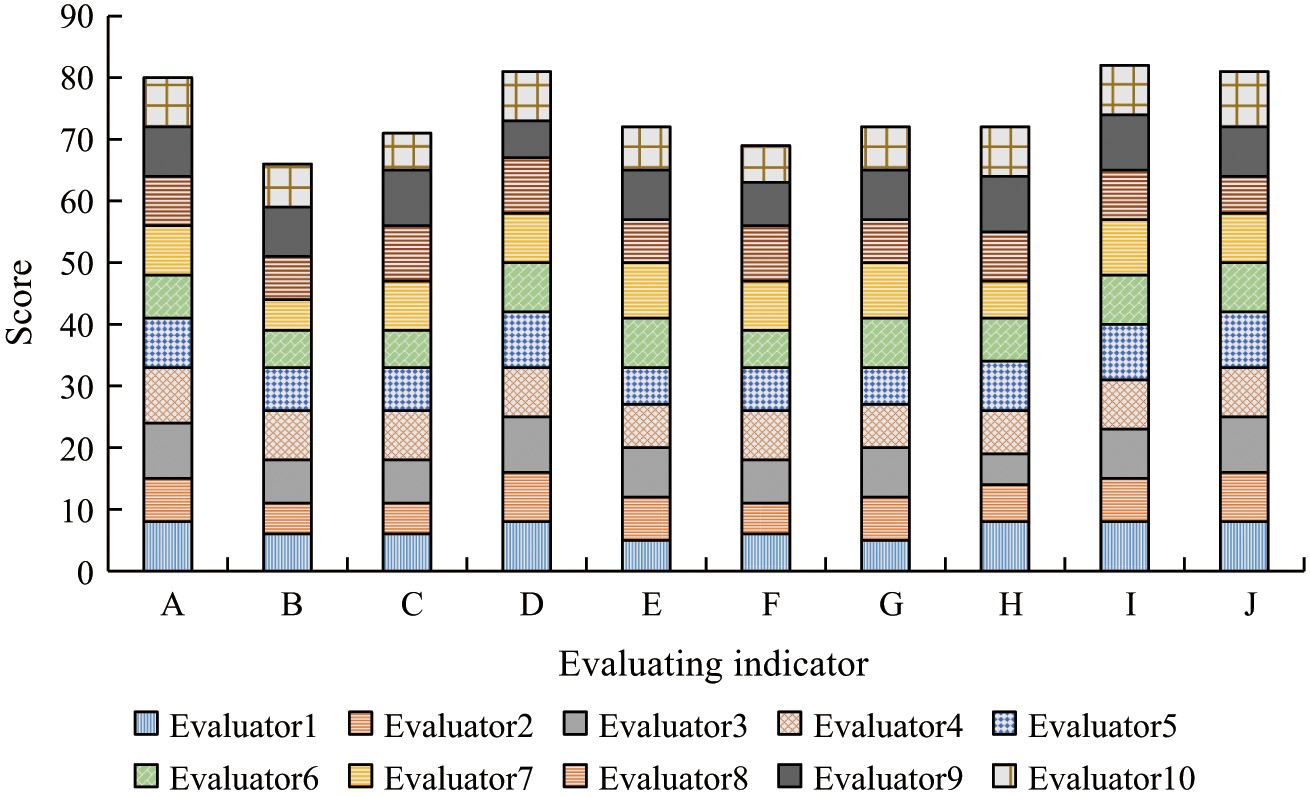 Fig. 11. Relevant evaluation results of 10 evaluation indicators.
V.CONCLUSION
To address the challenge of conventional contact behavior recognition techniques struggling to reconcile accuracy and speed in robots designed for preschoolers, the VIBR method was presented as a solution. The VIBR method relies on the LRe Trans model that incorporates image input and slice preprocessing, global semantic representation from a deep lightweight visual Transformer, and regularized IB recognition in three stages. The model could competently identify long memory span interaction actions and efficiently capture global features and long memory span actions. The experimental outcomes revealed that the LRe Trans model executed proficiently on the robot interaction dataset. Indeed, the LRe Trans model achieved exceptional outcomes for both accuracy and F1 score for IB recognition, with figures of 97.6% and 97.5%, respectively, and also boasted an average inference time of solely 0.18 s per sheet. These findings indicated that LRe Trans can provide faster inference speed while maintaining or exceeding the accuracy of current state-of-the-art spatiotemporal deep learning algorithms. In addition, the LRe Trans model demonstrated significant resilience for different image slice sizes and noise interference conditions. The experiment’s outcomes demonstrated that the LRe Trans model could surpass the weaknesses of traditional machine learning techniques and deep learning algorithms. It further offered an interactive visual layout with improved precision, swifter pace, and better strength for preschooler robots, which holds great value in practical applications. However, the study solely relied on visual image data, and incorporating multimodal heterogeneous data will be considered to enhance the accuracy and robustness of the behavior recognition model in the future work.