I.INTRODUCTION
The integration and development of professional education and innovation and entrepreneurship education is called professional creative integration [1]. Since the concept of innovation and entrepreneurship education was introduced into higher education, Chinese universities have gradually tried to deeply integrate entrepreneurship education with professional education and put forward corresponding reform measures [2]. With the advancement of science and technology, online education has emerged as a new form of education. However, teachers cannot ensure that students maintain a 100% learning state during the teaching process. Currently, online creative fusion education in music majors is becoming increasingly common, but accurately identifying students’ classroom states remains a challenge [3]. Teachers easily overlook students’ learning experiences in online teaching. The intelligent recognition of students’ learning states online is a focal point of current research. Through this approach, teachers can gain real-time insights into students’ classroom states, adjust course content promptly based on students’ states, and ensure maximum course efficiency [4]. Traditional machine learning facial recognition methods heavily rely on extensive prior knowledge and experience, lacking strong generalization performance and suffering from issues of low efficiency and poor model robustness [5]. In addition, the collection of facial expressions requires high-precision sensors and devices, which can increase the financial burden on educational institutions. The acquired data may be affected by factors such as illumination, angle, and occlusion, resulting in a decline in data quality and thus affecting the training effect of the model [6,7]. In practical application, students’ classroom status may be affected by various factors, such as learning environment, course content, and teacher teaching style. These factors may lead to a decline in the generalization ability of the model and an inability to accurately identify the class status of students.
To this end, this study proposes a method for online class status recognition of creative fusion music majors, which combines deep separable convolution (DSC) and convolutional neural network (LeNet-5) models. Music educators can use this method to better understand students’ classroom states and provide personalized teaching management and guidance. The innovation of this study lies in the fusion of DSC and LeNet-5 models to achieve accurate recognition of online music major students’ classroom states.
The rest of the paper is presented in four parts: the literature review, method introduction, experimental analysis, and conclusion. Each section, respectively, explores the current research status, introduces the technical aspects and processes of the model design, analyzes the performance of the designed model through comparative experiments, and summarizes and analyzes the research content while providing prospects for the future.
II.RELATED WORKS
Emotions, as one of the most direct labels for expressing human feelings, play a crucial role in demonstrating emotions and conveying sentiments in real life. In recent years, researchers have delved into a new direction by using facial expression recognition to assess the emotional states of individuals. Liu W and colleagues explored a multimodal emotion recognition algorithm for optimal performance, comparing the recognition capabilities and robustness of deep canonical correlation analysis (DCCA) and bimodal deep autoencoder algorithms. They introduced noise into multimodal features and replaced electroencephalogram (EEG) features with noise. Experimental results indicated that DCCA exhibited stronger robustness with a recognition rate of 90.7% [8]. Khare S K and others aimed to achieve accurate automatic emotion classification by constructing an emotion recognition model using EEG signals and CNNs. They transformed EEG signals into images and fed these images into a CNN model for training and recognition. Experimental analysis revealed an accuracy of 93.01% for this model [9]. Ashok Kumar P M and team proposed a novel feature method to realize an intelligent facial emotion recognition model. They initially extracted faces from input images using the Viola-Jones method, employed affine scale-invariant feature transform to extract facial components as features and reduced the number of descriptors using optimal descriptor selection methods. Finally, the extracted features were input into a neural network for recognition [10]. Addressing the issue of inaccurate facial emotion recognition due to mask usage during the COVID-19 pandemic, Castellano G and colleagues presented an automatic facial expression recognition system capable of identifying emotions from masked faces. The system focused solely on the eye region for emotion recognition and was tested for its effectiveness, achieving a detection accuracy of 90.12% [11]. Kumari N and team identified problems in existing facial emotion recognition methods, such as poor visibility and excessive noise. They utilized contrast limited adaptive histogram equalization to enhance the visibility of input images and employed a joint three-side filter to remove noise from the enhanced images [12].
DSC involves splitting traditional convolution into two processes: depthwise convolution and pointwise convolution. With technological advancements, DSC finds applications in a growing range of fields. Zhang J and colleagues addressed the low diagnostic efficiency in traditional bearing fault diagnosis by proposing a bearing fault diagnosis method based on DSC and spatial dropout regularization. They extracted features from raw bearing vibration signals using DSC, adjusting weights to enhance the effectiveness of feature extraction. Spatial dropout regularization independently computed fault features in the signal and incorporated batch normalization in the convolutional layer, resulting in improved diagnostic efficiency [13]. To overcome the limitations of a single-network model in extracting more complex and rich effective features, as well as its resource-intensive parameters, Huo H and team introduced an abnormal module and a logic residual structure for quantifying the overall model in neural networks. They also presented an improved deep separable convolutional network-based method for face recognition [14]. Zhao H. et al. proposed a probability-based channel pruning method for DSC to address the limitations of existing channel pruning methods, which mainly focus on pruning standard convolutional networks. They highlighted the issue of extensive reliance on time-consuming fine-tuning for performance improvement. This method takes into account the scaling and shifting factors of batch normalization layers [15]. Zhou W. et al. aimed to enhance the segmentation accuracy of the optic disc and cup in glaucoma diagnosis. They combined DSC with robust multiscale features to create a novel image segmentation model. By introducing external residual connections between encoding and decoding layers, they minimized the problem of feature degradation. The dice coefficients for image segmentation using this method were reported as (0.978, 0.919) and (0.965, 0.910) [16]. Huang T. et al. introduced an end-to-end deep separable U-shaped convolutional network with large convolutional kernels. They applied this network to the segmentation of computed tomography and magnetic resonance imaging images. Additionally, they proposed parallel DSC to aggregate global information. Experimental analysis demonstrated a dice index of 90.88% for synapses on the dataset [17].
In summary, the literature indicates that facial emotion recognition technology has matured, but its application in online classroom teaching is still limited. At present, the collected data may be affected by factors such as illumination, angle, and occlusion, which will lead to the deterioration of data quality and thus affect the training effect of the model. In addition, students’ classroom status may be affected by factors such as learning environment, course content, and teacher’s teaching style, which will lead to the decline of the generalization ability of the model. The DSC network has shown maturity in facial recognition. To address the limitations of traditional online teaching, which lacks real-time observation and analysis of students’ learning states, the study constructed a model for recognizing students’ classroom behavior using DSC and LeNet-5 networks.
III.INTEGRATION OF DSC AND LeNet-5 MODEL
This research aims to investigate the recognition of online classroom behavior for music major students based on DSC and the LeNet-5 model. Analyzing sensor data generated by students during class, the study proposes an approach that combines DSC and the LeNet-5 model to accurately identify students’ classroom behavior.
A.DATA COLLECTION AND PREPROCESSING
To bring online education closer to traditional offline classroom education, there is a growing awareness of understanding user states and thoughts during online education to achieve maximum teaching efficiency [18–20]. The study uses timed captures of students’ classroom images from online learning videos, preprocesses them, and then employs the recognition model to identify students’ learning states. Teachers, based on the obtained emotional states of students, integrate this information with the learning behaviors recorded by teachers in the classroom, as well as subsequent exams, answering questions, etc. This comprehensive approach provides a holistic understanding of students’ learning conditions, as depicted in Fig. 1 based on the evaluation of students’ on-class learning conditions using multiple sources of information.
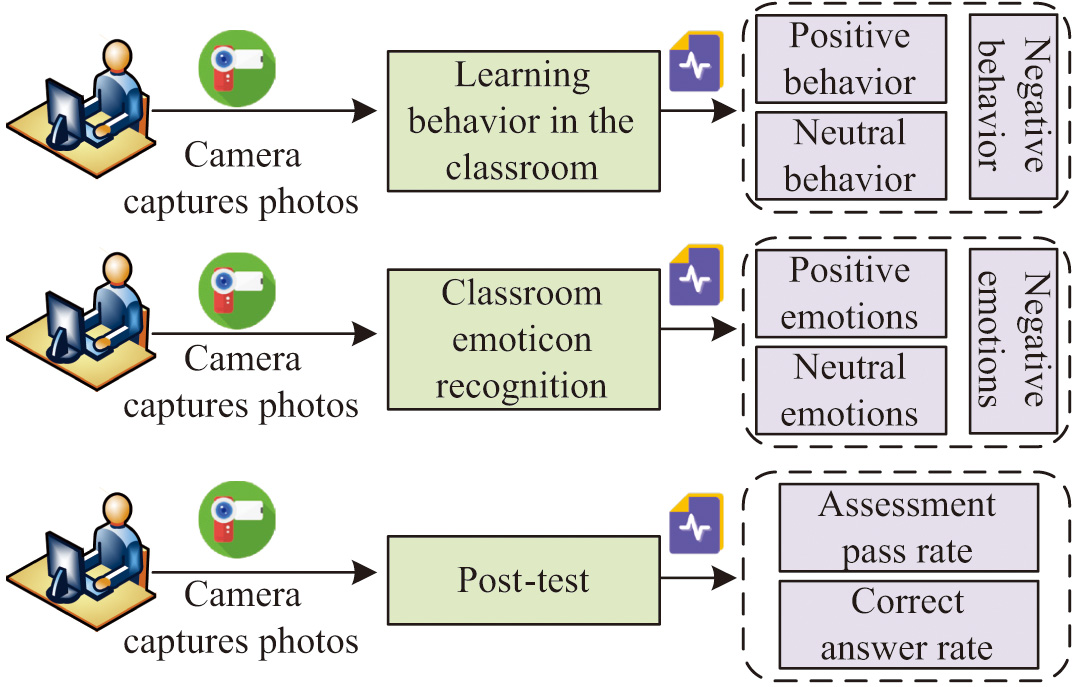 Fig. 1. Evaluation of students’ class learning status based on multisource information.
During the training of the model, data from the PubFig Dataset of Columbia University’s Biometric Facial Database were used as both the training and test sets. In the process of model training, the cross-entropy loss function is taken as the optimization objective, and the random gradient descent (SGD) algorithm is used to update the parameters. In order to accelerate the training process and prevent overfitting, the study also used learning rate decay and early stop methods in the training process. After many experiments, the hyperparameter configuration of the model was finally determined: the batch size was 32, the learning rate was 0.001, the number of iterations was 50, and the data enhancement methods were random clipping, rotation, and flipping. In order to evaluate the performance of the model, the dataset was divided into a training set, a validation set, and a test set in a 7:1:2 ratio. The training set is used to train the model, the validation set is used to adjust hyperparameters and early stop methods, and the test set is used to evaluate the final performance of the model. A total of 1584 images were obtained after filtering out inappropriate angles, excessively dark images, and other undesirable data. To ensure training accuracy, preprocessing of the model was performed before using the image data for training. In the application of neural network models, data preprocessing refers to the process of cleaning, transforming, and normalizing data before feeding it into the neural network. The goal of this stage is to make the raw data more suitable for the training of neural network models, thereby improving the model’s performance and generalization capability. Data preprocessing typically includes the following steps. Data preprocessing is a crucial step in the application of neural network models, directly impacting the performance and training effectiveness of the model. Reasonable and effective data preprocessing can provide more valuable input for neural networks, enhancing the practicality and applicability of the model. The dataset often presented issues of inconsistent brightness and contrast in images due to variations in the collecting device models, camera parameter settings, and shooting environments. To address this, color correction was applied to the images to eliminate interference from other factors before inputting them into the model. The color correction formula used in the research is represented by equation (1).
In equation (1), is the convolution operation, are three constants, is the pixel coordinate, is the corrected pixel, is the variance of the filter, and is the Gaussian filter. To enhance the model’s classification generalization and discriminative ability, all image data underwent both vertical and horizontal flipping. Flipping up and down can increase the rotation invariance of the model, making it less sensitive to the up and down directions of the face. This is very important for practical applications, as in actual shooting, the up and down directions of the face may change due to device angles or slight movements of the user’s head. By flipping up and down for enhanced processing, the model can better adapt to these changes, thereby improving the accuracy of classification. Flipping left and right can increase the mirror invariance of the model. Make the model less sensitive to the left and right directions of the face. To maintain a consistent input size for the model, the research normalized the sizes of different facial expression images, including scaling and rotation. The transformation involved mapping pixel coordinates from the input image to the transformed image, followed by interpolation using a cubic interpolation algorithm, as illustrated in Fig. 2.
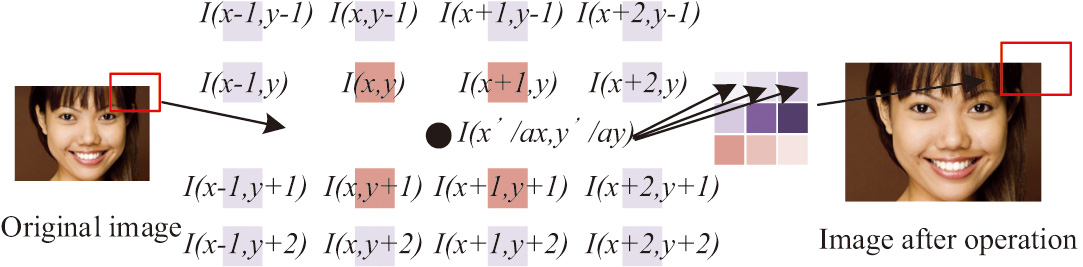 Fig. 2. Principles of the tertiary interpolation method.
The arrow in Fig. 2 refers to the use of the middle equation to calculate the pixel at the position indicated by the frame line of the image and obtain the new pixel value after calculation. Additionally, to address issues of uneven lighting and significant differences in image contrast, all input images underwent grayscale normalization. The research employed grayscale histogram processing, as described by equation (2).
In equation (2), represents the equalized grayscale image, is the pre-mean image, and are the width and height of the image, and are the variances before and after image equalization, and are the means before and after image equalization. In the process of emotion recognition, there are potential biases caused by cultural and personal differences. For this purpose, the study selected a sample of students from different cultures, ages, genders, and social backgrounds. Through this approach, our model can better learn and understand the emotional expressions of different individuals, thereby reducing bias toward specific groups or individuals. In addition, the study first pretrained models on larger datasets and then fine tuned them on specific datasets and help the model learn more general features, thereby reducing dependence on specific emotional expressions.
B.INTEGRATION OF DSC AND LeNet-5 FOR FACIAL EXPRESSION RECOGNITION
In the task of class state recognition, how to select the most important feature from many features into the model is the key to improve the recognition accuracy. The study combines DSC with the classical LeNet-5 model to extract the most efficient features for class state recognition. First, multilayer convolution operation is performed on the input image by depth-separable convolution to extract the multilayer features of the image. Then, the extracted features are input into the LeNet-5 model for training and classification. LeNet-5 network has a very high recognition rate of handwritten digital images. Compared with current deep convolutional neural networks, LeNet-5 network has fewer layers, fewer parameters, and less computation. Therefore, the LeNet-5 model is used to identify students’ learning state in class. LeNet-5 employs a combination of convolutional and pooling layers to effectively extract local features. It uses the backpropagation algorithm for training, enabling model parameter learning and optimization through extensive sample data. The design of LeNet-5’s convolution operation and parameter sharing reduces the number of parameters and computational complexity. The specific structure of the LeNet-5 network model is illustrated in Fig. 3.
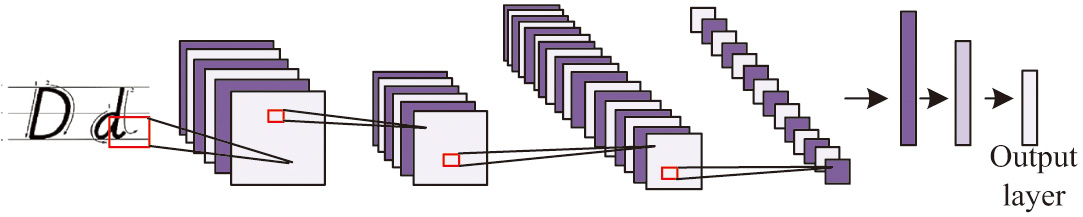 Fig. 3. Network structure of LeNet-5.
The traditional LeNet-5 network faces challenges in accurately recognizing and robustly handling facial images due to the complexity and diversity of such images. In order to address this issue, a study combined DSC with the LeNet-5 network, proposing a new network architecture to enhance the recognition performance of facial images. LeNet-5 network architecture shows excellent performance in image recognition tasks. However, for more complex and diverse facial images, LeNet-5’s performance may be limited. The traditional convolution operation is decomposed into two steps, deep convolution and point-by-point convolution, which significantly reduces the number of parameters and computational complexity of the model without sacrificing performance. Therefore, combining DSC with LeNet-5 can not only take advantage of LeNet-5’s advantages in image recognition but also take advantage of DSC’s powerful feature extraction ability in processing complex images.
DSC is a special convolutional operation that divides the convolution into two steps: first, performing depthwise convolution and then pointwise convolution. This convolutional approach is more effective in extracting features from facial images with rich textures and color variations while reducing computational complexity and model size [21,22]. The study applied DSC to the convolutional layers of the LeNet-5 network, replacing the original convolutional layers. The design rationale of DSC involves using a depthwise convolutional kernel to convolve the input image to extract local features, followed by using a pointwise convolutional kernel to convolve the feature map obtained from the depthwise convolution to achieve global feature interaction. This design ensures high-quality feature extraction while reducing the computational and parameter complexity of the model. The comparison between DSC and traditional convolution, as well as its structure, is illustrated in Fig. 4.
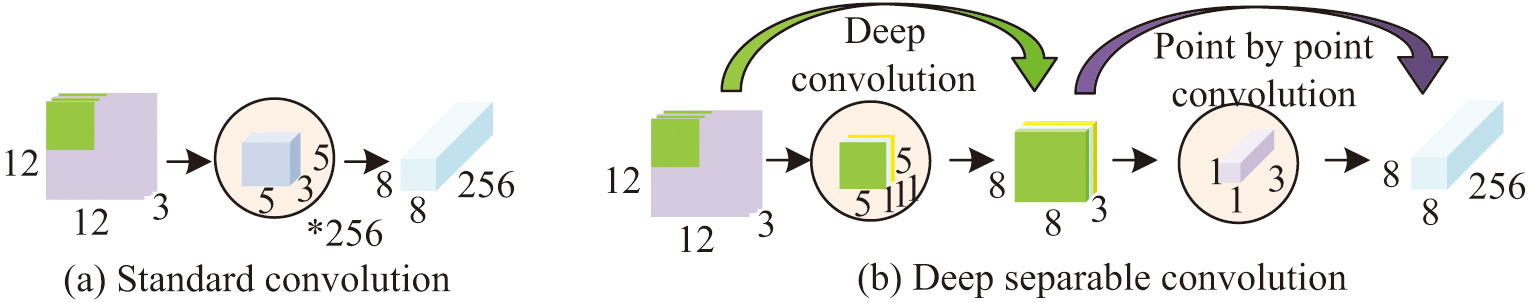 Fig. 4. DSC versus traditional convolution and its structure.
The proposed model builds upon the traditional LeNet-5 model with three convolutional layers and pooling layers, as well as a fully connected layer and an output layer. To address the gradient explosion problem and enhance the model’s resistance to overfitting, the study added batch normalization (BN) layers after each convolutional structure. During training, the Adam optimizer was employed for optimization. The BN algorithm is defined by equation (3).
In equation (3), is the mean of the first batch of training data, is the training data, and is the standard deviation of each batch of training data. The study utilized the BN algorithm to normalize the data for each layer, ensuring that each batch of data has the same distribution during the neural network training process. During the training process, BN introduces a certain amount of noise, which is equivalent to slightly perturbing the model, so that the model does not overly rely on specific patterns in the training data, thereby improving the model’s generalization ability. In deep neural networks, due to the multiplication effect, gradients may become very large during backpropagation, leading to gradient explosion. BN maintains the gradient of each layer within a relatively stable range through normalization operation, thus avoiding the problem of gradient explosion. Additionally, the study introduced transformation reconstruction, incorporating scientific parameters into the BN layer as shown in equation (4).
In equation (4), and are learnable parameters. Furthermore, the research adopted a lightweight attention mechanism to further improve the model’s recognition performance.
The attention module of the selected attention mechanism in the convolutional pooling process solves the problem of ignored feature map information due to different proportions of information by reasonably allocating weights between different channels. This not only involves fewer parameters but also improves the performance of the convolutional neural network. The original input feature map is globally average pooled to obtain all features, and then features with channel attention are obtained through fast one-dimensional convolution. Then, the sigmold function is used to obtain the weights of different channels, and the initial input features are multiplied by the channel weights to obtain features with channel attention. Therefore, this module has stronger performance in extracting effective data [23–25]. This mechanism introduces an attention module after DSC, allowing the model to adaptively focus on key regions of the input image, thereby more effectively extracting features from facial images. In summary, the study integrated DSC, the LeNet-5 network, and a lightweight attention mechanism to propose a novel network architecture aimed at enhancing the recognition performance of facial images.
C.MULTIDIMENSIONAL DATA FUSION IN THE STUDENT CLASSROOM PROCESS
In practical applications, the study utilizes real-time monitoring through the use of camera devices on online learning platforms to monitor and identify the learning status of each student during class. The research develops a student in-class status recognition model based on an improved LeNet-5 network and data fusion, as shown in Fig. 5.
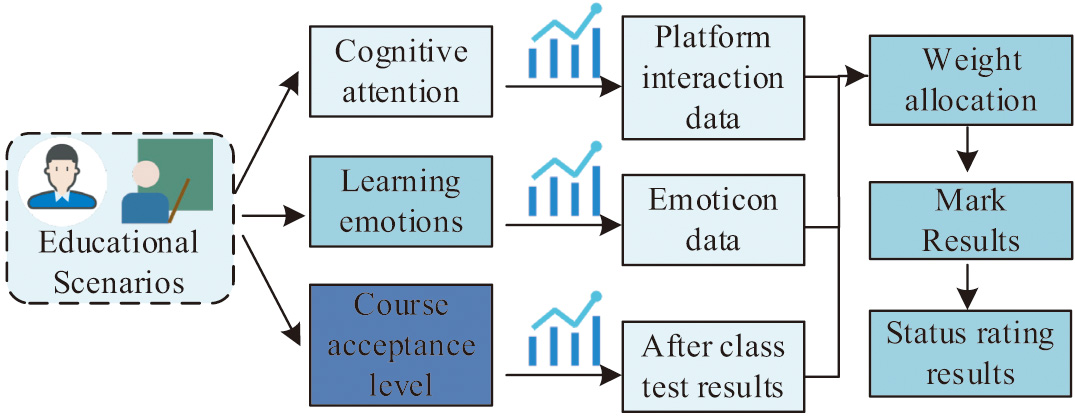 Fig. 5. A class status identification model based on the improved LeNet-5 network and data fusion.
Firstly, facial expression data of students are analyzed using deep learning networks to calculate emotional scores, evaluating the students’ learning status based on captured facial images. Additionally, the study analyzes students’ behavioral performance to understand their participation, interaction, and attentiveness in class, assigning scores for classroom performance. Data collected during the learning process, such as online learning time, study duration, and learning efficiency, are used to assess students’ effort and engagement. Finally, exam scores and assignment results are collected to evaluate students’ learning outcomes and mastery. Due to the disparate scales of different data, the study normalizes the data using the nondimensionalization method, which refers to a process in data handling where, through a mathematical transformation method, the numerical values of the data are constrained within a specific range or transformed into dimensionless pure numerical values using certain rules. This process ensures comparability among different variables by eliminating dimensional influences in the data, ensuring relatively consistent weights among different features when inputting into a model. Nondimensionalization methods assist in enhancing the convergence speed of models, preventing certain features from exerting excessive influence on the model, and ensuring a more balanced distribution of weights among different features during optimization. Each data source has its own unique perspective and information, and simply blending them together can result in missing some important details and features. To this end, the study uses data preprocessing and cleaning techniques to eliminate biases and inconsistencies between different data sources. The stability and reliability of data fusion results were evaluated through cross-validation and sensitivity analysis, and gradual adjustments were made to avoid homogenization effects [26-28]. In machine learning algorithms such as neural network models, nondimensionalization is commonly employed during the data preprocessing stage to optimize the model’s performance. The calculation of the method is displayed in equation (5).
In equation (5), and represent the number of attributes in the indicator data and the number of students included in the data, respectively. is the original input data, and are the maximum and minimum values in indicator , and is the processed data. When constructing a student in-class status recognition model with multiple data sources, cognitive attention, learning emotions, and course acceptance have varying impacts on the final recognition result. For the three types of information data collected in the research, the method of decision fusion is used to fuse the information of different dimensions. First, different classifier data are used for classification, and then the label values output by different classifiers are scored and weighted. Then SVM was used to classify the obtained multidimensional data. After classification, different data with different characteristics are studied, and dimensionless processing is carried out to normalize all data numbers for easy analysis. Then, the analytic hierarchy process and entropy method are used to solve the weight distribution problem. The principles of analytic hierarchy process and entropy method are shown in Fig. 6.
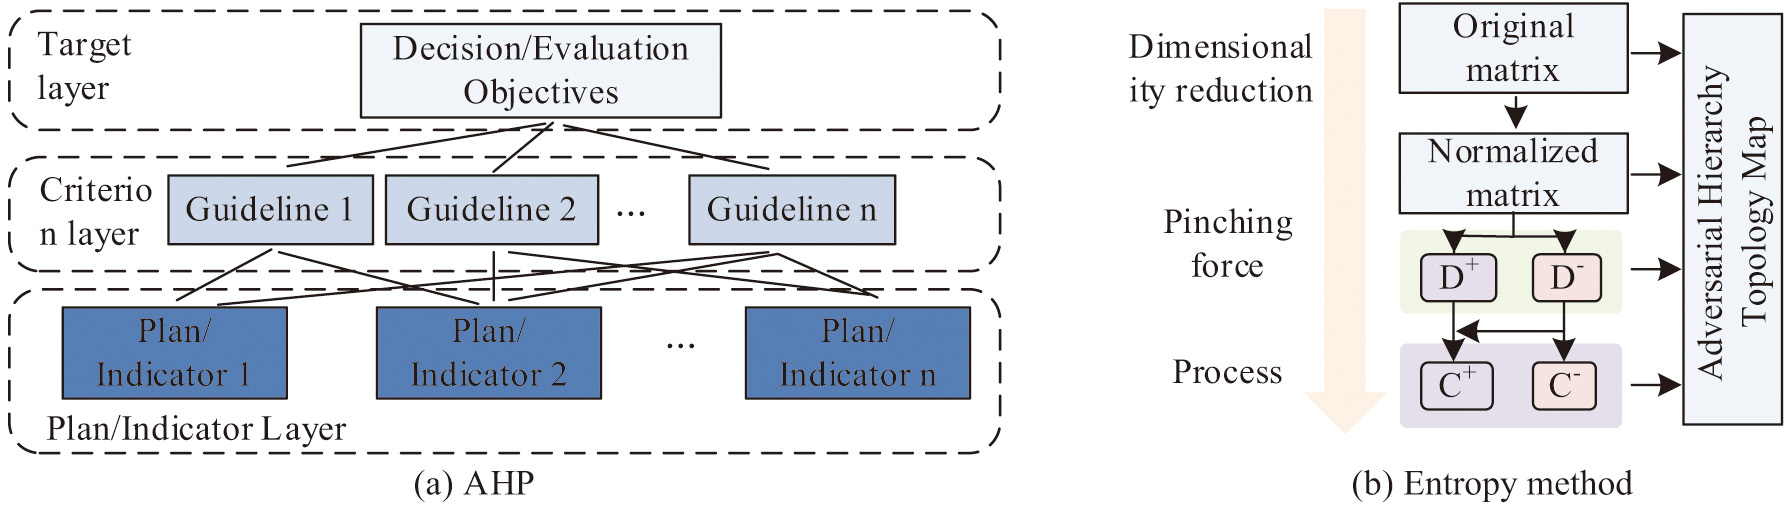 Fig. 6. Principles of the hierarchical analysis method and the entropy method.
As shown in Fig. 6, AHP is a subjective evaluation method to build a hierarchical model based on the experience and expertise of decision makers. In this method, the complex problem is decomposed into several levels and factors, and the relative importance of each factor is determined by pairwise comparison. The core of AHP is to establish a judgment matrix and get the weight of each factor by calculating the eigenvector and the maximum eigenvalue of the matrix. The entropy method is based on the characteristics of the data itself, and it determines the weight of each factor by calculating the entropy and information utility value of the data. In order to synthesize the advantages of the two methods, the subjective and objective comprehensive weighting method is used to determine the weight of each data type. By integrating the above data sources, the study gains a more comprehensive understanding of students’ learning status and performance, providing more accurate teaching feedback and guidance for teachers and students. Based on the predictions of the LeNet-5 model, the study classifies and scores students’ in-class statuses.
The LeNet-5 model is a relatively simple CNN with relatively low computational complexity [29,30]. However, when the model is improved to accommodate new tasks, more layers may be added or certain parameters may be adjusted, which may increase the computational complexity. In this study, the data to be processed include students’ facial expression, behavior performance and academic performance, and the amount of data is large. Therefore, the training and reasoning process of the model can be relatively complex. In order to improve the performance of the model, a series of data preprocessing steps are carried out, which themselves will increase the computational complexity. In view of this, the study can reduce the computational complexity while ensuring the performance of the model by adjusting the parameters such as the number of layers, the size of the convolution kernel, and the step size. In addition, data compression technology is used to reduce the size and dimension of input data, so as to reduce the computational complexity of the model.
IV.PERFORMANCE ANALYSIS OF RECOGNITION MODEL
With the emergence of online integrated education, recognizing students’ learning statuses becomes a focal point of research. The study constructs an in-class status recognition model. To validate the effectiveness and reliability of the proposed music major student in-class status recognition model, the research conducts the following experiments and analyses.
A.PERFORMANCE ANALYSIS OF THE MODEL
To validate the effectiveness and performance of the proposed classroom state recognition model, this study employed evaluation metrics such as accuracy, recall, F1 score, and others to assess the recognition performance of the model during the class sessions of music major students. Additionally, the study compared the impact of different network structures, data fusion methods, and weight allocation methods on the model’s performance. To examine the improvement of the LeNet-5 network, the study trained both the traditional LeNet-5, the LeNet-5 with fused DSC, and a traditional CNN simultaneously, recording the training results in Fig. 7.
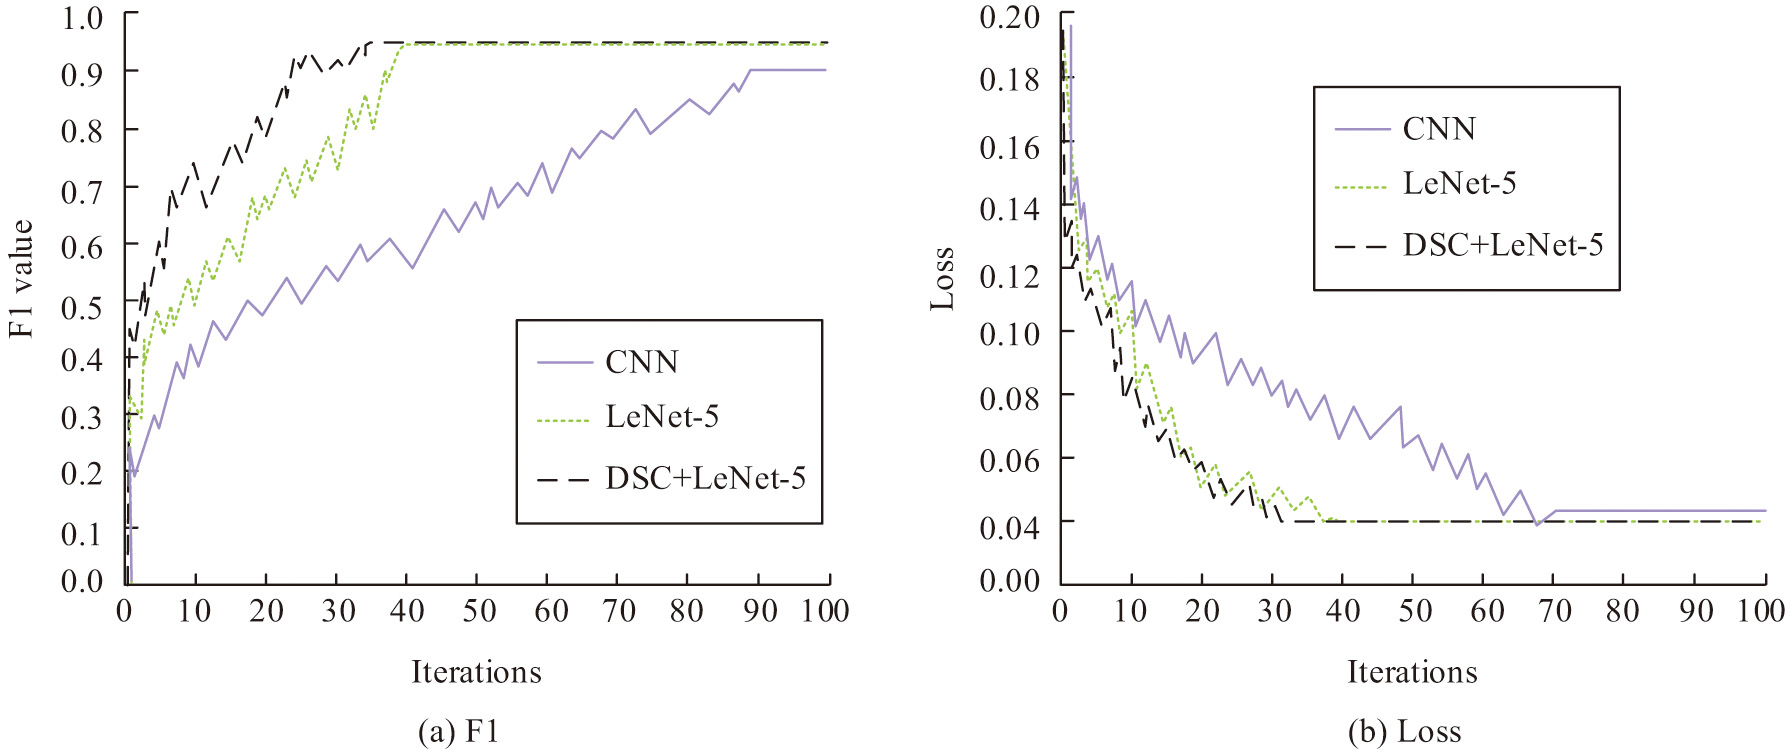 Fig. 7. Comparison of the training situation of the three network structures.
As shown in Fig. 7(a), the CNN model required 89 training iterations to achieve satisfactory recognition performance, while the traditional LeNet-5 achieved high recognition accuracy after 38 iterations. The LeNet-5 network with fused DSC achieved desirable metrics after only 35 iterations. Fig. 7(b) indicates that the LeNet-5 network with fused DSC stabilized after 31 iterations, while the traditional LeNet-5 stabilized after 39 iterations. This suggests that the improved LeNet-5 network has better convergence. To evaluate the emotion recognition performance of the designed algorithm, the study utilized both the original and improved versions of the LeNet-5 network to recognize emotions in test data, as depicted in Fig. 8.
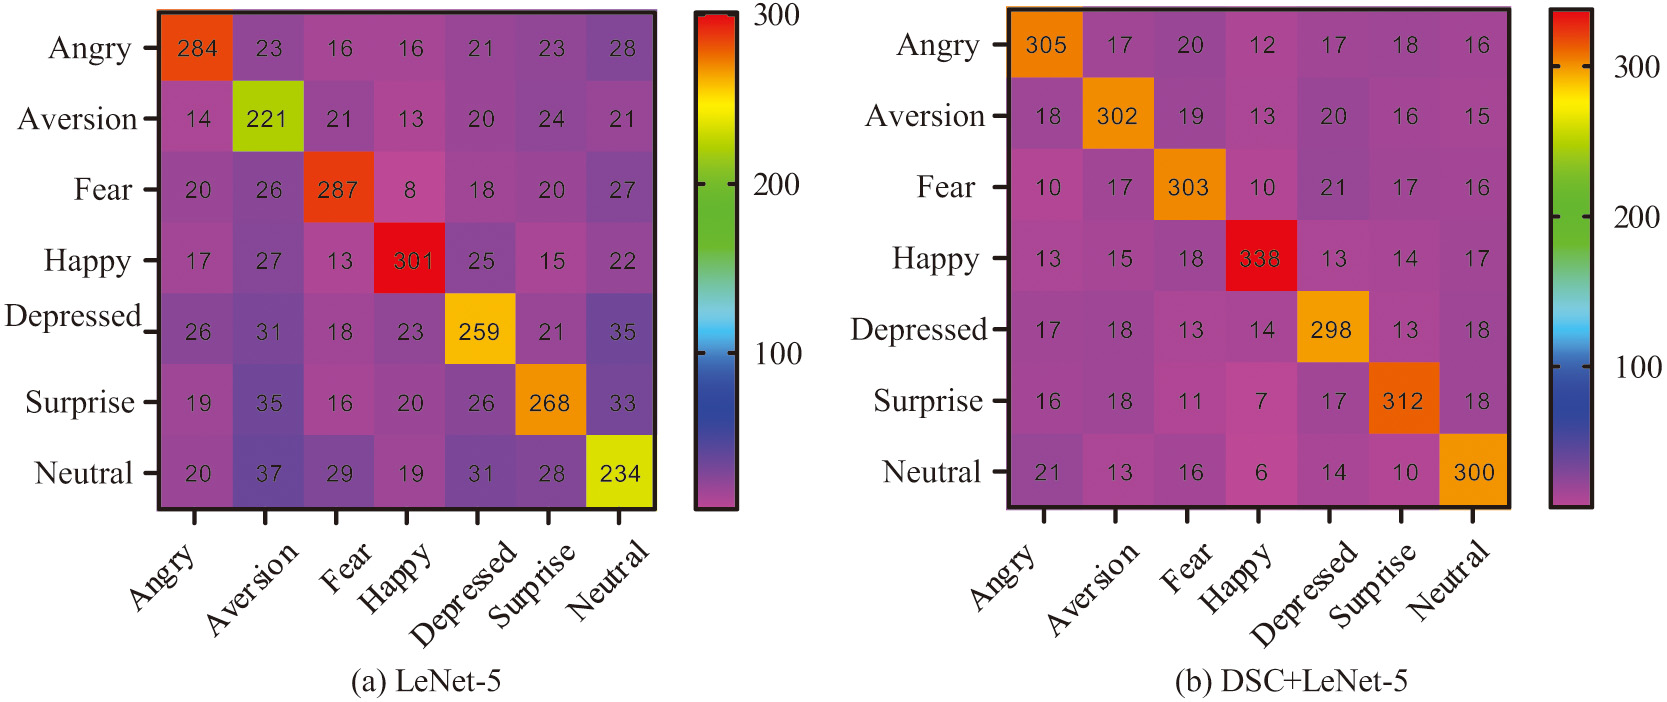 Fig. 8. Comparison of emotion recognition effects of LeNet-5 networks before and after improvement.
As seen in Fig. 8(a), the original network achieved a prediction accuracy of 72.86%, whereas the improved network achieved an accuracy of 84.96%, showing higher accuracy across most emotion labels. Both models exhibited good prediction accuracy for the “happy” label, suggesting that features of happy faces are more distinct than other emotions. For the remaining emotions, the improved network consistently outperformed the original model. To further validate the performance of the designed emotion recognition model (Model 1), the study compared it with several advanced models from existing research, including a multitask deep learning-based facial emotion recognition model (Model 2), a CNN and long short-term memory network-based emotion recognition model (Model 3), and a lightweight recursive residual neural network-based emotion recognition model (Model 4). Recognition accuracy and errors under different data conditions are presented in Fig. 9.
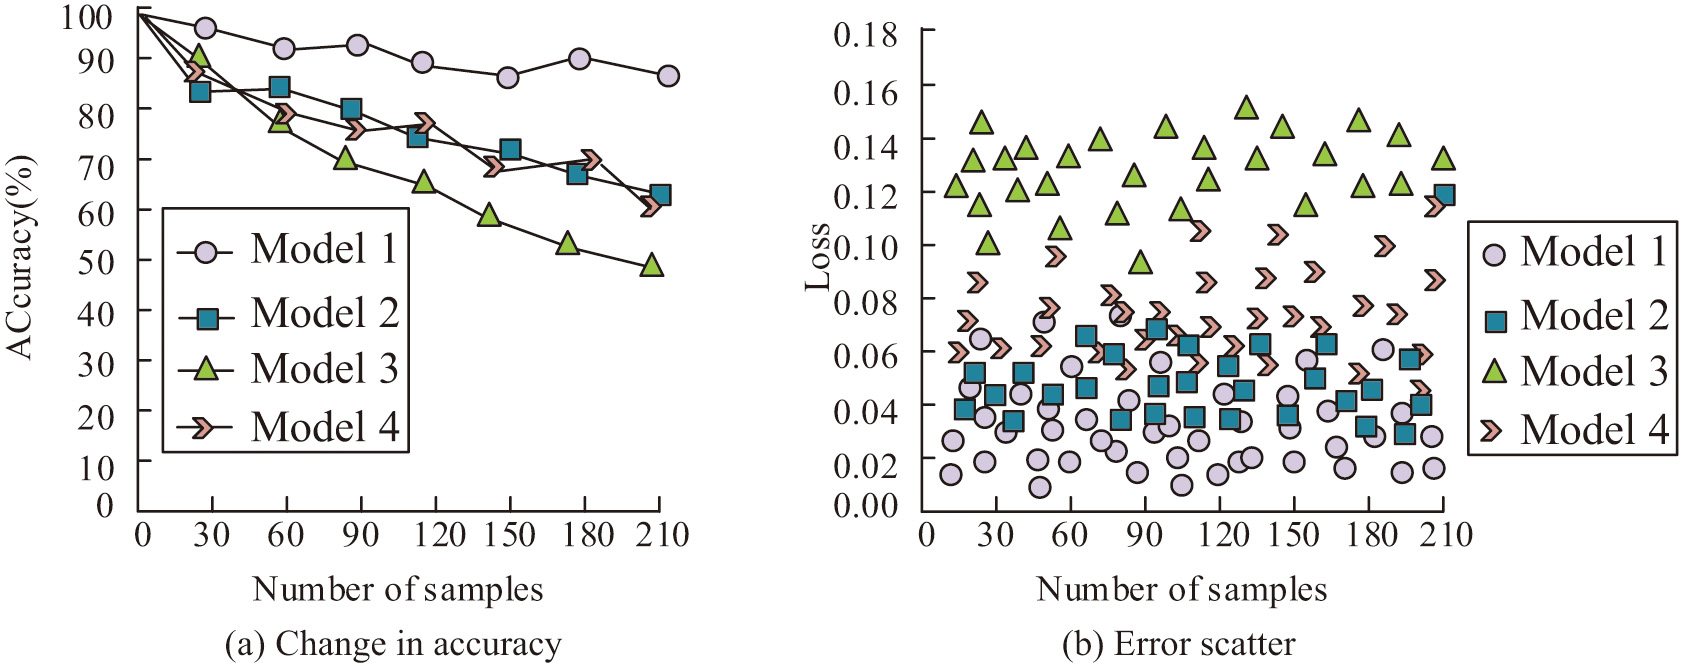 Fig. 9. Identification accuracy and error of the model under different data quantities.
According to Fig. 9(a), it can be observed that as the testing data increases, the testing accuracy of several models gradually decreases. Model 1 exhibits the smallest decline in accuracy. Specifically, the average recognition accuracy of Model 1 is 92.84%, while Model 2 has an average recognition accuracy of 89.47%, Model 3 with 85.34%, and Model 4 with 88.43%. Figure 9(b) indicates that the error range of Model 1 is significantly lower than the other three models, primarily fluctuating between 0.02 and 0.06. To further compare the performance of the models, an experiment records the F1 value, recall value, recognition accuracy, and recognition time indicators for the four models. The specific results are presented in Table I.
Table I. Comparison results of performance indicators for several models
| Project | Test 1 | Test 2 | ||||||
|---|---|---|---|---|---|---|---|---|
| F1 | Recall | Accuracy (%) | Time (s) | F1 | Recall | Accuracy (%) | Time (s) | |
| Model 1 | 0.97 | 0.90 | 93.84 | 2.08 | 0.95 | 0.94 | 94.40 | 2.12 |
| Model 2 | 0.88 | 0.81 | 89.48 | 3.99 | 0.90 | 0.83 | 88.79 | 3.89 |
| Model 3 | 0.85 | 0.76 | 83.37 | 4.28 | 0.85 | 0.78 | 84.18 | 4.31 |
| Model 4 | 0.87 | 0.80 | 88.52 | 3.89 | 0.89 | 0.82 | 88.37 | 3.90 |
From Table I, it is evident that the average values for the four metrics of Model 1 are 0.96, 0.92, 94.12%, and 2.10 seconds, respectively. Compared to Model 1, the other three models show a decrease of 0.08, 0.10, 4.85% and an increase of 1.86 seconds, respectively. Model 1 also outperforms the other two models significantly. Therefore, Model 1 demonstrates superior emotion recognition capabilities, enabling efficient and accurate identification of students’ class participation.
B.ANALYSIS OF MODEL APPLICATION EFFECT
The study evaluates the application of the proposed emotion recognition method for assessing students’ class participation. Emotion states during class are recorded on a scale of 0–1. To assess the practical application of the designed models, the study uses a camera to capture images of students in two sessions of professional-creative fusion classes, conducting emotion recognition analysis. The results are shown in Fig. 10.
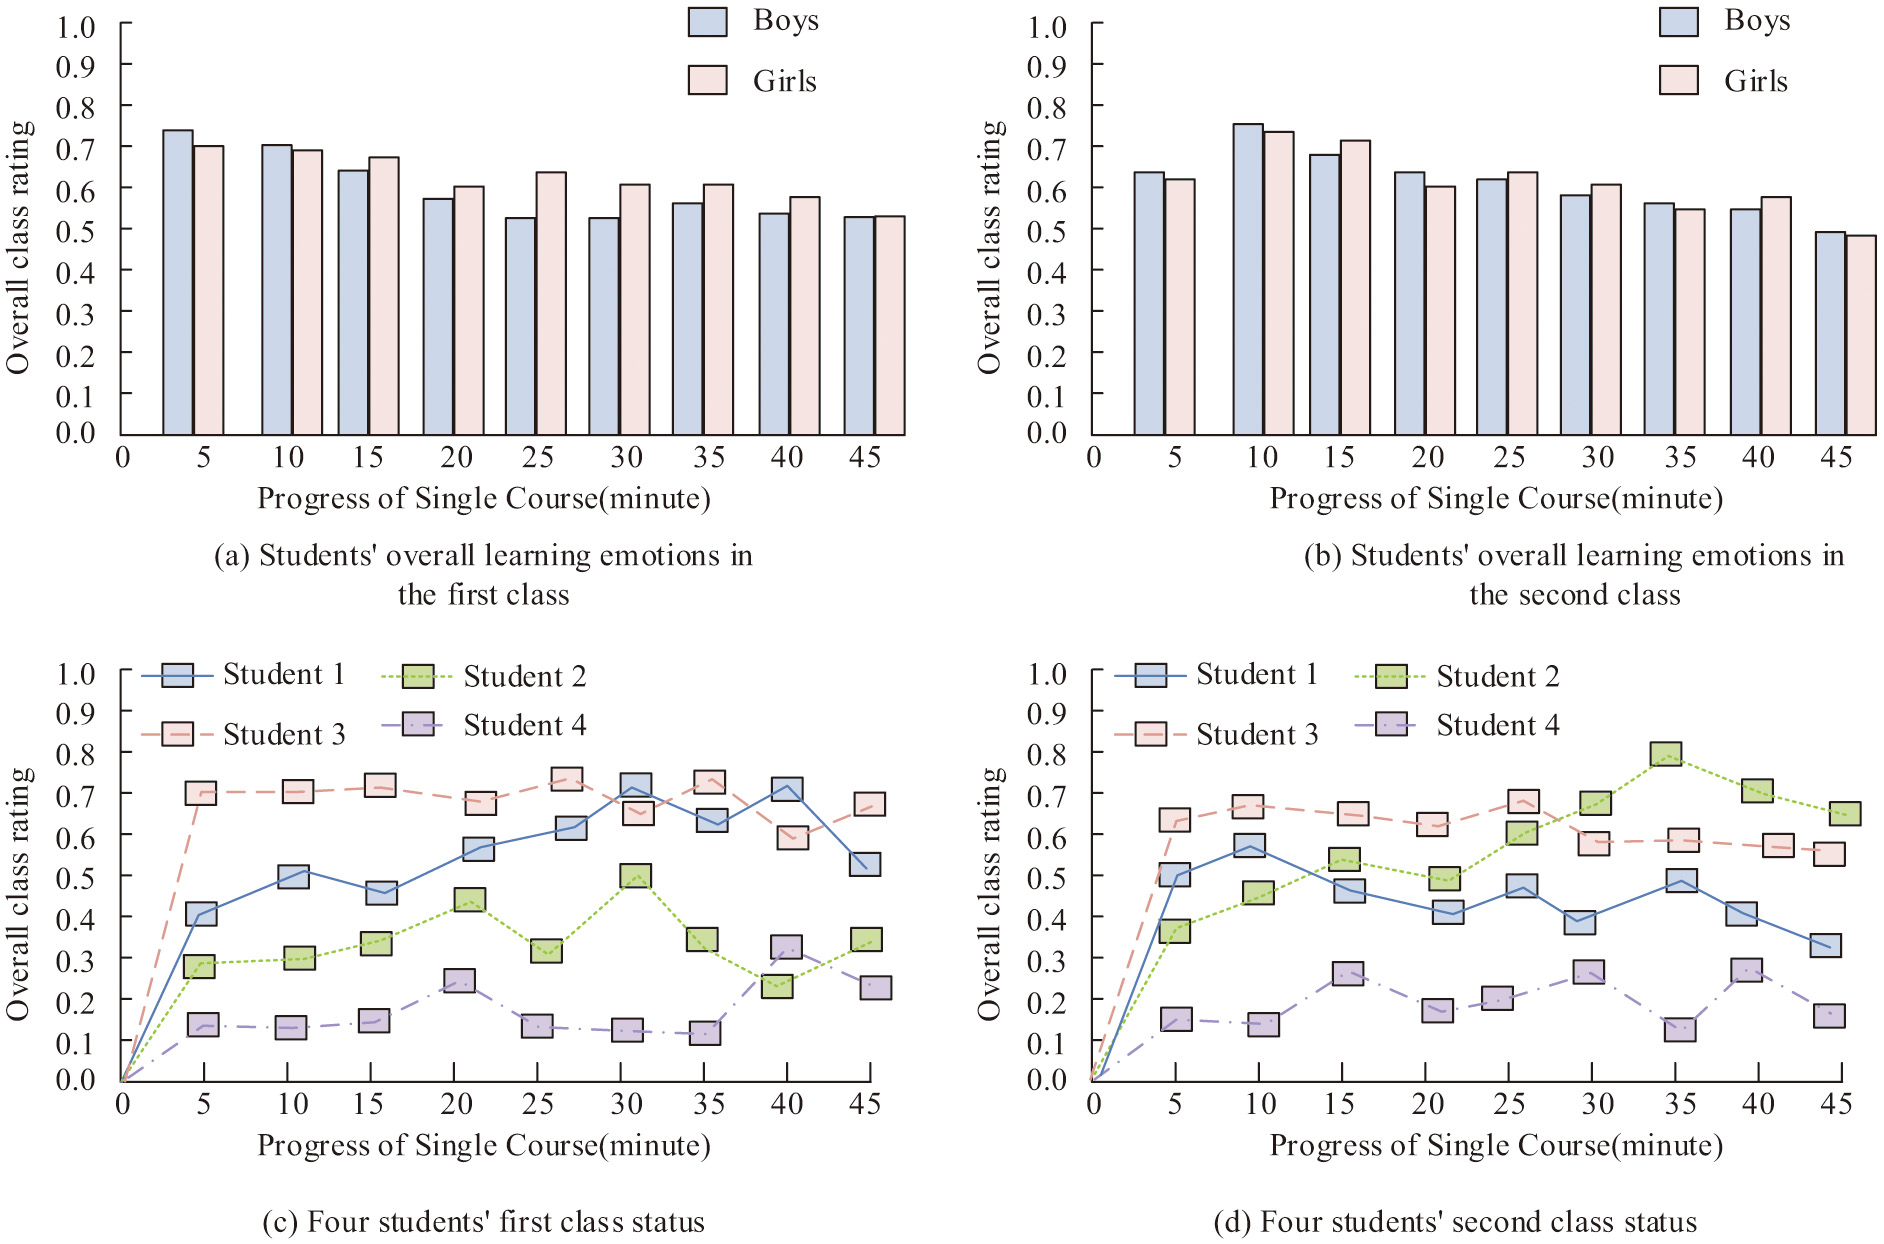 Fig. 10. Learning status results in the student class based on emotion recognition.
From Fig. 10(a) and Fig. 10(b), it is evident that at the beginning of the class, over 80% of the students are highly focused. However, after approximately 20 minutes into the class, most students exhibit varying degrees of changes in their learning states, indicating a decline. Nevertheless, overall, many students maintain a good learning state throughout the class duration. As shown in Fig. 10(c) and Fig. 10(d), the learning states of four individual students vary, providing an intuitive display. Teachers can analyze students’ learning situations post-class and adjust their teaching accordingly. After fusing data from multiple sources and applying the model, a comprehensive evaluation of students’ learning is obtained. To test the application effect of the model, the study applies it to a professional-creative fusion class in University A’s music department. The students’ learning conditions are evaluated over a week, and teachers adjust their courses based on the evaluation results. The study continues to assess learning in the second week, and the results are compared, as shown in Table II.
Table II. Results of students’ learning status evaluation within two weeks
| Student serial number | Last week | Next week | ||||||
|---|---|---|---|---|---|---|---|---|
| Cognitive attention | Learning emotions | Course acceptance | Comprehensive score | Cognitive attention | Learning emotions | Course acceptance | Comprehensive score | |
| 1 | 0.745 | 0.684 | 0.721 | 0.718 | 0.744 | 0.743 | 0.721 | 0.758 |
| 2 | 0.571 | 0.612 | 0.668 | 0.628 | 0.762 | 0.761 | 0.728 | 0.719 |
| 3 | 0.608 | 0.634 | 0.607 | 0.647 | 0.697 | 0.721 | 0.732 | 0.708 |
| 4 | 0.761 | 0.700 | 0.694 | 0.704 | 0.789 | 0.797 | 0.764 | 0.792 |
| 5 | 0.384 | 0.363 | 0.389 | 0.400 | 0.617 | 0.601 | 0.632 | 0.625 |
| 6 | 0.421 | 0.487 | 0.438 | 0.425 | 0.714 | 0.687 | 0.696 | 0.694 |
| 7 | 0.783 | 0.788 | 0.814 | 0.804 | 0.815 | 0.803 | 0.824 | 0.811 |
| 8 | 0.328 | 0.322 | 0.365 | 0.361 | 0.584 | 0.601 | 0.630 | 0.601 |
| 9 | 0.774 | 0.694 | 0.764 | 0.768 | 0.844 | 0.832 | 0.810 | 0.823 |
| 10 | 0.218 | 0.384 | 0.365 | 0.366 | 0.588 | 0.607 | 0.624 | 0.608 |
According to Table II, it can be observed that, in the first week, the learning states of students 1, 4, 7, and 9 were better compared to the other six students. Among them, student 4 had the highest learning state score. Students 2 and 3 had a moderate learning state. In contrast, students 5, 6, 8, and 9 had poorer learning states. After targeted instructional corrections based on teaching evaluations by the teacher, in the second week, students with initially good learning states maintained high performance. Meanwhile, students with initially moderate or poor learning states showed some improvement.
To further test the performance of the student classroom state recognition method (Method 1) based on the fusion of emotion recognition data and classroom data designed for research, this study compares it in detail with existing methods for identifying student classroom states. The comparison methods include the single emotion-based recognition method in reference [31] (method 2), the behavioral analysis method in reference [32] (method 3), the physiological signal-based method in reference [33] (method 4), and the speech recognition method in reference [34] (method 5). grade of the school. The comparison results of the test are shown in Table III, where the real-time performance index is obtained by corresponding class student and teacher ratings, with a maximum score of 5 points. The higher the score, the better the real-time performance.
Table III. Comparison of student classroom state recognition methods
| Project | Identification accuracy of (%) | Real time | Data sources |
|---|---|---|---|
| Method 1 | 95.48 | 4.3 | Class images and behavioral data of students after class |
| Method 2 | 91.14 | 4.2 | Classroom images |
| Method 3 | 88.45 | 3.8 | Classroom video |
| Method 4 | 89.47 | 3.2 | Student physiological data |
| Method 5 | 81.32 | 3.8 | Classroom voice data |
As can be seen from Table III, Method 4 based on students’ physiological signals has the worst real-time performance because the collection, processing, and analysis of physiological signals require a lot of time. The recognition accuracy of method 5 is too low because the information contained in speech is limited, and the actual classroom state of students cannot be judged by speech. Methods 2 and 3 have high recognition accuracy and high real-time performance in emotion recognition. Based on method 2, Method 1 of the research design adds students’ extracurricular test data and classroom behavior data, which further improves the accuracy of classroom status recognition while ensuring real-time performance.
To further evaluate the generality and reliability of the proposed fusion method in different educational settings, experiments were conducted through external validation from independent sources. In external validation, the research team selected schools with different educational backgrounds and environments for testing and collected classroom data in different classroom settings. Subsequently, these data are analyzed and processed by applying the method of research design 1 to identify the classroom status of students. In order to ensure the fairness and accuracy of the experiment, the research team invited educational experts and external evaluation institutions to independently evaluate the experimental results. The evaluation focuses on the accuracy, timeliness, and applicability of identification methods in different educational contexts. The real-time performance scoring standard is consistent with Table III, and the suitability index adopts the percentage system. The higher the score, the higher the applicability. The experimental results are shown in Table IV.
Table IV. External validation of the independent sources
| Project | Identification accuracy of (%) | Real-time | Applicability |
|---|---|---|---|
| School 1 | 92.57 | 4.0 | 98.45 |
| School 2 | 92.89 | 4.3 | 95.64 |
| School 3 | 95.87 | 4.7 | 95.01 |
| School 4 | 94.16 | 4.1 | 96.23 |
| School 5 | 93.28 | 4.2 | 95.43 |
According to Table IV, although there are differences in classroom behavior, emotional expression, and other aspects among students from different educational backgrounds, Method 1 designed in the study can still maintain high recognition accuracy and real-time performance in most cases. This indicates that the method has strong generalizability and reliability and can be applied to student classroom state recognition in different educational environments.
When selecting a deep learning model, it is necessary to consider the performance of the model, the requirement of computing resources, and the specific application scenario. Despite the existence of many advanced CNN models, such as VGG and ResNet, and despite the relatively simple structure compared to modern CNN models, LeNet-5 still performs well in many tasks, especially when dealing with image recognition problems. The design of LeNet-5 takes into account the limitations of computing resources, enabling it to achieve efficient training and reasoning with limited computing resources. VGG and ResNet may have stronger feature extraction capabilities, but considering the actual classroom environment, students’ image data may be affected by various factors such as illumination, angle, and occlusion. LeNet-5's concise structure makes it show better robustness in processing these complex factors. In order to verify the rationality of LeNet-5, LetNet-5, VGG16, and ResNet50 were trained and tested in the same dataset. The test results are shown in Table V.
Table V. Comparison of different CNN models for student classroom state recognition
| Model | Identification accuracy (%) | Real-time (score) | Performance period (s) |
|---|---|---|---|
| LeNet-5 | 95.48 | 4.3 | 1.47 |
| VGG16 | 96.12 | 3.8 | 4.85 |
| ResNet50 | 96.15 | 3.4 | 6.98 |
As can be seen from Table V, the difference in recognition accuracy of the three algorithms is not large, and VGG16 and ResNet50 have only a slight advantage over LetNet-5. However, in terms of real-time performance and computing time, LeNet-5 shows obvious advantages. The longer the calculation time, the higher the complexity of the model. Therefore, considering the performance of the model and the demand for computing resources, LeNet-5 is the most appropriate choice.
V.CONCLUSIONS
Despite the advantages of online education, such as being unrestricted by time and location, it gradually becomes a new form of education. However, it lacks the personalized teaching found in traditional classrooms. To address this, the study proposed a new method for student emotion recognition using LeNet-5 and DSC, along with the construction of a multisource data fusion model for assessing and analyzing students’ in-class states. According to the experimental results, the following conclusions can be drawn:
- (1)Experimental results showed that the model achieved an average F1 value of 0.96, a recall rate of 0.92, an accuracy rate of 94.12%, and a recognition time of 2.10 seconds. The proposed method efficiently and accurately identifies students’ in-class states.
- (2)The LeNet-5 network with DSC convergence significantly improved with only 35 training iterations compared to the non-fused DSC LeNet-5 network.
- (3)Additionally, by fusing information from multiple sources, the study obtained a comprehensive evaluation of students’ learning, which was applied to a professional-creative fusion class in the A university. Evaluating the model’s application effect by comparing the two weeks of learning conditions revealed that, in the second week, students improved by over 4%, while poorly performing students improved by over 30%. This method effectively enhances students’ learning states, providing real-time feedback for teachers and helping them adjust teaching strategies to improve overall teaching quality.
Future research could integrate more practical teaching scenarios, explore more effective data fusion methods, and refine model application strategies to better promote students’ learning development. To further improve and expand the model, deeper network structures such as ResNet or VGG can be considered in future research to improve the accuracy of emotion recognition. In addition, it is possible to consider using GPUs or dedicated hardware accelerators to accelerate the inference process of the model.