I.INTRODUCTION
Faced with the globalized knowledge and rapidly changing technological environment of the economy, personalized innovation education for college students is particularly important [1]. The education sector urgently needs precise evaluation tools to measure and improve the effectiveness of teaching methods, especially when using cross project software tools [2]. The current evaluation system often lacks analysis of the deep-seated influencing factors of educational effectiveness. Therefore, it is difficult to fully reflect the subtle differences in personalized education and its specific promoting effect on innovation ability [3]. In this context, Google AI Knowledge Transfer (GAKT) emerged as an advanced technology transfer tool [4]. This method aims to enhance the adaptability and educational effectiveness of software tools in different academic projects through efficient knowledge transfer [5]. In traditional assessment assignments, due to the limitations of traditional methods, their performance in handling high-dimensional and complex educational data is extremely poor. In response to this issue, this study applies GAKT technology and adopts the K-nearest neighbors (KNN) algorithm combined with MeanShift clustering. The proposed method improves its feature selection ability, aiming to enhance its accuracy and availability in personalized innovation education evaluation. The integration of mixed attention modules bring new dimensions of improvement to supervised learning. It enhances not only the algorithm’s understanding of complex relationships in data but also enhances the model’s ability in learning and generalization. The innovation of this study lies in its improvement of traditional supervised learning through feature extraction reinforcement and the introduction of attention mechanisms. This method helps to reveal the differences in different educational activities, providing strong data support for educators to adjust teaching strategies and resource allocation in a targeted manner. The research is divided into four parts. The first part is a summary of the supervised learning and teaching evaluation fields. The second part is the implementation of the proposed project. The third part is the validation of the usability of the proposed project. The fourth part is a summary and outlook of the research.
II.RELATED WORKS
Supervised learning is a core branch of machine learning, whose basic idea is to train a model through known input–output pairs (i.e. labeled training data) so that the model can discover patterns and correlations between data [6,7]. Once trained, this model can be used to predict the output of new, unseen data. With the development of technology, supervised learning algorithms have been widely applied in various fields such as image recognition, speech recognition, natural language processing, and financial analysis. It has become one of the cornerstones in the fields of artificial intelligence and data science. Veluchamy S et al. proposed a multi-modal authentication model based on palm print and finger joints for the widespread application of biometric recognition systems in the field of security. This study demonstrated that the model combined HE-Co-HOG vectors with fractional firefly algorithm to optimize weights, achieving recognition accuracy of up to 95% and low acceptance and rejection rates of 0.1 through a hierarchical support vector machine classifier [8]. Dhivya A B et al. proposed a recognition algorithm based on tablet imprinting text to address the difficulty of tablet recognition. This study demonstrated that by combining support vector machine classification and obfuscation models with n-gram post-processing, the algorithm could accurately match tablets in the database. This greatly improved the recognition rate of tablets [9]. Wang J et al. proposed a hybrid model based on the Xin’anjiang model, wavelet analysis, and random forest method for daily runoff simulation. In the practical application at Shiquan Station in the upper reaches of the Han River, it showed that the Xin’anjiang Random Forest hybrid model outperformed the individual model in five performance indicators. Moreover, the fusion of wavelet analysis significantly improved simulation accuracy [10]. Cui W et al. proposed a radar-based random forest machine learning method for morphological classification of linear mesoscale convective systems in continuous states in the United States. This study demonstrated that the algorithm achieved automated high-precision classification, revealing its spatio-temporal variations and key environmental conditions [11]. Coronado Bl á zquez J proposed a machine learning algorithm based on spectral feature classification to address the issue of unknown identity sources in the Fermi LAT 4FGL-DR3 directory. This study demonstrated that the algorithm can achieve an accuracy of 99% in binary classification problems that only distinguish AGN/pulsars [12].
As the boost of globalization and knowledge economy, the quality of education directly affected national competitiveness and individual development. Teaching evaluation provided a scientific basis for improving educational level. The diversity of individual differences and learner needs required education to be more personalized and differentiated. Furthermore, evaluation can help teachers understand the unique needs of each student. Teaching evaluation played an irreplaceable role in ensuring and improving teaching quality, promoting the comprehensive development of students, guiding educational reform and decision-making. Through effective teaching evaluation, continuous improvement and optimization of education can be achieved, ultimately achieving the goal of enhancing the education level of the entire society. Noh Y et al. proposed a scale based on domestic and foreign literature analysis and the Delphi method for the actual educational value of libraries, which was validated through a survey of 100 public libraries. This study demonstrated that the developed evaluation indicators could promote the improvement of library services, increase usage frequency, and have applicability across library types [13]. Chen Y et al. proposed a multivariate longitudinal growth curve model to track student learning trajectories in response to current evaluation issues in educational technology. This study demonstrated that the model could provide low-dimensional approximations in educational research with moderate sample size. It could effectively identify factors that affect skill mastery, thereby finely evaluating the effectiveness of educational interventions [14]. De Kun J et al. proposed a new method based on a bidirectional long short-term memory model to address the low efficiency of traditional teaching evaluation algorithms. This study demonstrated that its accuracy exceeded 96%, stability was good, and delay was extremely low, with high efficiency and practicality [15]. Ali K et al. conducted an online questionnaire survey on the comprehensive teaching level of a medical university in the UK. This proved that students had limited clinical exposure in managing sepsis and lacked confidence in identifying early symptoms. Both faculty and students believed that there was room for improvement in teaching [16]. Qianna S et al. proposed a feature extraction-based evaluation algorithm to address the difficulty in evaluating classroom teaching quality in modern education. This study demonstrated that the model has high accuracy and availability in evaluating the quality of theoretical and experimental teaching [17].
In summary, certain progress has been made in the field of education quality evaluation. However, there is still room for improvement in the availability and adaptability of evaluation tools, especially in the face of diverse and dynamic learning environments where the evaluation effectiveness can still be further improved. Therefore, the study proposes an evaluation model based on the combination of GAKT and supervised learning. This is to comprehensively optimize its efficiency, availability, and availability and expand its application in various personalized education fields. This can provide support for the diversification and customization of educational evaluation.
III.CONSTRUCTION OF A PERSONALIZED EDUCATION EVALUATION MODEL
Building an educational availability evaluation model under a supervised learning framework is crucial for capturing and understanding learning outcomes. On this basis, the evaluation model using KNN algorithm shows significant ability to improve prediction accuracy by optimizing the feature extraction process. The development and optimization of such models contribute to a more in-depth analysis of the effectiveness of educational activities. This can provide data support for the development of data-driven teaching strategies, while also providing technical support for the innovation of educational evaluation methodologies.
A.CONSTRUCTION OF EVALUATION MODEL BASED ON KNN ALGORITHM
Considering that in this study, it is necessary to compare the actual performance of students with similar confirmed cases. The KNN algorithm is chosen for this study. The basic principle is to predict and classify by searching for nearest neighbor samples, which is highly suitable for evaluating the availability of education [18]. Meanwhile, as a non-parametric method, KNN does not require any assumptions about the distribution of data [19]. This represents a significant advantage in the field of educational data analysis. The distribution characteristics of educational data are often complex, which may render it unsuitable for the assumptions of traditional parametric models. Moreover, the KNN algorithm can adapt to different types of input data, whether continuous or classified. In the field of education, evaluation indicators may include various formats of data such as grades, ability test scores, and learning behavior records. Moreover, KNN can handle these complex data types. Figure 1 shows the basic framework of the supervised learning-based evaluation model adopted by the research.
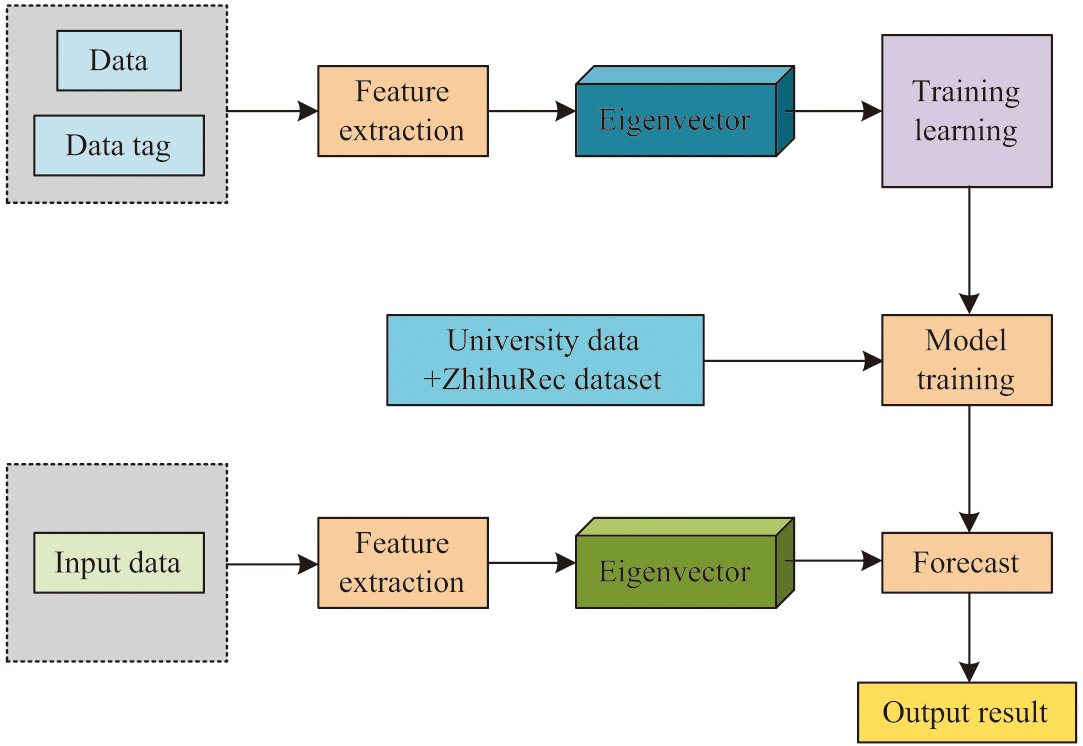 Fig. 1. The basic framework of an assessment model based on supervised learning.
The basic framework of the supervised learning-based evaluation model adopted by the research is shown in Fig. 1. The study chose to use the KNN algorithm, taking into account the flexibility of its feature space. KNN does not require complex feature construction and selection, it can operate flexibly in the feature space [20,21]. This is particularly beneficial for situations in the field of education where there are numerous features that are difficult to quantify. Moreover, the interpretability of educational evaluation models is crucial, as educators and decision-makers need to understand the reasons behind the evaluation results. The KNN algorithm provides decision-making basis by identifying similar cases, and compared to other more complex algorithms, the results of KNN are easier to interpret [22,23]. Meanwhile, the KNN algorithm has the characteristic of dynamic updates. Educational evaluation often requires dynamic updates to reflect the latest data. The KNN algorithm is inherently suited to dynamic learning environments, as it does not necessitate the retraining of the entire model. Rather, it can accommodate new data points by simply incorporating them into the existing dataset. First, it constructs an offline evaluation database, collects different teaching evaluation cases, and stores their evaluation indicator data and corresponding case coordinates in the database. The specific establishment of the database is shown in formula (1):
In formula (1), represents the database, represents the coordinates of the -th case, and represents the availability level value of the -th data corresponding to the -th case. By calculating the Euclidean distance from the test case to cases, the weighted average of the case positions of nearest neighbor points is calculated. The specific weight calculation is shown in formula (2):
In formula (2), represents the weight occupied by the -th reference point. It can be further represented as shown in formula (3):
In formula (3), represents the domain distance of the -th case point in the -th nearest neighbor point. To further improve the accuracy and practicality of KNN algorithm in educational availability evaluation, the study chose to use MeanShift-based clustering to improve KNN. MeanShift clustering is a gradient-based algorithm that can explore density clusters in data space without prior knowledge [24]. This method can automatically determine the number of clusters without the need for prior specification. This is particularly beneficial for educational data analysis, as the patterns and structures of learning data are often unknown beforehand. First, in the matching stage, distance data is obtained from the data target to be evaluated. If the data point to be evaluated is , the calculation of the domain distance between it and the -th case point is shown in formula (4):
In formula (4), represents the domain distance between the evaluation data point and the -th case point . represents the number of identical action points for and . represents the reception of the -th action point at evaluation data point . represents the reception of the -th action point at data point . Then, based on the domain distance, it finds the -th nearest neighbor point that is most similar in the database and then uses formula (2) to locate and evaluate the data. The flowchart of the KNN algorithm combined with MeanShift clustering is shown in Fig. 2.
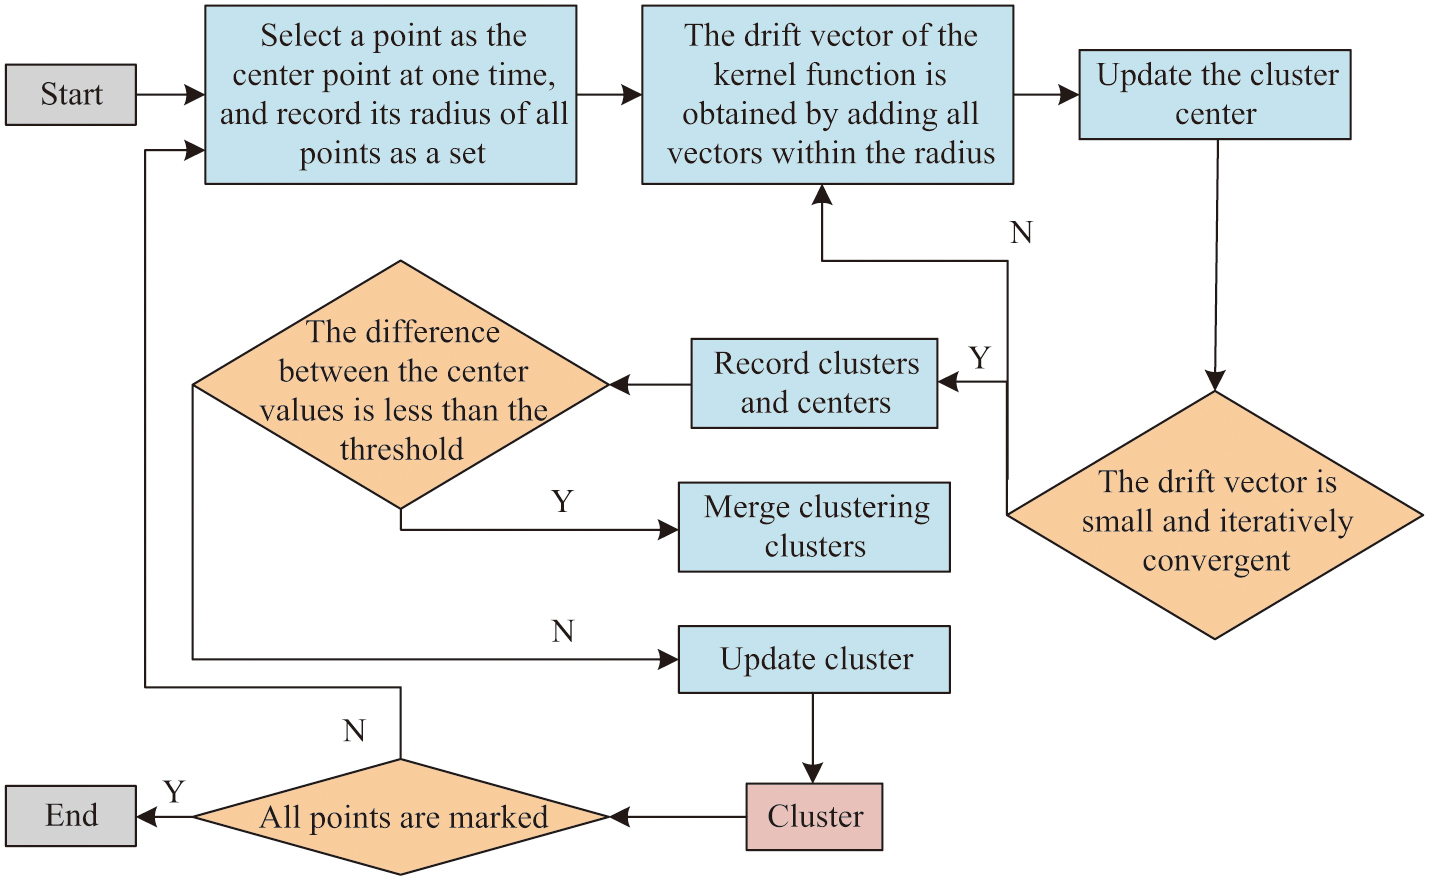 Fig. 2. MeanShift clustering KNN algorithm flow diagram.
By combining MeanShift clustering, the KNN algorithm can first identify dense regions in the data during the pre-processing stage. Then, when performing classification or regression tasks, it only considers the nearest neighbors located in the same dense area. This approach not only mitigates the impact of noisy data points but also enhances the accuracy of the evaluation, as it ensures that the evaluation is based on the most pertinent and representative data samples. In addition, the introduction of MeanShift clustering also helps to solve a key problem in KNN – selecting the optimal k-value. On the dataset processed by MeanShift, the KNN algorithm can more flexibly and accurately determine the value of k, as points in dense areas provide a natural indicator of proximity [25]. This improved KNN algorithm is expected to be applied in the field of education, providing a more refined evaluation of learner performance and learning outcomes. For the KNN algorithm, overall, the prediction results of each data sample in the regression task can be specifically represented as formula (5):
In formula (5), represents the final predicted evaluation result, and represents the actual value of the -th data sample closest to the given data point. The KNN algorithm is susceptible to a significant class imbalance issue. When the number of samples in distinct categories within the training dataset varies considerably, the KNN algorithm tends to prioritize those categories with a greater number of samples. This tendency can lead to a decrease in classification performance, especially for categories with fewer samples, where the probability of being correctly classified is significantly reduced. The number of categories contributing to the calculation of distance when determining the nearest neighbor is a significant factor in the accurate delineation of decision boundaries. The schematic diagram of class imbalance problem is shown in Fig. 3.
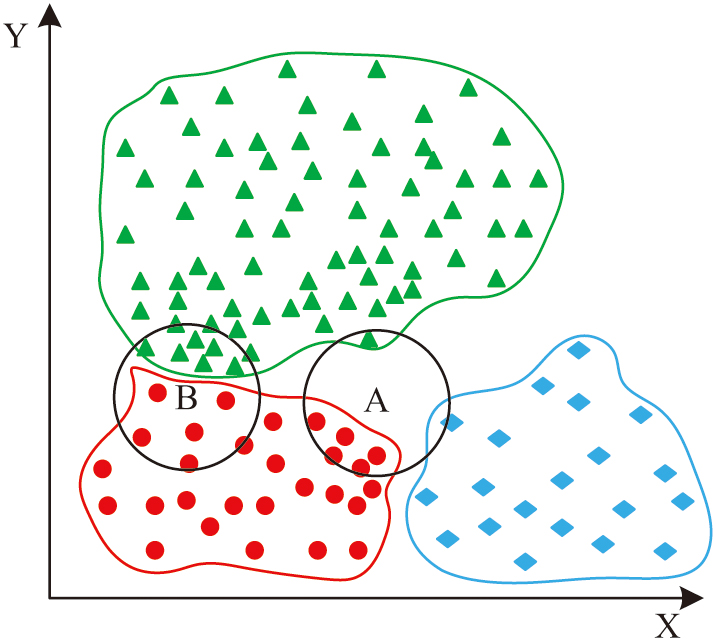 Fig. 3. Class unbalance problem schematic diagram.
As shown in Fig. 3, it is a schematic diagram of the class imbalance problem. It is evident that the nearest points obtained by the KNN algorithm for point A are the reddest points, while for point B, the nearest points obtained are triangles, which clearly poses a problem. The study chooses to introduce weights and assign higher weights to categories with fewer samples, thereby improving their influence in the calculation of nearest neighbors. Then formula (5) can be further transformed into formula (6):
In formula (6), represents the distance between the predicted data and the given data sample, represents its weight, and represents the actual value of the -th data sample adjacent to the predicted data sample.
B.FEATURE EXTRACTION OPTIMIZATION OF KNN ALGORITHM
To further enhance the performance and availability of the KNN algorithm, the study chose to perform feature extraction and enhancement processing on it. Feature extraction optimization is a key step in enhancing the performance of KNN algorithm, ensuring that only the most representative and discriminative information is input into the model. It introduces a multi-feature selection module based on attention mechanism. This is to select different advantageous features from the preset data. In this module, convolution operations are combined to further optimize the output results. The attention module introduced in the study is shown in Fig. 4.
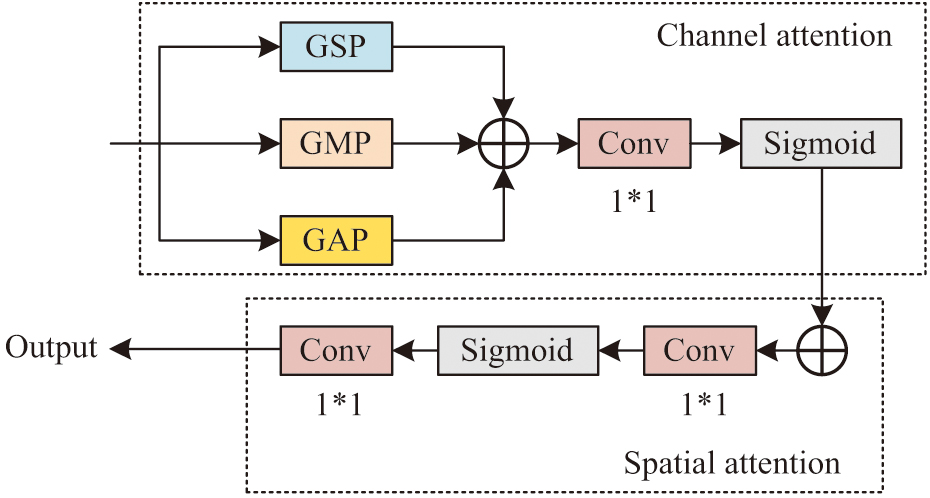 Fig. 4. Mixed attention module.
The size of the convolution kernel needs to be confirmed to some extent. To enhance the adaptive ability of the model, a method based on efficient channel attention networks is studied to adaptively adjust the size of the convolutional kernel, as shown in formula (7):
In formula (7), represents the size of the convolution kernel, represents the number of channels, , , and represents an odd number similar to . The expression of channel attention is specifically shown in formula (8):
In formula (8), represents the output of channel attention, with a value range of . represents input, . represents average pooling. represents maximum pooling. represents standard deviation pooling. represents a one-dimensional convolution with a kernel of . represents splicing operation. represents the sigmoid function. In the spatial attention module, its main function is to further correct the input features. The spatial attention operation is specifically shown in formula (9):
In formula (9), represents spatial attention operation and represents convolution operation. The output of the spatial attention module can be represented as shown in formula (10):
In formula (10), represents the output of the spatial attention module, with a value range of . The structure of the multi-feature selection module further integrated in the study is shown in Fig. 5.
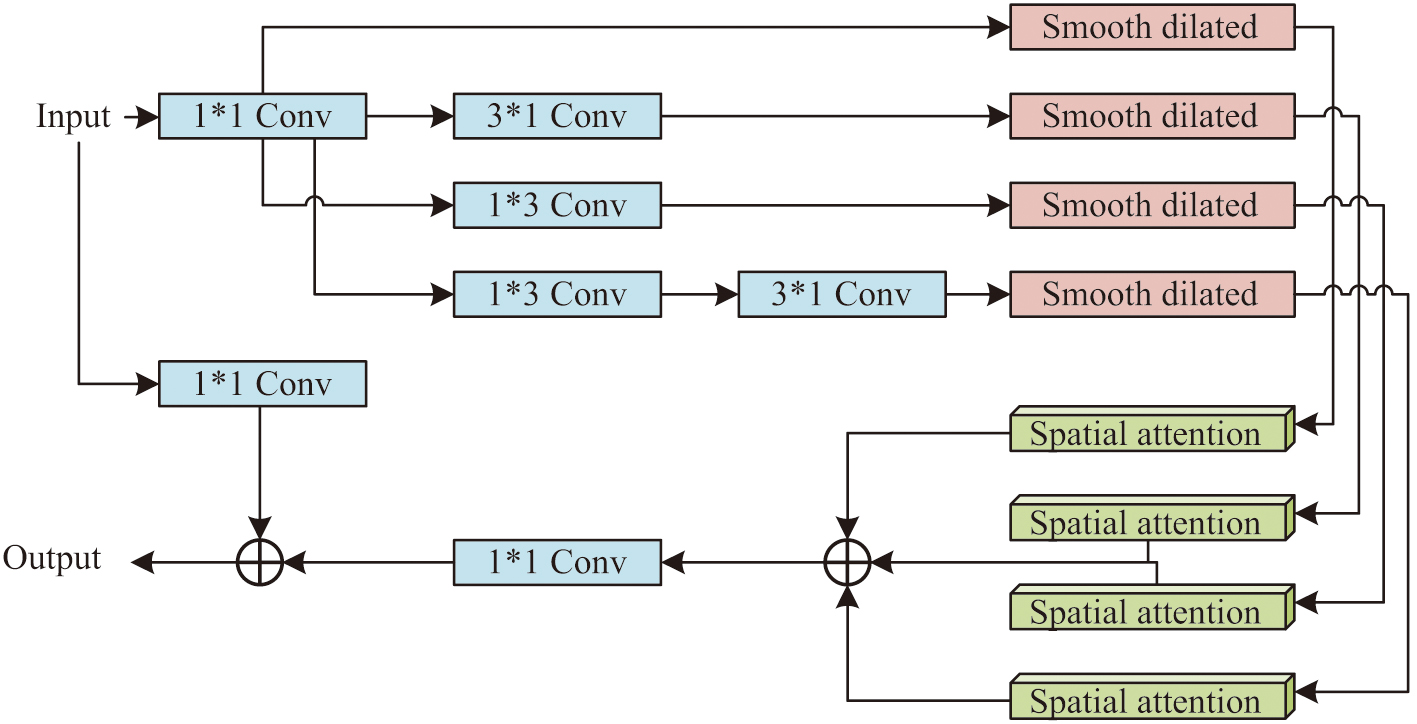 Fig. 5. Multi-feature selection module.
In the multi-feature selection module, convolution operations are combined to enhance the model’s learning ability for preset data, thereby improving training efficiency. In this module, assuming its input is . The output features can be specifically represented as shown in formula (11):
In formula (11), represents the output feature of the -th path, and represents the combination function of asymmetric convolution and smooth dilated convolution of the -th path. The output of this module can be represented as shown in formula (12):
In formula (12), represents the output of the multi-feature selection module. Furthermore, a global feature extraction module is introduced on this basis. The global attention extraction operation is specifically shown in formula (13):
In formula (13), represents global feature extraction, represents up-sampling operation, and represents the input of the module. The output of this module can be represented as shown in formula (14):
In formula (14), represents the output result of the global feature extraction module. The flowchart of evaluating teaching effectiveness in the study is shown in Fig. 6.
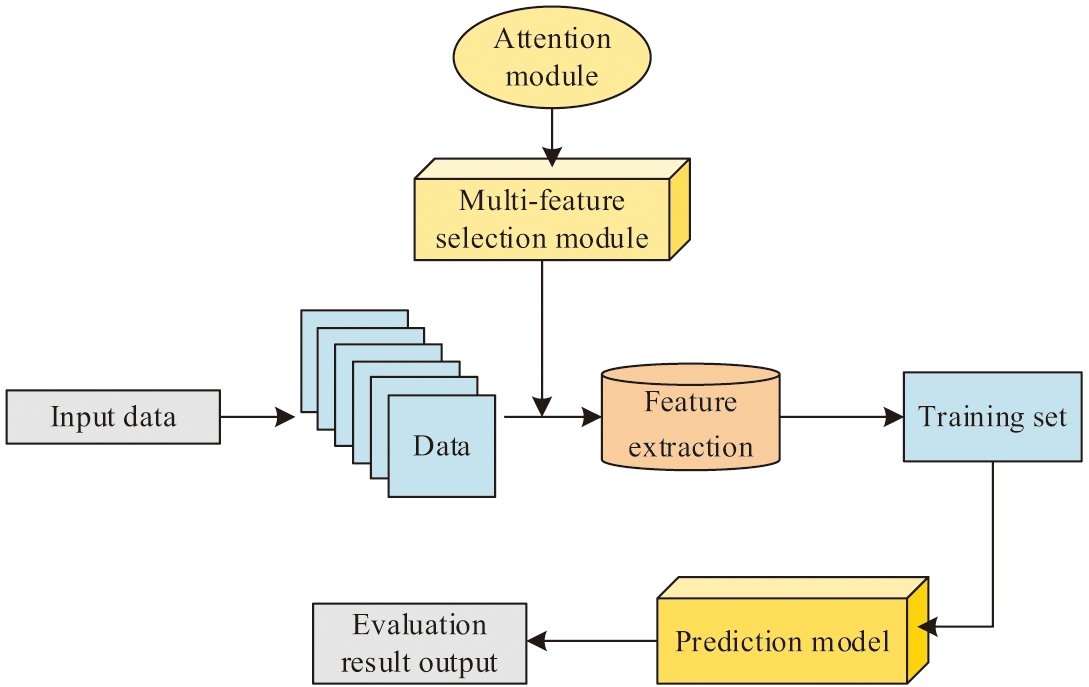 Fig. 6. Personalized teaching evaluation process diagram.
In the study, considering the sensitivity of prediction errors and their importance in model evaluation, the squared loss function is chosen to optimize the KNN algorithm [26]. The squared loss function, also known as the least squares method, provides a concise way to quantify errors by minimizing the sum of squared differences between predicted and actual values. This loss function is extremely sensitive to outliers and can help detect and correct model prediction bias in some cases [27]. Therefore, in the field of educational evaluation that emphasizes prediction accuracy, using a squared loss function can promote the model’s learning of potential patterns in the data, thereby improving overall predictive performance. It is specifically shown in formula (15):
In formula (15), represents the squared loss function, represents the true value of the sample data, and represents the predicted value of the sample data. Through the above optimization, the aim is to improve the predictive ability of the model. By accurately screening features that are highly correlated with the target variable and have discriminative power, the accuracy of prediction can be significantly improved. In the process of feature optimization, the dimensionality and inherent structure of the data are considered to ensure that the algorithm can capture key factors that affect student performance.
IV.MODEL TESTING
To verify the effectiveness of the MeanShift-KNN personalized education evaluation model, the study uses two key datasets. First, the study obtains personalized education evaluation data of students from a university from 2021 to 2022. Under the premise of ensuring privacy and obtaining authorization, the dataset is randomly divided, 80% of which is used to construct a training set and the remaining 20% is used as a test set. This education evaluation dataset contains a wealth of student performance indicators such as grades, ability test scores, and learning behavior records. Moreover, these indicators are used to form feature vectors, and the personalized education evaluation results of students are used as labels.
To enhance the generalization ability of the model, the study further introduces the ZhihuRec dataset released by Tsinghua University. The ZhihuRec dataset contains information such as user behavior patterns, interaction history, and preference feedback, which are also of great value in the study of personalized learning environments. In the pre-processing stage, the study undertake the necessary cleaning of the data, the removal of any missing or outlying values, and the performance of feature selection and encoding in order to convert any non-numeric data into a format that the model can process. For example, a student record extracted from an educational assessment dataset may contain the following information: student ID as a unique identifier, academic performance and aptitude test scores as numeric characteristics, and learning behavior records such as online study time and homework submission frequency. For the ZhihuRec dataset, a user record may include user ID, browsing history, frequency of click behavior, and user satisfaction feedback.
In the model training phase, the study enters the feature vector into the MeanShift-KNN model, uses the corresponding label to calculate the prediction error, and optimizes it through the quadratic loss function. In the testing phase, the study uses the test set to evaluate the predictive ability of the model and verify the accuracy and reliability of the model in actual personalized educational assessment. To compare the methods proposed by the research in parallel, naive Bayes (NB) and Gradient Boosting Decision Tree (GBDT) are further selected to compare with the MeanShift-KNN model proposed by the research. To avoid the impact of platform performance limitations on research testing, the study use a cloud server platform for testing. When selecting a cloud server platform for constructing a supervised learning model for educational availability evaluation and optimizing feature extraction using KNN algorithm, it is necessary to ensure that the platform can provide stable computing resources, sufficient storage capacity, and data processing capabilities. As shown in Table I, the software and hardware parameter information and training parameter settings used in the study are presented.
Table I. Details of software, hardware, and training parameter settings
| Hardware | Details | Software | Details | Training parameter | Details |
|---|---|---|---|---|---|
| Instance type | e2-highmem-4 | OS | Ubuntu 20.04 LTS | N_neighbors | 5 |
| vCPU | 4 core | Python | 3.8 | Metric | Minkowski |
| RAM | 32 GB | Google Cloud SQL | PostgreSQL | P | 2 |
| GPU | NVIDIA Tesla K80 | Google Cloud Storage | Standard Storage | Test_size | 0.2 |
| Boot disk | Persistent SSD | Google Cloud Console | Random_state | 42 | |
| Data disk | Persistent SSD | Google Cloud SDK | Weights | uniform | |
The convergence performance of the three models is tested five times to avoid errors affecting the results. The test results are shown in Table II. Table II shows that the MeanShift-KNN proposed by the research has better convergence performance. Compared to NB and GBDT, it has better training efficiency and can achieve the optimal state of the model at lower training costs.
Table II. Convergence performance test results of three models
| – | MeanShift-KNN | NB | GBDT | |||
|---|---|---|---|---|---|---|
| Mean value | Standard deviation | Mean value | Standard deviation | Mean value | Standard deviation | |
| 1 | 1.52×10⁻⁶ | 6.28×10⁻⁶ | 2.57×10⁻⁵ | 5.29×10⁻⁵ | 5.60×10⁻⁴ | 3.27×10⁻⁴ |
| 2 | 2.47×10⁻⁶ | 4.21×10⁻⁶ | 3.67×10⁻⁵ | 6.21×10⁻⁵ | 7.82×10⁻⁴ | 2.15×10⁻⁴ |
| 3 | 1.18×10⁻⁶ | 1.37×10⁻⁶ | 1.54×10⁻⁵ | 3.97×10⁻⁵ | 8.24×10⁻⁴ | 3.68×10⁻⁴ |
| 4 | 3.65×10⁻⁶ | 2.19×10⁻⁶ | 6.39×10⁻⁵ | 2.04×10⁻⁵ | 1.19×10⁻⁴ | 2.15×10⁻⁴ |
| 5 | 5.19×10⁻⁶ | 2.24×10⁻⁶ | 5.47×10⁻⁵ | 8.67×10⁻⁵ | 2.38×10⁻⁴ | 6.89×10⁻⁴ |
| Ave | 2.80×10⁻⁶ | 3.26×10⁻⁶ | 3.93×10⁻⁵ | 5.24×10⁻⁵ | 5.05×10⁻⁴ | 3.63×10⁻⁴ |
It conducts comparative tests on F1 and loss values of three models, and the test results are shown in Fig. 7. Figure 7(a) shows the F1 test results of three models. It indicates that the F1 value of MeanShift-KNN proposed by the research performs well and converges faster, with an optimal value of 0.951, which is 0.032 and 0.065 ahead of NB and GBDT, respectively. Figure 7(b) shows the loss value test results of three models. It indicates that the MeanShift-KNN proposed by the research has better convergence speed. Moreover, the optimal loss value is lower, with a value of 0.081, which is 0.167 and 0.232 ahead of NB and GBDT, respectively.
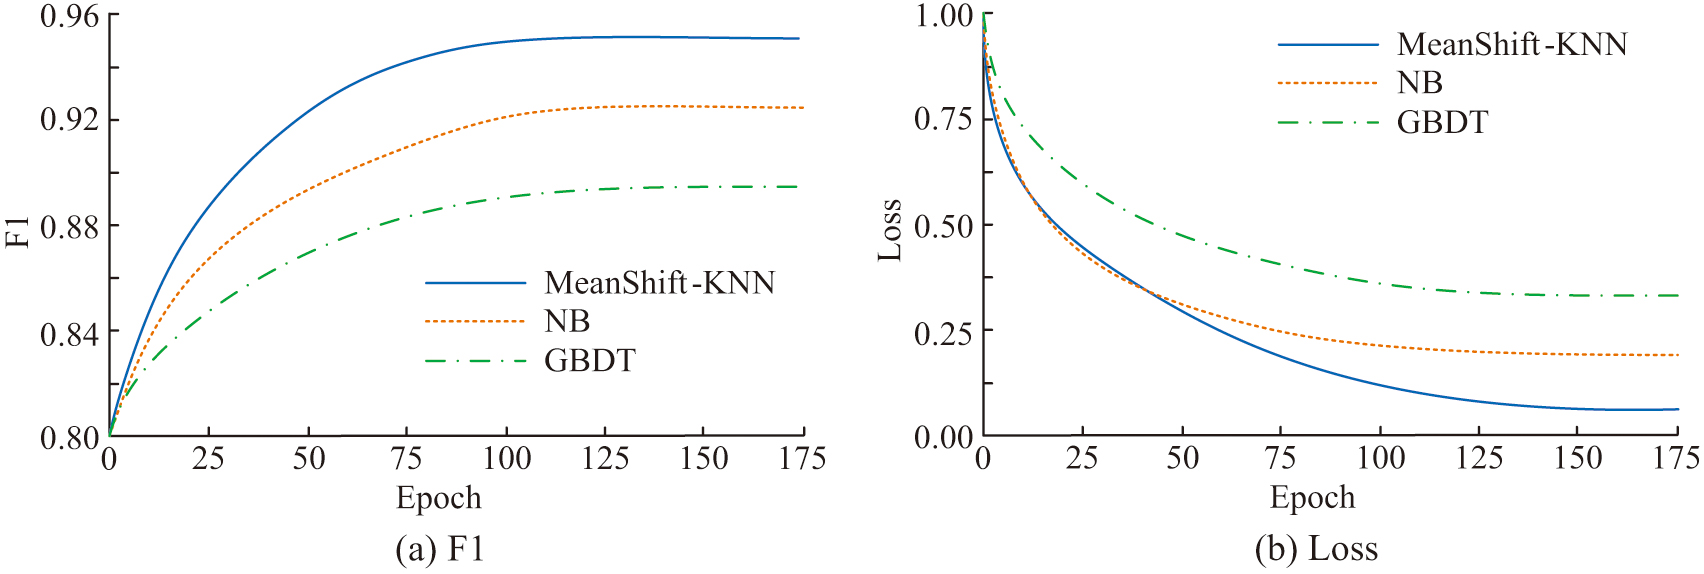 Fig. 7. F1 and loss of three models.
Its evaluation level for teaching effectiveness is set at 0–5, with teaching effectiveness ranging from worst to best from 0 to 5. The confusion matrices of the three algorithms are shown in Fig. 8, and Fig. 8(a) shows the confusion matrices of MeanShift-KNN. Figure 8(b) shows the confusion matrix of NB, and Fig. 8(c) shows the confusion matrix of GBDT. Figure 8 shows that the algorithm proposed by the research has better accuracy.
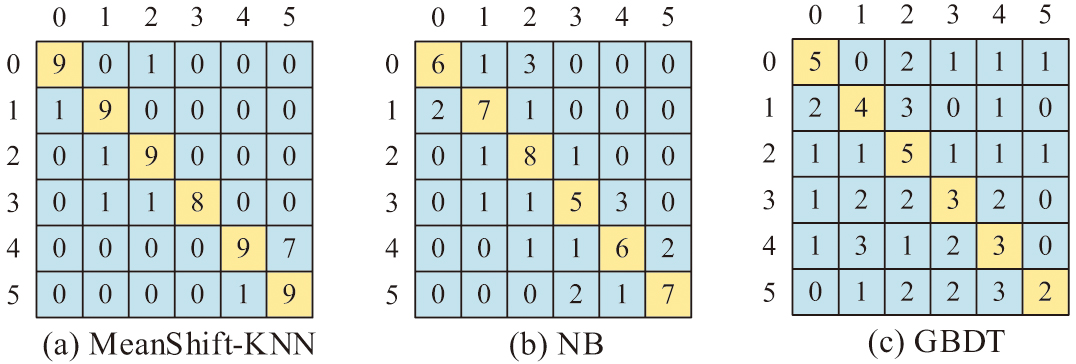 Fig. 8. Confusion matrix of three models.
The delay and data volume of the three models are tested, and the test results are shown in Fig. 9. Figure 9(a) shows the delayed testing of three models. It indicates that the MeanShift-KNN model proposed by the research has better delay performance, with an optimal delay value of 2.47 s, which is 2.52 s and 6.12 s ahead of NB and GBDT, respectively. Figure 9(b) shows the data volume test for three models. It indicates that the MeanShift-KNN model proposed by the research has less data volume. The optimal data volume is 14.12 MB, which is 17.23 MB and 22.19 MB ahead of NB and GBDT, respectively.
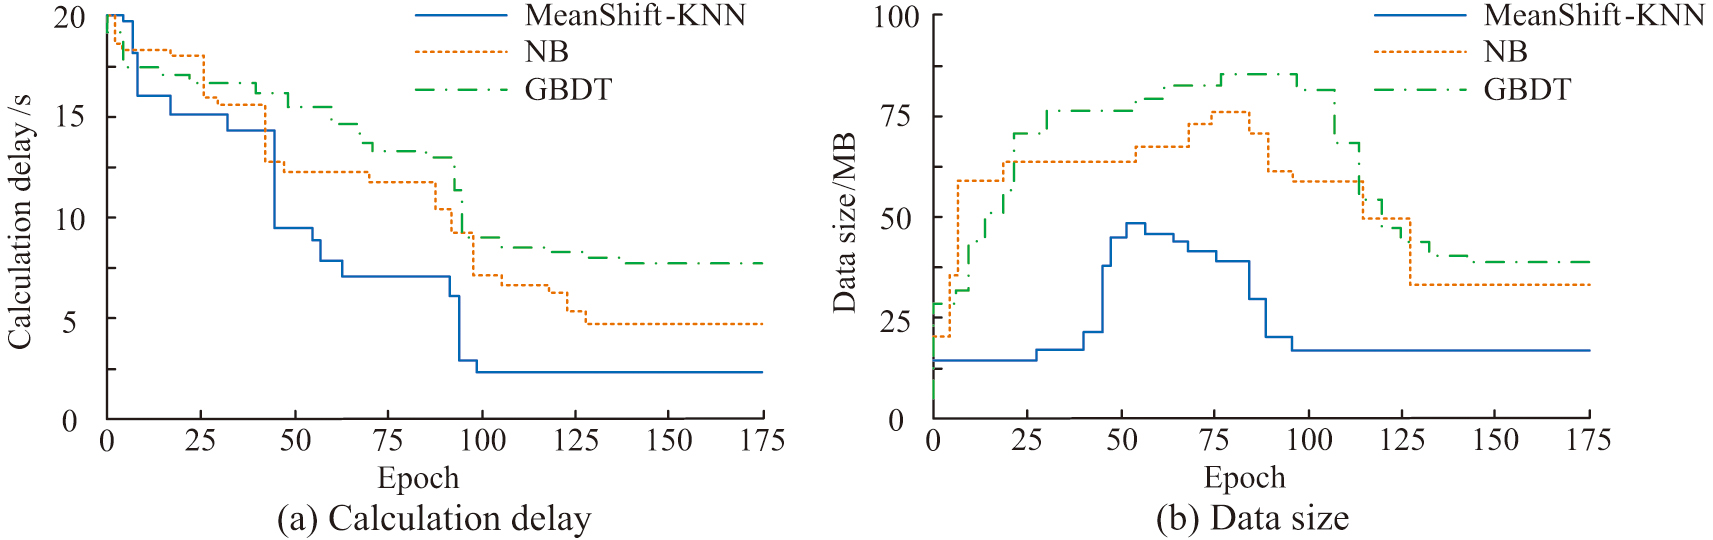 Fig. 9. The delay and data size performance of the three models.
The actual evaluation accuracy of the three models is tested. To avoid the impact of experimental errors, five experiments are conducted, and the test results are shown in Table III. Table III shows that the average accuracy of MeanShift-KNN reaches 94.11%, which is 6.61% and 19.11% higher than NB and GBDT models, respectively.
Table III. The actual accuracy test of three models
| Number of test | MeanShift-KNN | NB | GBDT | Actual value | |||
|---|---|---|---|---|---|---|---|
| Output value | Deviation | Output value | Deviation | Output value | Deviation | ||
| 1 | 5 | 0 | 4 | 1 | 3 | 2 | 5 |
| 2 | 3 | 0 | 2 | 1 | 1 | 2 | 3 |
| 3 | 2 | 1 | 2 | 1 | 3 | 2 | 1 |
| 4 | 5 | 0 | 4 | 1 | 4 | 1 | 5 |
| 5 | 2 | 0 | 2 | 0 | 1 | 1 | 2 |
| Average accuracy | 94.11% | 87.50% | 75.00% | – | |||
In summary, the MeanShift-KNN model proposed by the research has better performance in personalized innovation education evaluation. The experimental results also support the advantages of the MeanShift-KNN model. On a series of performance evaluation indicators, the MeanShift-KNN model has shown superior results compared to traditional models and a single algorithm. This indicates that in practical applications, the model can better identify the personalized needs of students and propose effective teaching strategies and improvement suggestions. This can promote the development of innovative education.
V.CONCLUSION
In this study, a method combining GAKT and supervised learning, especially the MeanShift-KNN algorithm, was adopted to improve the performance of the evaluation work. It demonstrated through comparative analysis that MeanShift-KNN exhibited excellent performance in multiple dimensions. In terms of convergence performance, the model demonstrated stronger stability. The delay test results indicated that MeanShift-KNN had a significant advantage in speed, with an optimal delay value of 2.47 s, which was significantly better than the delay performance of NB and GBDT models. In addition, the required data volume had also been significantly reduced, with an optimal data volume of only 14.12 MB, effectively reducing the computational and storage burden. In terms of accuracy, the model led with an average accuracy of 94.11%, indicating its effectiveness in predicting software availability. The results of this study can effectively and accurately assess the availability of college students’ personalized innovation under the circumstances of limited resources. However, the universality of the model on datasets of different types and scales still needs further verification. Future work can focus on expanding the range of adaptability of the models, optimizing the algorithms to adapt to larger datasets, and further improving the accuracy.