I.INTRODUCTION
North Aceh is one of the Regency in Aceh Province that has great potential in agriculture and plantations. The production of agricultural products, especially food crops and horticulture, is a leading commodity, because most of the North Aceh area is a producer of commodities from the agricultural sector. Based on data from the Central Bureau of Statistics (BPS) [1], the agricultural sector made the largest contribution to the formation of Gross Regional Domestic Production (GRDP) in 2023 with a value of 32.44%.
Agriculture is one of the important sectors to improve the economy of a region [2] and has an important role in global food security [3,4]. Agriculture has a role in, among other things, providing food for a growing population [5], provider of raw materials for several manufacturers, and a major source of employment [6], especially in North Aceh District.
Advances in information and communication technology have made the agricultural sector undergo a fourth revolution [7], and there are many ways to optimize the process and utilization of data in decision-making for food crop and horticulture management to ensure food security in the future [8,9] such as GIS, IoT, AI, and Big Data [10–12]. Data mining is one of the approaches used to process information from big data [13]. Data mining has been applied for a long time in agriculture to discover knowledge [14] and patterns from large-scale data sets [15]. One of the techniques in data mining is clustering [16,17].
Clustering is a complex clustering analysis [18] and systematic with numerical and statistical algorithms that are able to analyze data accurately so that it has an impact on making the right decisions [19–21]. In addition to numerical data, clustering can also be applied to images, graphics, text, and time series [22]. One algorithm that is widely used and well known for its effectiveness in solving many clustering problems is K-Medoids [23–26]. The K-Medoids algorithm has a medoid, which is data modeled using K-representative objects that serve as prototypes for clusters [27].
This mapping becomes one of the bases for decision-making related to planning and managing agricultural production to maintain proper food security. One of the approaches used to overcome this challenge is to cluster agricultural production using the K-Medoids algorithm [26] geographic information system (GIS)-based map. GIS is a system used to process and store data and display geographically relevant information [28]. GIS is a system that can be used as a spatial decision support system. The results of the clustering analysis of agricultural production in North Aceh District will be implemented and visualized in a web-based GIS [29,30].
This research aims to create spatial mapping and clustering of agricultural production in North Aceh District using the K-Medoids algorithm, so as to obtain agricultural production with high-production clusters (C1), medium-production clusters (C2), and low-production clusters (C3). The results of this clustering analysis will be implemented into a web-based GIS. This research provides benefits to help local governments and other stakeholders in making decisions related to planning and managing agricultural production to maintain food security. This research uses agricultural production data from the North Aceh Regency Agriculture Office using the K-Medoids method and GISs. This approach offers a new contribution in agricultural production mapping and clustering technology.
This research faces challenges in data collection, processing, and integration with GIS. However, with innovations such as the use of multisource data, IoT integration, and dynamic visualization, this research has the potential to provide more effective and informative solutions for agricultural management. These innovations can also improve the sustainability and efficiency of agricultural production. This research also has significant contributions, both from a theoretical and practical point of view, which can have a direct impact on agricultural management, government policy, and the development of spatial data analysis technology.
The rest of the paper is structured as follows. Section II presents the related work. Section III presents the research location, the stages of the research conducted, the stages of the K-Medoids algorithm, and the types of variables and datasets used. Section IV presents the results of the application of the K-Medoids algorithm, the final results of clustering agricultural products, and visualization of mapping results. Section V provides a comprehensive overview of the research results and further research
II.RELATED WORK
Based on research of Budiaji et al. [31] In this paper, a simple K-medoids (SKM) algorithm was suggested. A generalized distance function (GDF) was also created in order to provide the distance as an input for this technique. The SKM and partition around medoids (PAM) both performed similarly. When using the s option to specify the number of initializations, 20 was found to be an adequate quantity to achieve a result that was comparable to the PAM. The SKM outperformed other partitioning algorithms in terms of cluster accuracy index, according to the partitioning outcomes of the six real datasets.
Based on research of Purnamasari [32], the findings of the research show that the summarization accuracy for K-means is 51.16% and for K-medoids is 62.35%. Compared to K-Medoids, K-means has a lower accuracy value. The size and center of the first cluster chosen also affect the accuracy of the ensuing K-means. Therefore, as the following step in the development process, a study comparing the outcomes of the size value and the K-means initial cluster center combination is required.
Based on research of Dinata et al. [33], it demonstrates that the suggested purity K-Medoids algorithm requires only two iterations to cluster the mortality rate dataset, compared to the standard K-Medoids algorithm’s 8.7 iterations on average. The average number of traditional K-Medoids iterations on the Iris dataset is 13.2. As a result, the purity algorithm can significantly lower the total number of K-Medoids clustering rounds. Furthermore, Davies Bouldien Index (DBI) validation demonstrates that in both datasets, pure K-Medoids produce a superior clustering effect: the birth death dataset has the lowest DBI of purity K-Medoids at 0.6719 and on the iris dataset at 0.6612; the birth death dataset has the lowest DBI of conventional K-Medoids at 0.8821.
Based on research of Tan et al. [34], when compared to the actual flaws, the K-Medoids clustering algorithm had a defect anticipation accuracy of 95.3878%. Greater delamination accuracy was predicted by the K-Medoids method. However, compared to the actual defect size, the anticipated delamination area was higher. The proposed method could effectively discriminate between the defect-free zone and the fault boundary. The proposed method was more operational-friendly and could be employed as an in situ microwave NDT system for flaw identification because it requires less adaption. It could also be incorporated into production quality control procedures and utilized as a mobile field service inspection technique.
Based on research of Leis [35], Based on past studies those with hyperglycemia and lower oxygen saturation on admission were more likely to experience adverse events in their cohort, including prolonged hospitalization. The K-Medoids algorithm was a promising approach to parse the heterogeneity around hospital admissions.
Based on research of Syukra [36], using the K-Medoids clustering method, multiple trials were conducted with the following cluster counts: 3, 4, 5, 6, 7, 8, and 9. Based on the DBI validity test, which yielded a value of 0.678, the ideal cluster of three clusters was determined. The findings indicate that the Association Rule is only present in cluster 3 based on the Association Rule search experiment conducted across three clusters with a minimum support value of 5%–9% and a minimum confidence value of 50%.
The Association Rule formed in cluster 3 with a minimum support value of 5% found a pattern of 2 rules, at a minimum support of 6% found a pattern of 1 rule, at a minimum support of 7% found a pattern of 1 rule, at a minimum support of 8% found a pattern of 1 rule and at a minimum support of 9% found no pattern rules. Based on the Association Rule that has been formed in cluster 3, it states that there are 4 interconnected product items that are most often purchased by customers of 212 Mart Jalan Rambutan Pekanbaru City, namely 2lt Permata cooking oil, granulated sugar, fried Indomie, and chicken curry Indomie which can be recommended to 212 Mart.
Based on research of Zhang and Lu [37], this work outlined a strategy that combined the use of spatial autocorrelation, factor decomposition, and GIS-based spatial analytic techniques to uncover the spatiotemporal dynamics and spatial clustering features of soybean production in the NCP. By revealing changes in soybean production and its regional clustering patterns between 1998 and 2015 in the NCP, the analysis aided in the identification of hotspots for the development of soybean production, hence promoting regional agricultural planning. According to the data, there was a sharp decline in overall soybean production between 1998 and 2015, primarily as a result of planting areas being smaller due to declining advantages. This study suggested that in order to support the national soybean revival strategy, the NCP’s decreased soybean production area may be restored if incentives are raised.
III.MATERIALS AND METHODS
A.MAP OF RESEARCH LOCATION IN NORTH ACEH REGENCY
North Aceh Regency is a low-lying area with an average altitude of 125 meters above sea level. It is located at positions 04.46.00° North latitude and 05.00.40° North latitude, and 96.52.00° and 97.31.00° East longitude. The land area of North Aceh is 3,296.86 km2. North Aceh Regency itself has a tropical climate where the average temperature in February–August is 31.5°C and September–January ranges from 29°C. North Aceh Regency consists of 27 sub-districts, including sawang district, nisam district, nisam antara district, banda baro district, kuta Makmur district, simpang keramat district, shamtalira bayu district, geureudong pase district, meurah mulia district, matangkuli district, paya bakong district, pirak timu district, cot girek district, tanah jambo aye district, langkahan district, seunuddon district, baktiya district, baktiya barat district, lhoksukon district, tanah luas district, nibong district, samudera district, shamtalira aron district, tanah pasir district, lapang district, muara batu district, and dewantara district. The map of the research location in North Aceh Regency, Aceh Province, Indonesia (BPS Aceh Utara, 2023) is shown in Fig. 1.
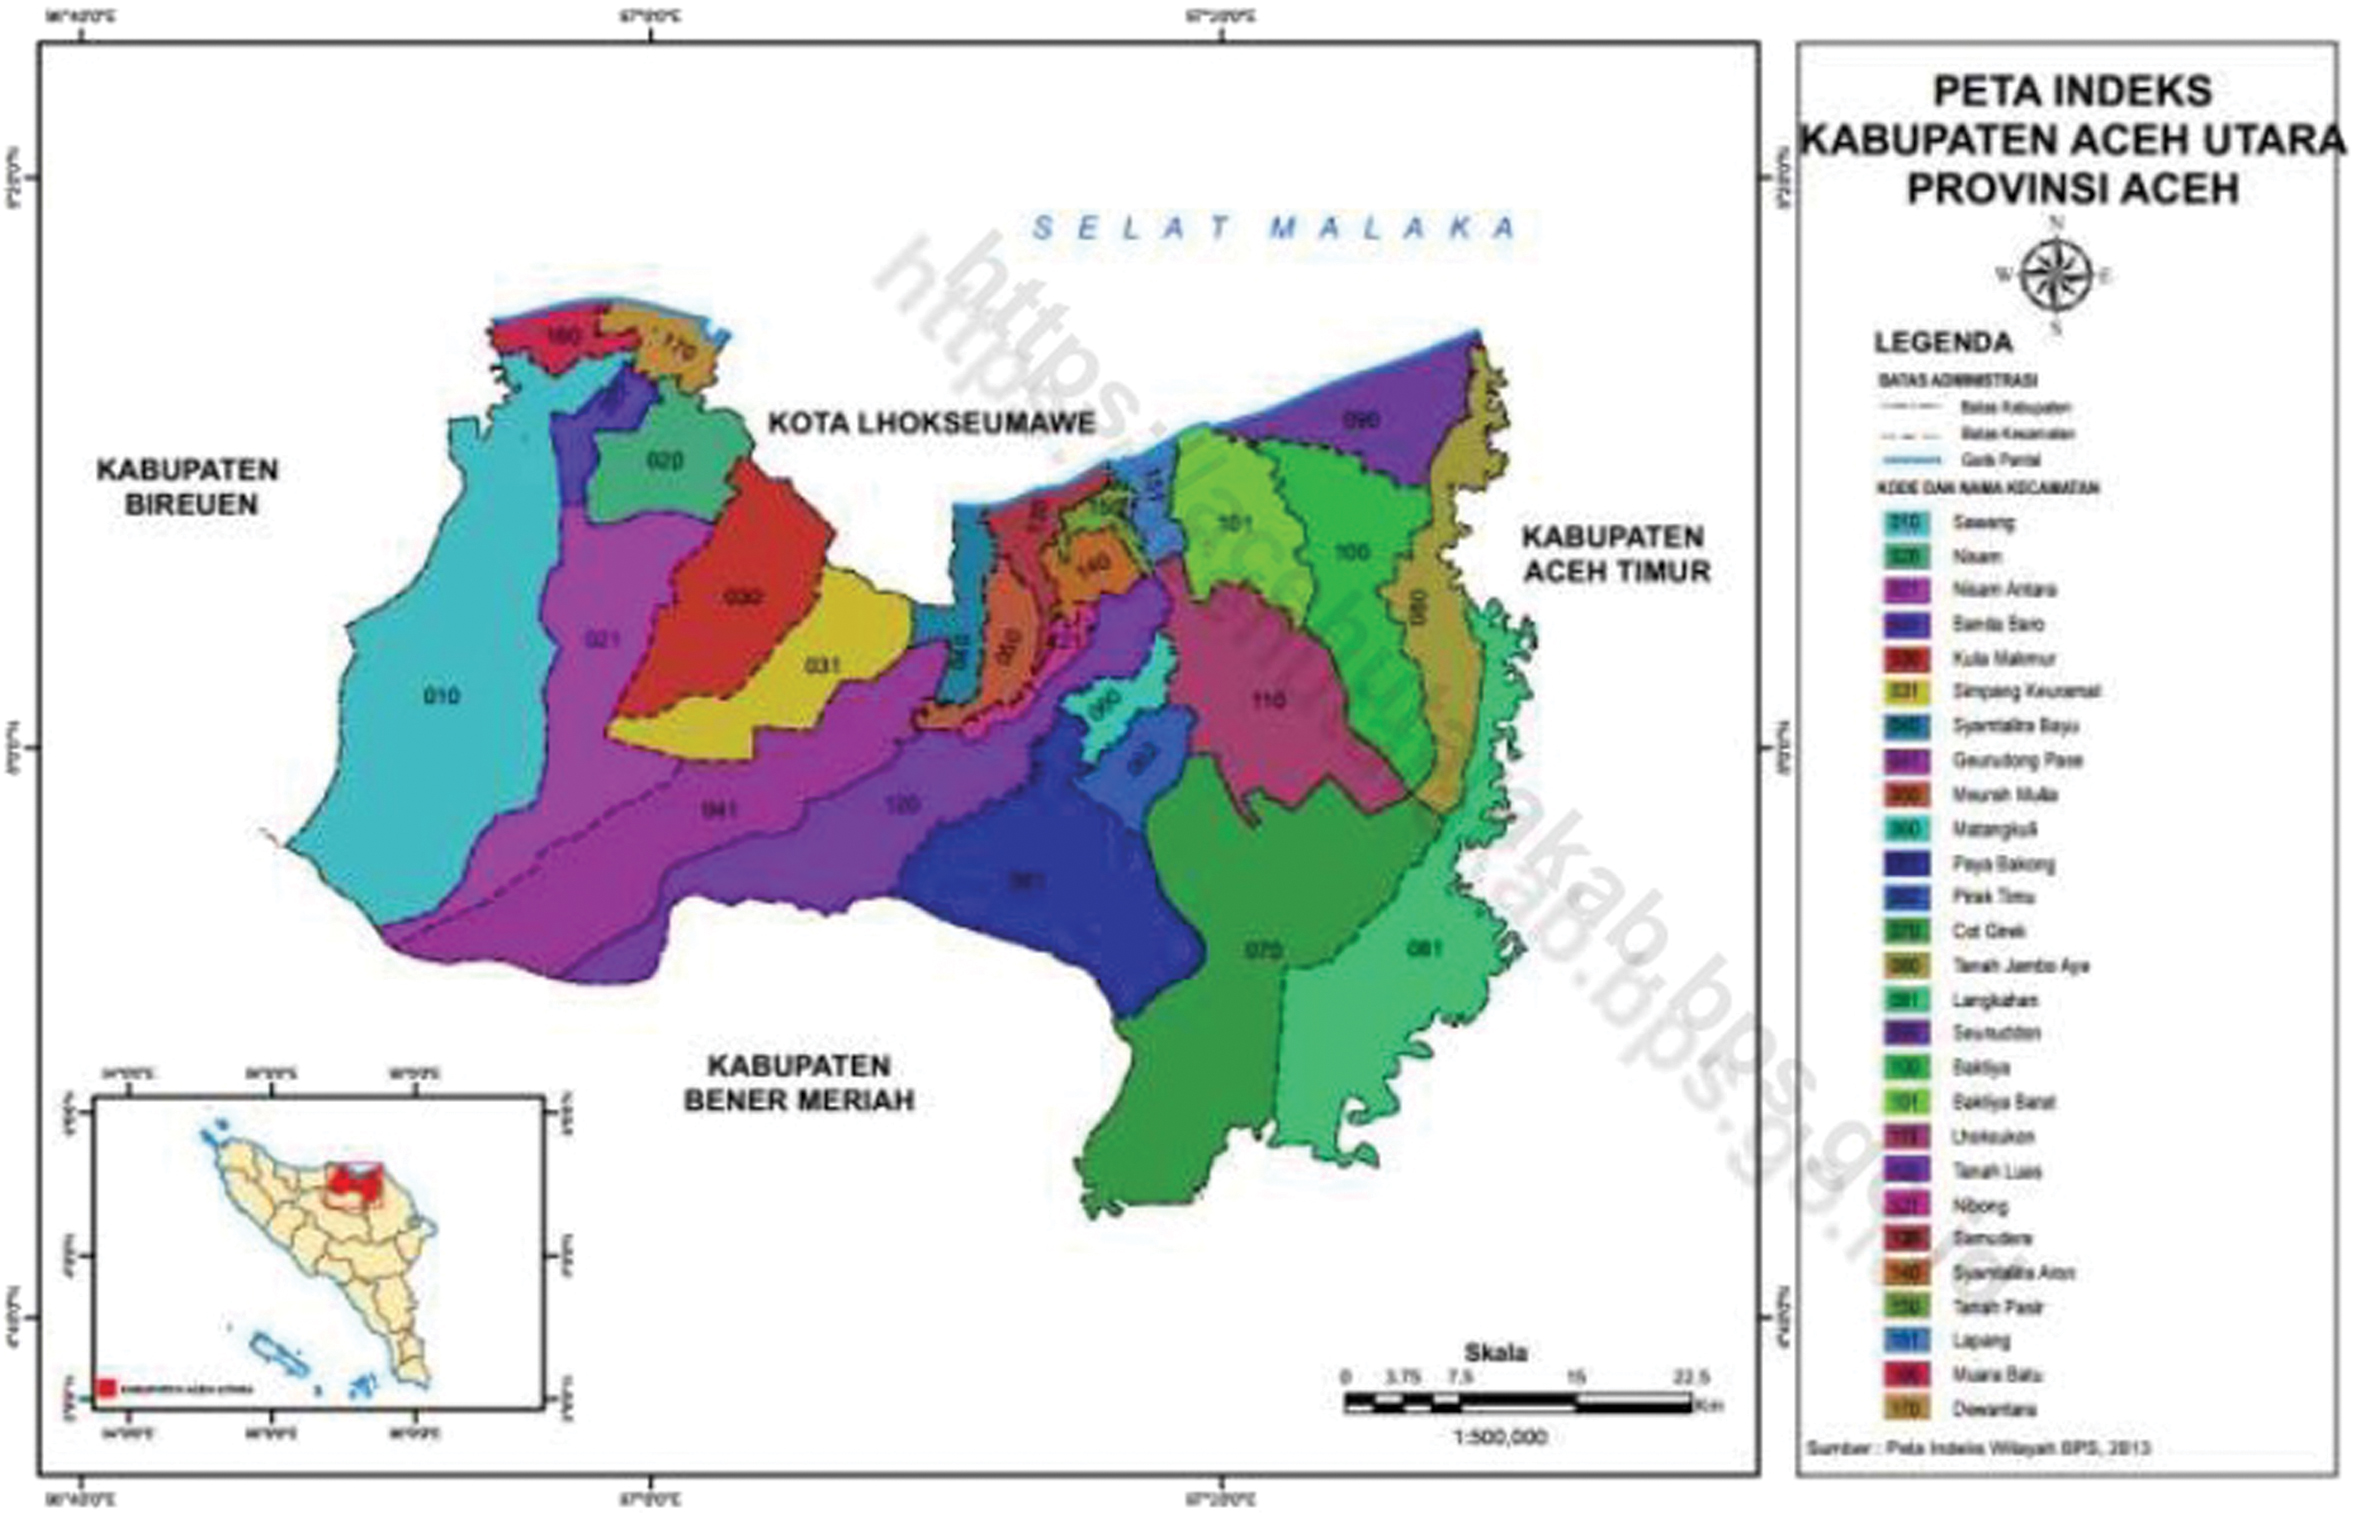 Fig. 1. Map of research location in North Aceh Regency, Aceh Province, Indonesia (BPS Aceh Utara, 2023).
B.STAGES OF RESEARCH
This research method is carried out by building and developing a software model for a clustering system and mapping of agricultural production results based on a GIS using the K-Medoids algorithm with the following research stages:
- 1.ObservationIn order to gather information on the outcomes of agricultural production in North Aceh Regency, the researchers conducted extensive observation activities.
- 2.Review of LiteratureA literature review, which includes articles from other pertinent research journals, is a forum for discussing the theory or methodology utilized to support this study.
- 3.Acquisition of DataIt is the process of looking for information in the area that will be utilized to address issues during the research process. Data from North Aceh Regency’s agricultural production is used to enter the necessary data into the system.
- 4.Analysis of the System RequirementsSystem design comes next, following the completion of the system requirements stage, which involves studying the system that will be constructed. The system to be created will be designed using the system analysis results as a guide.
- 5.Design of Systems.A system’s structure is planned and developed during the system design phase, which also involves creating databases, software, and user interfaces using programming languages that are represented by model diagrams.
- 6.Implementation of the SystemThe system design is executed in an operational environment, including installation, configuration, and testing. System implementation is a step that discusses the outcomes of research implementation of the resulting system design that explains the features in the software program.
- 7.Testing SystemSystem testing is a phase in research where the outcomes of system trials are discussed. Specifically, software application testing findings are discussed to make sure the system functions as intended.
- 8.Systems Outcomes: Clustering and MappingThe clustering and mapping system’s final output is a website map based on the GIS, representing the outcomes of the clustering process of various agricultural production kinds.
C.K-MEDOIDS ALGORITHM
Based on research of Schubert and Rousseeuw [27], the algorithm known as PAM or K-Medoids is used. To divide a collection of n objects into a set of k clusters, the PAM algorithm incorporates a partitioning clustering technique. An object from a group of objects known as medoids that represent the cluster is the cluster representation in PAM. The K-Medoids algorithm’s steps are as follows:
- 1.Set up k cluster centers (the total number of clusters).
- 2.Using the Euclidean Distance formula with Equation (1), assign each piece of data (object) to the closest cluster: where:D = Euclidean DistanceI = Many objectsx,y = Object coordinate pointn = Many observations observed(number of objects).
- 3.Choose an object at random from each cluster to be a new medoid candidate.
- 4.Using the previously mentioned Euclidean Distance formula, determine the distance between each object in each cluster and the new medoid candidate, as shown in Equation (1).
- 5.Dividing the new total distance by the previous total distance, find the total deviation (S). The clusterization result can be obtained by stopping the process if S>0. Instead, exchange objects with cluster data to create a new set of k objects that are medoids if S<0.
- 6.In order to obtain the clusters and the members of each cluster, repeat steps 3 through 5 until the medoids remain the same.
D.DATA COLLECTION AND VARIABLE TYPE AND DATASET
This research is conducted in North Aceh Regency, Aceh Province, Indonesia, which includes areas that produce agricultural production. The data used in this study are obtained from the Agriculture Office. The data used includes 25 types of agricultural production. The data variables used in this study include the type of production, the name of the sub-district, and the results of agricultural production, where each sub-district is initialized with criteria: X1 = Muara Batu District, X2 = Sawang District, X3 = Nisam District, X4 = Nisam Antara District, X5 = Banda Baro District, X6 = Dewantara District, X7 = Kuta Makmur District, X8 = Simpang Keramat District, X9 = Syamtalira Bayu District, X10 = Geureudong Pase District, X11 = Meurah Mulia District, X12 = Samudera District, X13 = Syamtalira Aron District, X14 = Tanah Pasir District, X15 = Lapang District, X16 = Tanah Luas District, X17 = Nibong District, X18 = Matangkuli District, X19 = Pirak Timu District, X20 = Paya Bakong District, X21 = Lhoksukon District, X22 = Cot Girek District, X23 = Baktiya District, X24 = Baktiya Barat District, X25 = Seunuddon District, X26 = Tanah Jambo Aye District, and X27 = Langkahan District. The dataset used can be seen in Table I.
Table I. Dataset of agricultural production results
| No | Production type | X1 | X2 | X3 | X4 | … | X27 |
|---|---|---|---|---|---|---|---|
| 1 | Rice | 121827,04 | 224579,9 | 167222,2 | 0 | … | 141504,52 |
| 2 | Corn | 100,48 | 4580,4 | 13059,53 | 3337,6 | … | 21649,44 |
| 3 | Soybeans | 0 | 0 | 0 | 0 | … | 0 |
| 4 | Durian | 35 | 300 | 75 | 28000 | … | 895 |
| 5 | Mango | 104 | 200 | 1495 | 0 | … | 443 |
| 6 | Papaya | 368 | 2600 | 170 | 2515 | … | 43150 |
| 7 | Banana | 206 | 2260 | 232 | 3560 | … | 6695 |
| 8 | Rambutan | 97 | 350 | 735 | 195 | … | 2310 |
| 9 | Avocado | 0 | 0 | 240 | 0 | … | 0 |
| 10 | Star fruit | 609 | 0 | 218 | 0 | … | 302 |
| … | …………. | … | … | … | … | … | … |
| 25 | Duku | 67 | 200 | 20 | 0 | … | 155 |
IV.RESULT AND DISCUSSION
A.APPLICATION OF K-MEDOIDS ALGORITHM
The dataset used in this study consists of agricultural production results obtained from the North Aceh Regency Agriculture Office in Table I.
B.DATA NORMALIZATION
The phases of the clustering are as follows: the unprocessed data in Table II needs to be normalized. The alignment of attributes with varying numerical values is the goal of this data standardization. The minimum and maximum functions on the characteristics that will be recalculated are employed in the data normalization equation. Equation (2) is used in the process of normalizing data:
| No | X1 | X2 | X3 | X4 | X5 | X6 | X7 | … | X27 |
|---|---|---|---|---|---|---|---|---|---|
| 1 | 1,0000 | 1,0000 | 1,0000 | 0,0000 | 1,0000 | 1,0000 | 1,0000 | … | 1,0000 |
| 2 | 0,0008 | 0,0204 | 0,0781 | 0,1192 | 0,0036 | 0,0137 | 0,0464 | … | 0,1530 |
| 3 | 0,0000 | 0,0000 | 0,0000 | 0,0000 | 0,0000 | 0,0000 | 0,0000 | … | 0,0000 |
| 4 | 0,0003 | 0,0013 | 0,0004 | 1,0000 | 0,0000 | 0,0000 | 0,0010 | … | 0,0063 |
| 5 | 0,0009 | 0,0009 | 0,0089 | 0,0000 | 0,0267 | 0,0765 | 0,0012 | … | 0,0031 |
| 6 | 0,0030 | 0,0116 | 0,0010 | 0,0898 | 0,0042 | 0,0000 | 0,0061 | … | 0,3049 |
| 7 | 0,0017 | 0,0101 | 0,0014 | 0,1271 | 0,0119 | 0,0166 | 0,0068 | … | 0,0473 |
| 8 | 0,0008 | 0,0016 | 0,0044 | 0,0070 | 0,0000 | 0,0014 | 0,0122 | … | 0,0163 |
| 9 | 0,0000 | 0,0000 | 0,0014 | 0,0000 | 0,0000 | 0,0000 | 0,0000 | … | 0,0000 |
| 10 | 0,0050 | 0,0000 | 0,0013 | 0,0000 | 0,0000 | 0,0005 | 0,0000 | … | 0,0021 |
| … | … | … | … | … | … | … | … | … | … |
| 25 | 0,0005 | 0,0009 | 0,0001 | 0,0000 | 0,0000 | 0,0000 | 0,0000 | … | 0,0011 |
C.INITIALIZE K CLUSTER CENTERS (NUMBER OF CLUSTERS)
The next step is to initialize the cluster center value after all attributes of the production type data and obtain data that has the same numerical value based on the above data normalization results. Three agricultural production clusters, that is, high-production cluster (C1), medium-production cluster (C2), and low-production cluster (C3), make up the number of clusters in this study. Next, the midpoint value of each available attribute for each cluster is found. The medoid values, or beginning cluster values, were chosen at random in Table III.
Table III. Cluster center value (medoid value)
| Cluster | X1 | X2 | X3 | X4 | X5 | X6 | X7 | … | X27 |
|---|---|---|---|---|---|---|---|---|---|
| C1 | 1,0000 | 1,0000 | 1,0000 | 0,0000 | 1,0000 | 1,0000 | 1,0000 | … | 1,0000 |
| C2 | 0,0008 | 0,0204 | 0,0781 | 0,1192 | 0,0036 | 0,0137 | 0,0464 | … | 0,1530 |
| C3 | 0,0000 | 0,0000 | 0,0000 | 0,0000 | 0,0000 | 0,0000 | 0,0000 | … | 0,0000 |
D.EUCLIDEAN DISTANCE CALCULATION
The distance between the data and the centroid will be computed using the first computation once the cluster center’s centroid value (medoid value) has been determined. The Euclidean Distance with Equation (3) was utilized in this study’s calculation of distance:
The following is how this equation can be applied to the data and determines the data’s distance from the first cluster center:
Calculate the distance between the data and the center of the second cluster:
Calculating the distance between the data and the center of the third cluster:
The same calculation is done on all data, and after calculating all data and attributes, it will get the closest distance of each data in each cluster. Table IV shows second iteration medoid calculation result.
Table IV. Second iteration medoid calculation result
| No | C1 | C2 | C3 | Distance | Cluster |
|---|---|---|---|---|---|
| 1 | 0,0000 | 4,8686 | 5,0857 | 0,0000 | 1 |
| 2 | 0,6533 | 0,6424 | 0,6491 | 0,6424 | 2 |
| 3 | 0,0399 | 0,0531 | 0,0423 | 0,0399 | 2 |
| 4 | 1,0002 | 1,0008 | 1,0001 | 1,0001 | 1 |
| 5 | 0,1132 | 0,0952 | 0,1127 | 0,0952 | 3 |
| 6 | 0,3238 | 0,3257 | 0,3229 | 0,3229 | 2 |
| 7 | 0,1452 | 0,1461 | 0,1447 | 0,1447 | 3 |
| 8 | 0,0657 | 0,0743 | 0,0614 | 0,0614 | 3 |
| 9 | 0,0017 | 0,0367 | 0,0150 | 0,0017 | 3 |
| 10 | 0,0069 | 0,0372 | 0,0154 | 0,0069 | 1 |
| … | … | … | … | … | … |
| 25 | 0,0149 | 0,0375 | 0,0000 | 0,0000 | 2 |
| Total : | 7,5819 |
E.CALCULATING THE TOTAL DEVIATION (S)
After obtaining the distance value between the first iteration and the second iteration, then calculate the total deviation (S) by finding the difference from the new total cost value minus (−) the old total cost. Provided that if S < 0, then exchange the value of the object by determining new medoids, and if S > 0 then the test will be stopped at that iteration, by using Equation (4):
The total deviation result is more than zero (S>0). Then the test is stopped at the second iteration. The clustering parameters will be the outcomes of the most recent iteration. Here, the author determines which cluster members are included in the high, medium, and low cluster members based on the centroid, namely C1 = high, C2 = medium, and C3 = low. Thus, members of cluster C1 are high production, members of C2 are medium production, and members of C3 are low production.
F.FINAL RESULT OF AGRICULTURAL PRODUCE CLUSTERING
The final results of clustering the type of production of agricultural products utilizing the K-Medoids algorithm in North Aceh Regency is shown in Table V.
Table V. Clustering results of production types of agricultural products in North Aceh district
| No | Type of agricultural production | Cluster |
|---|---|---|
| 1 | Rice | C1 = High |
| 2 | Corn | C2 = Medium |
| 3 | soybeans | C1 = High |
| 4 | Durian | C2 = Medium |
| 5 | Mango | C1 = High |
| 6 | Papaya | C2 = Medium |
| 7 | Banana | C2 = Medium |
| 8 | Rambutan | C2 = Medium |
| 9 | Avocado | C3 = Low |
| 10 | Star fruit | C1 = High |
| 11 | Guava | C1 = High |
| 12 | Water Guava | C1 = High |
| 13 | Siamese Oranges | C1 = High |
| 14 | Big Oranges | C1 = High |
| 15 | Mangosteen | C1 = High |
| 16 | Jackfruit | C2 = Medium |
| 17 | Pineapple | C1 = High |
| 18 | Snake fruit | C3 = Low |
| 19 | Mustard greens | C1 = High |
| 20 | Soursop | C1 = High |
| 21 | Breadfruit | C1 = High |
| 22 | Gnetum | C1 = High |
| 23 | Twisted cluster bean | C1 = High |
| 24 | Jengkol | C2 = Medium |
| 25 | Duku | C1 = High |
The graph shows the outcomes of clustering the types of agricultural production using the K-Medoids algorithm in North Aceh Regency in 2023 in Fig. 2.
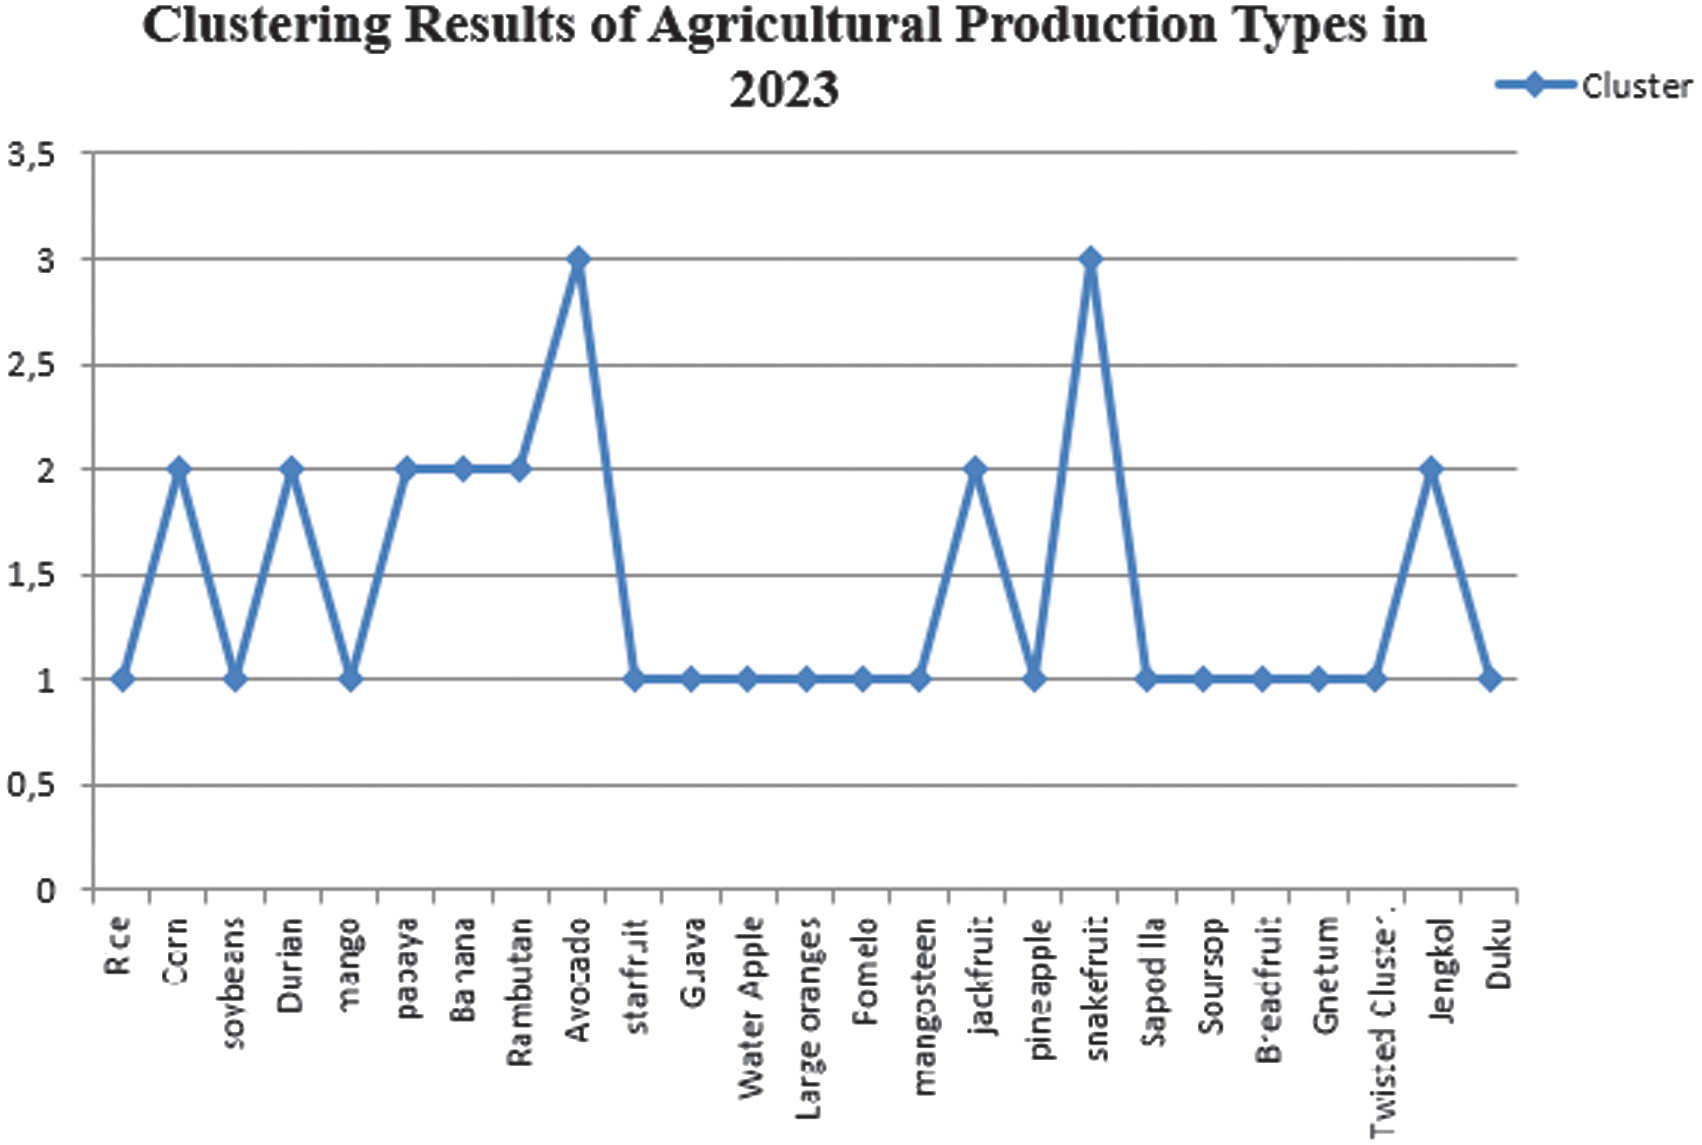 Fig. 2. Clustering results of agricultural production types.
G.MAPPING VISUALIZATION RESULTS WITH GIS
The results of agricultural production and clustering results are then visualized in the form of GIS-based mapping. Figure 3 is a visualization of the implementation on the web GIS of agricultural production data for all types of production, and it can be seen that each sub-district has information related to production results in tons.
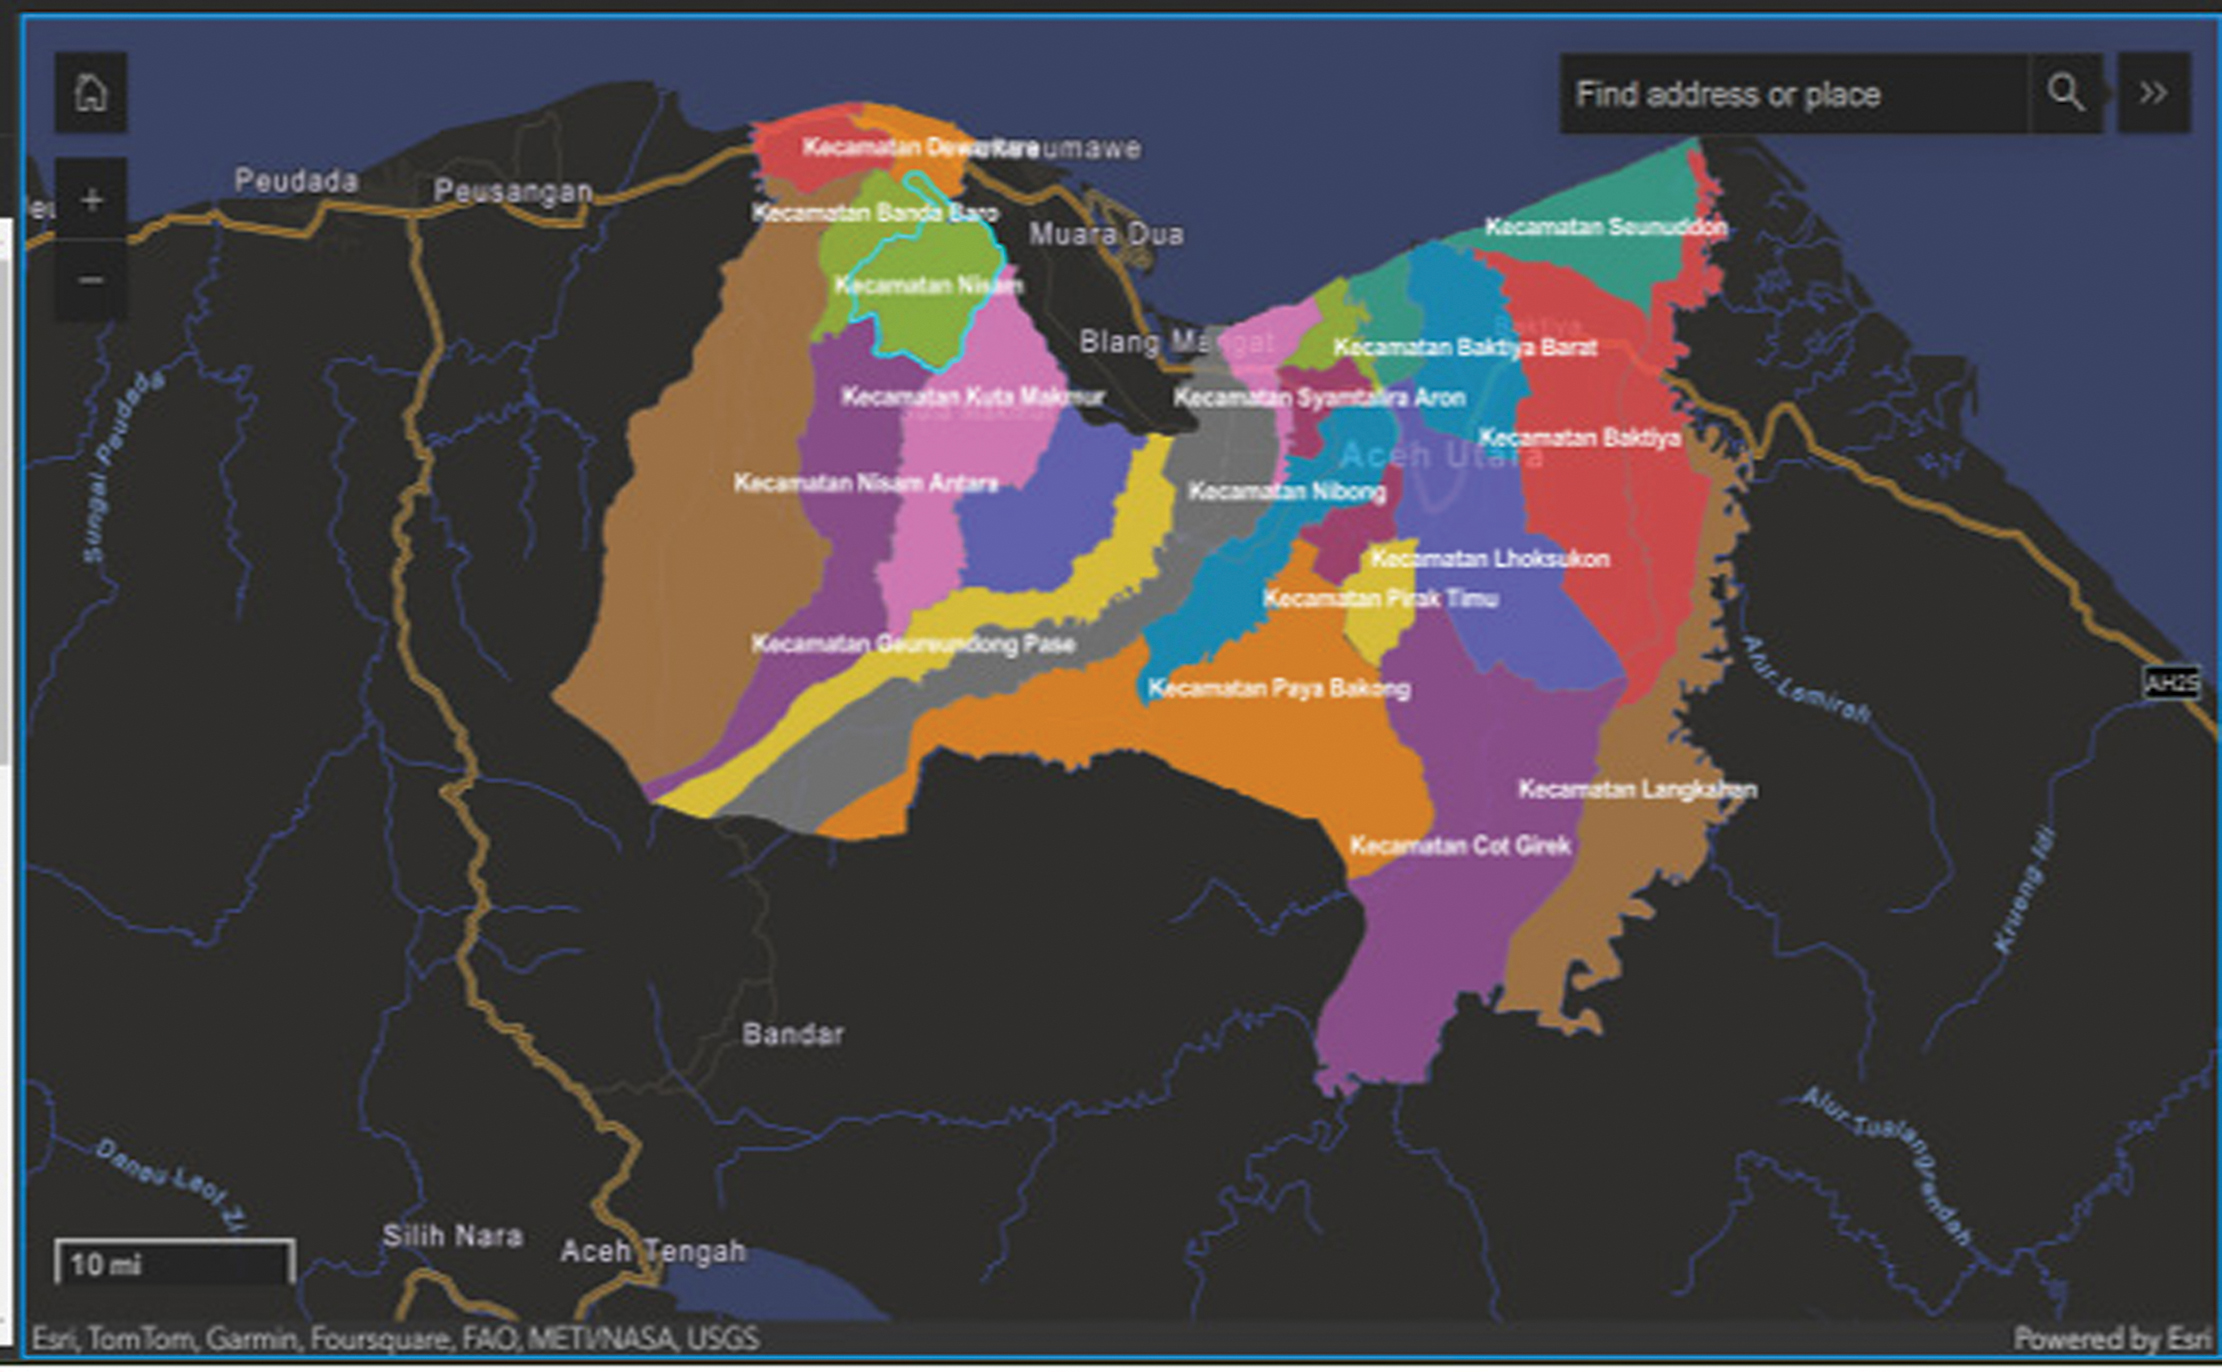 Fig. 3. Web GIS display of agricultural production results in North Aceh regency.
Figure 4, which is a layout map that visualizes the clustering of agricultural production, shows that each sub-district has diverse production results, but rice crops still dominate overall in each sub-district with the highest production results.
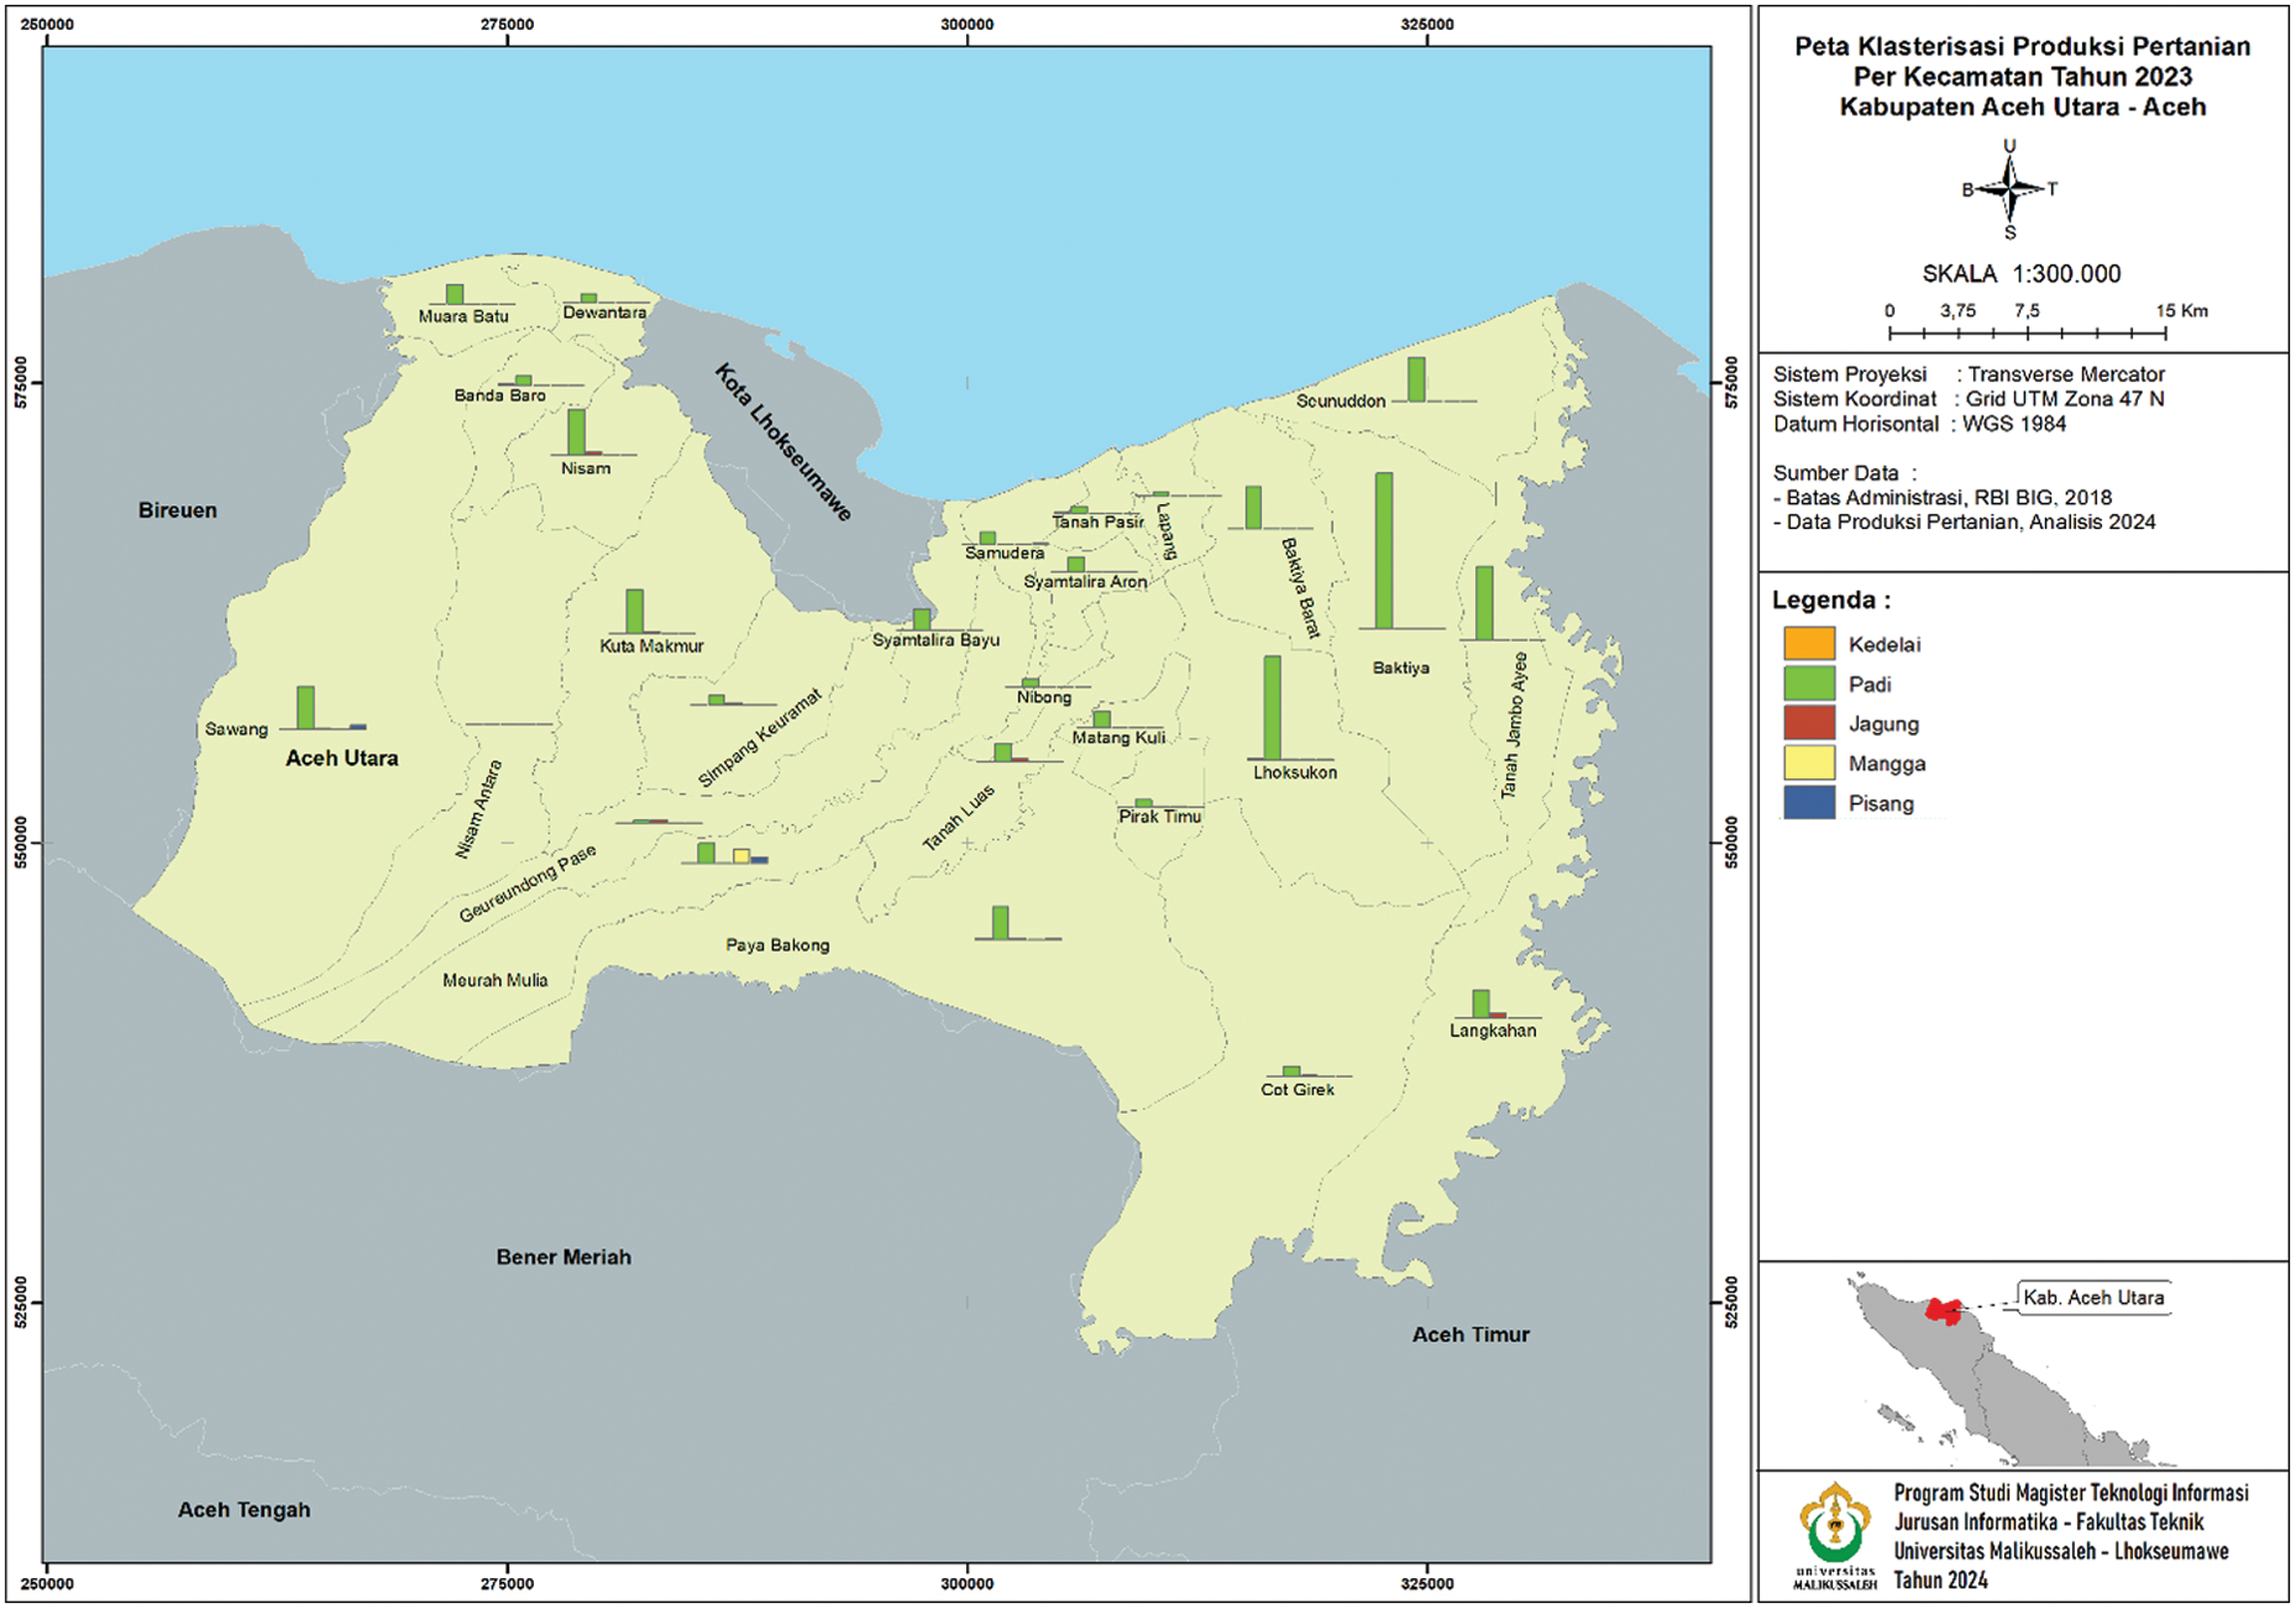 Fig. 4. Layout map of agricultural production clustering results of North Aceh regency.
V.CONCLUSIONS
The research successfully implemented the K-Medoids algorithm to cluster agricultural production in North Aceh Regency into three categories: high-production cluster (C1), medium-production cluster (C2), and low-production cluster (C3). The study utilized 25 agricultural production data points from 27 sub-districts in North Aceh District in 2023. The high production cluster (C1) included rice, soybean, mango, starfruit, guava, water guava, Siamese oranges, big orange, mangosteen, pineapple, mustard greens, soursop, breadfruit, gnetum, twisted cluster bean, and duku. The medium production cluster (C2) comprised corn, durian, papaya, banana, rambutan, jackfruit, and jengkol, while the low-production cluster (C3) included avocado and snake fruit. The clustering results were visualized on a GIS-based map. This research aimed to assist local governments and other stakeholders in decision-making related to planning and managing agricultural production for food security. The findings demonstrated that the K-Medoids algorithm and GIS could effectively cluster and map agricultural production in North Aceh District.
Future studies are encouraged to compare different clustering methods, such as the K-means algorithm, to identify the most effective approach for agricultural production clustering.