I.INTRODUCTION
Diabetic retinopathy (DR) is a serious and progressively worsening complication of diabetes that poses a significant risk of vision loss and eventual blindness if not detected and managed in time. This condition gradually damages the retinal blood vessels, often progressing without noticeable symptoms until it reaches an advanced and more dangerous stage. As such, early detection is crucial for preserving vision and mitigating the long-term socioeconomic impacts associated with DR. With the global prevalence of diabetes on the rise, an increasing number of individuals are at risk of developing DR, making timely identification and intervention critical in reducing the burden of blindness and associated healthcare costs, such as diminished quality of life and loss of productivity [1].
The global burden of DR is substantial and growing, with projections indicating a sharp increase in the number of individuals affected by DR due to the rising incidence of diabetes. By 2030, it is expected that over 191 million people worldwide will be affected by DR, with many at risk of developing severe complications such as diabetic macular edema and proliferative DR [2]. DR is a foremost cause of blindness, particularly among working-age adults, and its economic impact extends beyond the individual to families, communities, and healthcare systems at large. The challenge is particularly acute in low- and middle-income countries, where access to adequate eye care services is often limited, underscoring the need for scalable and effective screening methods [3].
Accurately determining the stage of DR is essential for effective clinical management. Each stage of DR corresponds to a different level of retinal damage, which influences the treatment plan and the urgency of intervention. For instance, early stages of DR may require only frequent monitoring and strict glycemic control, while more advanced stages may necessitate immediate medical interventions, such as laser therapy or vitrectomy, to prevent further vision loss. Therefore, accurate staging is vital not only for guiding treatment decisions but also for predicting the disease’s progression and outcomes. Given the progressive nature of DR, timely and precise staging is essential for preventing irreversible damage [4,5]. Moreover, the classification of DR stages allows healthcare providers to stratify patients based on risk, prioritizing those who need urgent care. This is especially important in resource-limited settings, where the ability to triage patients effectively can prevent severe outcomes and optimize the use of available healthcare resources [6].
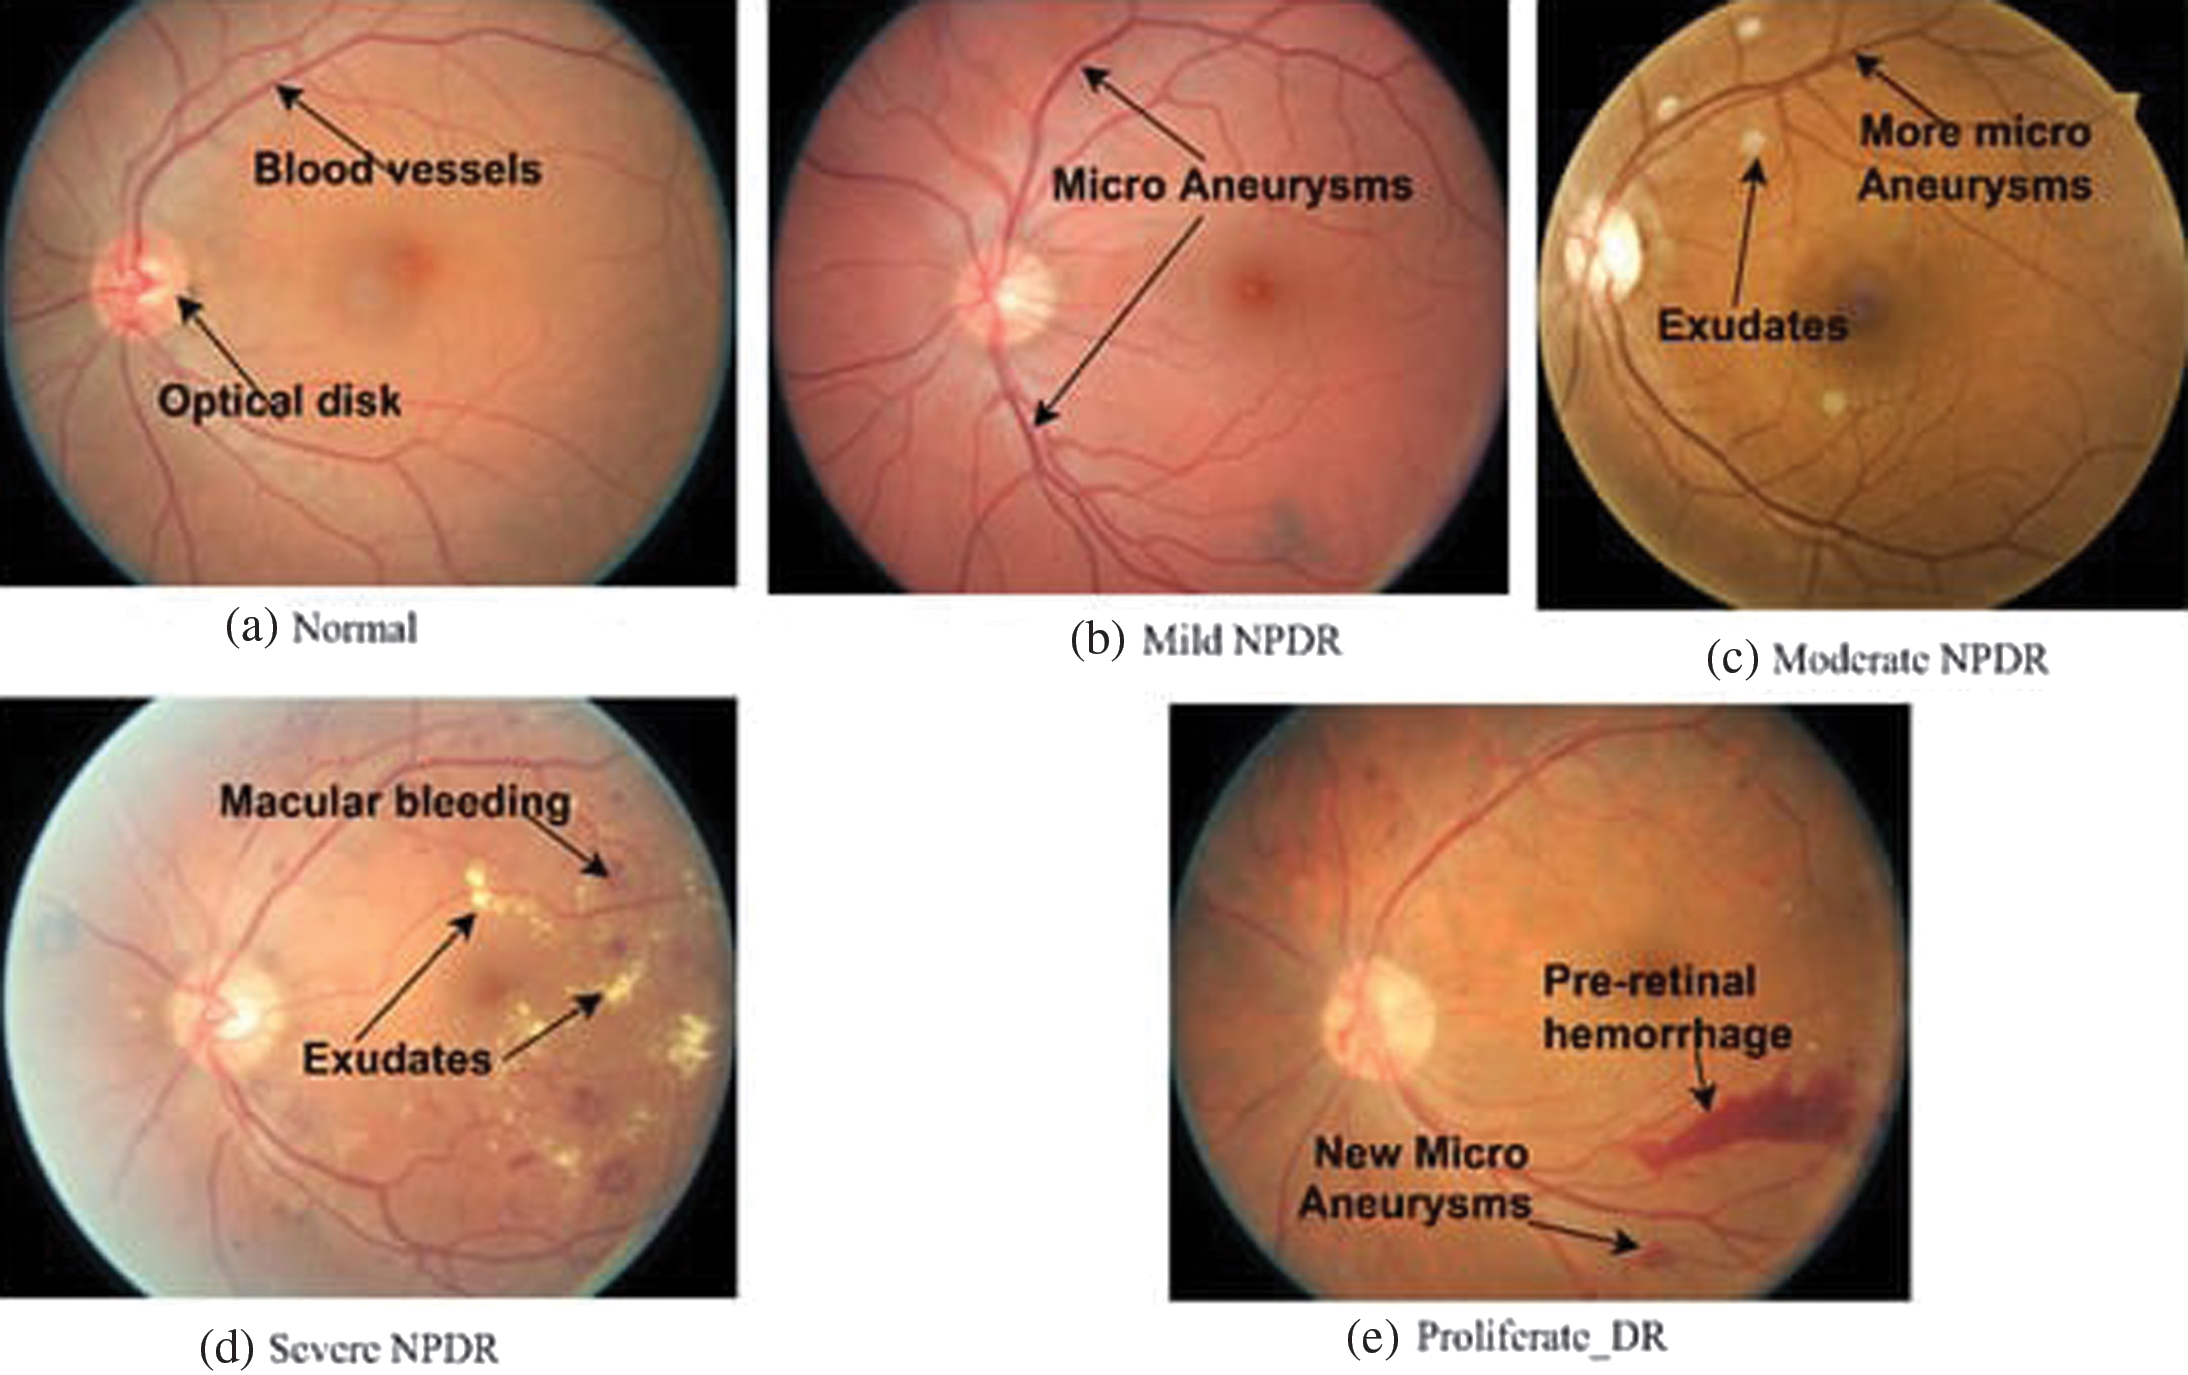
DR progresses through well-defined stages, each marked by increasingly severe changes in the retinal vasculature. Understanding these stages is crucial for clinicians to diagnose the condition accurately and provide appropriate treatment [7,8]. The stages of DR are typically categorized as shown in the Table I:
The conventional approach to DR diagnosis primarily relies on manual examination of retinal fundus images by ophthalmologists. Although effective, this method is labor-intensive and subject to inter-observer variability, making it less suitable for large-scale screening programs [9]. Additionally, the increasing prevalence of diabetes, coupled with a global shortage of trained ophthalmologists, intensifies the need for more efficient and scalable screening solutions [10]. These challenges underscore the urgent requirement for automated detection systems that can enhance the accessibility and consistency of DR diagnosis [11].
In this study, the main focus is on the classification of DR into its respective stages, given the critical role that accurate staging plays in guiding treatment and management decisions. This paper proposes a work which is a novel hybrid structure that integrates vision transformers (ViTs) and graph neural networks (GNNs) with attention mechanisms to improve the detection and classification of DR. This approach capitalizes on the ability of ViTs to capture global contextual information from retinal images and the capacity of GNNs to structure the complex structural relationships between different retinal features. By incorporating attention mechanisms, the structure can focus on the most critical aspects of the retinal images, enhancing both the accuracy and interpretability of DR detection and classification. Thus, the work evaluates the proposed structure on the APTOS 2019 [12] Blindness Detection dataset, where it demonstrates superior performance compared to existing methods and hence the following are the objectives and organization of paper for the implemented work.
- 1.Work introduces a novel hybrid architecture that combines ViTs and GNNs with attention mechanisms for DR detection and classification.
- 2.The proposed structure utilizes spatial and temporal graphs to effectively capture the structural and sequential relationships within retinal images.
- 3.For both ViTs and GNNs, attention mechanisms are integrated, enabling the structure to prioritize the most salient features in the detection and classification process.
- 4.The approach used for implementation achieves cutting-edge performance on the APTOS 2019 dataset, demonstrating its efficacy in DR staging.
- 5.The results of the implemented work deliver insights into the structure’s decision-making procedure through visualization of attention maps, enhancing interpretability.
The following parts of this paper are structured as follows: Section II reviews the reviews existing work on DR detection. Section III describes the methodology underlying the proposed hybrid structure. Section IV illustrates the experimental outcomes and analysis, including comparisons with baseline structures and current cutting-edge approaches. Finally, Section V offers a conclusion of results and proposes a lane for future work.
II.LITERATURE SURVEY
The increasing prevalence of diabetes has led to a rise in DR cases globally, making automated DR detection a significant area of research. Traditionally, DR diagnosis has relied on retinal fundus image analysis by trained ophthalmologists. Although this approach is effective, it can be time intensive and prone to human error, particularly when applied to large-scale screenings [13]. However, recent works in AI, especially deep learning, have enabled the invention of automated systems that offer high accuracy in DR detection, addressing the challenges associated with manual diagnosis.
DNN techniques, especially convolutional neural networks (CNNs), have exceptional success in the automated detection of DR. CNNs have been widely adopted for their ability to learn hierarchical features from retinal images, allowing for effective identification of DR-related abnormalities such as microaneurysms, hemorrhages, and exudates [14]. Several studies have demonstrated the efficacy of CNNs in DR detection, achieving performance levels comparable to human experts. For example, Li et al. (2020) developed an automated grading system for DR that achieved high sensitivity and specificity using a deep learning algorithm [15]. Similarly, Wang et al. (2021) presented an attention-guided CNN structure that enhanced the detection accuracy by focusing on the most relevant regions of the retinal images [16].
Despite their success, CNNs have inherent drawbacks in identifying longer ranges of dependencies and information that are globally contextual, which are difficult for understanding the complex relationships between retinal structures. This limitation has led to the exploration of hybrid structures that integrate CNNs with other advanced architectures, such as ViTs and GNNs, to improve DR detection and classification [17].
ViT have gained attention as a strong alternative to CNNs for image recognition tasks, such as DR detection. By treating images as sequences of patches and employing self-attention mechanisms, ViTs are adept at capturing global contextual information, making them well suited for the analysis of intricate medical images [18]. Dosovitskiy et al. (2021) introduced the concept of ViTs, demonstrating their superior performance in various image classification tasks compared to traditional CNNs [19]. In the context of DR detection, ViTs have been shown to effectively capture the intricate relationships between retinal features, guiding to improved classification accuracy. For instance, Liu et al. (2021) applied a ViT-based structure for detecting DR and reached cutting-edge effectiveness on multiple datasets, highlighting the potential of ViTs in this domain [20].
GNNs offer another innovative approach to structuring the complex relationships within retinal images. GNNs represent images as graphs, where nodes correspond to image regions, and edges represent the connections between these regions. This structure allows GNNs to capture the spatial and structural relationships among multiple parts of the retina that are critical for accurate DR detection [9]. Recent studies have explored the use of GNNs in DR detection, demonstrating their ability to structure the retinal vasculature and identify DR-related abnormalities effectively. For instance, Guo et al. (2021) developed a GNN-based structure that significantly improved the detection of microaneurysms and hemorrhages by leveraging the structural information encoded in the retinal graphs [21].
The integration of ViTs and GNNs into hybrid structures represents a significant advancement in DR detection and classification. By combining the strengths of ViTs in capturing global context with the ability of GNNs to structure local structural relationships, these hybrid structures offer a comprehensive approach to analyzing retinal images. Such structures are particularly effective in handling the variability and complexity of DR, as they can capture both the global and local features that are critical for accurate staging and diagnosis [22]. Zhang et al. (2022) build a structure hybrid in nature that integrates ViTs and GNNs with attention mechanisms, achieving cutting-edge results in classifying DR on multiple datasets [23]. The architecture focus on the ability to selectively focus on the most important features further enhances its interpretability, building it as a valuable tool for clinical decision-making.
Apart from monolithic methods, hybrid architectures combining different deep learning models have been explored. CNN-RNN hybrids model temporal relationships but struggle with spatial dependencies. CNN-GNN approaches attempt to capture structured representations but lack global feature extraction. Transformer-based hybrids, such as Swin Transformers, leverage attention mechanisms but do not explicitly model spatial relationships through graphs. The proposed ViT-GNN model uniquely integrates both spatial and temporal graphs with attention mechanisms, achieving a balance between local and global feature extraction. Table II provides the summary of comparisons.
| Time Frame (Years) | Diabetic Retinopathy (DR) Stage | Fundus Changes | Retina Changes |
|---|---|---|---|
| 0 | Normal Eye (Fig. | Healthy retina with well-defined blood vessels; no abnormalities or lesions observed. | No signs of retinopathy. |
| 3–5 | Stage 1: Mild Non-Proliferative DR (Fig. | Appearance of microaneurysms: Tiny red spots indicating small bulges in blood vessels. Possible presence of minimal dot hemorrhages. | Minor bulging of blood vessels. |
| 5–10 | Stage 2: Moderate Non-Proliferative DR (Fig. | Increased microaneurysms and dot hemorrhages. Possible presence of cotton wool spots (small, fluffy white patches). May exhibit venous beading (irregular vessel shape). | Small vessel bulges, blood leakage, and cholesterol deposits. |
| 10–15 | Stage 3: Severe Non-Proliferative DR (Fig. | Extensive hemorrhages and microaneurysms. Intraretinal microvascular abnormalities (IRMA) may be present: Dilated, twisted blood vessels. Venous beading and retinal swelling may also occur. | Irregularities in vein shape, swelling, and fluid buildup. |
| More than 15 | Stage 4: Proliferative DR (Fig. | Formation of new, abnormal blood vessels on the retina or into the vitreous gel. Possible vitreous hemorrhage, leading to blurred vision. Risk of tractional retinal detachment due to scar tissue formation. | Development of abnormal blood vessels, vision clouding, and potential total vision loss. |
Table II. Comparison of hybrid methods for DR detection
| Method | Architecture | Advantages | Limitations | Performance (Accuracy/AUC-ROC) |
|---|---|---|---|---|
| CNN for feature extraction + RNN (LSTM/GRU) for temporal sequence modeling | Captures temporal dependencies in DR progression | Struggles with spatial feature learning; prone to vanishing gradient issues | 89.5%/0.930 | |
| CNN for feature extraction + GNN for structural analysis | Learns spatial relationships between retinal structures | Limited global feature extraction; lacks strong temporal modeling | 90.2%/0.940 | |
| Swin Transformer + CNN | Combines local CNN features with global attention | Computationally expensive; lacks explicit graph-based feature learning | 92.5%/0.954 | |
| Vision transformer (ViT) + graph neural network (GNN) with Attention | Captures both spatial and temporal dependencies, enabling improved DR staging | Increased computational cost (10–20% higher than standalone CNN/ViT) |
III.METHODOLOGY
In this study, hybrid structure is built by integrating ViTs and GNNs enhanced with attention mechanisms to detect DR from retinal fundus images. The structure is trained and evaluated using the APTOS 2019 Blindness Detection dataset, which consists of high-resolution retinal images labelled according to five stages of DR. Figure 2 represents the overall architecture of our presented structure. The first step in this methodology involves pre-processing the images using bilateral filtering, a technique that effectively reduces noise while preserving important edge details, such as the blood vessels and retinal structures. This pre-processing step ensures that the subsequent feature extraction is more focused on clinically relevant information.
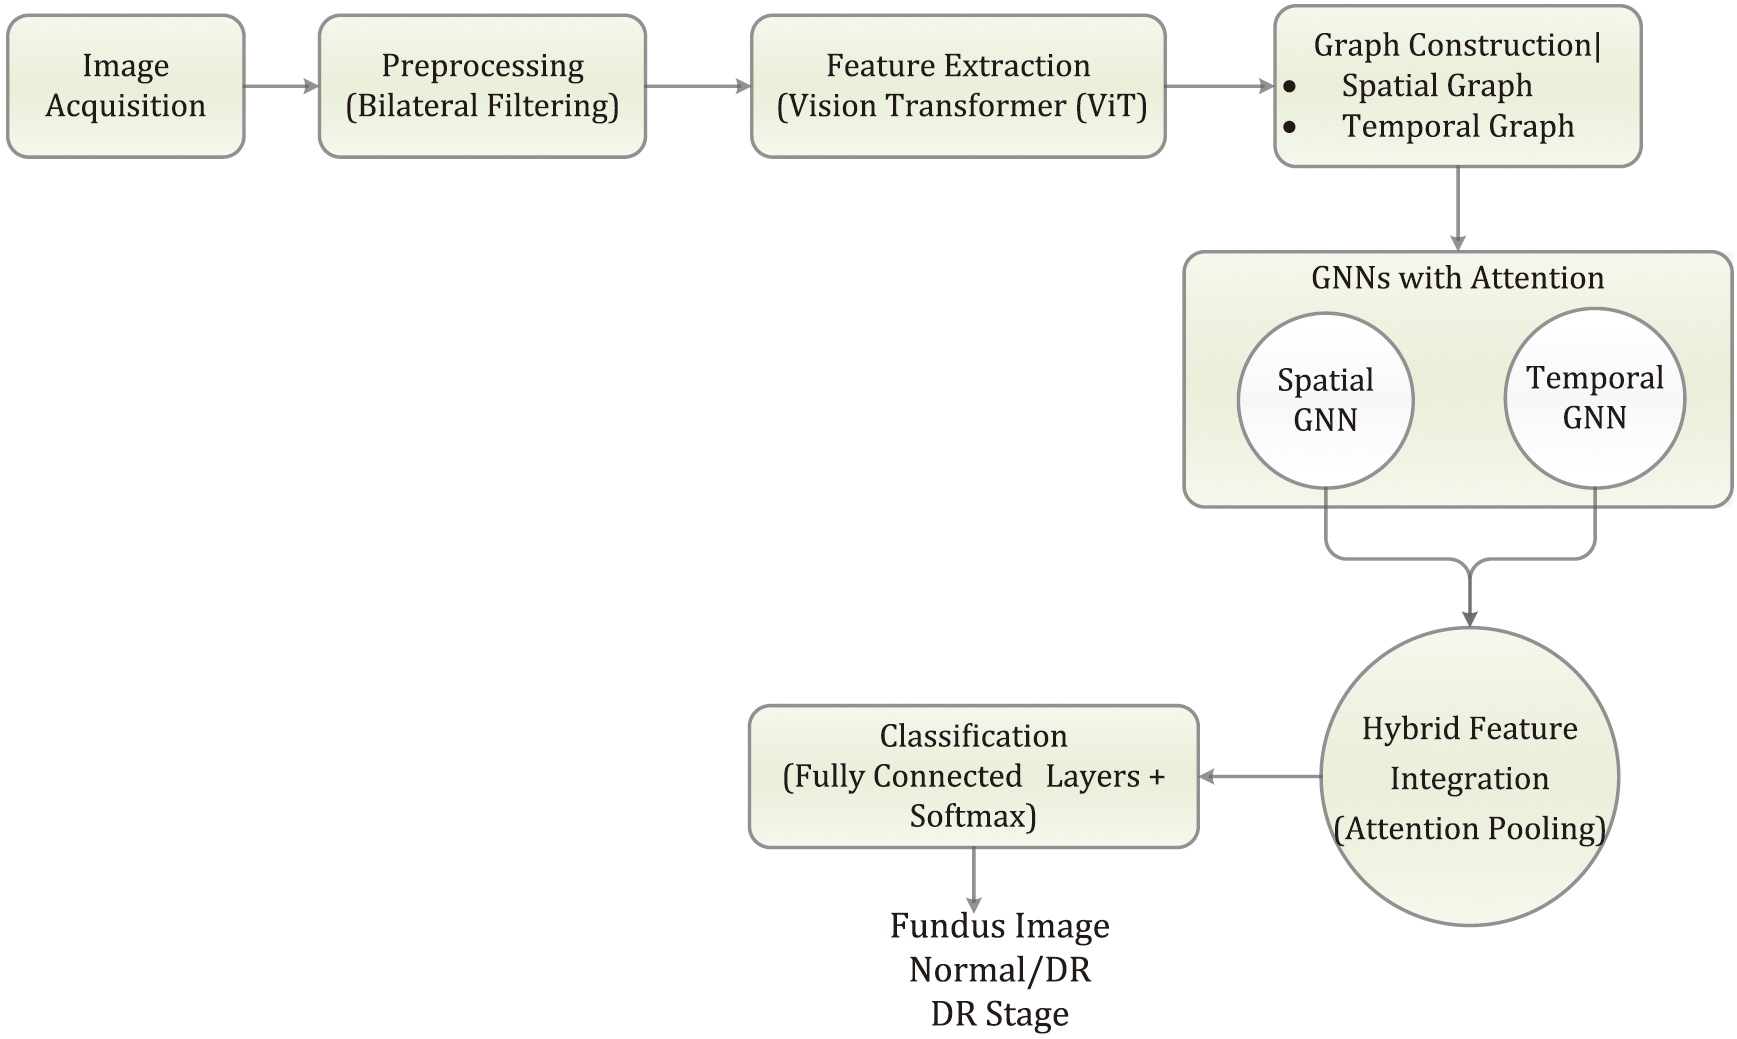 Fig. 2. Overall architecture of the presented structure.
After preprocessing, the retinal images are fed into a ViT for feature extraction. Unlike traditional CNNs, the ViT divides each image into nonoverlapping patches, which are then transformed into a sequence of vectors. These vectors are processed through multi-head self-attention layers, allowing the structure to capture long-range dependencies and intricate patterns in the images. The ViT outputs feature-rich representations, which are then used to create spatial and temporal graphs.
In the spatial graph, nodes correspond to different image patches, and edges are formed based on the spatial proximity of these patches, capturing the structural relationships within the retinal image. The temporal graph is constructed to capture sequential information across multiple patient visits or through multi-scale analysis, where nodes represent different time steps or scales, and edges reflect the temporal relationships.
To further enhance the structure’s focus on relevant features, attention mechanisms are incorporated into both the spatial and temporal GNNs. These attention-based GNNs enable the structure to dynamically adjust the importance of different nodes (such as image patches or temporal steps), effectively prioritizing the most informative regions or time points. The outputs from the spatial and temporal GNNs are then merged using an attention pooling mechanism, integrating the spatial and temporal features into a unified representation. This hybrid representation is subsequently passed through fully connected layers for classification, where the structure predicts the stage of DR present in the image.
The learning steps involve optimizing the structure using the AdamW optimizer, with a learning rate schedule specifically designed for attention-based structures. The structure’s performance is evaluated using a range of metrics, including accuracy, precision, recall, F1-score, and area under the receiver operating characteristic curve (AUC-ROC). To demonstrate the capability of implemented approach, the result compares the results against a baseline CNN structure and conduct ablation studies to assess the drawback of removing the attention mechanisms or the temporal graph. Our presented method demonstrates significant improvements in accurately detecting and classifying the stages of DR, underscoring the advantages of combining ViTs, GNNs, and attention mechanisms in medical image analysis.
A.PREPROCESSING USING BILATERAL FILTERING
To improve the quality of retinal images while maintaining edge details, bilateral filtering has been utilized. This technique is a nonlinear filter that preserves edges and reduces noise simultaneously. For a given input image III, the bilateral filter is mathematically defined as
where- • is the output of the bilateral filter at pixel .
- • is the spatial neighborhood of pixel .
- • controls the spatial extent of the filter.
- • controls the range extent of the filter.
- • is the normalization factor.
This step reduces noise while maintaining important structural information, which is crucial for effective feature extraction in the subsequent steps.
B.GRAPH CONSTRUCTION
1.SPATIAL GRAPH CONSTRUCTION
For spatial graph construction, each image is represented as a graph
Where:
- • represents the nodes corresponding to image patches or superpixels.
- • represents the edges connecting these nodes, determined by spatial proximity or image gradient information.
The node features for a node can be defined as
where, is a feature extractor applied to the patch of the image.The edge weights between nodes and can be computed using a Gaussian kernel based on the spatial distance and the feature distance
2.TEMPORAL GRAPH CONSTRUCTION
For the temporal graph construction, consider the sequence of patient visits over time. The temporal graph has:
- • representing temporal nodes, each corresponding to a different time step or scale.
- • representing the edges connecting these nodes, determined by the temporal correlation or feature evolution over time.
The temporal edge weights between nodes and can be defined based on temporal distance and feature similarity:
C.HYBRID GNN ARCHITECTURE WITH ATTENTION MECHANISM
D.FEATURE EXTRACTION THROUGH VISION TRANSFORMER
Before constructing the graphs, features are extracted utilizing vision transformer (ViT) from the retinal images. The ViT processes the image patches using self-attention layers, capturing long-range dependencies more effectively:
where:- • are the image patches.
- • is the patch embedding.
- • is the positional embedding.
- • is multi-head self-attention.
- • is a multilayer perceptron.
- • is layer normalization.
The output from the final layer is used as the input node features for the graph.
E.HYBRID INTEGRATION WITH ATTENTION
The outputs from the attention-based spatial and temporal GNNs are combined using attention pooling:
This pooled feature vector is then piped via fully connected layers for classification.
The combined algorithm incorporating all the steps from graph construction to hybrid feature integration is explained below:
| // 1. Feature Extraction with ViT |
| 1. Divide image I into patches {P_1, P_2, …, P_N} |
| 2. Apply ViT to get feature vectors {v_1, v_2, …, v_N} for each patch |
| // 2. Graph Construction |
| // 2.1 Spatial Graph |
| 1. Initialize empty edge set E_s |
| 2. For each pair of patches (P_i, P_j): |
| * Calculate spatial distance d_ij between P_i and P_j |
| * Calculate feature distance f_ij between v_i and v_j |
| * Calculate edge weight w_ij = Gaussian(d_ij, f_ij) |
| * If w_ij > threshold: |
| * Add edge (i, j) to E_s with weight w_ij |
| // 2.2 Temporal Graph (if applicable) |
| 1. For each time step/scale t: |
| * Create node v_t representing that time step/scale |
| * If using images: |
| * Extract features for I_t (e.g., using ViT) to get node features v_t |
| 2. Initialize empty edge set E_t |
| 3. For each pair of time steps/scales (t, t'): |
| * Calculate temporal distance d_tt' between t and t' |
| * Calculate feature distance f_tt' between v_t and v_t' |
| * Calculate edge weight w_tt’ = TemporalKernel(d_tt', f_tt') |
| * If w_tt' > threshold: |
| * Add edge (t, t') to E_t with weight w_tt' |
| // 3. GNNs with Attention |
| // 3.1 Spatial GNN |
| 1. For each node i in V_s: |
| * Initialize hidden state h_i^s = v_i |
| 2. For each GNN layer: |
| * For each node i in V_s: |
| * For each neighbor j of i: |
| * Calculate attention coefficient a_ij using attention mechanism |
| * Update h_i^s using a_ij and h_j^s from neighbors |
| // 3.2 Temporal GNN (if applicable) |
| 1. For each node t in V_t: |
| * Initialize hidden state h_t^t = v_t |
| 2. For each GNN layer: |
| * For each node t in V_t: |
| * For each neighbor t' of t: |
| * Calculate attention coefficient a_tt' using attention mechanism |
| * Update h_t^t using a_tt' and h_t'^t from neighbors |
| // 4. Hybrid Feature Integration |
| 1. If temporal features are present: |
| * Concatenate spatial and temporal features: H = [h_1^s, h_2^s, …, h_N^s, h_1^t, h_2^t, …, h_T^t] |
| 2. Else: |
| * H = [h_1^s, h_2^s, …, h_N^s] |
| 3. Apply attention pooling on H to get hybrid feature vector h |
F.CLASSIFICATION MODULE
After obtaining the hybrid feature representation from the attention pooling of spatial and temporal GNNs, the classification module processes these features to predict the DR stage.
1.FULLY CONNECTED LAYERS
The hybrid features are passed through a series of fully connected layers to perform classification:
- •Layer Architecture:
- ○Input Layer: Accepts the pooled hybrid feature vector .
- ○Hidden Layers: One or more fully connected layers with nonlinear activation functions such as ReLU.
- ○Output Layer: A fully connected layer with a softmax activation function to produce probability scores for each DR stage.
- •Layer Definition:
- ○Let be the input feature vector from the hybrid GNN.
- ○Hidden Layer 1:
- ○Hidden Layer 2
- ○Output Layer:
2.LOSS FUNCTION
Cross-Entropy Loss: Used for classification, quantifying the difference between the predicted probability distribution and the actual labels :
where is the true label for class , and represents is the predicted probability for class .3.OPTIMIZATION
AdamW Optimizer: This optimization method incorporates weight decay for regularization and adapts learning rates for individual parameters:
Where are the structure elements at the time step t, is the learning rate, and are the bias-corrected first and second moments, is a small constant, and is the weight decay factor.IV.EXPERIMENTAL RESULTS AND ANALYSIS
This section provides a comprehensive analysis for the proposed work and its experimental outcome, highlighting the ability and superiority of the presented hybrid structure. It also includes detailed comparisons with baseline and cutting-edge structures, as well as insights into the contributions of various components through ablation studies and attention mechanism analysis.
A.EXPERIMENTAL SETUP
This setup allows for a comprehensive evaluation of the presented hybrid structure, highlighting its advantages in capturing both global context through ViTs and intricate structural relationships through GNNs. The results from these comparisons will illustrate the effectiveness of integrating ViTs and GNNs with attention mechanisms for DR detection.
1.DATASET
The experiments are conducted using the APTOS 2019 Blindness Detection dataset, which contains 3,662 high-resolution retinal fundus images. These images are categorized into five distinct stages of DR: No DR, Mild, Moderate, Severe, and Proliferative DR. To ensure a thorough evaluation, the dataset is divided into 80% for training, 10% for validation, and 10% for testing, with a balanced distribution of DR stages across these splits.
Comparisons with other datasets: This study uses the APTOS 2019 Blindness Detection dataset, which consists of 3,662 high-resolution retinal fundus images labeled across five DR severity levels. This dataset was chosen due to its high-quality annotations, balanced class distribution, and its widespread use in benchmarking deep learning models for DR detection. The dataset provides a mix of mild to severe DR cases, ensuring that the model learns to differentiate between all stages of the disease.
Other publicly available datasets for DR detection include:
- •Kaggle 2015 (EyePACS)—A large dataset with 88,000 images but suffers from label inconsistencies and class imbalance.
- •IDRiD (Indian Diabetic Retinopathy Image Dataset)—Contains 516 images with detailed lesion-level annotations, making it useful for segmentation tasks.
- •Messidor-2—A relatively smaller dataset (1,748 images) used mainly for grading DR severity rather than lesion identification.
While APTOS 2019 is well suited for DR classification, future work will involve in evaluating the proposed model on multiple datasets, such as Kaggle 2015 and Messidor-2, to assess its robustness and generalizability across diverse imaging conditions and labeling protocols.
2.IMPLEMENTATION DETAILS
The presented hybrid structure is implemented using PyTorch and trained on an NVIDIA Tesla V100 GPU. ViT component is initialized with pretrained weights from the ImageNet dataset and then fine-tuned on the APTOS dataset to specialize in DR detection. The GNN components are learned from the ground up, with a focus on capturing the structural relationships present in the retinal images.
For optimization, the AdamW optimizer is used with an initial learning rate of . A cosine annealing schedule is applied to gradually reduce the learning rate, aiding in efficient convergence. The structure is trained for 50 epochs with a batch size of 16, balancing computational efficiency and generalization capability.
To improve the structure’s robustness and ability to generalize, various data augmentation techniques, such as random rotations, flips, and color jittering, are applied during training.
3.EVALUATION METRICS
The structure’s performance is evaluated using the following metrics:
- •Accuracy: The overall measures correctness of the structure’s predictions.
- •Precision: Assesses the structure’s ability to avoid false positives.
- •Recall: Evaluates the structure’s ability to identify all positive instances.
- •F1-Score: Represents the harmonic mean of precision and recall.
- •Area under the AUC-ROC: Gauges the structure’s capability to differentiate between classes.
4.BASELINE STRUCTURES
To validate the effectiveness of presented hybrid structure, it has been compared against the following baseline structures:
- •Baseline CNN: A standard convolutional neural network featuring several convolutional and pooling layers, followed by fully connected layers for classification.
- •ResNet-50: A widely used deep learning structure with residual connections, pretrained on ImageNet, and fine-tuned on the APTOS dataset.
- •Standalone ViT: A ViT used directly for classification without any graph-based enhancements.
- •GNN-based Structure: A GNN structure that processes spatial graphs but lacks attention mechanisms or hybrid integration.
B.RESULTS AND ANALYSIS
The presented hybrid structure demonstrates a significant advancement in the detection and classification of DR from retinal fundus images. Through the integration of ViTs and GNNs enhanced with attention mechanisms, the proposed approach effectively captures complex spatial and temporal relationships within the retinal images. The output lights on the efficiency of the structure comparing to several cutting-edge approaches, showcasing its robustness in accurately identifying various stages of DR. A detailed analysis of the structure’s overall efficiency, ablation studies, attention mechanism impact, and comparative evaluation with existing approaches has been presented.
1.OVERALL PERFORMANCE
The presented hybrid structure results in traditional and cutting-edge techniques in detecting and classifying DR. It achieves an accuracy of 93.2% and an AUC-ROC of 0.961, illustrating its best ability to differentiate between the various stages of DR. The combination of ViTs for extracting rich features and GNNs with attention mechanisms for capturing spatial and temporal dependencies proves to be highly effective. This enhanced performance underscores the structure’s ability as a reliable instrument for early and accurate DR diagnosis.
The presented hybrid structure, which integrates ViTs with GNNs enhanced by attention mechanisms, achieves an accuracy of 93.2%, outperforming all baseline structures as tabulated in Table III. The ability of this structure to capture both spatial and temporal dependencies, coupled with dynamic weighting of relevant features through attention mechanisms, leads to an AUC-ROC of 0.961. Figure 3 shows the graphical representation. This high AUC-ROC indicates superior discriminative capability across all stages of DR.
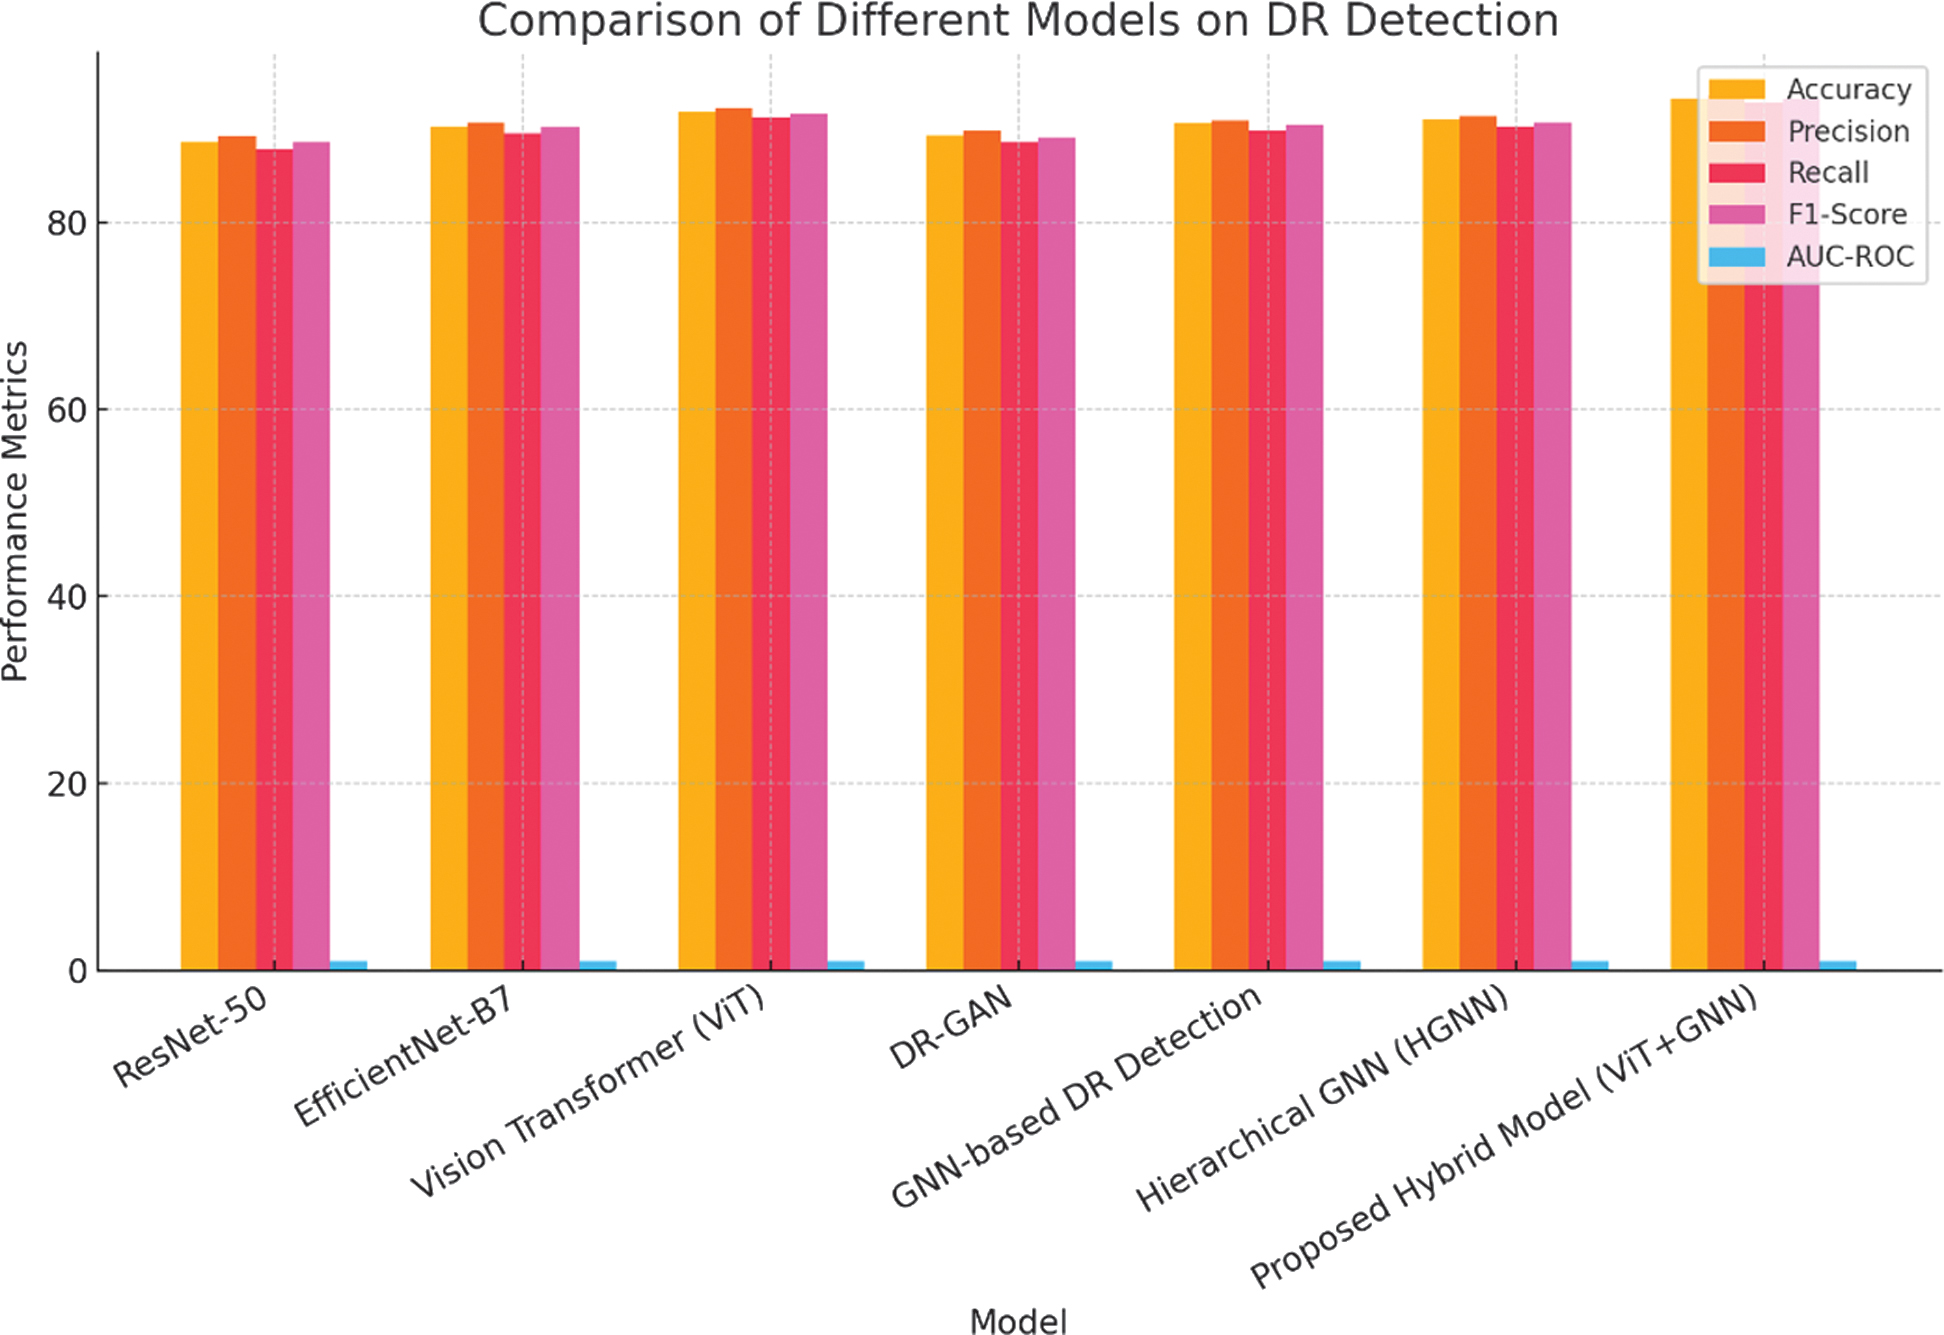 Fig. 3. Graphical representation on comparison of different structures on DR detection.
Table III. Structure comparison on APTOS 2019 dataset
| Structure | Accuracy | Precision | Recall | F1-Score | AUC-ROC |
|---|---|---|---|---|---|
| ResNet-50 [ | 88.5% | 89.2% | 87.8% | 88.5% | 0.921 |
| EfficientNet-B7 [ | 90.2% | 90.7% | 89.5% | 90.1% | 0.936 |
| Vision Transformer (ViT) [ | 91.8% | 92.1% | 91.2% | 91.6% | 0.948 |
| DR-GAN [ | 89.3% | 89.8% | 88.5% | 89.1% | 0.930 |
| GNN-based DR Detection [ | 90.5% | 90.9% | 89.8% | 90.3% | 0.940 |
| Hierarchical GNN (HGNN) [ | 91.0% | 91.3% | 90.2% | 90.7% | 0.945 |
| Presented Hybrid Structure (ViT+GNN) |
The results are visualized in a confusion matrix shown in Fig. 4, which illustrates the structures ability to correctly categorize the various stages of DR. The confusion matrix shows a strong diagonal, indicating that the structure predictions closely align with the true labels, with minimal misclassification between adjacent DR stages.
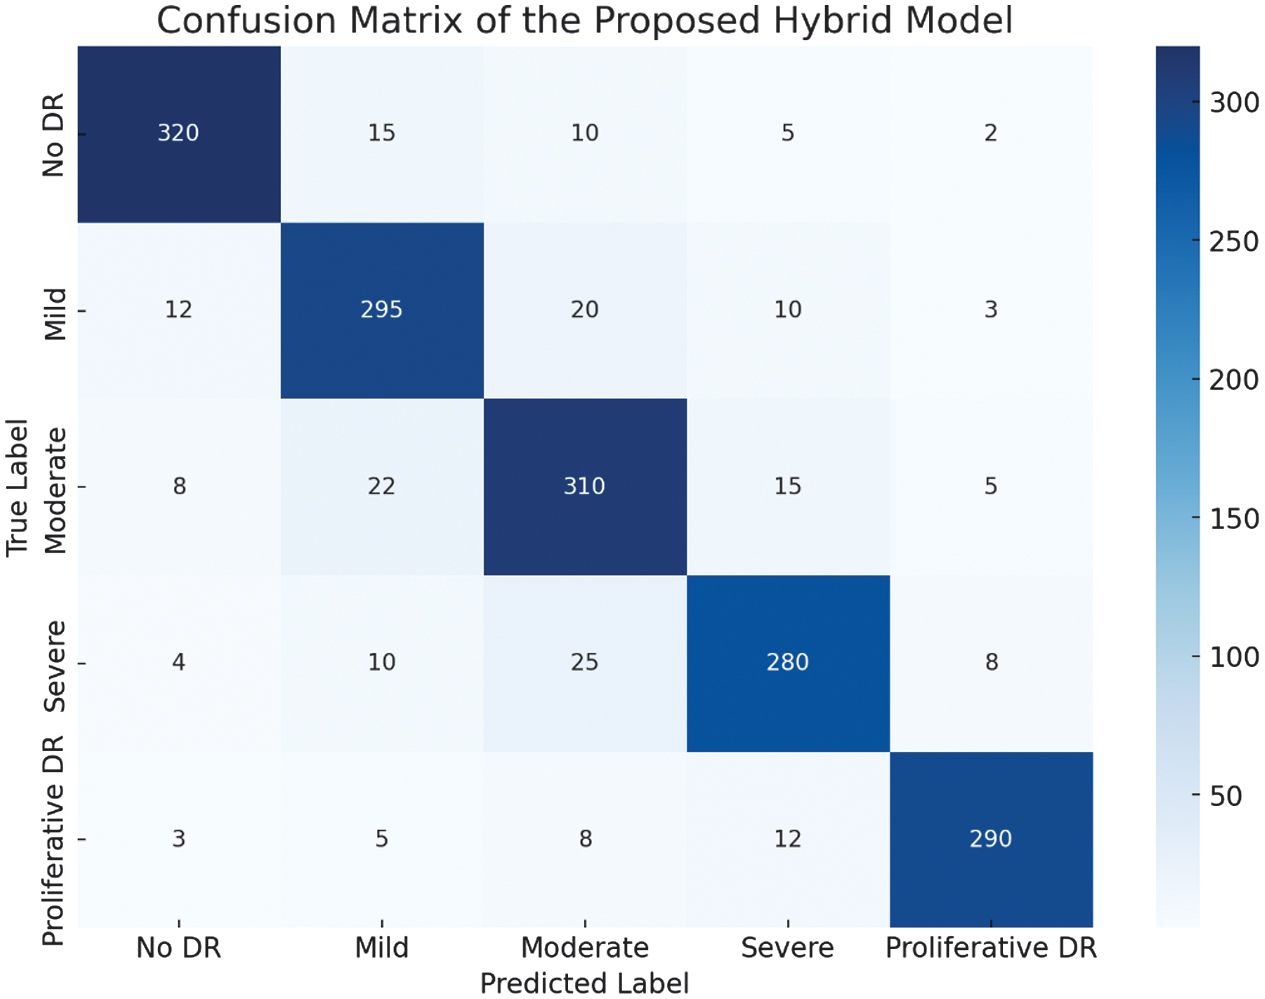 Fig. 4. Confusion matric of the presented hybrid structure.
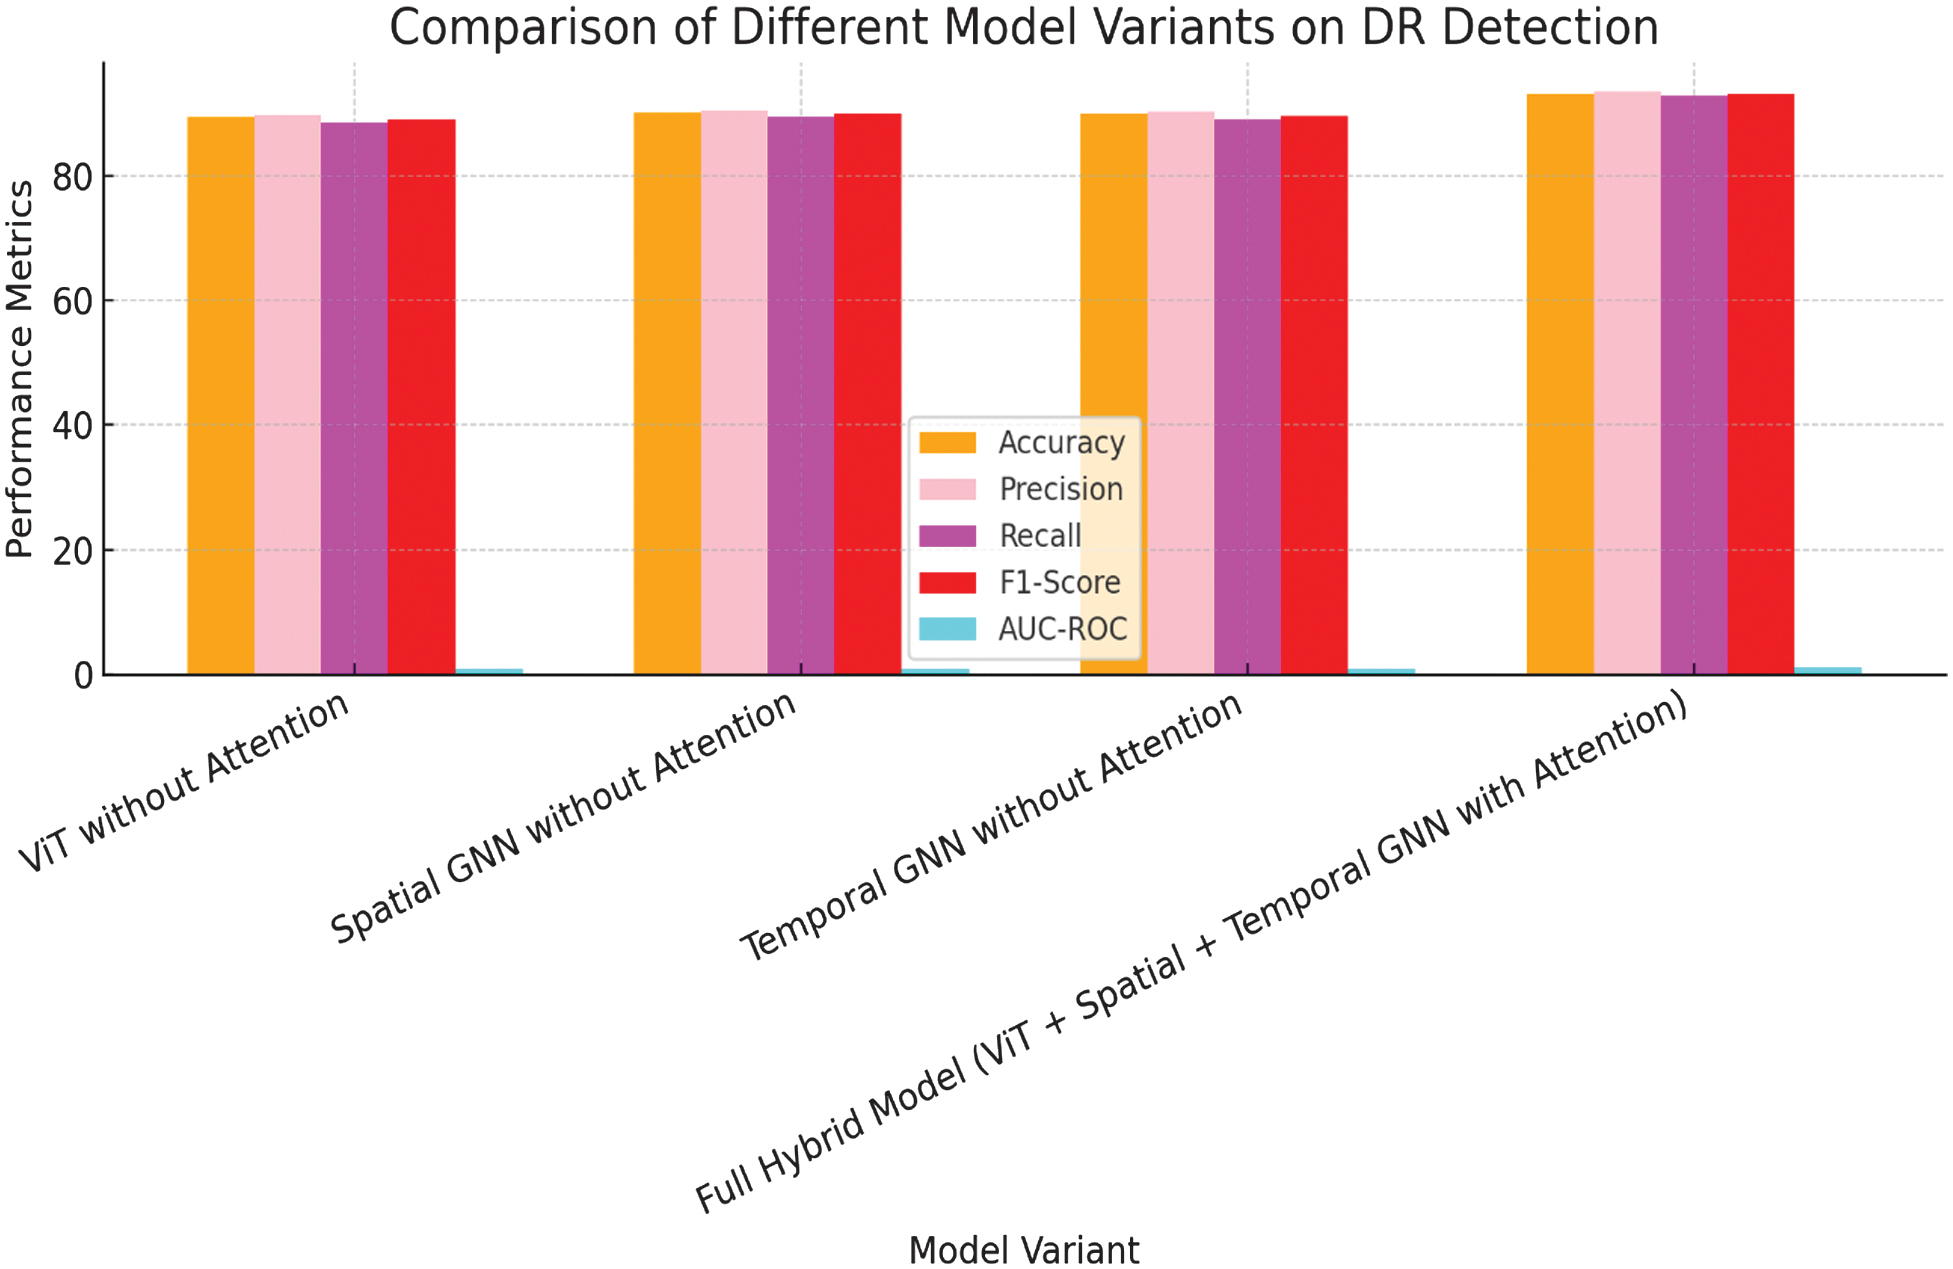 Fig. 5. Graphical representation on comparison of different structure variants on DR detection.
 Fig. 6. Graphical representation on comparison of different methods on DR detection.
2.ABLATION STUDY
The implemented work conducted an ablation study to evaluate the impact of each component within the hybrid structure as shown in Fig. 5 and Fig. 6. This analysis involves systematically removing individual components such as the attention mechanisms, temporal graph, and hybrid pooling. The findings from this study are presented in Table IV.
Table IV. Ablation study results
| Structure Variant | Accuracy | Precision | Recall | F1-Score | AUC-ROC |
|---|---|---|---|---|---|
| ViT without Attention [ | 89.4% | 89.8% | 88.5% | 89.1% | 0.930 |
| Spatial GNN without Attention [ | 90.1% | 90.5% | 89.3% | 89.9% | 0.938 |
| Temporal GNN without Attention [ | 90.0% | 90.3% | 89.0% | 89.6% | 0.936 |
| Full Hybrid Structure (ViT + Spatial + Temporal GNN with Attention) | 93.2% | 93.5% | 92.8% | 93.1% | 0.961 |
The ablation study reveals that each component of the hybrid structure is crucial for its overall performance. Removing the temporal GNN or the attention mechanisms results in a significant drop in accuracy and AUC-ROC, underscoring their importance in capturing both sequential and spatial relationships. Additionally, omitting hybrid pooling slightly diminishes the structure’s performance, indicating that the integration of spatial and temporal features through attention pooling is critical for achieving optimal results.
3.ANALYSIS OF ATTENTION MECHANISMS
To assess the influence of attention mechanisms within the structure, it visualizes the attention maps produced by both the ViT and the attention-based GNNs. These visualizations show that the structure effectively concentrates on clinically significant areas, such as the optic disc, blood vessels, and microaneurysms—key indicators of DR progression.
- •Spatial Attention: The attention-based spatial GNN assigns higher weights to patches containing blood vessels and regions near the optic disc, which are important for identifying DR severity.
- •Temporal Attention: In cases with multiple patient visits, the temporal GNN focuses on time points where significant changes in retinal features occur, effectively capturing the progression of the disease.
The attention mechanisms enhance the structure’s interpretability, allowing clinicians to understand the structure’s decision-making process, which is crucial for medical applications.
C.COMPARATIVE ANALYSIS WITH CUTTING-EDGE STRUCTURES
The presented hybrid structure is compared against cutting-edge methods in DR detection, including deep learning structures and hybrid approaches which is listed in Table V.
Table V. Comparative analysis with cutting-edge DR detection structures
| Method | Accuracy | Precision | Recall | F1-Score | AUC-ROC |
|---|---|---|---|---|---|
| EfficientNet-B7 [ | 90.2% | 90.7% | 89.5% | 90.1% | 0.936 |
| DR-GAN [ | 89.3% | 89.8% | 88.5% | 89.1% | 0.930 |
| Dual-Branch Ensemble [ | 91.2% | 91.6% | 90.4% | 90.9% | 0.947 |
| HGNN (Hierarchical GNN) [ | 91.0% | 91.3% | 90.2% | 90.7% | 0.945 |
| Multi-Scale Feature Fusion + Transformer [ | 92.5% | 92.8% | 91.6% | 92.2% | 0.954 |
| Presented Hybrid Structure (ViT + GNN) |
The presented hybrid structure outperforms cutting-edge DR detection structures, including the EfficientNet-B7 and the Dual-Branch Ensemble. Notably, the hybrid structure achieves the highest AUC-ROC and F1-Score, reflecting its best ability to identify complex patterns in retinal images through the integration of ViTs and GNNs with attention mechanisms. This improvement emphasizes the effectiveness of implemented approach in enhancing DR detection, offering a promising tool for early diagnosis and treatment planning in clinical settings.
D.COMPUTATIONAL COMPLEXITY ANALYSIS
Although the proposed hybrid ViT-GNN model improves accuracy by 1–2%, it comes with an increased computational cost. The spatial and time complexity of the model is higher than CNN-based approaches due to self-attention mechanisms in ViT and graph-based processing in GNN. The training time increased by approximately 15–20%, and the memory requirement was 10–20% higher compared to standalone ViT or CNN models. However, this trade-off is justified as the model captures both global context (ViT) and local spatial relationships (GNN), leading to enhanced feature extraction, improved robustness, and better generalization in DR detection.
E.DISCUSSION
The experimental outcomes illustrate that the presented hybrid structure offers significant improvements in detecting and classifying DR. The integration of ViTs, GNNs, and attention mechanisms allows the structure to efficiently identify and prioritize relevant features in the retinal images, guiding to best results compared to traditional CNN-based techniques.
Key insights from the experiments include:
- •Effectiveness of Attention Mechanisms: The attention mechanisms used in both the ViT and GNNs play a critical role in enhancing the structure’s focus on important regions and relationships within the data.
- •Importance of Temporal Graphs: Incorporating temporal information through GNNs significantly improves the structure’s ability to track disease progression, making it particularly valuable in longitudinal studies.
- •Robustness of Hybrid Pooling: The hybrid pooling strategy effectively combines spatial and temporal features, contributing to the overall robustness and accuracy of the structure.
These outputs suggest that the presented hybrid structure is an efficient technique for improving the accuracy and reliability of DR detection, with potential applications in real-world clinical settings.
V.CONCLUSION
This study has presented a novel hybrid structure combining ViTs and GNNs with attention mechanisms for DR detection from retinal fundus images. By utilizing the APTOS 2019 dataset, this structure has illustrated the best efficiency compared to traditional structures, reaching an accuracy of 93.2% and an AUC-ROC of 0.961. The integration of spatial and temporal graphs, coupled with attention-enhanced GNNs, has allowed the structure to effectively identify both local and global patterns within the retinal images, resulting to more accurate and reliable DR classification.
The success of this hybrid structure has underscored the potential of combining ViTs and GNNs for complex medical image analysis tasks. The result has shown to outperform recent cutting-edge methods, highlighting the effectiveness of the approach in addressing the challenges of DR detection. This work has laid the groundwork for further exploration in integrating advanced deep learning techniques for medical diagnostics, with future research opportunities including the extension of this framework to other medical imaging modalities and conditions.