I.INTRODUCTION
The stock market offers significant opportunities for investors seeking substantial profits, making stock price prediction a critical endeavour [1]. With the increasing volume of trading and investment activities, there is a growing demand for effective strategies that can maximize returns while minimizing risks [2]. In India, the National Stock Exchange (NSE) and Bombay Stock Exchange (BSE) play a pivotal role in the financial landscape, with indices like Nifty and Sensex reflecting extensive market activity [3]. Despite advancements in financial analytics, predicting stock prices remains a challenging task due to the inherent volatility and complexity of market conditions [4].
II.FORECASTING METHODOLOGIES
Over the years, various forecasting methodologies have been employed to predict stock prices, each addressing different aspects of market behavior [5]:
- 1.Time Series Analysis: This method relies on historical data to identify trends and patterns, providing essential insights for forecasting market fluctuations [6].
- 2.Fundamental Analysis: Popularized by investors like Warren Buffett, this technique evaluates a stock’s intrinsic value by analysing financial metrics such as the Price-to-Earnings (P/E) ratio [7].
- 3.Technical Analysis: This approach focuses on historical price trends, utilizing indicators such as moving averages, the Relative Strength Index (RSI), and Bollinger Bands to anticipate short-term price movements [8]. These tools help identify trends, reversals, and critical entry and exit points, enabling traders to make informed decisions.
Despite their widespread application in industries ranging from insurance firms to government agencies, traditional forecasting methods face limitations [9]. These include challenges related to rapid market fluctuations, sector-specific variability, and the complex interactions of global economic factors [10]. These challenges highlight the need for innovative solutions that can integrate multiple data sources and analytical techniques [11].
A.CONTRIBUTIONS OF THIS RESEARCH
This study introduces a novel hybrid LSTM-CNN model to address the challenges in stock price prediction. The key contributions of this research are as follows:
- 1.Proposed Hybrid Architecture: Development of a hybrid LSTM-CNN model, combining LSTM’s ability to capture long-term dependencies and CNN’s effectiveness in feature extraction, resulting in enhanced predictive accuracy.
- 2.Comprehensive Evaluation: Rigorous performance analysis of the hybrid model using real-world data from NSE-listed companies, demonstrating its superiority over individual LSTM and CNN models.
- 3.Addressing Market Challenges: Identification and mitigation of key challenges such as market volatility, sector-specific variability, and rapid fluctuations, offering actionable insights for investors and analysts.
- 4.Practical Applications: A discussion on how the model can improve investment strategies, risk management, and financial decision-making in diverse market conditions.
By bridging the gaps in existing forecasting models, this research contributes to the advancement of machine learning methodologies in financial analytics, empowering stakeholders across the stock market ecosystem to make data-driven decisions with greater confidence.
B.CHOICE OF CNN AND LSTM
The decision to employ CNN and LSTM for stock market prediction is driven by their complementary strengths [12]. CNN is effective in extracting complex spatial patterns from data, while LSTM is designed to capture long-term dependencies in time-series data [13]. These characteristics are essential for understanding the dynamic and volatile nature of stock market behaviour. While similar hybrid integrations of CNN and LSTM have been explored in the literature, this study advances the state-of-the-art by introducing unique pre-processing techniques and innovative training strategies [14]. These contributions specifically enhance the performance of stock market prediction models, addressing existing gaps in prediction accuracy and computational efficiency.
III.LITERATURE REVIEW
Ongoing research in stock price prediction using machine learning techniques, particularly Long Short-Term Memory (LSTM), has demonstrated promising results in forecasting stock prices by capturing temporal dependencies [15]. LSTM has emerged as a powerful tool for time series analysis due to its ability to manage sequential data effectively. Recently, hybrid models integrating LSTM with Convolutional Neural Networks (CNN) or attention mechanisms have been explored to improve predictive accuracy in volatile financial environments [16]. This section reviews key studies in this domain, emphasizing their methodologies, datasets, findings, and research gaps.
B.OBSERVATIONS AND GAPS
Key observations from the reviewed studies include:
- •Outperformance of LSTM: LSTM consistently outperforms traditional models like SARIMA and even other deep learning models, such as CNN, in capturing intricate market dynamics [26].
- •Potential of Hybrid Models: Models like WT-LSTM and TRNN demonstrate significant improvements in forecasting accuracy, especially for noisy datasets.
- •Challenges in External Factors and Interpretability: Accounting for external factors, such as geopolitical events, remains a challenge. Additionally, improving the interpretability of machine learning models for stakeholders is an ongoing concern [27].
C.ADDRESSING RESEARCH GAPS
This study aims to bridge these gaps by developing a hybrid model that leverages both CNN and LSTM for enhanced stock price prediction. The proposed model focuses on:
- •Advanced Pre-processing Techniques: Implementing novel reprocessing strategies to handle noisy and non-stationary data.
- •Training Optimization: Employing robust training methodologies to minimize overfitting and enhance generalizability.
- •Model Efficiency: Ensuring computational efficiency for real-world deployment, particularly for volatile market conditions.
While advanced techniques like Transformers and attention mechanisms have shown promise in other domains, this study prioritizes CNN and LSTM due to their computational efficiency and proven effectiveness for stock market data. This novel hybrid approach seeks to advance the state-of-the-art in stock price prediction, offering valuable tools for investors and analysts.
D.PLANNED APPROACH
We have selected a combination of Convolutional Neural Networks (CNN) and Long Short-Term Memory (LSTM) due to their complementary strengths. CNNs are effective in capturing spatial features, while LSTMs excel at modelling temporal dependencies. This synergy enhances predictive accuracy for stock market forecasting, enabling us to effectively model both short-term patterns and long-term trends. Our hybrid model introduces an innovative architecture where CNN layers are strategically placed before the LSTM layers. This arrangement allows us to capture both spatial and temporal dependencies in stock market data. By doing so, we aim to optimize feature extraction from historical data while accurately modelling long-term trends. This approach has not been extensively explored in prior literature, offering a novel contribution to the field.
Additionally, we implement a novel pre-processing technique involving customized Min-Max scaling to handle outliers more effectively. This is followed by a feature selection process aimed at reducing noise in the stock market data. These steps have been shown to improve model stability and prediction accuracy, though they are not widely adopted in previous studies.
In conjunction with architectural and pre-processing innovations, we introduce a unique training strategy that employs dynamic learning rates and regularization techniques. This approach helps mitigate overfitting and significantly improves the model’s generalization ability, particularly when applied to real-world stock market data. The primary objective of stock market prediction is to accurately forecast the future value of company stocks and financial assets. Achieving this enables investors to gain valuable insights, make informed decisions, and potentially unlock financial gains while optimizing investment strategies. This is crucial across sectors such as business, industry, and finance. Accurate predictions empower stakeholders to navigate market complexities, manage risks, and make strategic decisions that enhance profitability and ensure long-term economic stability.
The structured workflow as shown in Figure 1 for this system consists of five pivotal modules:
- 1.Dataset Input: A comprehensive dataset is used to extract key attributes, such as open, high, low, close, and adjusted close prices.
- 2.Pre-processing: The extracted attributes undergo normalization and one-hot encoding to ensure uniformity and data quality.
- 3.Data Splitting: The dataset is divided into training and testing subsets using an 80:20 ratio for model training and validation.
- 4.Model Building and Training: Three distinct methodologies—LSTM, CNN, and Hybrid LSTM+CNN—are used to build predictive models, each leveraging its unique strengths to capture patterns in the data.
- 5.Predicted Result Output: The system generates predictions using the trained models, and evaluation metrics such as Root Mean Square Error (RMSE) are used to assess the accuracy and effectiveness of each model.
This systematic approach ensures comprehensive data handling, rigorous model development, and precise predictive capabilities, which are essential for navigating the complexities of stock market forecasting. While traditional methods like ARIMA and Support Vector Machines (SVM) are commonly used for stock market prediction, they were excluded from this study due to their limitations in capturing complex nonlinear patterns. The hybrid CNN+LSTM model was chosen for its ability to capture both spatial and temporal dependencies, which are crucial for predicting volatile stock market trends.
E.FUNCTIONING OF LSTM MODEL
Long Short-Term Memory (LSTM) is a significant advancement within the field of recurrent neural networks (RNNs) [28]. Unlike traditional RNNs, LSTM is specifically designed to handle long-term dependencies inherent in sequential data. Traditional RNNs struggle with retaining information over extended sequences, which can hinder their ability to make accurate predictions. LSTM overcomes this limitation by using memory cells that facilitate read, write, and forget operations to effectively manage the retention and flow of information.
LSTM’s architecture enables it to process and predict time-series data with remarkable precision. It is particularly well-suited for tasks such as stock market prediction, where capturing long-term dependencies is crucial. Figure 2 illustrates the LSTM architecture, including its components—input gate, forget gate, and output gate—which work together to handle and utilize historical context.
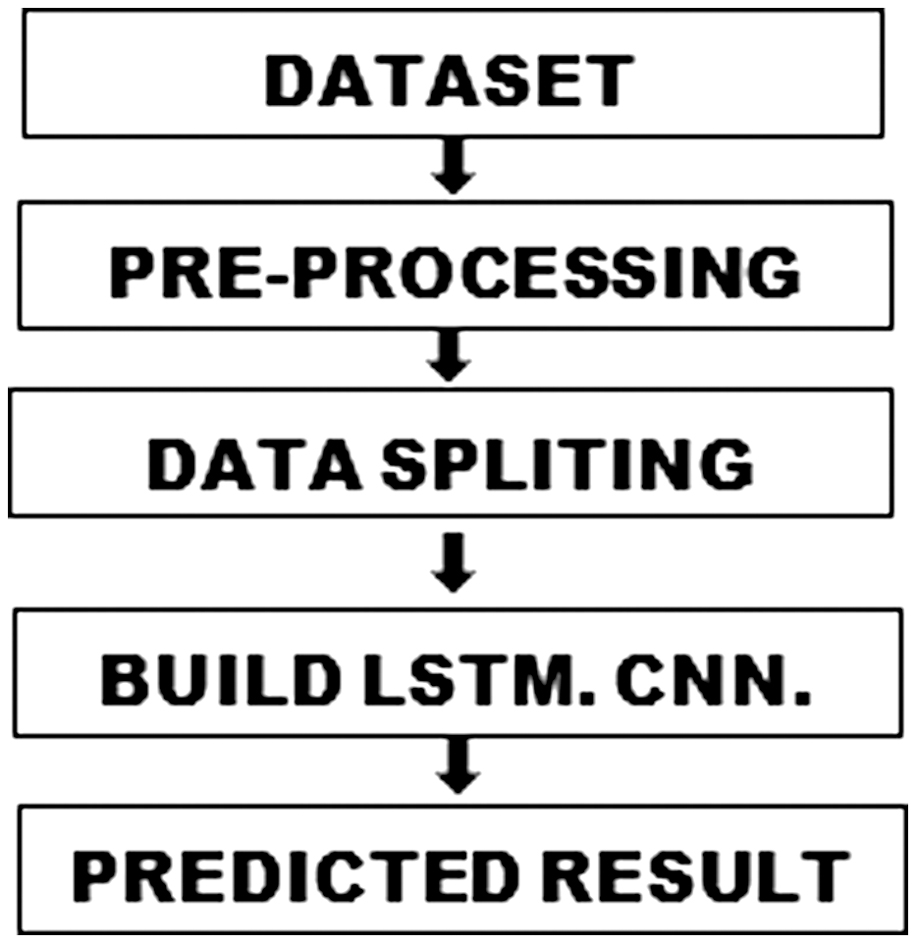 Fig. 1. Proposed workflow diagram.
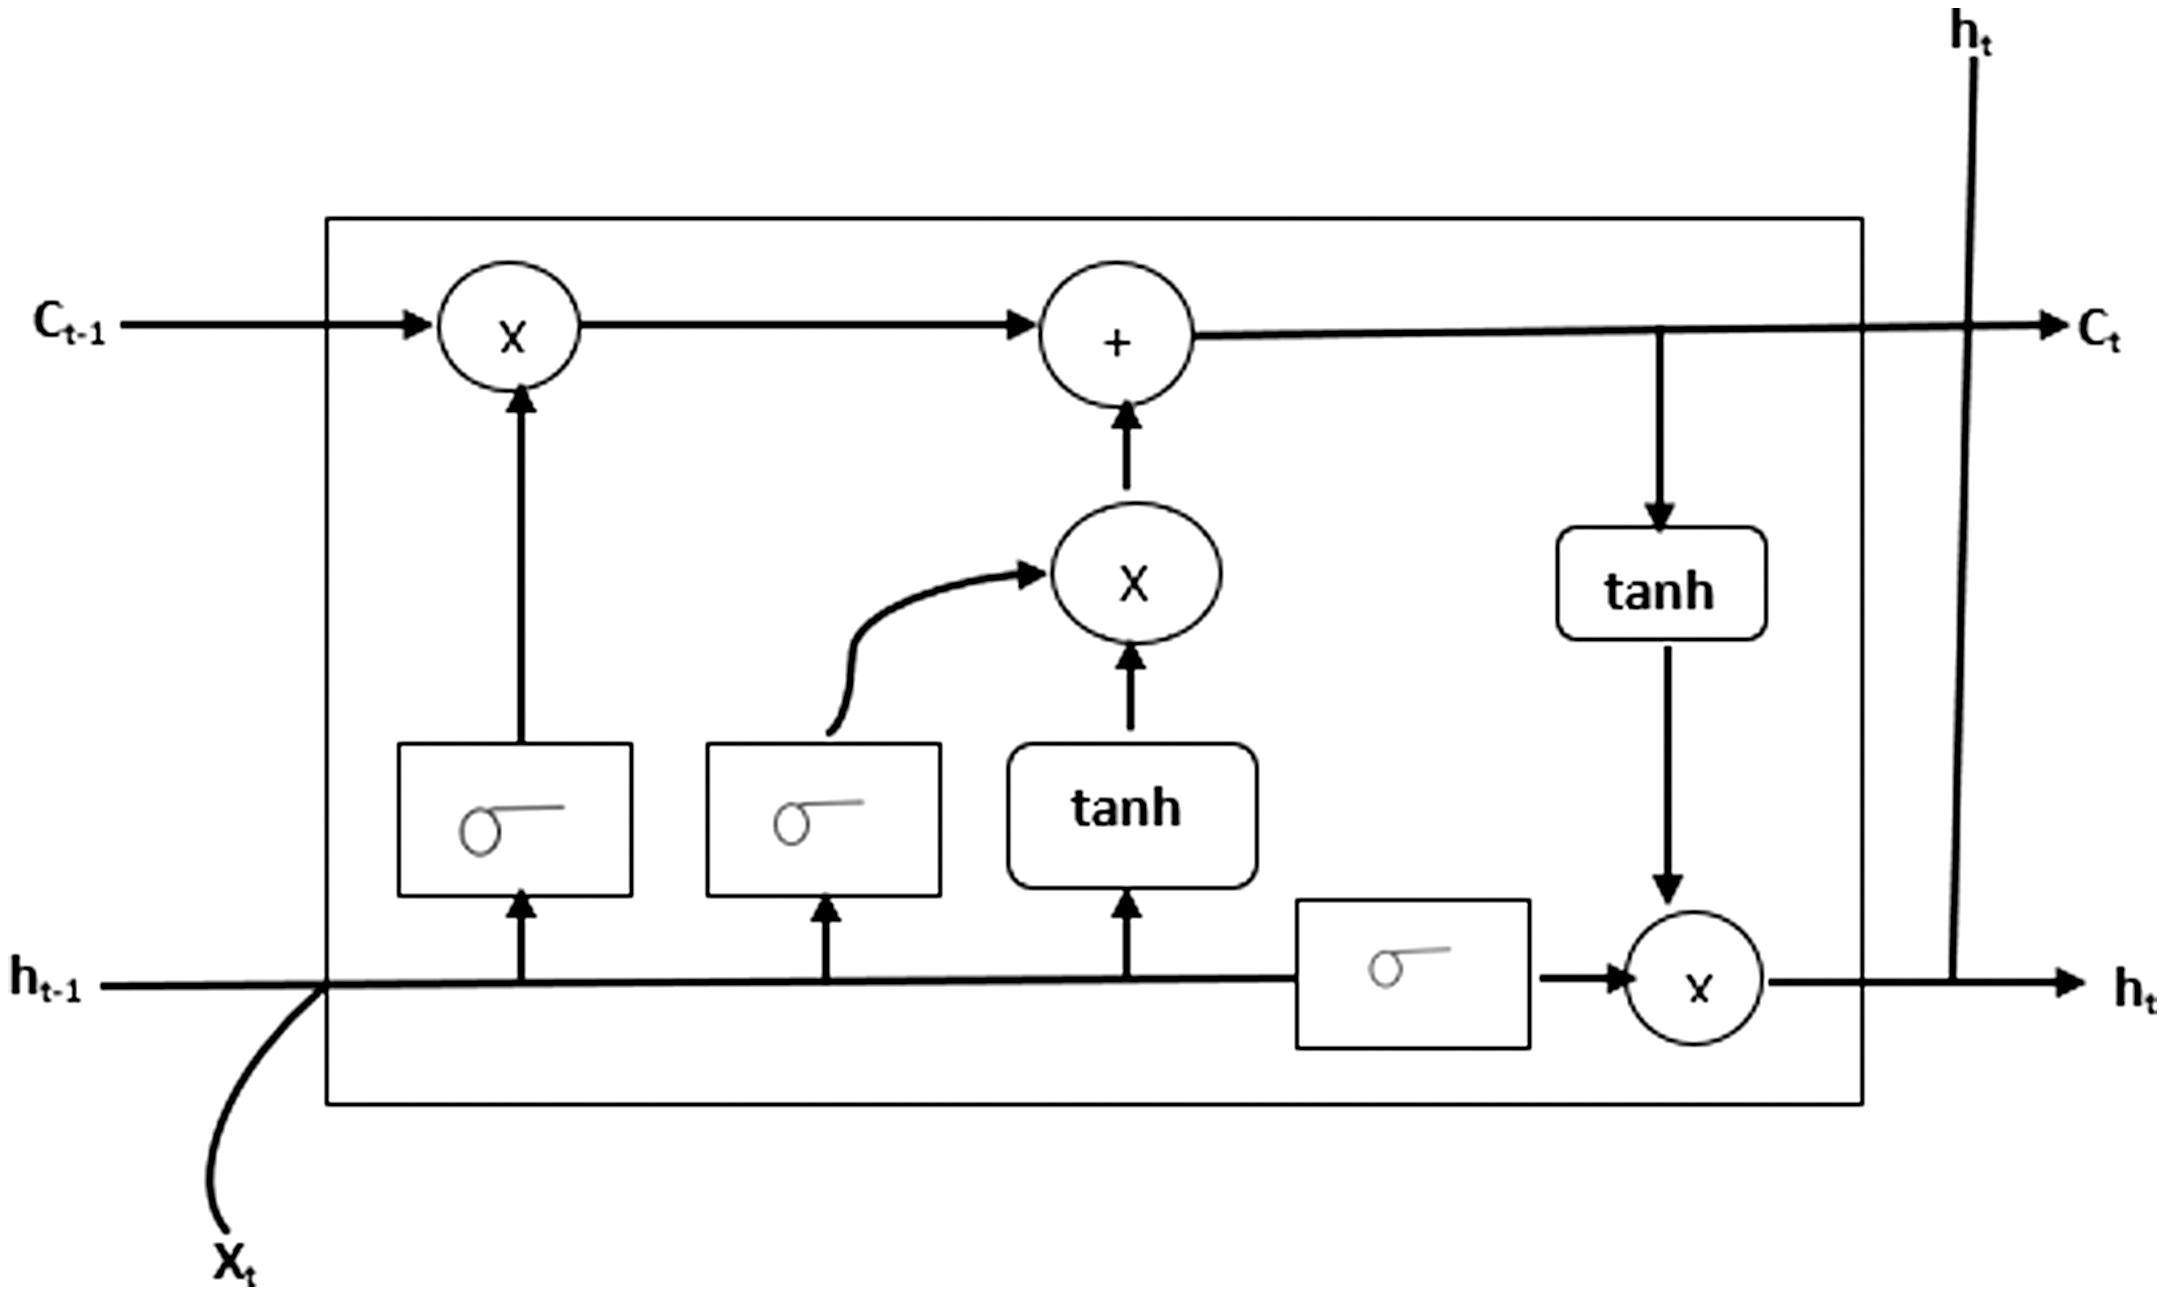
LSTM is widely applicable across various domains, including language modelling, machine translation, image captioning, handwriting generation, and question-answering chatbots. Its ability to handle sequential data with nuanced understanding makes it indispensable for advanced AI and machine learning applications.
F.FUNCTIONING OF CNN MODEL
Convolutional Neural Networks (CNNs) are highly effective for tasks such as image analysis and pattern recognition, processing input data through specialized layers [29]. The core operational components of a CNN as shown in Figure 3 include convolution for feature extraction, max pooling to condense information and reduce dimensionality, dropout to mitigate overfitting, and dense layers for synthesizing complex features.
CNNs excel at recognizing patterns within data, making them particularly effective for tasks like facial recognition, document analysis, and object detection. Their hierarchical structure allows them to identify intricate features at different levels of abstraction, from simple edges to complex textures. This makes CNNs particularly well-suited for handling high-dimensional data and is a key advantage for applications in artificial intelligence and computer vision.
G.HYBRID LSTM + CNN APPROACH
The hybrid LSTM + CNN approach combines the strengths of both architectures, significantly enhancing prediction accuracy [26]. LSTMs excel at capturing long-term dependencies and sequential patterns, making them ideal for understanding temporal relationships, while CNNs specialize in spatial feature extraction, identifying patterns within the data through convolutional filters.
By integrating these capabilities, the hybrid model first uses CNNs to extract meaningful spatial features from raw data. These features are then processed by LSTMs to capture temporal dependencies, enabling the prediction of future outcomes. This fusion not only improves predictive power but also mitigates the limitations of each individual model—such as CNN’s difficulty in handling sequential data and LSTM’s challenge with high-dimensional data.
This hybrid approach is particularly effective in fields such as stock market prediction, video analysis, and financial time-series forecasting. By combining both spatial and temporal analysis, it can manage complex datasets and capture intricate patterns with higher accuracy and robustness.
H.APPLICATIONS OF THE HYBRID MODEL
The hybrid LSTM + CNN approach has proven effective in various domains, such as finance, healthcare, and autonomous systems [28]. It enhances performance by leveraging CNN’s spatial feature extraction and LSTM’s temporal dependency learning.
In this approach, CNNs perform feature extraction through convolutional filters, followed by max-pooling layers. The output from the CNN’s pooling layer serves as input for LSTMs, which capture the temporal dynamics within sequential data. The final predictions are generated through fully connected layers, which synthesize the complex relationships between inputs and outputs.
By integrating CNNs and LSTMs, the hybrid model significantly improves accuracy and reliability in tasks requiring both feature extraction and sequential learning. It is ideal for predictive modelling, empowering applications in time-series forecasting, financial market prediction, and speech recognition.
IV.MODEL EVALUATION AND COMPARISON
To assess the performance of the proposed hybrid CNN+LSTM model, we conducted experiments using both individual CNN and LSTM models, tested on the same datasets. Performance metrics like RMSE and accuracy were used for evaluation. The comparison highlighted the superior performance of the hybrid model, demonstrating its ability to effectively learn both spatial and temporal features in stock market data.
While traditional methods like ARIMA and SVM are not suitable for capturing the nonlinear patterns in stock market data, the hybrid CNN+LSTM model effectively handles both spatial and temporal dependencies, making it more suitable for this task [30]. Despite challenges like non-stationarity in stock data, the hybrid model performed robustly after pre-processing steps such as normalization and scaling.
For further validation, out-of-sample testing and stability checks were conducted, ensuring that the model’s predictions remained reliable across different time frames and market conditions. However, future research could explore additional techniques like wavelet transforms or differencing to further enhance the model’s handling of non-stationary data.
A.DATASET OVERVIEW
The dataset utilized in this study consists of extensive historical stock data sourced from the National Stock Exchange (NSE), encompassing multiple sectors critical to the financial ecosystem. It includes daily records with key attributes such as:
Opening Price: The price at which a stock begins trading each day.
Highest Price: The maximum price a stock reaches during the trading day.
Lowest Price: The minimum price a stock falls to during the trading day.
Closing Price: The final price at which a stock trades before the market closes.
Adjusted Closing Price: A modified closing price that accounts for corporate actions like dividends and stock splits.
Trading Volume: The total number of shares traded during a given period.
In addition to these metrics, the dataset captures sector-wise performance, market trends, and volatility, offering a holistic perspective on stock behaviour over time. This comprehensive and detailed dataset is instrumental in enabling robust analyses for predictive modelling, helping to forecast stock price movements, assess market sentiment, and optimize investment strategies effectively.
Table I presents a concise snapshot of the dataset, detailing the sectors represented and the corresponding stocks analysed. This structured overview serves as a foundational reference, illustrating the dataset’s breadth and its focus on capturing sectoral diversity within the financial domain.
Table I. Details of the dataset
| Sector | Stock Name |
|---|---|
| Software | Infosys |
| Banking | HDFC Bank |
| Pharma | Cipla |
| Petroleum | ONGC |
B.TECHNOLOGICAL FRAMEWORK
Python serves as the primary programming environment for this research, leveraging its strengths across various dimensions:
- 1.Robust Community Support
- 2.Advanced Scientific Libraries
- Libraries such as NumPy, Pandas, and SciPy provide powerful tools for handling complex numerical computations and data manipulations.
- 3.Machine Learning and Deep Learning Ecosystem
- Python’s ecosystem includes:
- °Scikit-learn: Comprehensive tools for machine learning.
- °TensorFlow: Scalable deep learning framework.
- °Keras: Simplified neural network prototyping.
- 4.Intuitive Syntax and Flexibility
- Python’s user-friendly syntax promotes rapid prototyping and experimentation with diverse algorithms, fostering innovation in machine learning and data science.
- 5.Complementary Tools
- °Anaconda: Simplifies package management and environment setup.
- °Jupyter Notebook: Enhances interactive and collaborative data exploration.
While Python’s dynamic typing may lead to unexpected behaviours, careful implementation and testing mitigate such issues, making it an indispensable tool for data-driven research.
C.PARAMETER SETTINGS AND SENSITIVITY ANALYSIS
1.PARAMETER SETTINGS
LSTM Parameters:
- •Number of Units: 128
- •Dropout Rate: 0.2 (to mitigate overfitting)
- •Activation Function: ReLU
- •Optimizer: Adam (learning rate: 0.001)
CNN Parameters:
- •Kernel Size: 3×3
- •Number of Filters: 64
- •Pooling Size: 2×2
- •Activation Function: ReLU
Training Parameters:
- •Batch Size: 32
- •Epochs: 50
- •Validation Split: 20%
These values were optimized through grid search to balance model accuracy and training efficiency.
D.SENSITIVITY ANALYSIS
To assess parameter impact, sensitivity analysis revealed the following:
- •Learning Rate: Increasing to 0.01 caused instability; reducing to 0.0001 slowed convergence.
- •Batch Size: Larger batches (e.g., 64) accelerated training but reduced accuracy slightly.
- •LSTM Units: Fewer units (<64) reduced accuracy; increasing units (>128) yielded marginal gains with higher computational costs.
- •Dropout Rate: Low rates (<0.1) caused overfitting; high rates (>0.3) impaired generalization.
E.SIMULATION AND DATA DETAILS
1.DATA OVERVIEW
The dataset spans a decade (2010–2020), sourced from NSE and BSE, and includes sectors like banking, pharmaceuticals, petroleum, software, and textiles. Key attributes include:
- •Open: Opening price.
- •High: Highest price.
- •Low: Lowest price.
- •Close: Closing price.
- •Volume: Shares traded.
2.PRE-PROCESSING STEPS
- 1.Data Cleaning: Linear interpolation for missing values.
- 2.Normalization: Min-Max scaling to [0, 1].
- 3.Feature Engineering: Added lagged features and rolling averages.
3.SIMULATION SETUP
- 1.Environment:
- •Python 3.8, TensorFlow 2.6, Scikit-learn [32].
- •NVIDIA RTX 3090 GPU, 64 GB RAM.
- 2.Model Configuration:
- •LSTM: 128 units, 0.2 dropout, learning rate 0.001.
- •CNN: 3x3 kernel, 64 filters, ReLU activation.
- •Data Splitting:
- •Training: 80%
- •Testing: 20%
- •Validation: 20% of training data.
4.WORKFLOW
- •Data ingestion and pre-processing.
- •Model training with batch size of 32 and Adam optimizer.
- •Validation accuracy monitoring to avoid overfitting.
- •Testing on unseen data using metrics like RMSE.
- •Visualization of predicted vs. actual prices.
5.EVALUATION METRICS
Root Mean Square Error (RMSE):
- •HDFC Bank: LSTM (23.5309), CNN (9.1599), Hybrid (10.1597).
- •Infosys: LSTM (5.7052), CNN (4.7176), Hybrid (2.0623).
Visualizations (Figs. 13–27) highlight strong alignment between predicted and actual values, particularly for the hybrid LSTM + CNN model, which outperformed standalone models.
6.INSIGHTS AND OBSERVATIONS
The hybrid model effectively captures temporal dependencies (via LSTM) and spatial features (via CNN), demonstrating robustness against non-stationary data without explicit transformations. Despite challenges during highly volatile periods, the model’s consistent performance across different datasets underscores its reliability for stock market prediction tasks [33].
V.IMPACT ON PERFORMANCE
The analysis of stock market data began with a detailed examination of historical records across various sectors, uncovering critical metrics such as opening and closing prices, highs and lows, adjusted close values, and trading volumes (Fig. 4). Following this exploration, key information was meticulously ingested and processed, culminating in a comprehensive dataset comprising 4,274 data points per company (Fig. 5). This extensive collection provided a robust foundation for predictive modelling and extracting meaningful insights, enabling a nuanced understanding of market trends and behaviours across diverse industries.
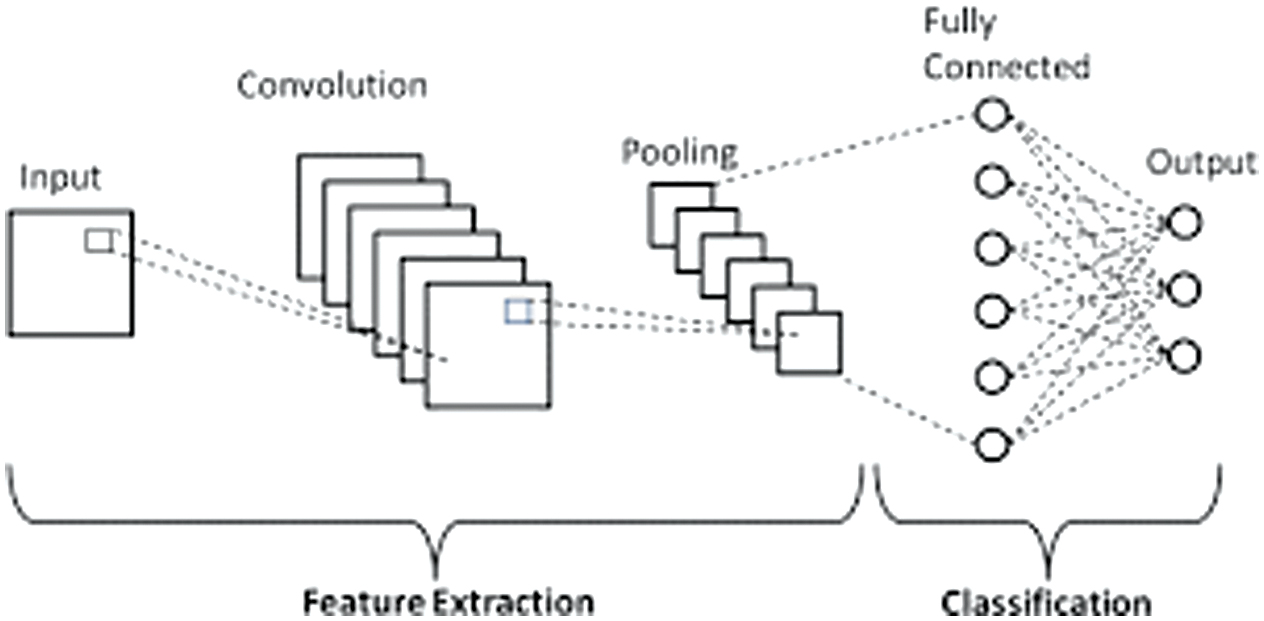 Fig. 3. Architecture of the CNN model.
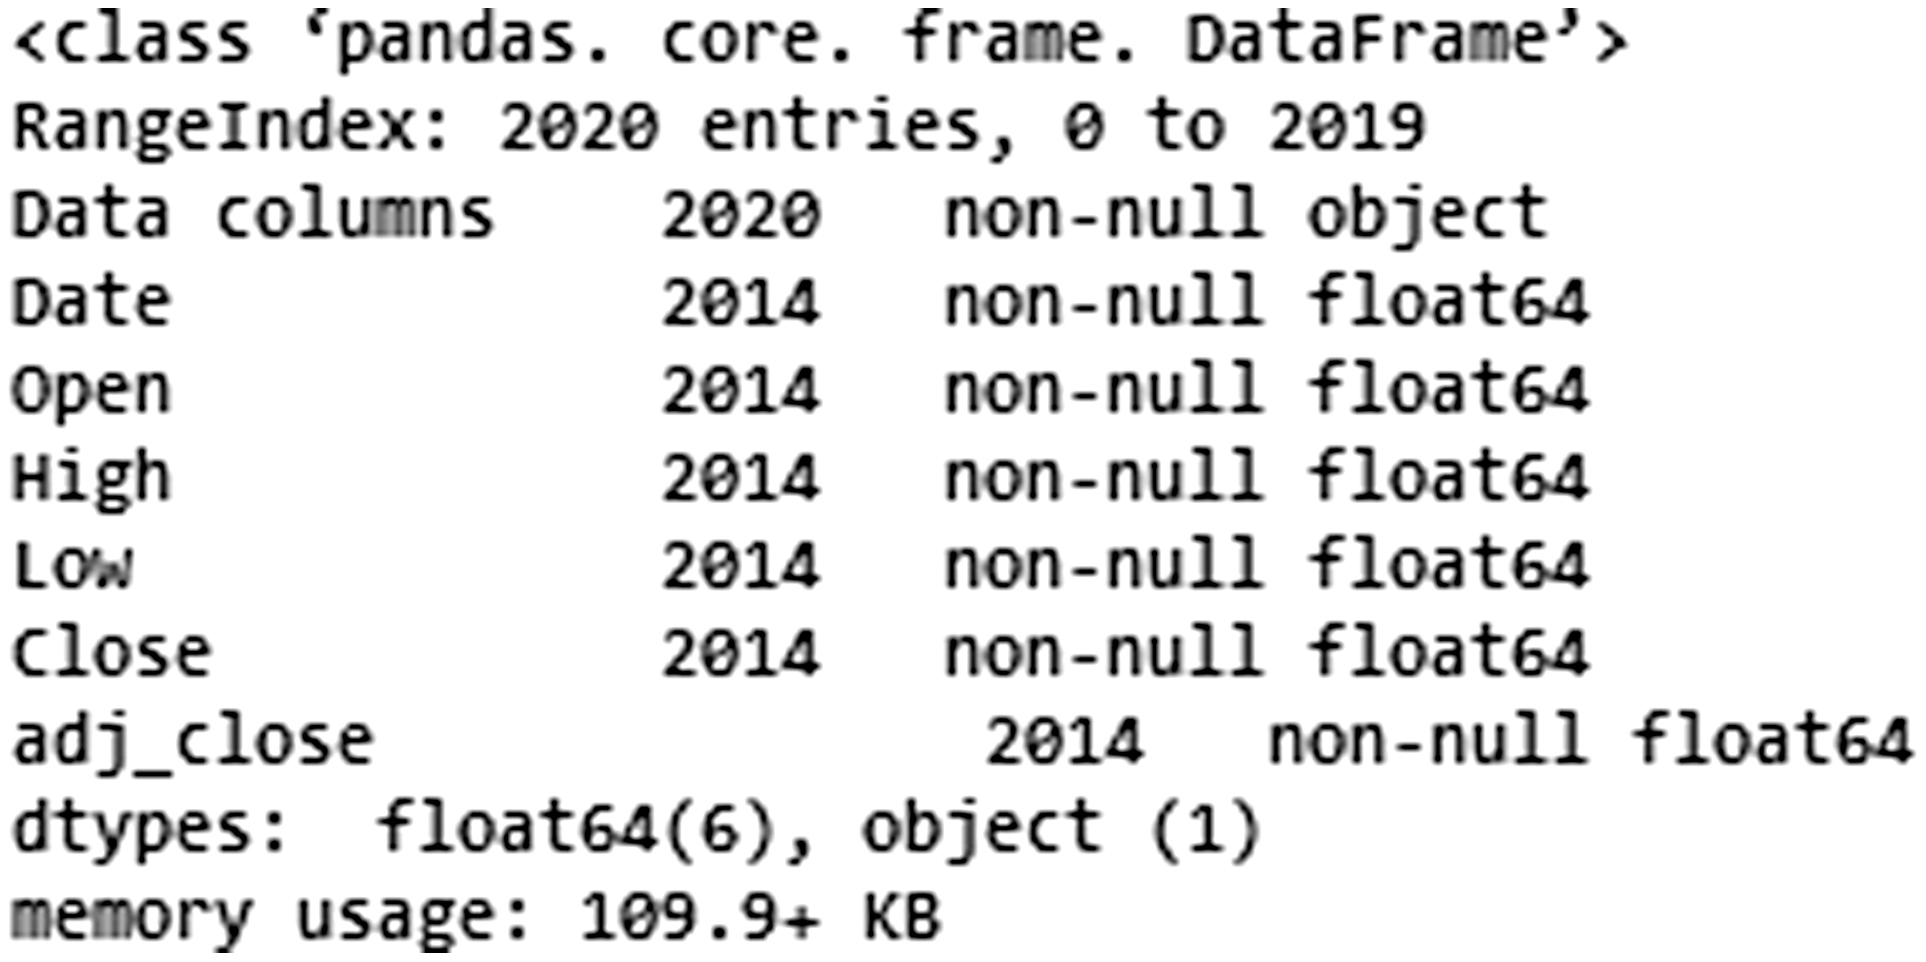 Fig. 4. Overview of insights from stock dataset.
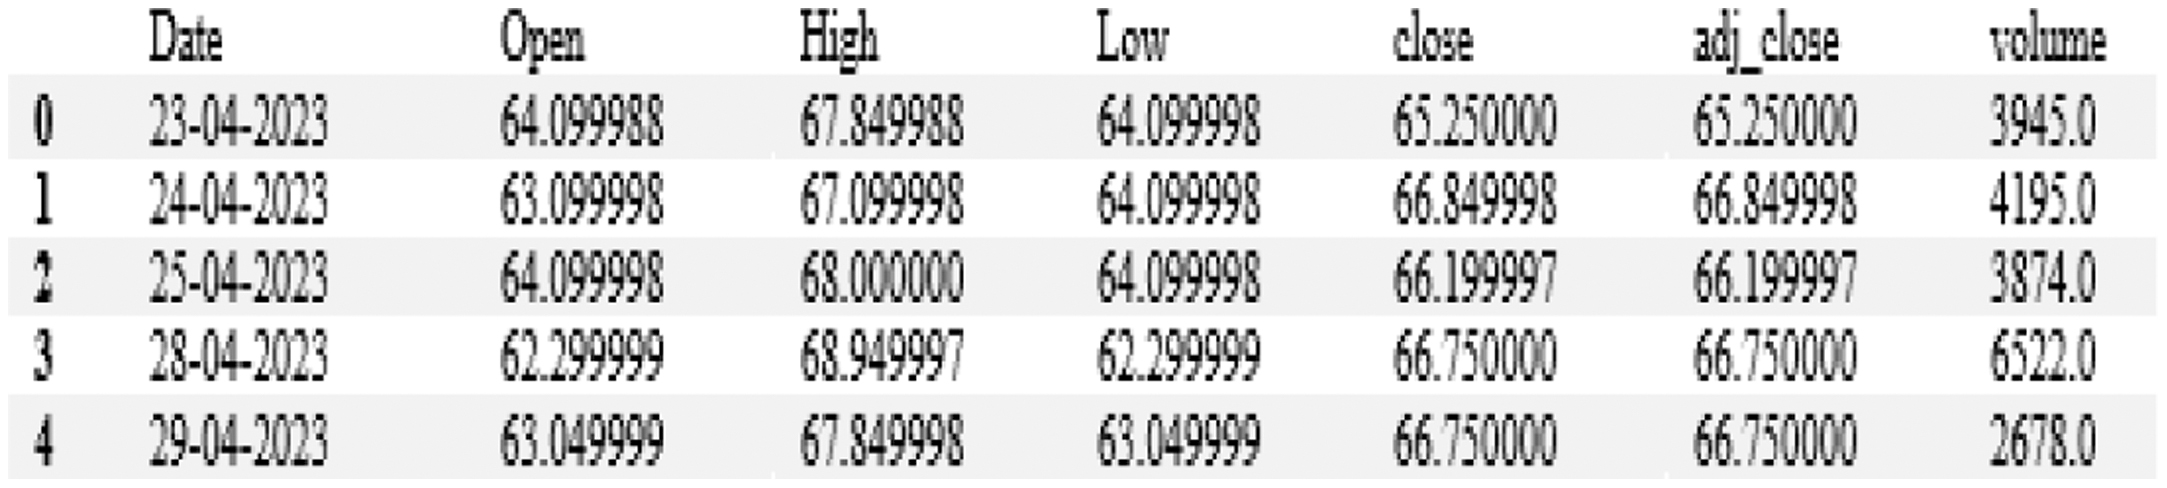 Fig. 5. Dataset ingestion and initial examination.
Visual representations illuminated fluctuating trends in closing prices over time, offering a snapshot of market dynamics (Fig. 6). Pre-processing steps such as normalization using the Min-Max Scaler ensured uniformity and reduced noise, crucial for refining the dataset (Fig. 7).
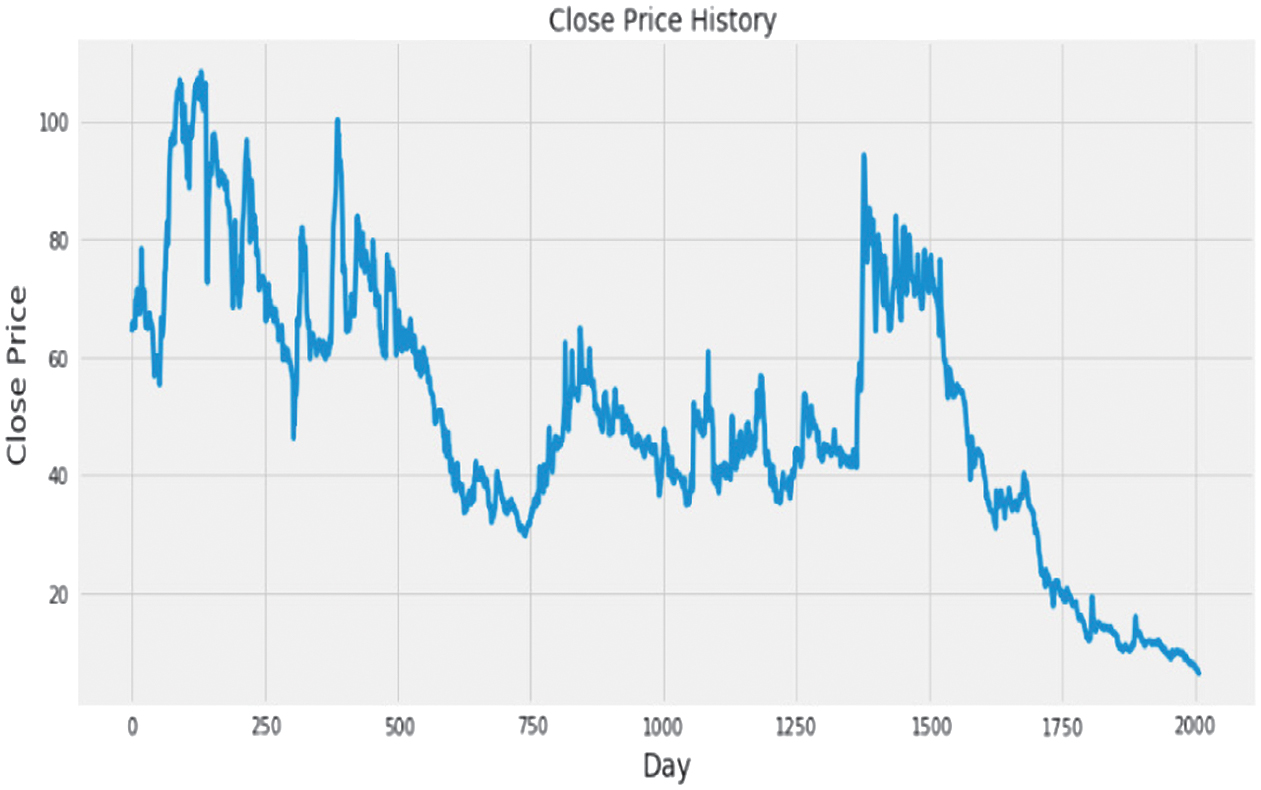 Fig. 6. Historical trends in close prices.
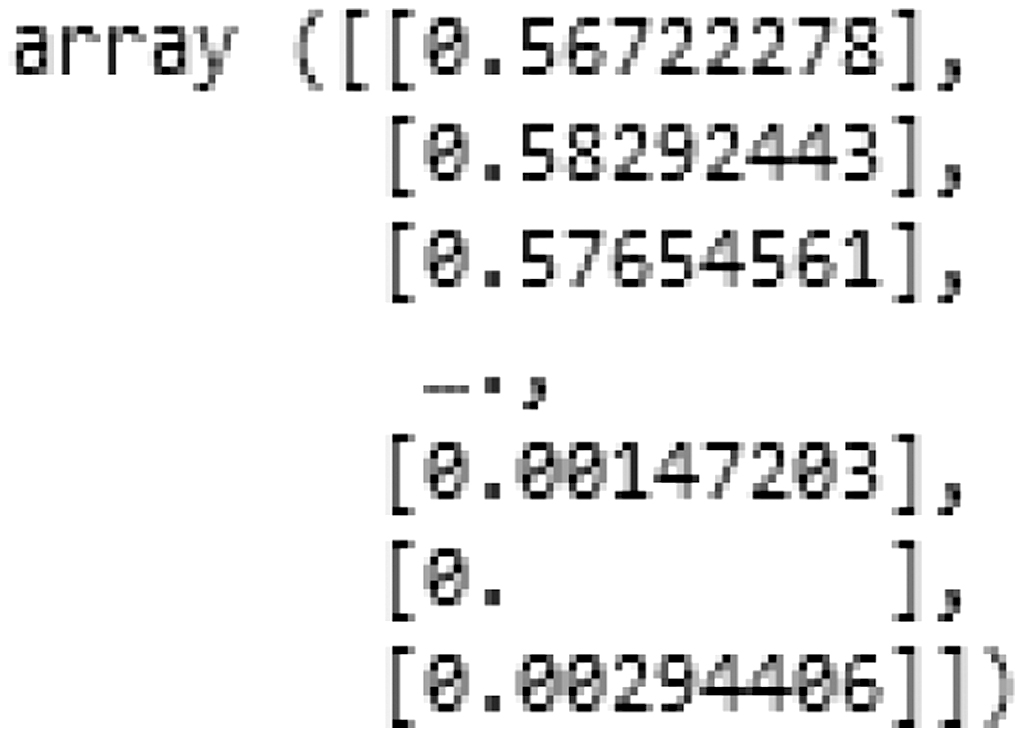 Fig. 7. Data scaling analysis.
The dataset was divided into training and testing sets, with 80% allocated for training and 20% for testing (Fig. 8). Models were then developed using advanced architectures—CNN, LSTM, and a hybrid LSTM + CNN approach—each optimized for unique predictive strengths (Figs. 9 and 10). The CNN model excelled in extracting spatial features, the LSTM captured temporal dependencies, and the hybrid approach combined these strengths to enhance accuracy and capture complex market dynamics.
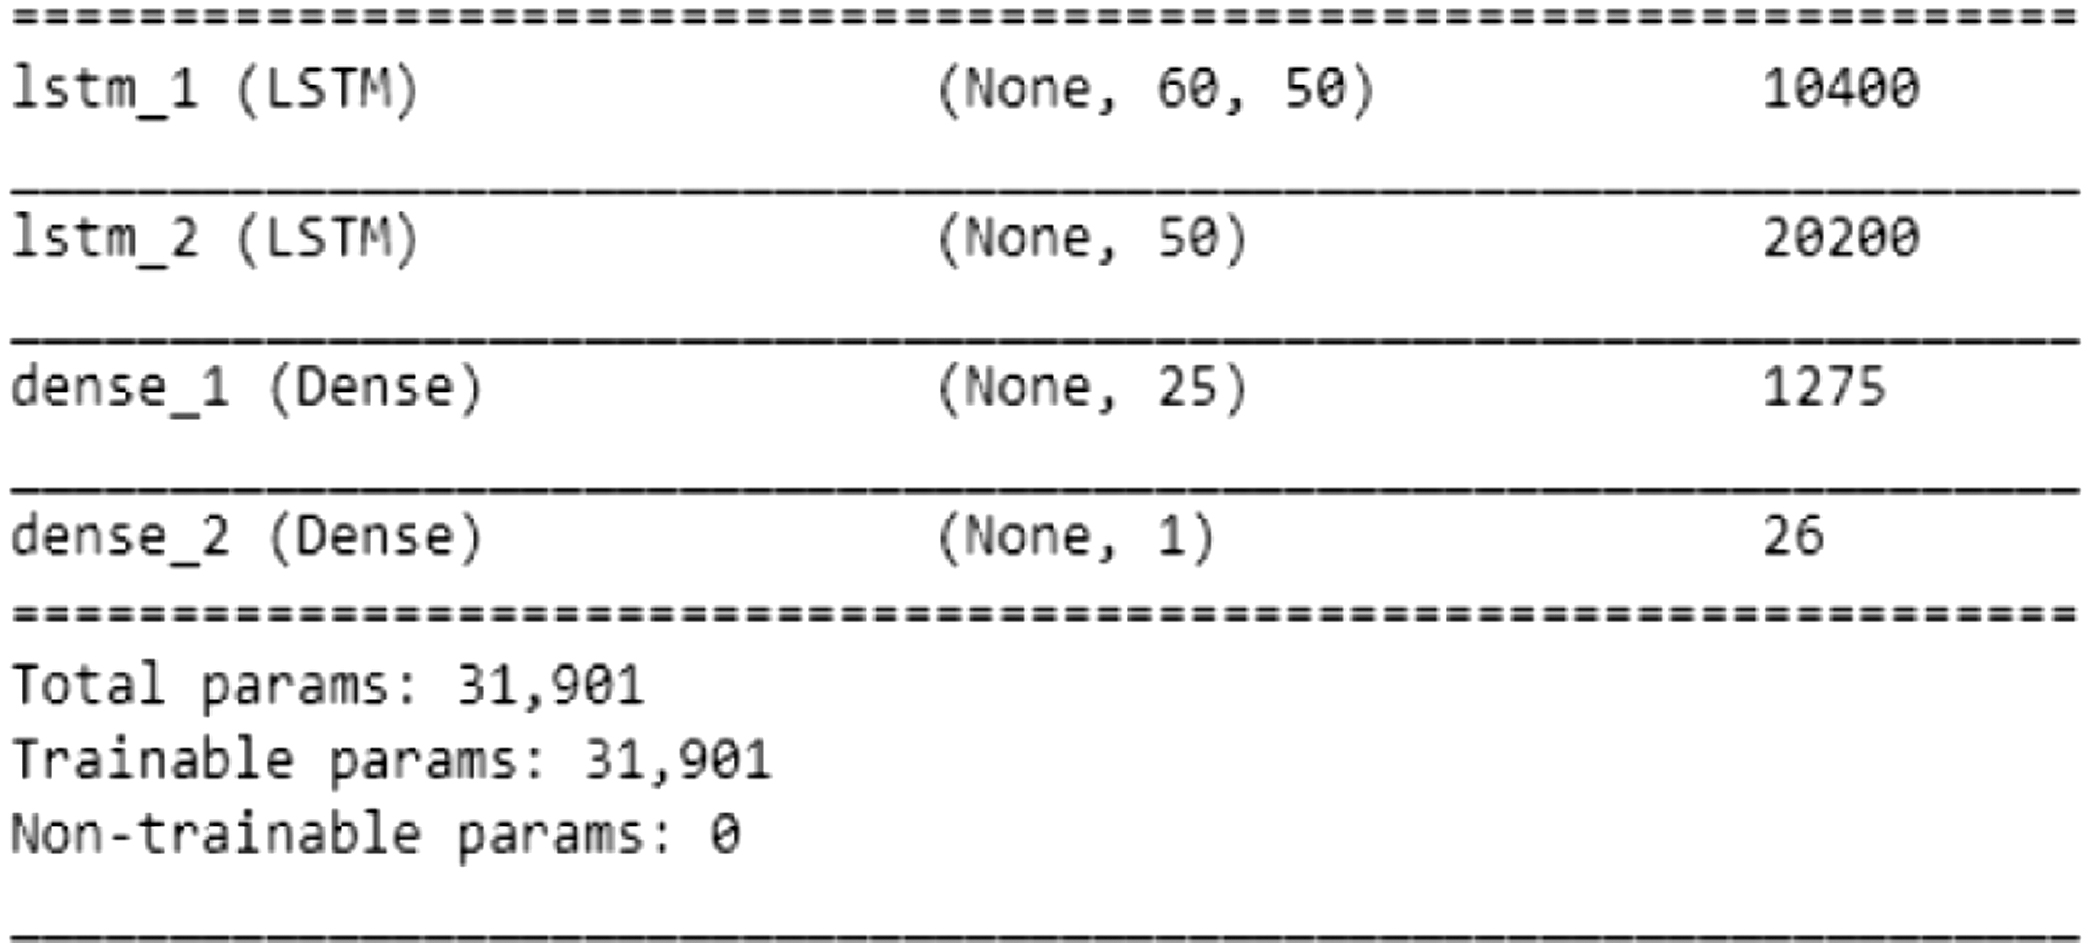 Fig. 8. Summary of LSTM analysis.
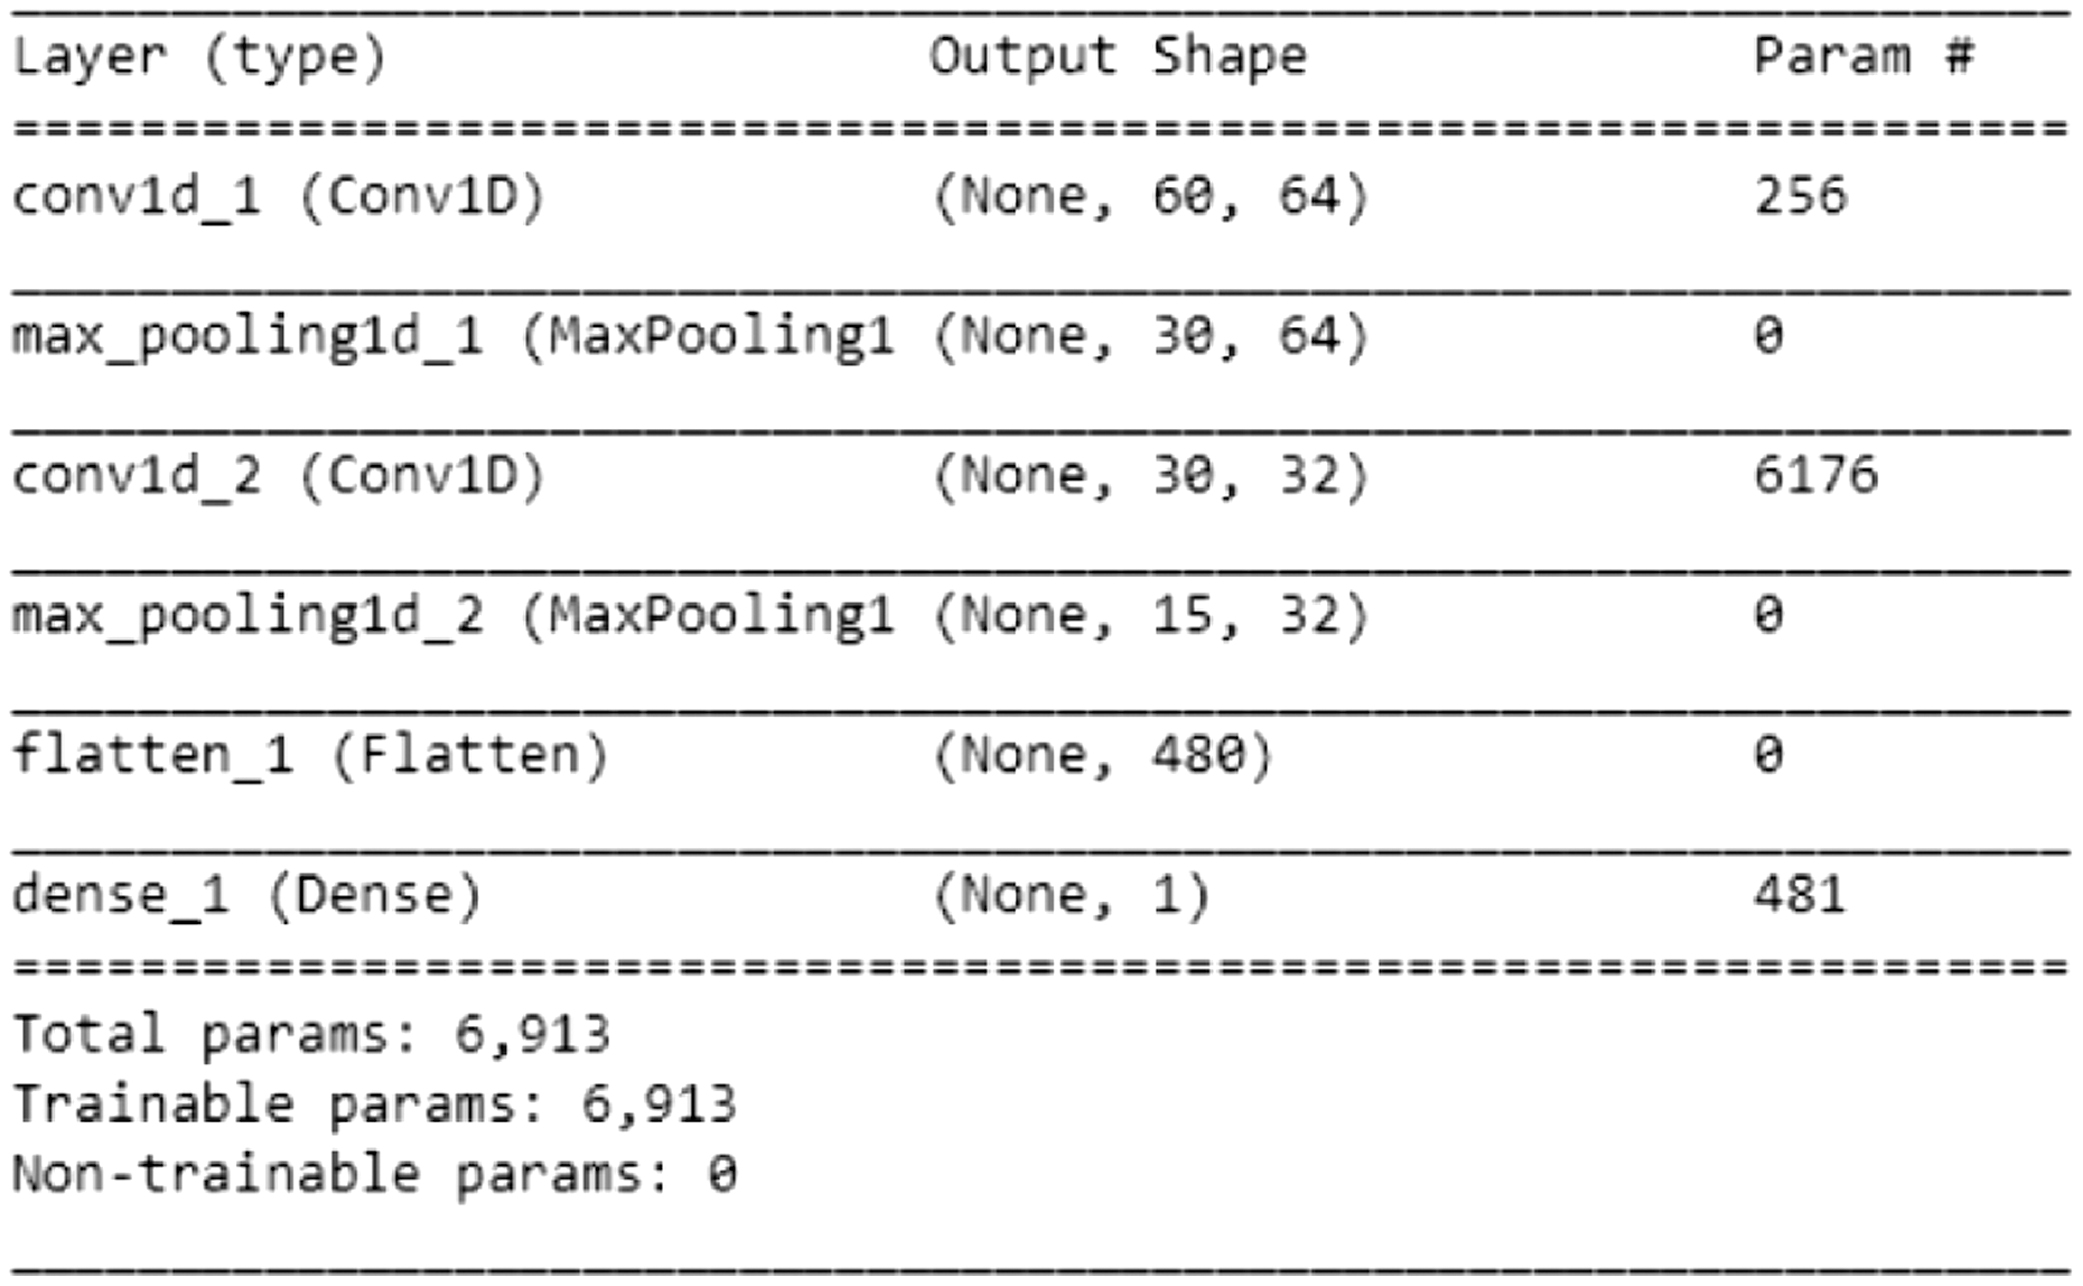 Fig. 9. Summary of CNN analysis.
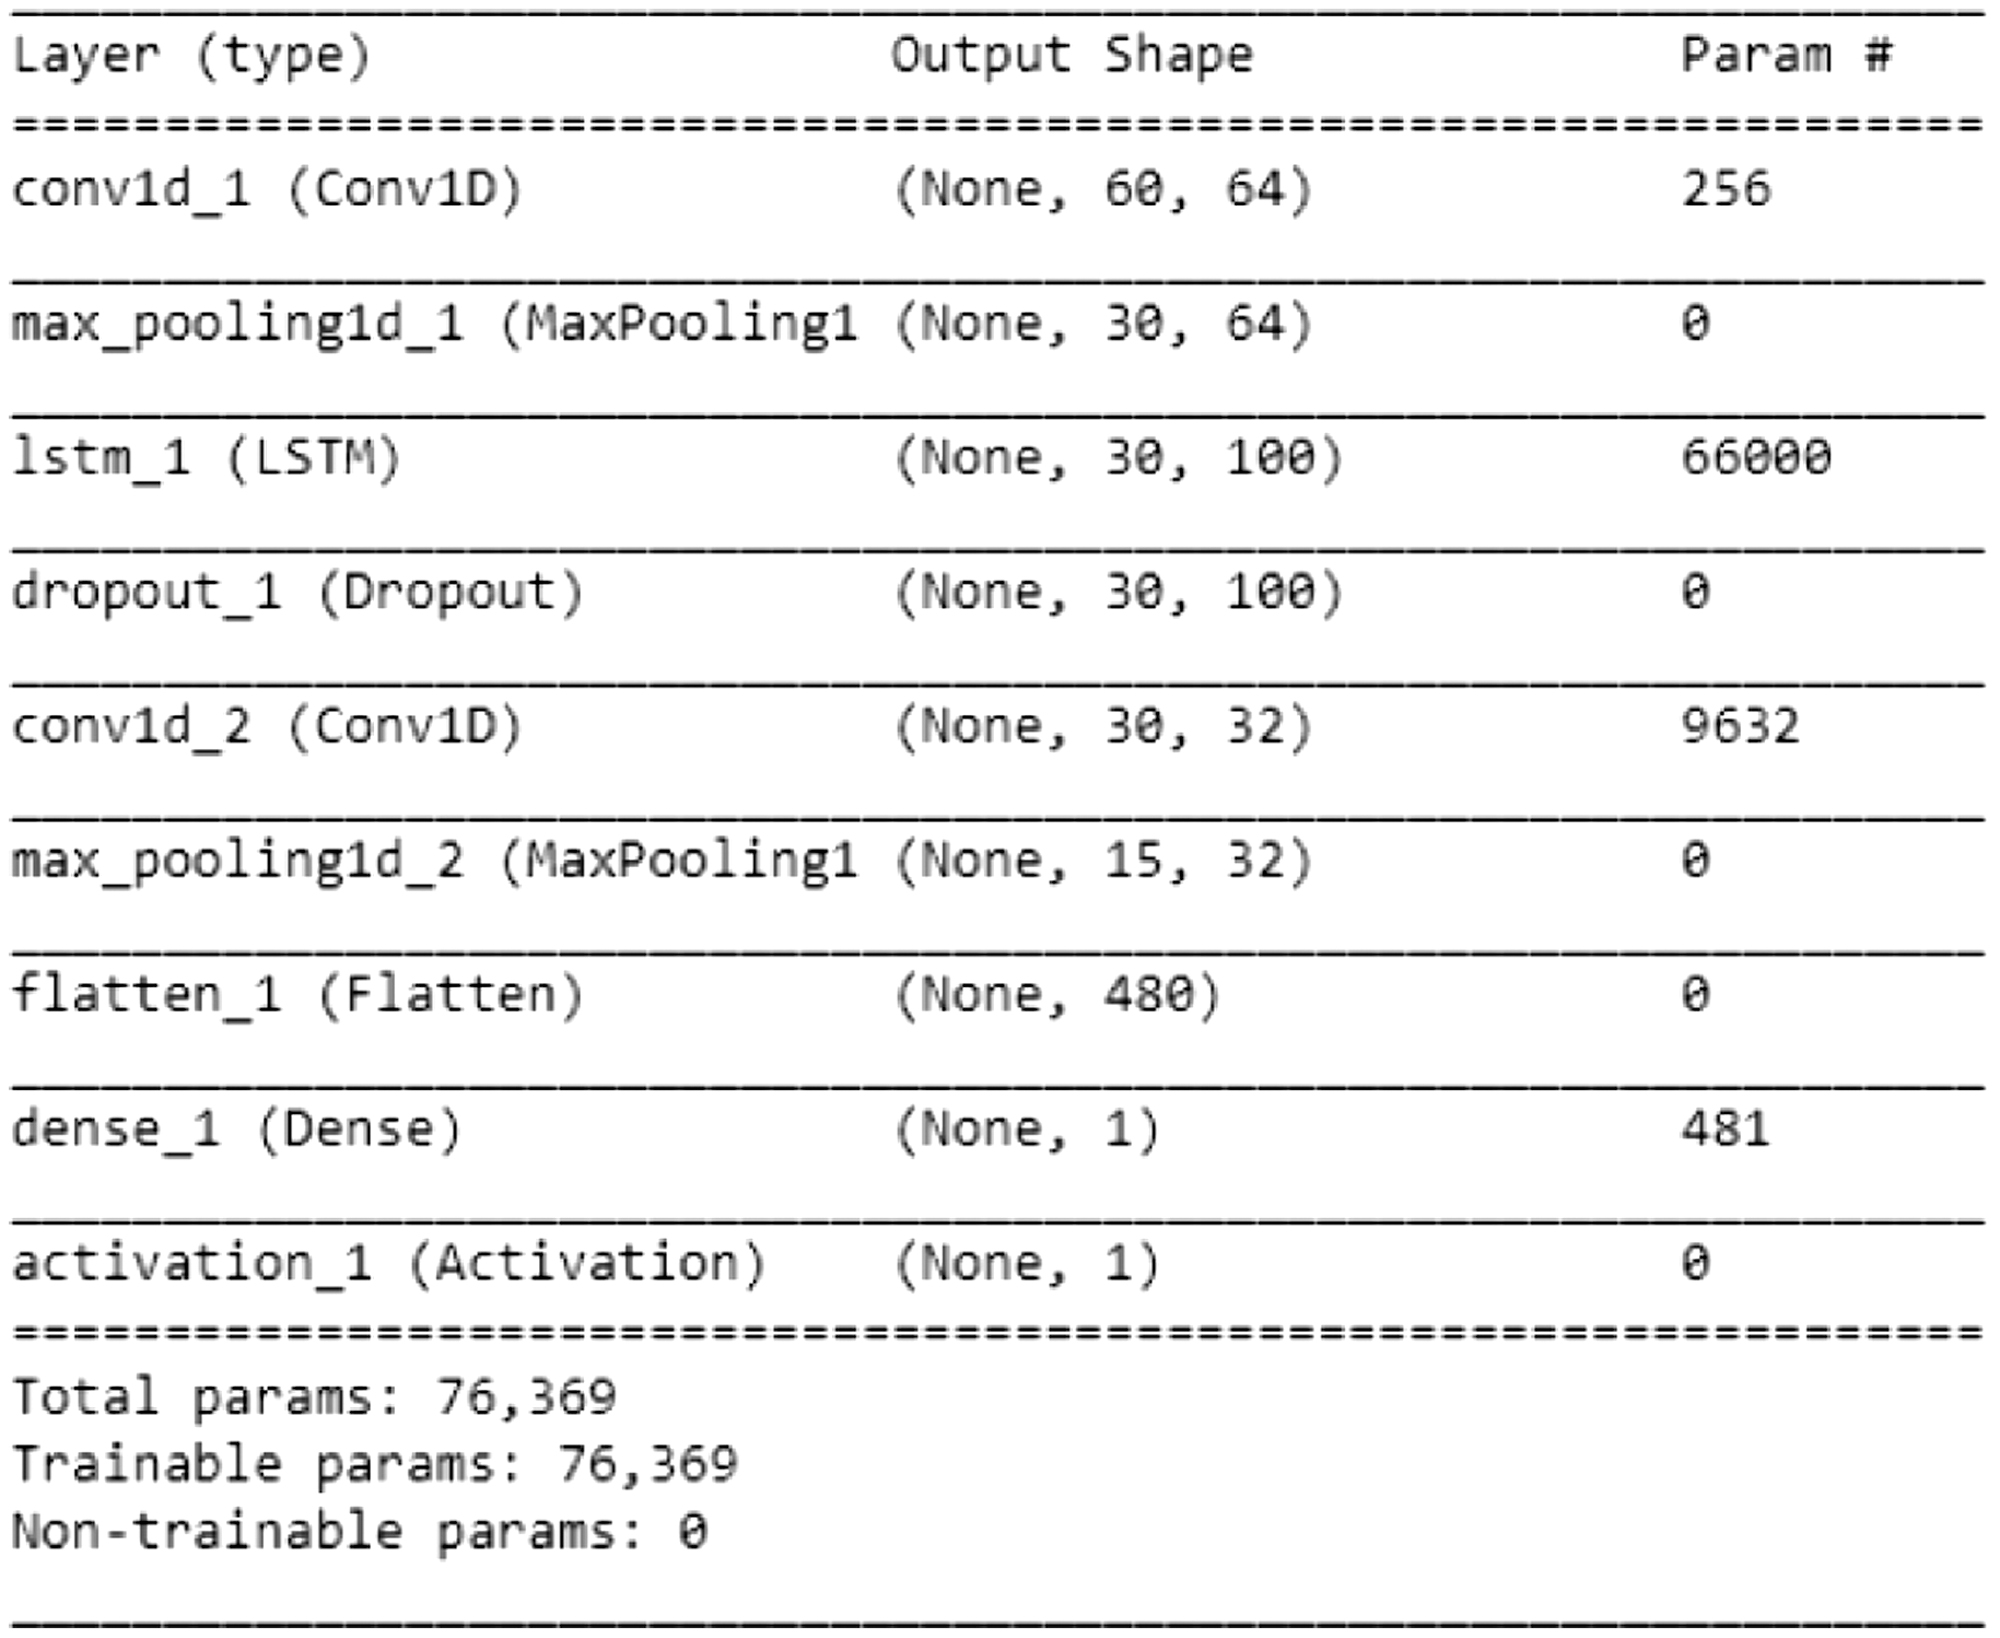 Fig. 10. Summary of hybrid LSTM + CNN approach.
During training, performance metrics such as validation accuracy were closely monitored. Hyperparameter tuning and batch processing ensured robustness while mitigating issues like overfitting. These refinements resulted in reliable predictions across various stock market datasets as shown in Figure 11.
Ultimately, predicted closing prices were generated and evaluated, with Root Mean Square Error (RMSE) assessments used to measure accuracy (Fig. 12). These evaluations revealed the hybrid LSTM + CNN model’s consistent superiority over individual CNN and LSTM models, particularly under volatile market conditions.
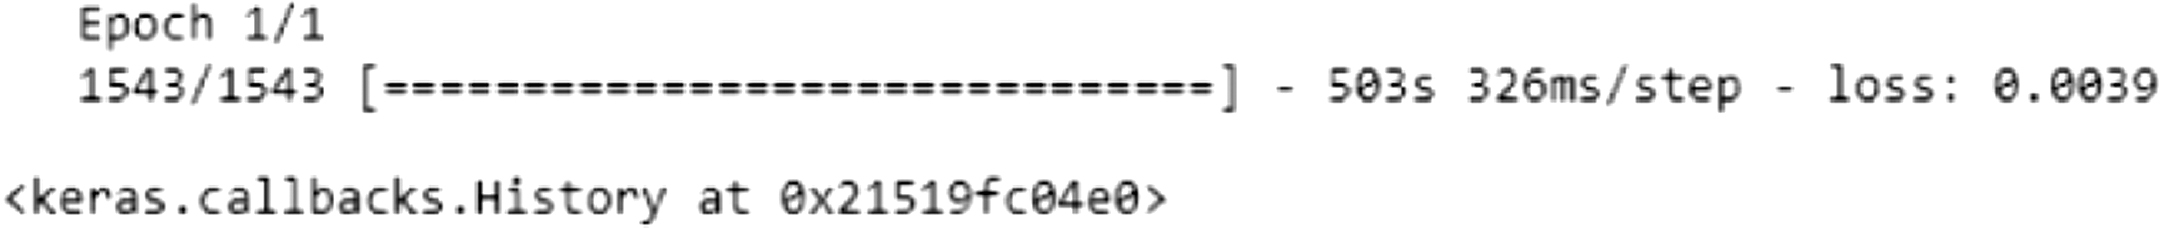
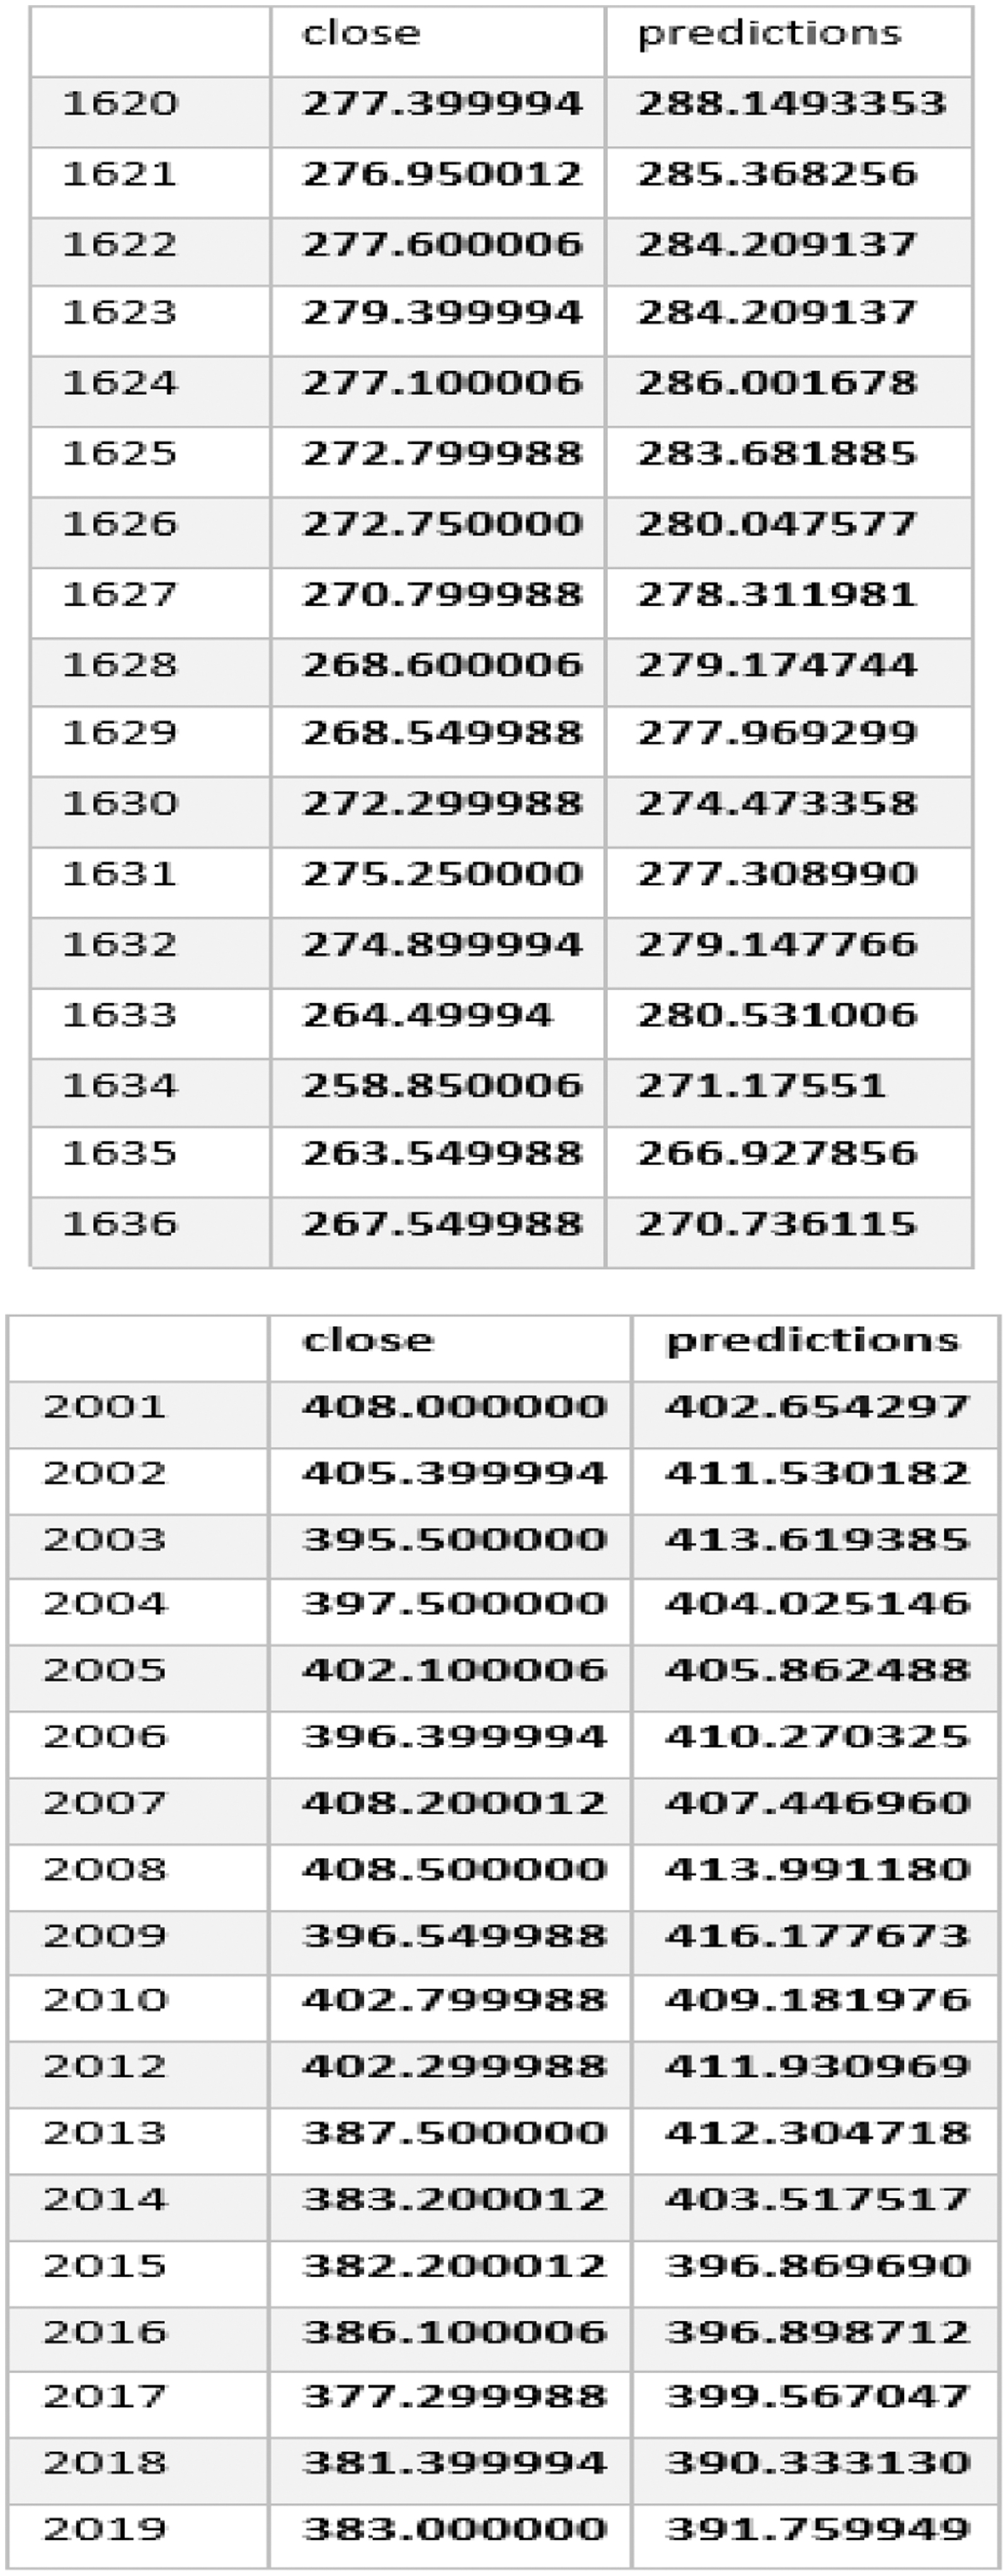 Fig. 12. Predicted closing prices.
Visualizations (Figs. 13–27) illustrated the alignment between actual and predicted prices, while Table II summarized accuracy metrics, providing insights into the models’ performance across sectors.
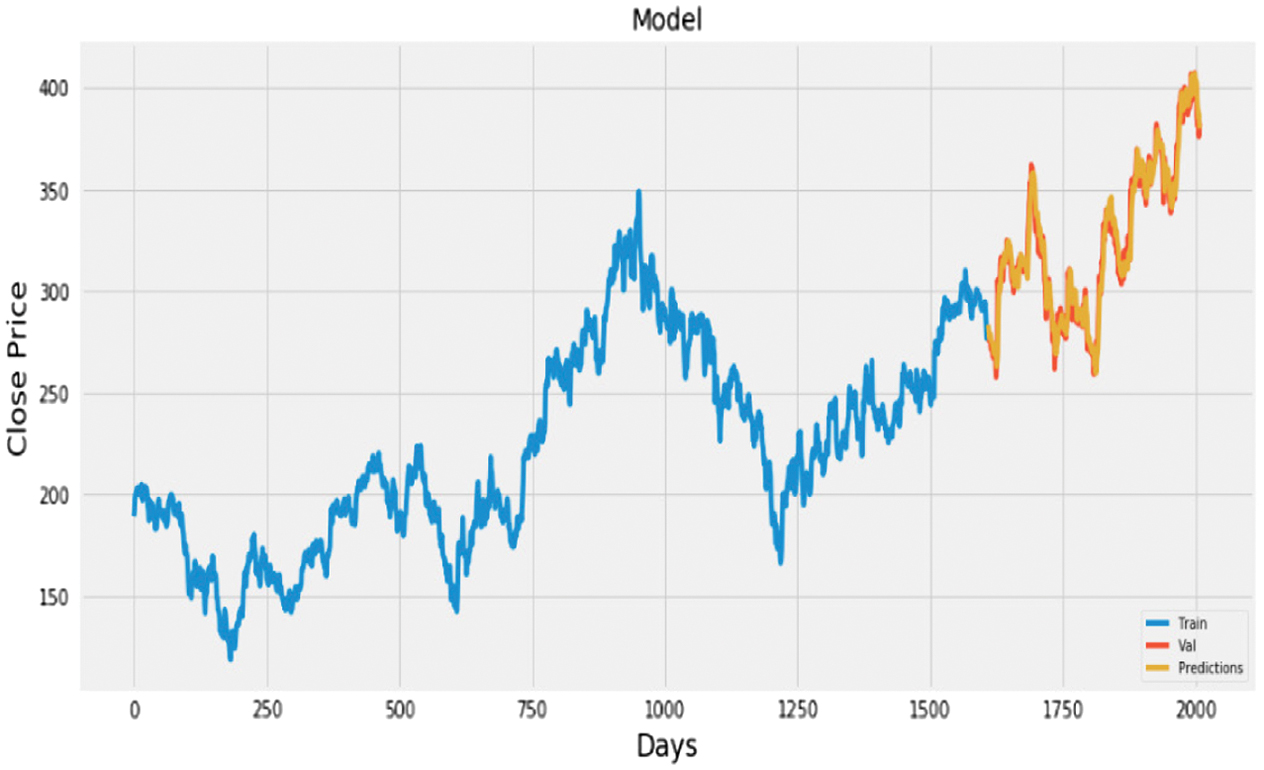 Fig. 13. Plot of actual vs. predicted values for HDFC bank using LSTM + CNN.
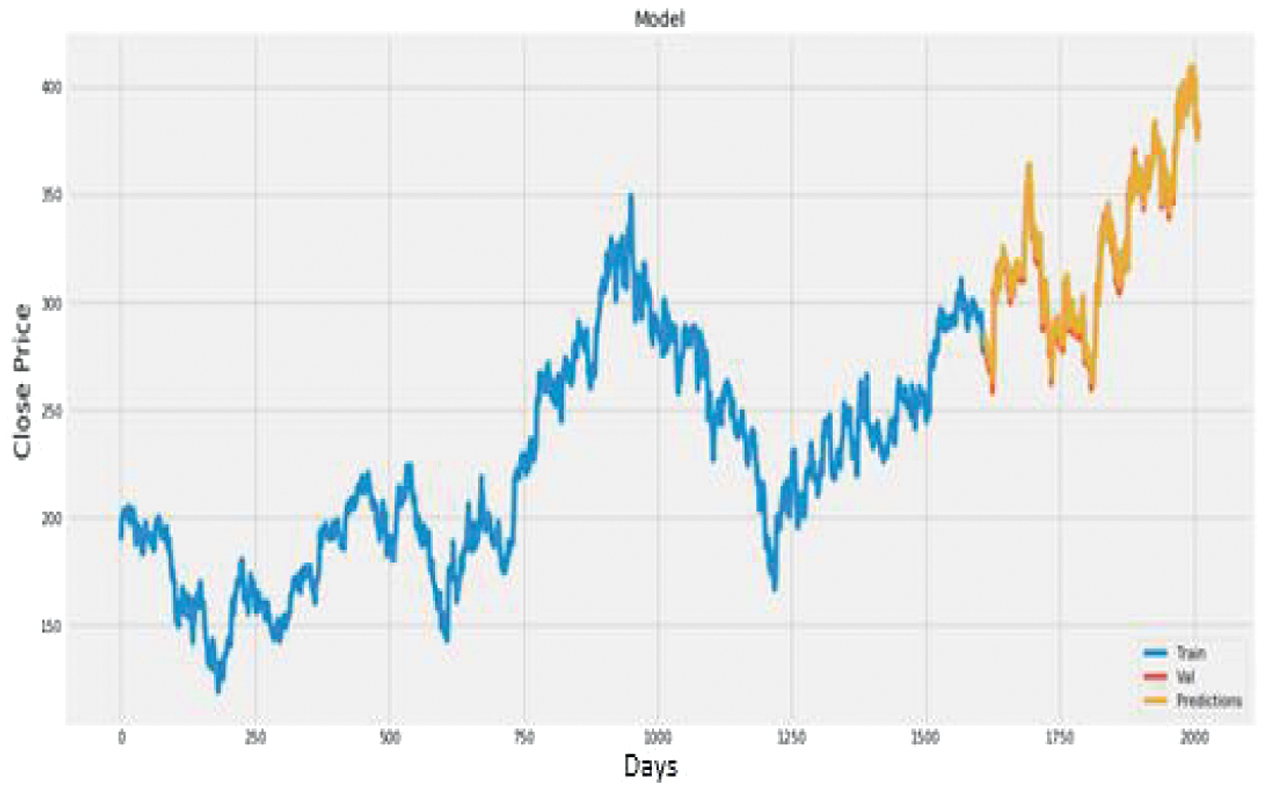 Fig. 14. Plot of actual vs. predicted values for Cipla using LSTM + CNN.
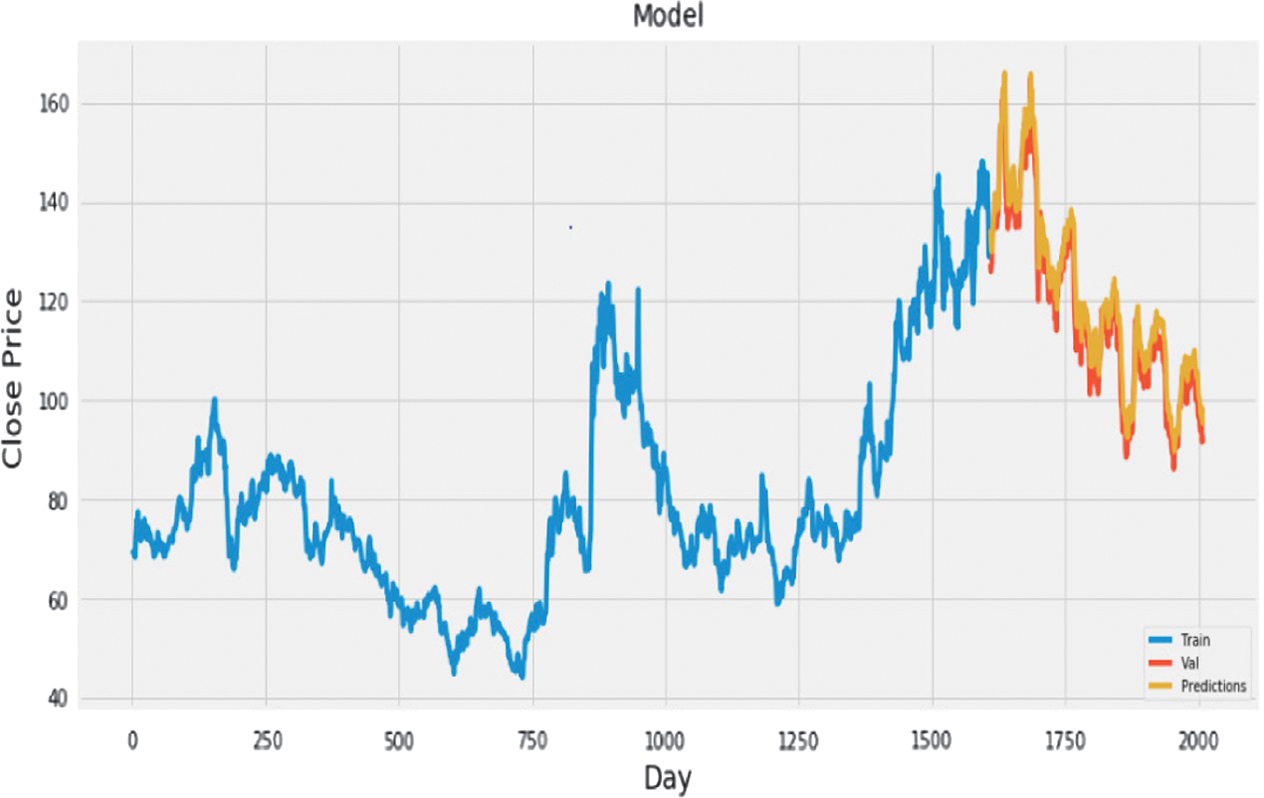 Fig. 15. Plot of actual vs. predicted values for ONGC using LSTM + CNN.
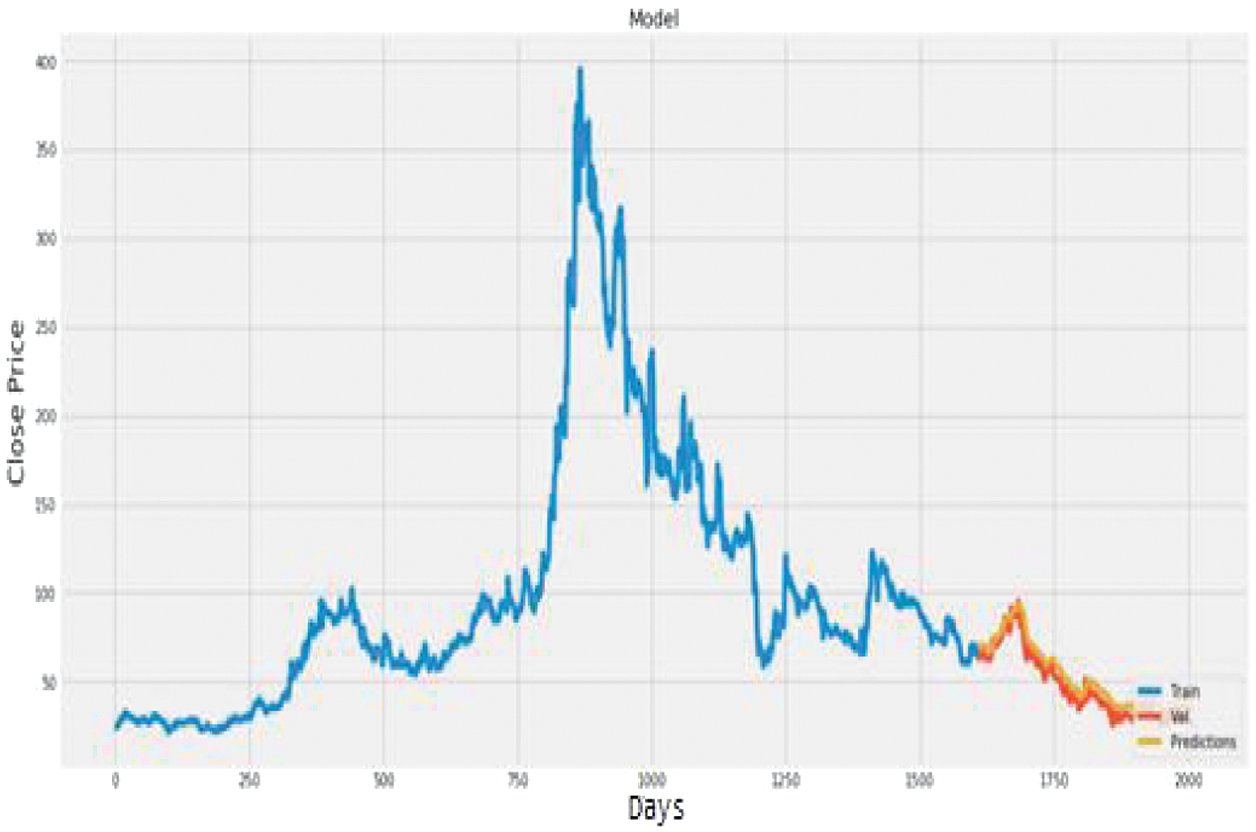 Fig. 16. Plot of actual vs. predicted values for Infosys using LSTM + CNN.
 Fig. 17. Plot of actual vs. predicted values for Vardhman Polytex using LSTM + CNN.
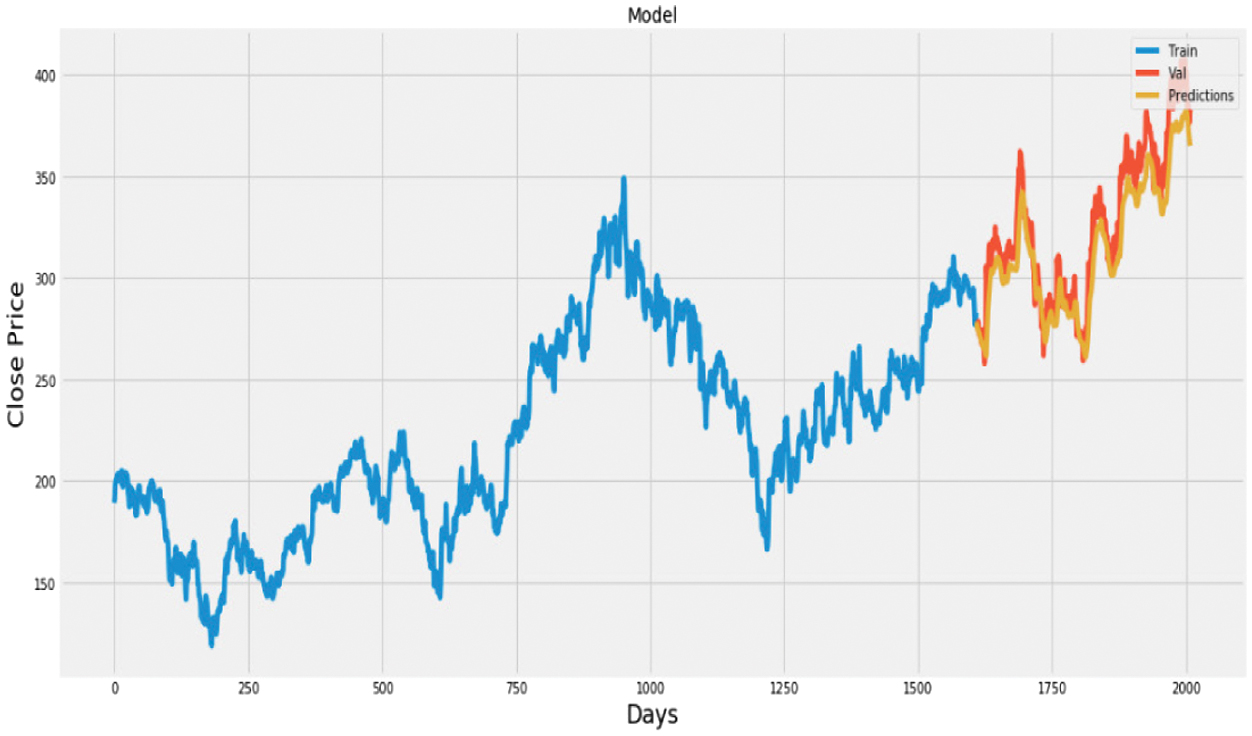 Fig. 18. Plot of actual vs. predicted values for HDFC bank using LSTM.
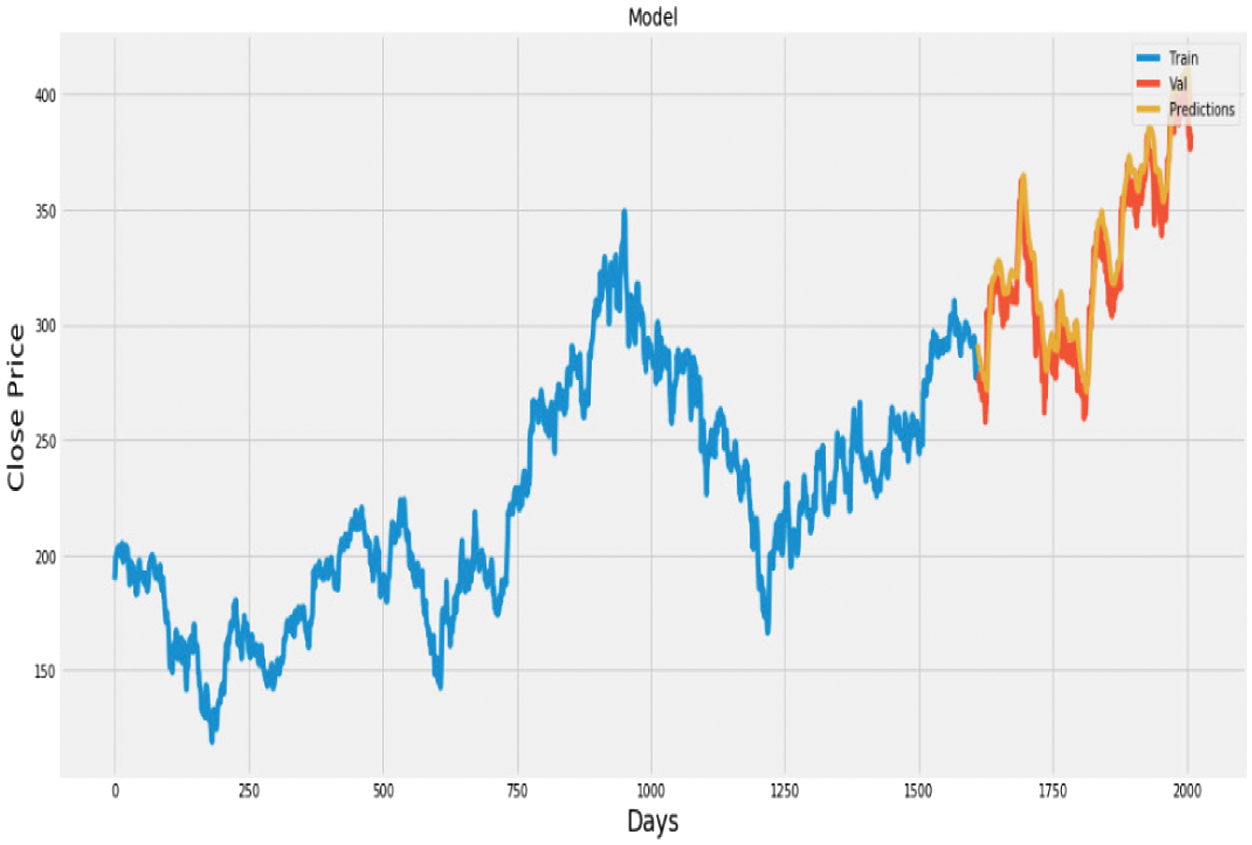 Fig. 19. Plot of actual vs. predicted values for Cipla using LSTM.
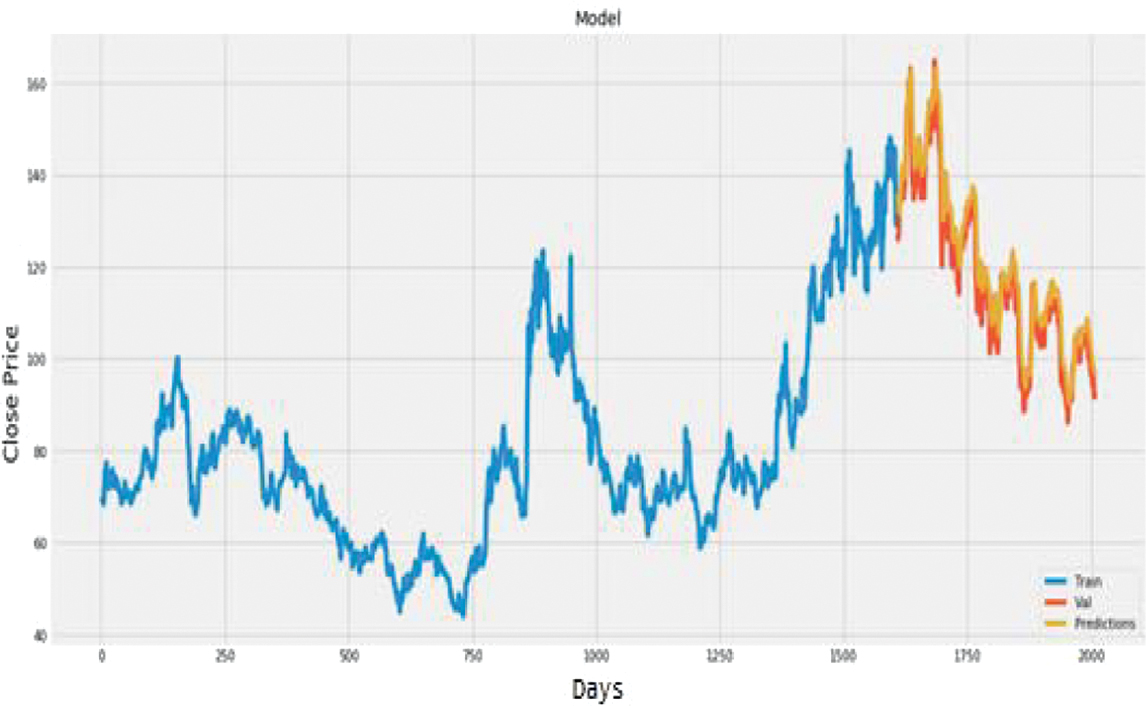 Fig. 20. Plot of actual vs. predicted values for ONGC using LSTM.
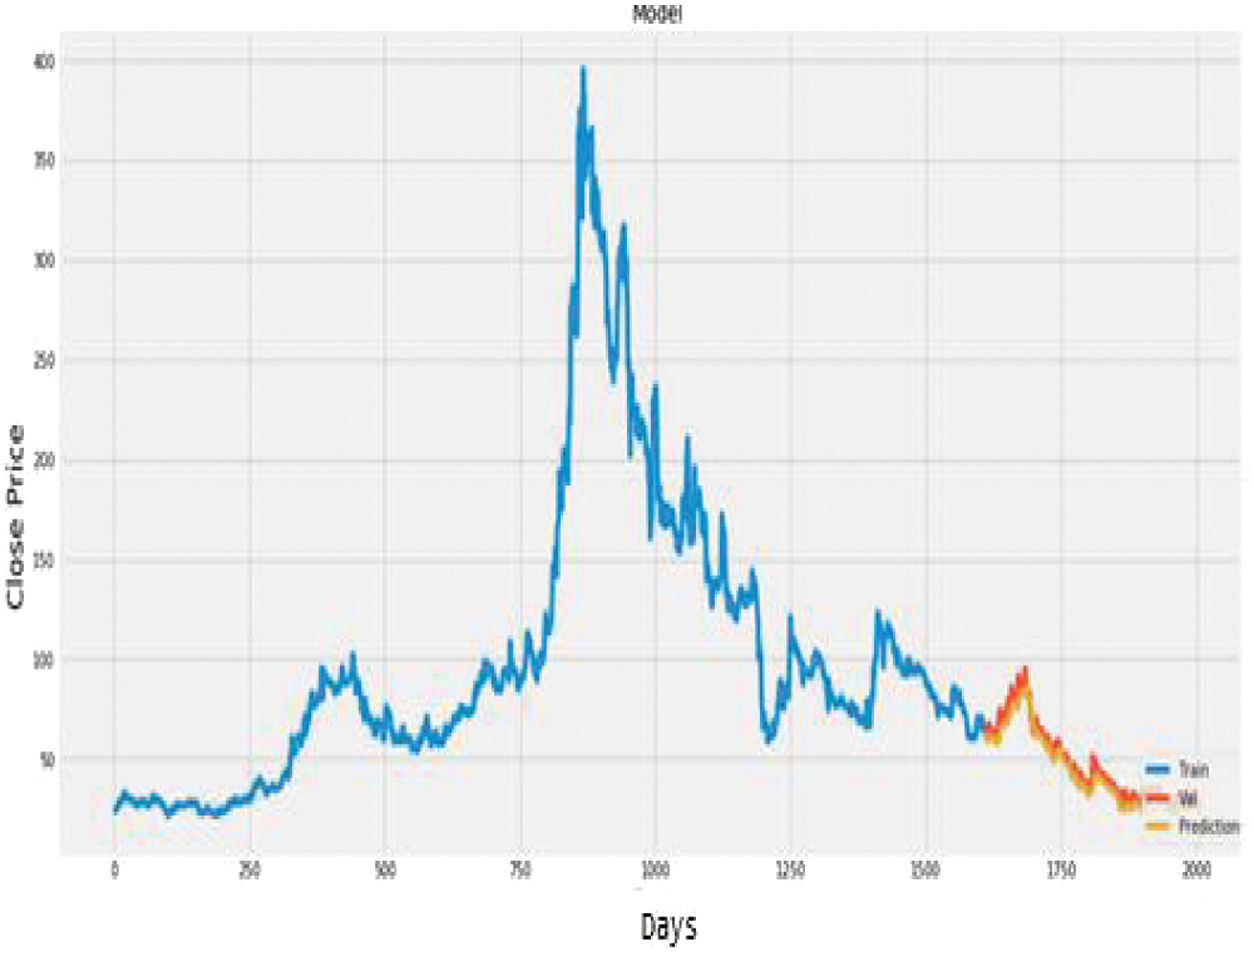 Fig. 21. Plot of actual vs. predicted values for Infosys using LSTM.
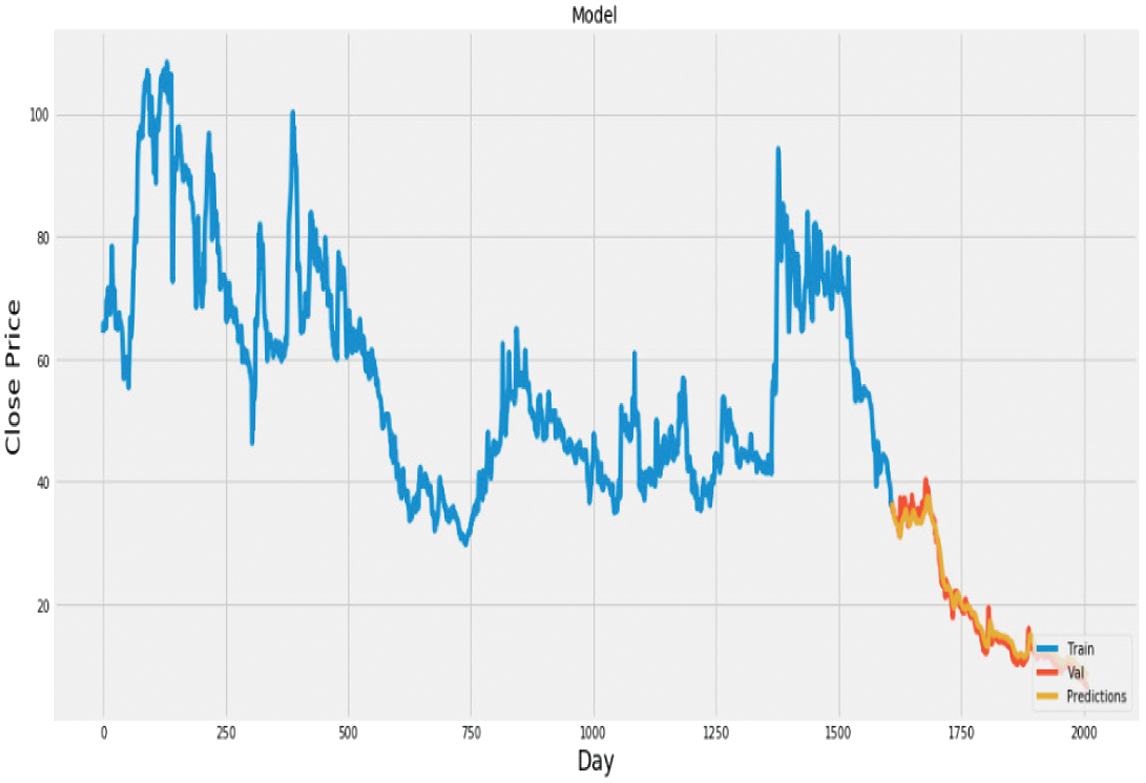 Fig. 22. Plot of actual vs. predicted values for Vardhman Polytex using LSTM.
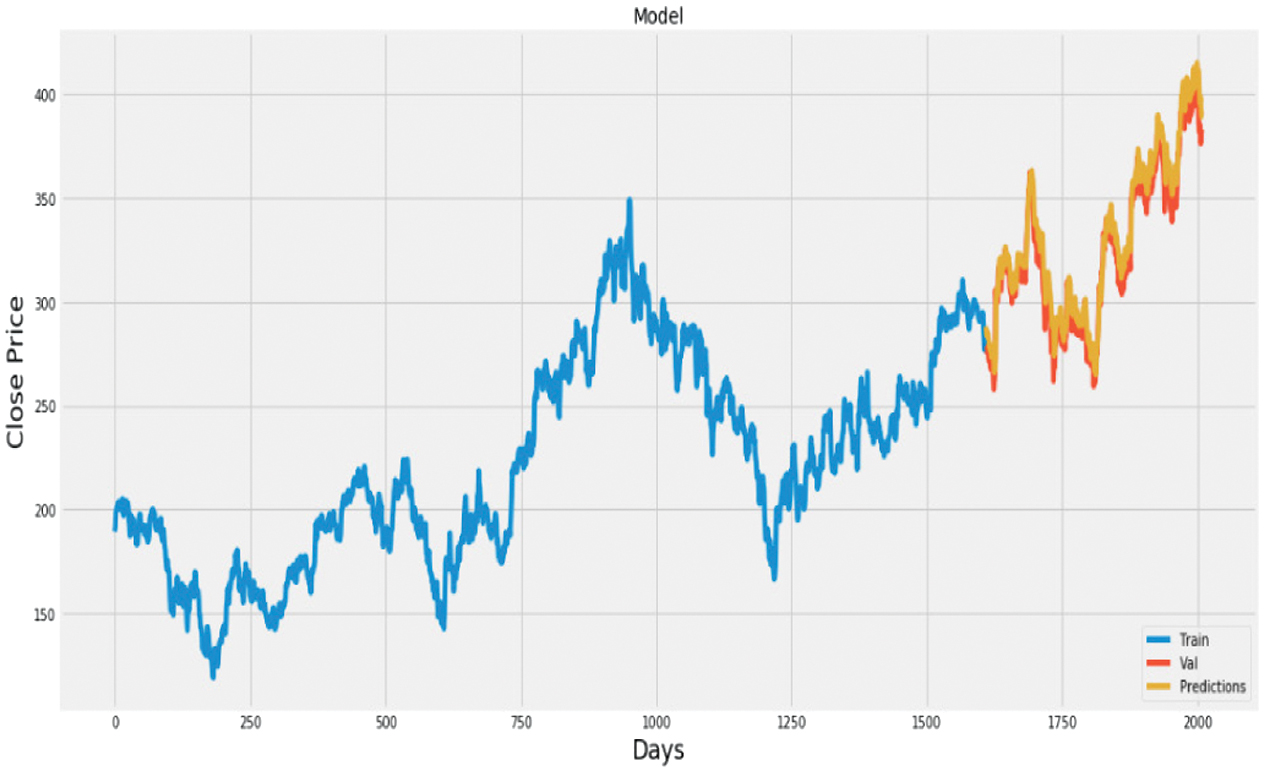 Fig. 23. Plot of actual vs. predicted values for HDFC bank using CNN.
 Fig. 24. Plot of actual vs. predicted values for Cipla using CNN.
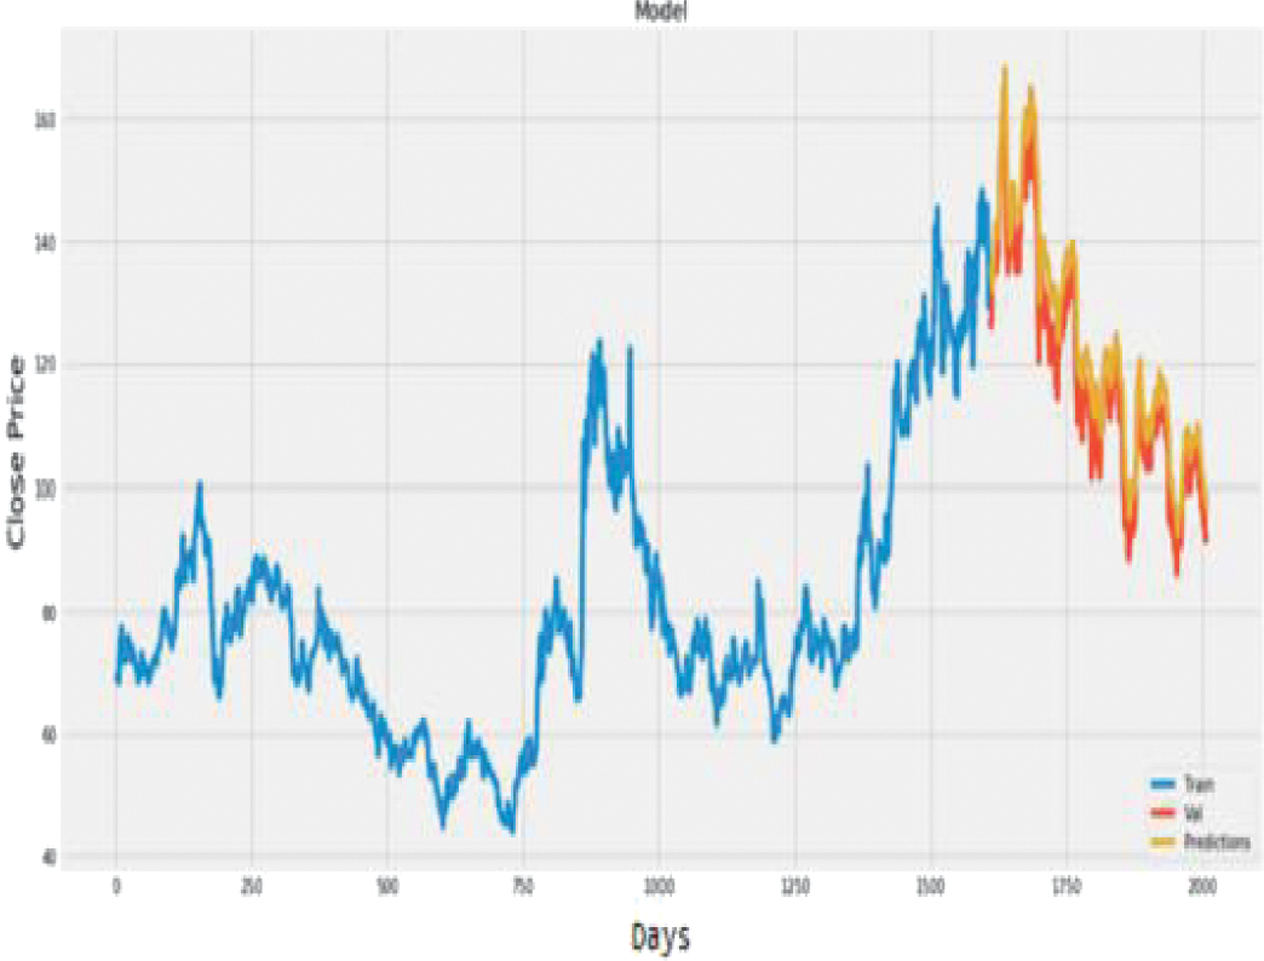 Fig. 25. Plot of actual vs. predicted values for ONGC using CNN.
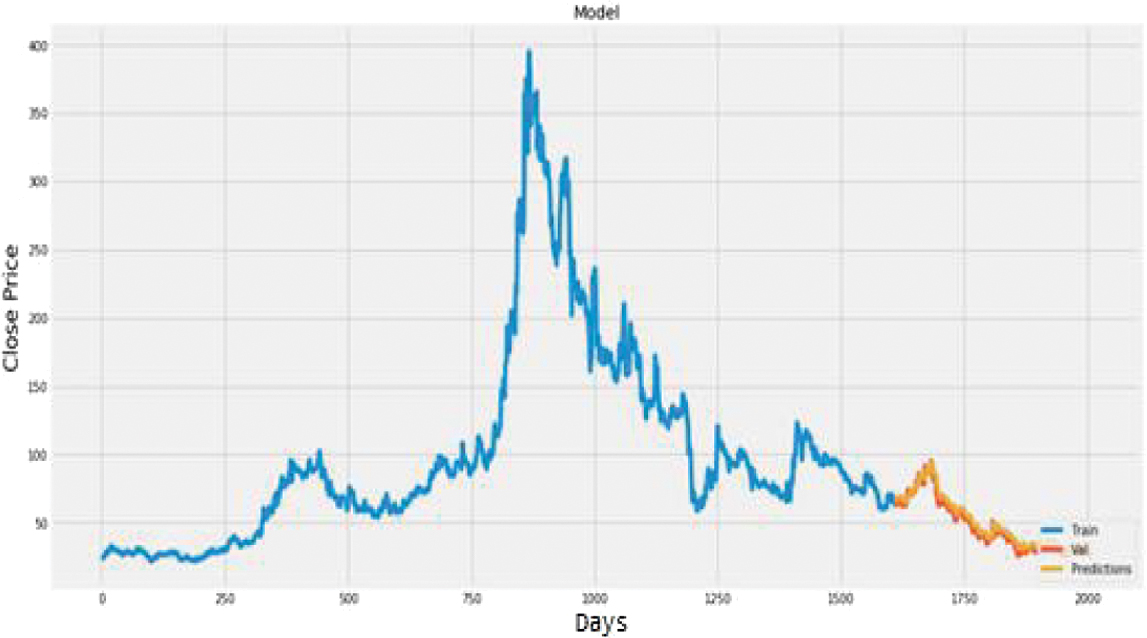 Fig. 26. Plot of actual vs. predicted values for Infosys using CNN.
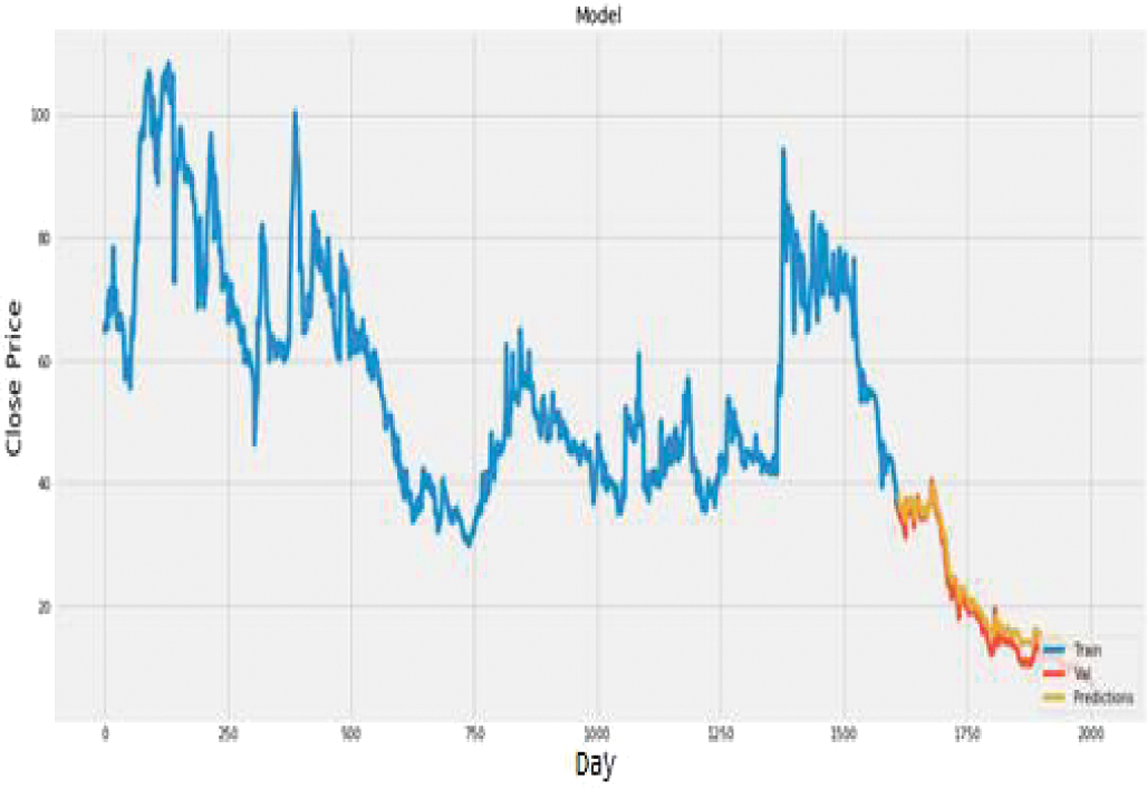 Fig. 27. Plot of actual vs. predicted values for Vardhman Polytex using CNN.
| Industry | Stock | RMSE (LSTM) | RMSE (CNN) | RMSE (LSTM+CNN) |
|---|---|---|---|---|
| Banking | HDFC Bank | 23.5309 | 9.1599 | 10.1597 |
| Pharmaceuticals | Cipla | 20.4290 | 17.2115 | 17.0616 |
| Petroleum | ONGC | 6.4296 | 7.6578 | 5.6235 |
| Software | Infosys | 5.7052 | 4.7176 | 2.0623 |
| Textiles | Vardhman Polytex | 2.3809 | 3.5974 | 3.2952 |
A.PERFORMANCE COMPARISON
The hybrid CNN+LSTM model demonstrated superior predictive accuracy due to its ability to capture both spatial and temporal dependencies. Traditional models like ARIMA and SVM struggle with the nonlinearities in stock price movements, whereas the hybrid approach excels by integrating CNN’s pattern detection with LSTM’s sequential modelling.
VI.CONCLUSION AND FUTURE WORK
This study evaluated three machine learning models—Long Short-Term Memory (LSTM), Convolutional Neural Network (CNN), and a hybrid LSTM-CNN architecture—for stock price forecasting using data from the National Stock Exchange (NSE). The hybrid model consistently outperformed standalone LSTM and CNN models by leveraging CNN’s spatial feature extraction and LSTM’s temporal dependency modelling to address the complexity of stock market behaviour.
Evaluation metrics like Root Mean Square Error (RMSE) and detailed visualizations demonstrated the hybrid model’s superior accuracy, robustness, and resource efficiency compared to traditional approaches like ARIMA and Support Vector Machines (SVM). The hybrid architecture is particularly well-suited for stock market prediction, offering a reliable tool for investors to optimize strategies and manage risks. The study also introduced innovative pre-processing and training strategies that enhanced the hybrid model’s performance. Despite its advantages, addressing challenges such as non-stationary data, model stability, and computational efficiency remains an area for future improvement.
A.FUTURE DIRECTIONS
- 1.Alternative Data Sources: Integrate macroeconomic indicators, news sentiment, and social media trends to enrich datasets and improve accuracy.
- 2.Advanced Architectures: Explore emerging models like Transformers and Graph Neural Networks (GNN) to uncover deeper insights.
- 3.Real-Time Implementation: Develop real-time systems for actionable intraday trading predictions.
- 4.Sector-Specific Customization: Adapt the model for industry-specific applications to enhance precision.
- 5.Scalability: Optimize computational efficiency for deployment in high-frequency trading environments.
- 6.International Analysis: Expand the approach to global markets to assess its generalizability.
B.LIMITATIONS
- 1.Data Quality: Dependence on clean and well-structured data makes the model vulnerable to noisy or missing data.
- 2.Market Volatility: Sudden economic or political changes can reduce prediction accuracy.
- 3.Overfitting: Risk of overfitting on small datasets, even with regularization techniques.
- 4.Interpretability: Limited transparency in predictions may hinder trust among analysts.
- 5.Computational Demand: High resource requirements restrict its use in smaller-scale applications.
- 6.Sector Variability: Requires customization for optimal performance across industries.
- 7.Hyperparameter Sensitivity: Performance is sensitive to hyperparameter selection, requiring careful optimization.
C.ADDRESSING LIMITATIONS
To overcome these challenges, future research will focus on:
- •Employing advanced pre-processing techniques, like wavelet transforms, for non-stationary data.
- •Conducting stability and sensitivity analyses across diverse market scenarios.
- •Enhancing model interpretability using attention mechanisms to build trust in predictions.
- •Optimizing scalability for real-time deployment in real-world trading environments.
By addressing these areas, future work can pave the way for more robust and practical solutions in stock market prediction.