I.INTRODUCTION
Driven by globalization and technological innovation, the manufacturing industry is undergoing unprecedented transformation. As a product of the integration of manufacturing and service industries, service-oriented manufacturing has become a new engine for promoting manufacturing upgrading and economic growth [1,2]. Service-oriented manufacturing not only emphasizes the production and quality of products but also focuses on providing personalized services and overall solutions to meet the diverse needs of consumers [3]. As mobile applications and Internet of Things technology develops, the collection and utilization of data resources have become particularly important, providing intelligent decision-making support, efficiency improvement, and customer service optimization possibilities for service-oriented manufacturing [4]. However, the phenomenon of data silos seriously restricts the potential of data in service-oriented manufacturing [5]. Data trading promotes the circulation and value realization of data elements by establishing standardized and efficient data trading venues and rules, but the value of data is difficult to evaluate, making it difficult to promote data trading on a large scale [6,7]. In traditional data trading, pricing data products almost does not consider the buyer’s factors and relies solely on the data owner’s independent pricing. Such pricing method often leads data owners to pricing their own products beyond the actual value of the data products themselves. This practice greatly hinders the circulation and promotion of data products. The Analytic Hierarchy Process (AHP) can analyze the factors that affect the pricing of data products, considering the impact of different factors on their pricing. Combining Fuzzy Comprehensive Evaluation (FCE) can evaluate the intrinsic value of data products. Therefore, in order to improve data circulation and ensure the security to stability of data transactions, the study proposes using AHP combined with FCE to evaluate the value of data. While ensuring that the pricing of data is not lower than its own value, the buyer factor is included in the pricing consideration. Finally, the PWYW (Pay What You Want) pricing mechanism is used to automatically price the data during the data transaction process.
The innovation of the research lies in using AHP to calculate the impact of different influencing factors on the value of data products and using Fuzzy Comprehensive Evaluation (FEC) to automatically price data products based on the analysis results of AHP and the PWYW mechanism. At the same time, research is also considering privacy compensation for data owners in pricing. The main contribution is to improve the scientific and rational pricing of data services, promote the effective utilization of data assets, and provide innovative solutions for the transformation and upgrading of service-oriented manufacturing. By building an intelligent trading system, it can facilitate data transactions between buyers and sellers in a secure and reliable environment, promoting the upgrading of the manufacturing service industry.
The remainder of the paper is organized into four parts. Part 1 is a literature survey on research related to data trading and automatic pricing. Part 2 is based on AHP-FCE for Data Value Assessment (DVA) research and automated pricing methods for data trading. Part 3 is an experimental analysis of value assessment methods and automated pricing methods to verify the feasibility of the method. Part 4 is a summary of the research content.
II.RELATED WORKS
The pricing methods and protection of data transactions have always been the main issues in data circulation in the information age. Cui W et al. designed a blockchain-based transaction system Ecare to address privacy data management issues and achieve privacy-protected data sharing. This system achieved transparency and immutability in data transactions, and it can be extended to more general big data privacy protection and data transaction scenarios [8]. Zhao B et al. proposed a reputation evaluation model with evaluation entities to address the problem of inaccurate subjective and qualitative evaluations in traditional reputation evaluation models in data transactions. This model could safely and effectively assess the reputation of the seller [9]. Yuezhou C et al. outlined the flow and transactions of individuals and companies based on public data and classified data factors to provide a complete picture of data flow and transactions. Data trading was complex and diverse, and the global data market was rapidly developing. The proportion of China’s data market was relatively low, and relevant institutional systems needed to be improved [10]. Huang G et al. proposed the bidirectional trusted transaction protocol Bitrans to solve the problem of realizing data value in blockchain systems. This protocol utilized different asset characteristics and controlled transaction status through a new consensus algorithm. Experimental results have shown that it can achieve the exchange of different assets under limited resources [11]. Bin Z et al. raised a data price dynamic evaluation model with credit game theory to address the issues of pricing inequality and credit deficiency in data trading. This model could initialize pricing mechanisms, evaluate data prices, and control price difference percentages, with a high trading success rate [12].
Li B et al. proposed an improved subscription scheme to address the increasing demand for data and the instability and no arbitrage issues of existing subscription schemes, which includes two parts: computation and specific validity. This scheme could stabilize pricing and maximize seller profits while giving the plan more rationality [13]. Xu Y et al. proposed a data collection market and iterative bilateral auction mechanism for the Internet of Vehicles to maximize social welfare. They constructed a data energy trading ecosystem based on bilateral auctions. The system was economically feasible, operated efficiently, and converged quickly [14]. Jiang W et al. raised a blockchain data repair technology based on data migration to ensure the security of data in data transactions, and they established a multi-party data migration on chain repair system. This technology used chameleon hash algorithm combined with controlled data restoration strategy for data restoration. Compared with traditional algorithms, this algorithm could reduce data repair costs by 10% [15]. Saba T et al. proposed a secure blockchain model to address the security issues of heterogeneous services and financial transactions in the big data environment. This model could protect intelligent service financial interactions, improve network throughput, reduce computational overhead, data latency, response time, and minimize packet loss [16]. Liu Z et al. raised a secure electricity data trading scheme to address privacy protection, transaction security, and data reliability issues in electricity data trading. This scheme could achieve privacy protection, transaction security, and data reliability, and the privacy protection attributes have been verified in real cases [17].
In summary, existing studies mostly focus on a single data type, lacking extensive applicability studies for evaluating the value of multiple types of data. Many studies have failed to fully consider the need for user privacy protection in data pricing, especially in the context of increasing risks of data breaches, and they lack effective privacy compensation mechanisms. In addition, existing technologies have shown insufficient performance in dealing with the dynamic and real-time issues in data trading, making it difficult to adapt to rapidly changing market environments. Finally, although some studies have proposed data transaction models that combine blockchain and other technologies, further exploration and solutions are needed to balance efficiency and security, and to achieve cross-platform data interoperability in practical applications. The circulation of important data relies on data transactions. In the current data trading market, the intangibility and replicability of data make it difficult to clearly define its ownership. The rights and obligations between data suppliers, demanders, and trading platforms are unclear, and the legal effectiveness of data trading contracts is uncertain. The value of data is influenced by various factors, including data integrity, accuracy, real-time performance, etc. In a complex market structure, there are issues of information asymmetry and uneven bargaining power among multiple stakeholders. Unreasonable pricing results are also detrimental to the growth of the data trading market. At present, the lack of unified DVE standards and pricing mechanisms has led to difficulties in data pricing. Therefore, this study proposes combining AHP and FCE evaluation methods to construct an evaluation method for data value and designing an automatic pricing algorithm for data trading based on the PWYW mechanism and Stackelberg game theory.
III.DVE AND AUTOMATIC PRICING METHODS
A.DVE METHOD BASED ON AHP-FCE
The value of data is directly related to its data type. The main circulating data in the current data trading market is manufacturing service data [18]. This study takes manufacturing data as an example to analyze its value evaluation. Manufacturing service-related industries not only need to provide products in the market but also need to provide other services related to products. When evaluating the value of data, it needs to consider the basic characteristics of the data, focus on its specific applications, and take into account the impact of market factors [19,20]. According to the above requirements, this study constructs a DVE index system, as denoted in Table I.
Table I. Data value evaluation index system
| Dimension | Indicator name | Dimension | Indicator name |
|---|---|---|---|
| Quality dimension | Data integrity | Application dimension | Data scarcity |
| Data correctness | Data timeliness | ||
| Consistency | Scenario economy | ||
| Data repeatability | Data correlation | ||
| Obtain difficulty level | Multidimensional data |
The DVE indicator system constructed is divided into two dimensions, with the quality dimension including data integrity, correctness, consistency, repeatability, and ease of acquisition, and the application dimension including data scarcity, timeliness, correlation, scenario economy, and multi-dimensionality. This study uses AHP to determine the weights of indicators, including the construction of judgment matrices, consistency checks, and weight calculations. When constructing the judgment matrix, this study constructs it from two dimensions. The quality dimension judgment matrix is shown in equation (1) [21,22].
In equation (1), is the quality dimension judgment matrix. is of equal importance for two factors. a, b, 1/b, and 1/c indicate that the importance of one factor is slightly, significantly, strongly, and absolutely superior to another factor. The judgment matrix of the application dimension is shown in equation (2).
Consistency testing requires first calculating the consistency index, as shown in equation (3).
In equation (3), is the consistency indicator. means the maximum eigenvalue of the maximum judgment matrix. means the order of the judgment matrix. The consistency ratio can be calculated by combining the consistency index with the random consistency index, as shown in equation (4).
In equation (4), means the consistency ratio. means a random consistency indicator. Comparing the consistency ratio results with the set threshold can determine whether the quality dimension and application dimension indicators meet the consistency requirements. After confirming that the consistency of the indicators meets the requirements, the judgment matrices of the quality dimension and application dimension are subjected to eigenvalue decomposition to obtain the eigenvectors of the two judgment matrices. After normalizing it, the sum of indicator weights is set to 1, and the weights of the DVE indicators can be obtained by integrating the two dimensions of indicators [23,24]. The designed data foundation value evaluation model is shown in equation (5).
In equation (5), is the fundamental value of the data, is the -th normalized metric value, and means the weight of the -th indicator. The fundamental value of data cannot directly determine the market value of data, and the value of data assets needs to be determined based on the data application market. The constructed data asset value evaluation model is shown in equation (6).
In equation (6), is the data price of the corresponding data type in the market, and is the correction coefficient for the value of data in data application scenarios. In practical scenarios, the value of data will dynamically change with market conditions. To make DVE more in line with market conditions, this study introduces three dynamic factors of satisfaction, transaction frequency, and scarcity from the perspectives of users, market, and data, and dynamically optimizes DVE [25,26]. When evaluating the dynamic impact of user satisfaction on DVE, it needs to construct a user satisfaction evaluation index system, as shown in Fig. 1.
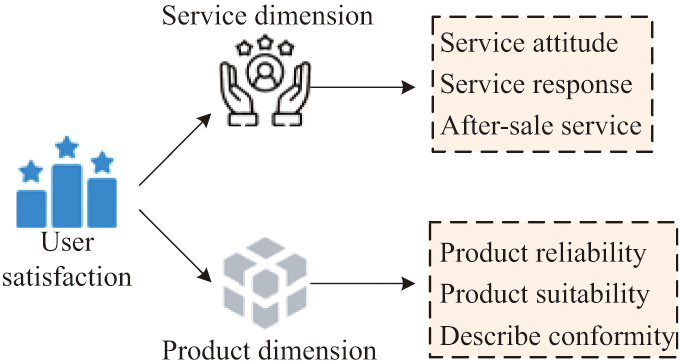 Fig. 1. User satisfaction evaluation index system.
The evaluation system is divided into two dimensions: product and service. The product dimension includes reliability, suitability, and description conformity, while the service dimension includes attitude, response, and after-sales service. The evaluation of user satisfaction involves many influencing factors, and there is a fuzzy phenomenon in the evaluation indicators. This study uses FCE to process user satisfaction. FCE is a multi-factor decision-making method with fuzzy mathematics. It transforms qualitative evaluation into quantitative evaluation through fuzzy logic, which is particularly suitable for dealing with complex problems with uncertainty and fuzziness. Its operational steps are shown in Fig. 2 [27,28].
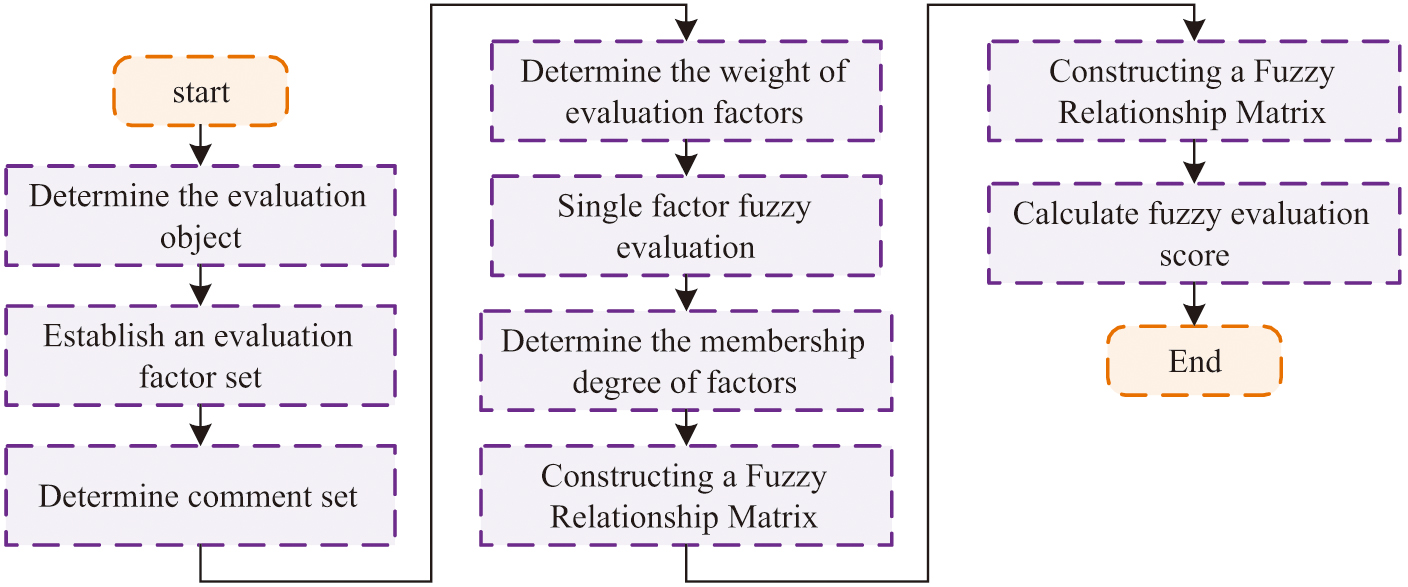 Fig. 2. The operation steps of the fuzzy comprehensive evaluation method.
When using FCE to evaluate user satisfaction, it is necessary to first determine the evaluation factors and comments. The evaluation factors for user satisfaction evaluation are six evaluation indicators. This study will set the comments into five levels: very satisfied, dissatisfied, average, relatively satisfied, and satisfied. After determining the evaluation factors and comments, it is necessary to determine the weights of the relevant evaluation indicators. This study uses the AHP method to determine the weight of rating indicators, and the operation steps are consistent with the calculation steps of the DVE indicator system weight. After determining the weights of the indicator system, a single-factor fuzzy evaluation is used to evaluate each factor and determine its membership degree to each comment, constructing a fuzzy relationship matrix. The evaluation score is obtained by performing fuzzy operations using weight vectors and fuzzy relationship matrices. The calculation of transaction frequency is shown in equation (7).
In equation (7), is the historical transaction count of the data, is the number of transactions per unit time for data, and means the number of transactions during the current time period. The calculation of data scarcity is shown in equation (8).
In equation (8), is the scarcity of data, is the frequency of occurrence of the data in the corresponding field, is the expert’s assessment of the scarcity of the data, and is a scarcity evaluation parameter. After adding the three dynamic influencing factors mentioned above, the DVE model is shown in equation (9).
In equation (9), and are the DVE results after and before dynamic optimization, is the variable of dynamic influencing factors, and is the weight of dynamic influencing factors.
1.AUTOMATIC PRICING METHOD FOR DATA TRADING BASED ON PWYW MECHANISM AND STACKELBERG GAME
After evaluating the value of the data, transaction pricing can be determined based on the evaluation results and the specific circumstances of both parties involved in the transaction. PWYW is a nontraditional pricing mechanism that grants consumers maximum pricing autonomy. In this mode, consumers are free to decide the price they are willing to pay for a product or service, including paying zero price. The PWYW pricing strategy is becoming increasingly popular in the service industry and digital products. When pricing data products based on the PWYW mechanism, it is necessary to consider the basic logic of user payment and external influencing factors. The conceptual model of the constructed data product PWYW is shown in Fig. 3.
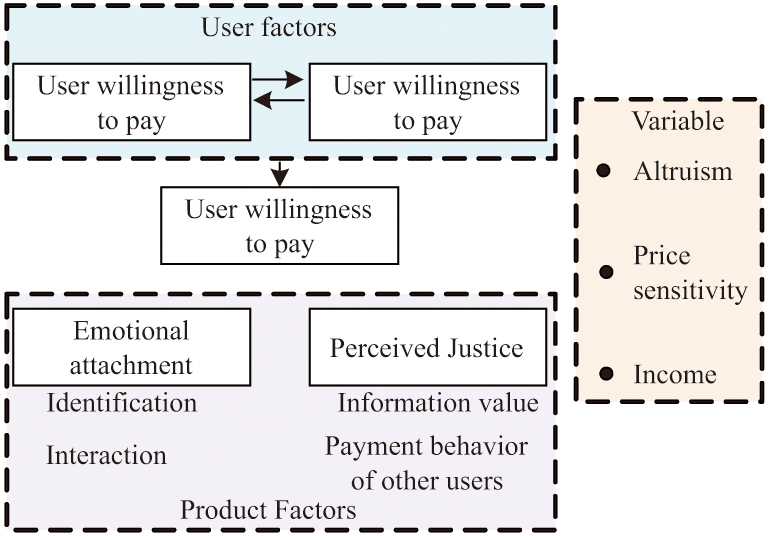 Fig. 3. Data product Pay What You Want conceptual model.
The willingness of users to pay for data products can be broken into data product factors and user factors. The factors of data products include emotional attachment and perceived fairness. Emotional attachment mainly refers to the user’s identification and interactivity with the data product. Perceived fairness mainly refers to the actual value of the data product and the payment value of other users for the product. User factors include the type of data product and impulse buying tendency. The types of data products can be roughly classified as hedonic and practical. Impulsive buying tends to be directly related to the user’s own situation and has no other potential influencing factors. The control variables for user payment include altruism, price sensitivity, and user income [29,30]. Based on this conceptual model, this study proposes using Stackelberg game theory for automated pricing of data products. Stackelberg game is a non-cooperative sequential game model. The mechanism of the automated pricing method for the designed data product is shown in Fig. 4.
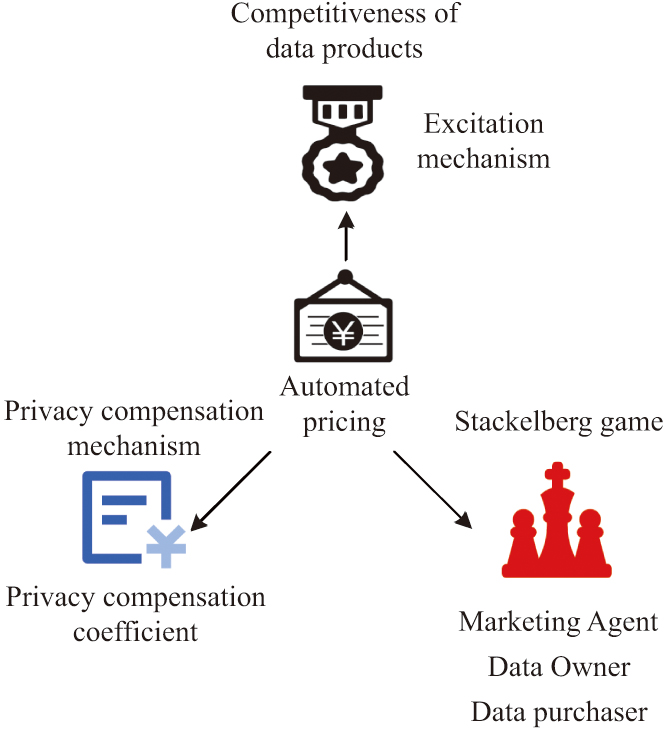 Fig. 4. Automatic pricing mechanism of data products based on the Starkerburg game.
The mechanism of automated pricing method for data products based on Stackelberg game includes three-stage game mechanism, incentive competition mechanism, and privacy compensation mechanism. When users pay for data products, their willingness to pay is strongly correlated with data prices. When pricing data products, the owners of the data products will interact with each other. The stronger the competitiveness of data product owners, the higher the willingness of users to pay for their products. The competitiveness calculation of data owners is shown in equation (10).
In equation (10), is competitiveness, is the data price, and is the quantity of data price. The privacy compensation mechanism is designed to compensate data owners for the risk of data leakage during data transactions, by increasing the basic pricing of relevant data by data owners through privacy compensation coefficients. The expression for the privacy compensation coefficient is shown in equation (11).
In equation (11), is the privacy compensation coefficient, and is the sales record of data products. In the Stackelberg game designed based on the PWYW mechanism in this study, participants include data owners, data buyers, and market agents. The first stage of the three-stage game mechanism is the market agency game. Market agents need to utilize data price distribution to maximize their own utility, as shown in equation (12).
In equation (12), maximizes the market agency utility, is the unit cost of data ownership by the data owner, is the distribution of market agency prices, and is the distribution of purchase quantities. When the game reaches Nash equilibrium, the selected party among the data owners and their data product quotes can be calculated. The second game is a data buyer game, where the data buyer needs to maximize their utility based on the amount of paid data, as shown in equation (13).
In equation (13), maximizes the utility of the data purchaser, and is the quantity of data purchased. When the second game reaches Nash equilibrium, the optimal purchase quantity for data buyers can be obtained. The third game is the data owner game, where the price obtained by the data owner is influenced by the price, purchase quantity, and privacy compensation. Therefore, data owners need to use these three influencing factors to maximize their own utility, as shown in equation (14).
In equation (14), is maximizing the utility of the data owner. When the third game reaches Nash equilibrium, the optimal privacy compensation coefficient for the data owner can be obtained. When using this mechanism to price data products, it is necessary to solve the Nash equilibrium point. The Nash equilibrium solution algorithm designed is shown in Fig. 5.
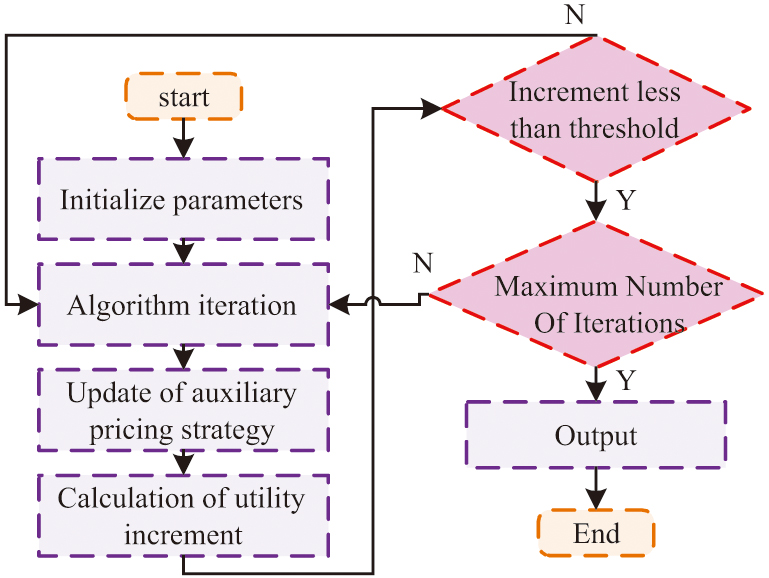 Fig. 5. Solving algorithm for Nash equilibrium based on iterative gradient update.
The steps for solving the Nash equilibrium point are as follows: the first step is to initialize parameters, including price distribution, purchase quantity, privacy compensation coefficient, auxiliary pricing strategy, iteration number, learning rate, and convergence threshold. The second step is algorithm iteration, which iteratively calculates the number of decisions for each data owner and data buyer based on the current auxiliary pricing strategy. The third step is to use gradient ascent method to update the auxiliary pricing strategy based on data owners and market agents. The fourth step is to calculate the utility increment and determine whether to stop the iteration. If the increment is less than the threshold, the algorithm is considered to have converged and the iteration is stopped. If the increment is greater than the threshold but the required number of iterations has been reached, stop iterating. The fifth step is to output the result, which is to output the final Nash equilibrium point, including price distribution, purchase quantity, privacy compensation coefficient, etc.
IV.DVE AND AUTOMATIC PRICING EXPERIMENTAL VERIFICATION
A.EXPERIMENTAL ENVIRONMENT AND PARAMETER SETTINGS
Two experiments are designed for our research, with Experiment One being a data value evaluation experiment. In this experiment, the data products used in the study are divided into practical and hedonic types. Practical data products include test datasets, teaching courses, artificial intelligence models, software data products, etc. In order to ensure the wide applicability of the automatic pricing model designed for research, one data product was selected from each of the source datasets, online teaching courses, artificial intelligence models, software data products, and data equity combination products for model validation. Enjoyment-oriented data products include music, movies, TV dramas, electronic novels, entertainment videos, etc. The study selected one of the currently popular products from the five types of enjoyment-oriented data products for model validation. Experiment 2 is an automatic pricing experiment for data trading. This experiment analyzes the hedonic products selected in Experiment 1. Table II shows the parameter information of experimental equipment and Experiment 2.
Table II. Experimental equipment information and related parameter setting
| Facility information | Parameter setting | ||
|---|---|---|---|
| Item | Type | Name | Value |
| Operating system | Windows 10 64bit | Maximum price | 12 |
| GPU | NVIDIA GeForce GTX 1660Ti | Minimum purchase quantity | 1 |
| CPU | Intel(R) Core(TM) i5-12450H | Maximum purchase quantity | 50 |
| Equipped with RAM | 32GB | Fitting parameter 1 | 5 |
| Memory | 1T | Fitting parameter 2 | 10 |
| / | / | Fitting parameter 3 | 10 |
B.VERIFICATION OF DVE EXPERIMENT
This study first determines the weights of the data product value evaluation index system and the user satisfaction evaluation index system, as indicated in Table III.
Table III. Evaluation index system weight
| Data value assessment | User satisfaction | ||||
|---|---|---|---|---|---|
| Index | Weight | Index | Weight | Index | Weight |
| Data integrity | 0.2032 | Data scarcity | 0.1589 | Product reliability | 0.2494 |
| Consistency | 0.1115 | Data timeliness | 0.1707 | Product suitability | 0.3959 |
| Data correctness | 0.0996 | Multidimensional data | 0.0852 | Describe compliance | 0.1047 |
| Obtain difficulty level | 0.0322 | Data correlation | 0.0540 | Attitude towards customers | 0.0799 |
| Data repeatability | 0.0535 | Scenario economy | 0.0311 | Service response | 0.1396 |
| / | / | / | / | After-sale service | 0.0305 |
In the DVE indicator system, data completeness has the greatest impact on data value, and its weight reaches more than 0.2. In the user satisfaction evaluation index, product suitability has the greatest impact on user satisfaction, and its weight reaches 0.39. The value assessment results of practical data products and hedonic data products are shown in Fig. 6.
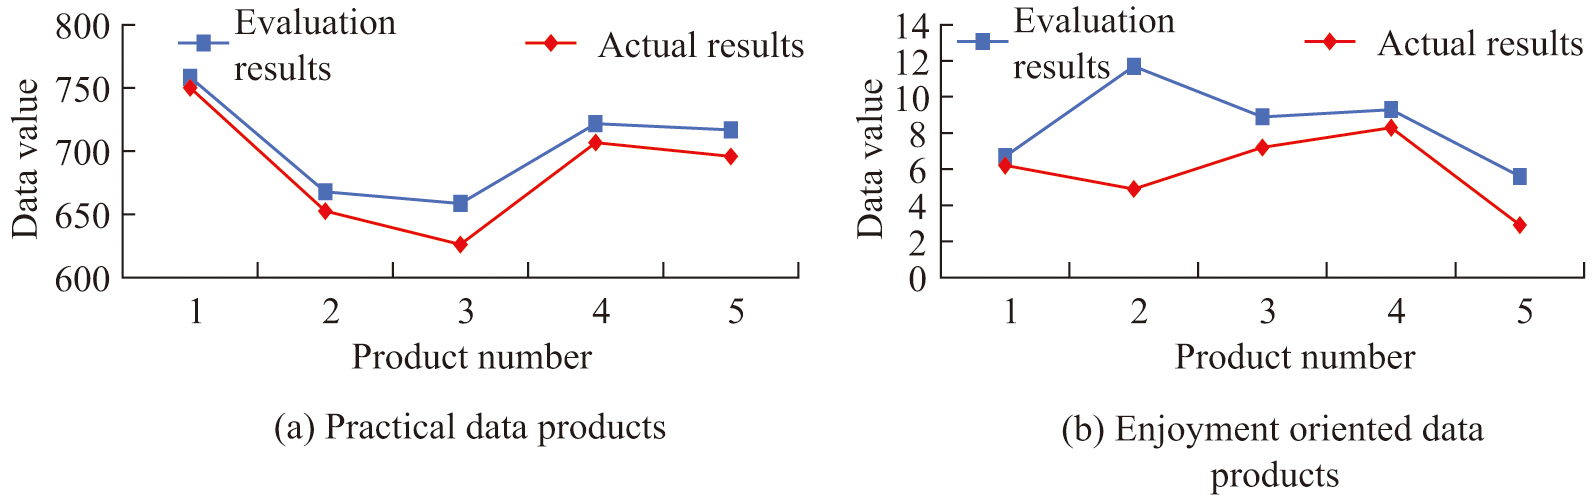 Fig. 6. Results of the data value assessment.
Figure 6(a) shows the value evaluation results of practical data products. The evaluation results of 5 different data products are similar to the current market evaluation results. The actual value and evaluation value of product 3 have the largest error, reaching 32.6, while the actual value and evaluation value of product 1 have the smallest error, only 8.3. Figure 6(b) shows the value evaluation results of hedonic data products. The value evaluation results of 5 different data products are similar to those of practical data products, and the error between the evaluation results and the actual results is relatively small. Among hedonic products, the evaluation result of data product No. 2 has the largest error with the actual result, reaching 6.8, while the value evaluation error of other products is less than 3. This experiment evaluated the value of data products using the AHP-FCE method, and the results showed that there was a small error between the actual value and the evaluated value, verifying the effectiveness of the proposed method. Among practical data products, product 3 has the largest error, while product 1 has the smallest error. The evaluation error of hedonic data products is generally less than 3, indicating that the evaluation model can accurately reflect the value of data products.
C.EXPERIMENTAL VERIFICATION OF AUTOMATIC PRICING IN DATA TRADING
This study analyzes the convergence effect of the Nash equilibrium solving algorithm, and the results are shown in Fig. 7. Figure 7(a) shows the convergence effect of data volume. Owners 1, 2, 4, and 5 all completed hand convergence in the 6th iteration, with owners 1, 2, 4, and 5 having converged data volumes of 26, 28, 24, and 23, respectively. Figure 7(b) shows the convergence result of data prices. The data prices of all owners remain between 2 and 4 yuan after convergence. The automatic pricing experiment was analyzed using the Nash equilibrium solving algorithm, and all data owners achieved hand convergence after 6 iterations, with data prices stabilizing between 2 and 4 yuan. The iterative results of market agency utility show that the maximum utility values of different owners fluctuate between 13.2 and 15.6, indicating that the automatic pricing mechanism can effectively achieve the maximum market agency utility of different data owners and achieve a win-win situation for all parties.
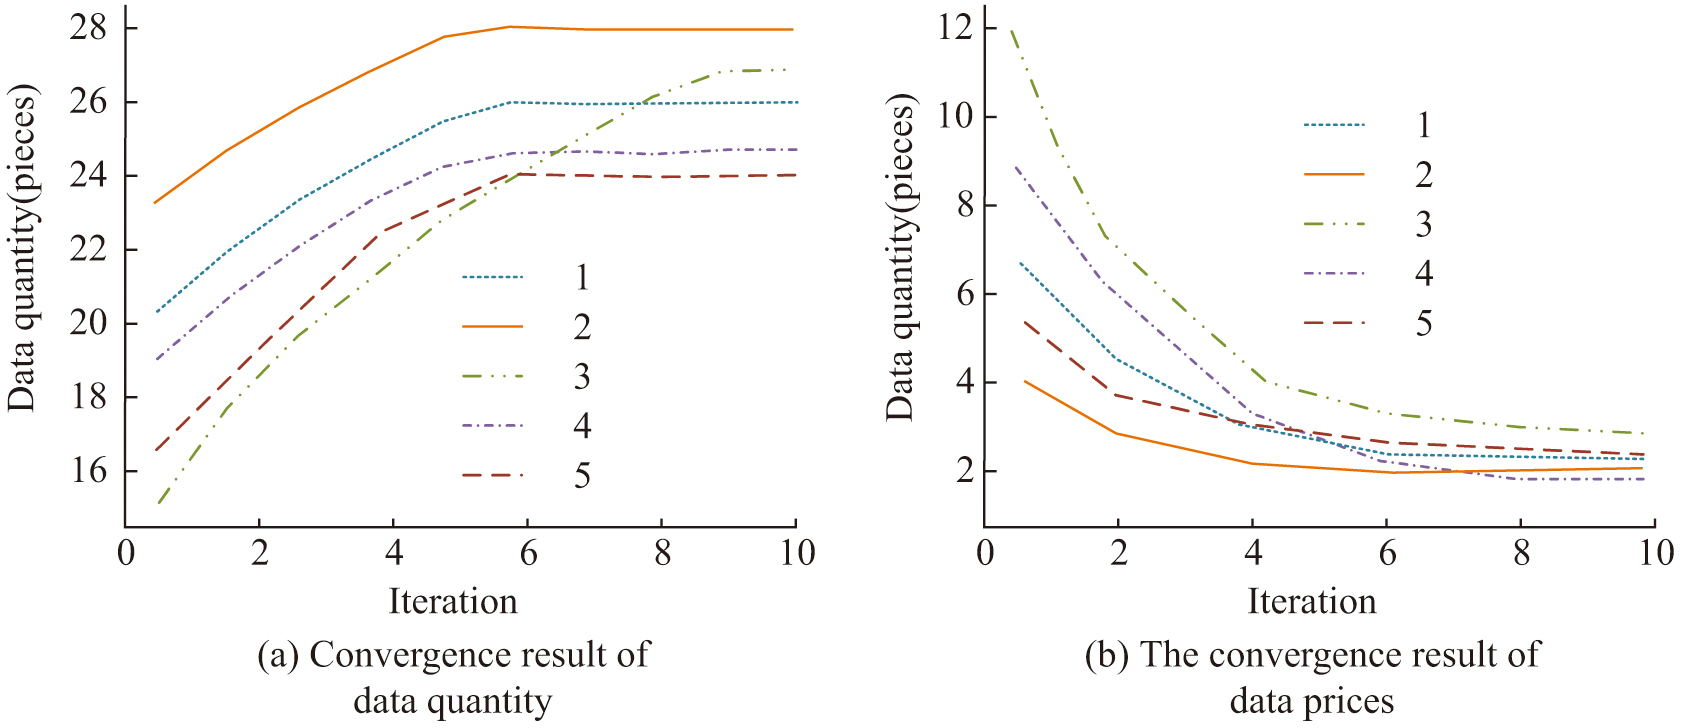 Fig. 7. Iterative effect of the Nash equilibrium solution algorithm.
Figure 8 shows the market agency utility iteration results and privacy compensation impact results of the automated pricing method for data products. Figure 8(a) shows the iterative results of market agency utility. The maximum utility of owners 1, 2, 3, 4, and 5 is 14.6, 13.2, 15.6, 13.5, and 14.3. Figure 8(b) shows the results of privacy loss compensation. As the privacy compensation coefficient increases, the winner utility will also gradually increase. When the privacy compensation coefficient is 0.6, the maximum winner utility is 9.3, and when the privacy compensation coefficient increases to 0.9, the maximum winner utility is 12.2. The experiment analyzed the impact of market agency utility and privacy compensation on automatic pricing methods. As the privacy compensation coefficient increases, the utility of the winner gradually increases. When the privacy compensation coefficient is 0.6, the maximum winner utility is 9.3. When it increases to 0.9, the maximum winner utility can reach 12.2, indicating that the privacy compensation mechanism has a positive effect on improving the utility of data owners.
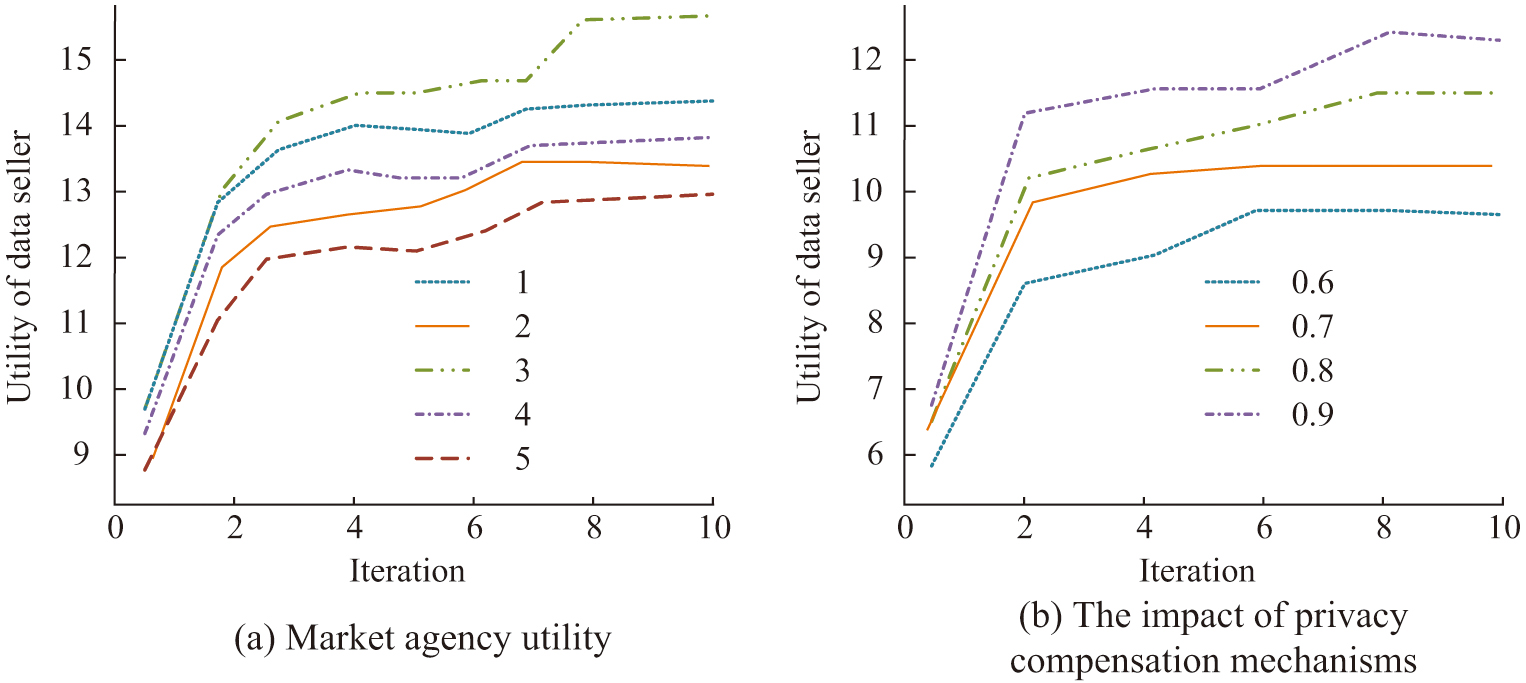 Fig. 8. The effect of market agency utility and the impact of privacy compensation.
This study randomly selects one hedonic data product from the top 20 in terms of current trading volume for pricing analysis, as denoted in Fig. 9. Figure 9(a) showcases the fitting result of the pricing results. Figure 9(b) shows the difference between the pricing results and the average market price over the past 30 days. The pricing results of the 5 products are basically perfectly matched with the average price results of the products in the past 30 days, with a maximum error of 0.6 yuan. The automated pricing method designed for data products is in line with market conditions and can be automatically adjusted according to market conditions. This experiment compared the changes in trading volume of data using different pricing methods over the past 30 days and found that the market using the automatic pricing scheme designed in this study reached market saturation after 25 days, with trading volume stabilizing at around 221 after saturation. This indicates that the pricing scheme designed in this study can effectively increase the trading volume of the data trading market.
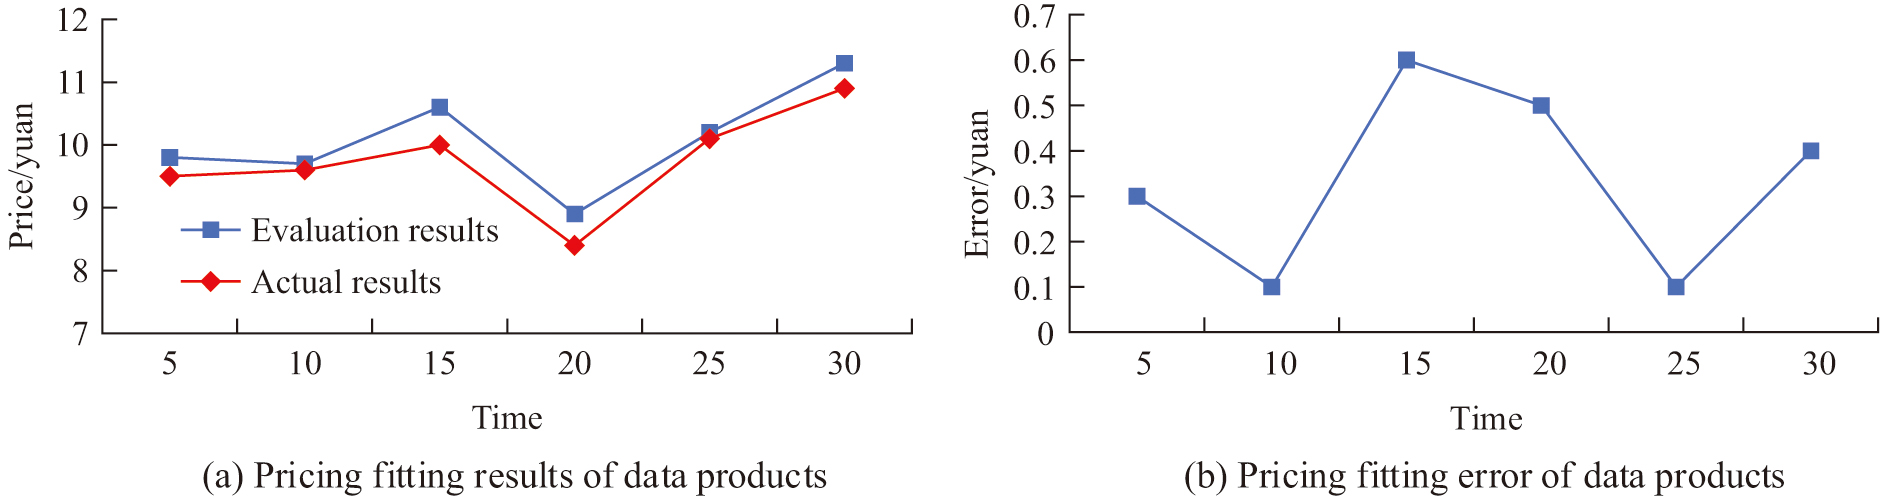 Fig. 9. Pricing and fitting results of the data products.
In order to further verify the effectiveness of the data trading automatic pricing method designed in the research, a comparison is made between the data trading market using the research-designed automatic pricing scheme and the data trading market using the traditional pricing scheme and the freeloading payment pricing method proposed by Wagner U et al. [27] in the past 30 days. The results are shown in Table IV.
Table IV. Data trading market volume changes for different pricing methods
| Time (d) | Proposed method | Traditional method | Freeloading payment pricing |
|---|---|---|---|
| 5 | 62 | 31 | 42 |
| 10 | 132 | 48 | 48 |
| 15 | 158 | 56 | 53 |
| 20 | 203 | 55 | 62 |
| 25 | 221 | 72 | 64 |
| 30 | 215 | 68 | 62 |
From Table IV, it can be seen that the data trading market using the research design pricing scheme only reached market saturation in the past 25 days, that is, as the statistical time increased, the market trading volume did not significantly increase and began to fluctuate in a small range. The market that adopts traditional pricing schemes reaches market saturation within 20 days. The market that adopts the research design scheme has a stable trading volume of around 221 after reaching saturation, while the market that adopts the traditional pricing scheme has the highest trading volume of only 72 after reaching saturation. The research design method can promote the trading volume of the data trading market.
In summary, the self-directed pricing method for data transactions designed in this study can accurately evaluate the value of data and adjust the pricing of data products by data owners through privacy compensation mechanisms. After using the research-designed pricing scheme for data products, the trading volume in the data trading market will significantly increase, indicating that the research-designed pricing scheme helps to improve data circulation.
V.CONCLUSION
To improve data circulation, ensure the rationality of data transactions, and expand the scale of data transactions, this study combined AHP and FCE to design a value evaluation method for data products. We combined PWYW mechanism and Stackelberg game to design an automated pricing method for data products. When evaluating the value of data products, the evaluation was mainly done from two dimensions: quality and application. The automated pricing method for designed data products constructed a three-stage game mechanism and added a privacy compensation coefficient. The results demonstrated that the constructed data product value evaluation method had a maximum value evaluation error of 32.6 for practical data products and 6.8 for hedonic data products. The automated pricing method designed could achieve maximum market agency utility for different data owners, achieving a win-win situation for owners, buyers, and market agents. When the privacy compensation coefficient was 0.9, the winner utility could reach its maximum value of 13.2. This pricing method had a maximum pricing error of 0.6 yuan for the product, which was close to the market price. The constructed data product value assessment method could accurately assess the value of data. The pricing results of the automated pricing method for data products were in line with market conditions and could be automatically adjusted according to market conditions. However, the designed data trading automatic pricing method required a large amount of computation when dealing with DVE. Future research will further optimize the DVE method by combining it with machine learning algorithms to improve the computational efficiency of DVE. In addition, the future study will also explore the use of multiple game mechanisms to incorporate the game of different data owners in data product pricing considerations, in order to further expand the generalization ability and robustness of the data product pricing scheme.