I.INTRODUCTION
Brain tumors are abnormal cells that grow in the brain and can generally be divided into two categories, primary brain tumors and secondary brain tumors, according to the source of the abnormal cells. Primary brain tumors are cells that originate directly from abnormal growths in the brain tissue, while secondary brain tumors are abnormal cells that spread to the brain after normal cells in other parts of the body have become cancerous. Magnetic resonance imaging (MRI), as a typical noninvasive imaging technique, can produce high-quality brain images without damage and cranial artifacts, which can provide more comprehensive information for the diagnosis and treatment of brain tumors, and is the main technical means for the diagnosis and treatment of brain tumors. The segmentation of brain tumor image by MRI is a very important step in the process of diagnosis and treatment of brain tumors, and with the help of multimodal brain image segmentation of tumors, doctors can perform quantitative analysis from the brain tumor thereby measuring the maximum diameter, volume, and amount of diseased tissue in the brain and develop the best diagnosis and treatment plan for the patient to quantify the response of the brain tumor before and after treatment.
Due to the needs of clinical application and scientific research, MRI brain tumor image segmentation has also become an important component in the field of medical imaging and has received extensive attention for a long time, and many segmentation methods for MRI brain tumor images have been proposed by researchers, but the existing methods are still not able to achieve satisfactory results in clinical MRI brain image segmentation all the time, which is also determined by the complexity of MRI brain images. In general, the difficulties in MRI brain image segmentation can be summarized as follows: 1) the limitations of imaging technology and image acquisition process factors lead to the existence of field shift effects, volume effects, motion artifacts, and noise in MRI brain images; 2) the tissue structure of the brain is very complex and not easy to be distinguished, and MRI brain images include not only the normal tissues of the brain such as the cortex, the cerebrospinal fluid, the white matter, the grey matter, and other normal tissues but also enhanced tumors, non-enhanced tumors, non-enhanced tumors, and other normal tissues, and also enhanced tumors, including enhanced tumors, non-enhanced tumors, edema, and necrotic areas within the tumor and other lesion tissues, and some of the tissue structures have high imaging similarity and are not easy to be distinguished; 3) the spatial location, shape, and size of brain tumors are variable, and the boundaries between different soft tissues or between soft tissues and lesion tissues may be blurred; 4) there are large differences in the structure of normal tissues and lesion tissues between different individuals, and even the same individual at different times may also have large differences. These factors have a significant impact on feature extraction and accurate segmentation in brain tumor image segmentation, and in the actual segmentation process, the impact of these factors can be handled accurately and timely to ensure the accuracy and robustness of brain tumor image segmentation.
Glioma is one of the most common malignant primary brain tumors in adults [1]. Gliomas are classified as grades I–IV based on malignancy, with different prognoses for each grade. Glioblastomas, the most aggressive type of brain tumor, account for roughly half of newly diagnosed gliomas [2,3,4]. In concurrent clinical trials, the median patient survival time for glioblastoma was approximately 14–17 months [5,6], compared to 12 months in population-based studies [7], with a 5-year survival rate of only 5.6% [1]. Early and accurate MRI evaluation of brain tumors affects patients’ estimated survival time and directly impacts patient treatment planning and tumor growth assessment. It is essential for improving patient care and survival rates [8,9].
Artificial intelligence has recently accelerated the development of several disciplines, including medicine. Several methods based on machine learning and deep learning to assess the prognosis of oncology patients have been rapidly developed [10,11]. Artificial intelligence methods for glioma have been developed, including predictive imaging grading, imaging genomics, and prognosis prediction [8,10,12]. Ahammed Muneer K. V. et al. presented a method for automatic glioma tumor grading from MRI images using a classifier from the Wndchrm tool and the VGG-19 deep convolutional neural network (DNN). The results showed that the classification accuracy of the Wndchrm classifier was 92.86%, and the classification accuracy of the VGG-19 DNN was 98.25% [13]. Many studies were based on the 3D-Uet algorithm. The segmentation performance of one of these studies classified gliomas with a dice score of 90% and an AUC of the glioma grading model of 94% in the validation set [14], while another study classified gliomas with a dice score of 91% [15]. Huigao Luo. et al. used this algorithm to diagnose and prognosticate gliomas, achieving 80.4% and 83.9% accuracy [16]. Similarly, the COX regression prediction model was also used with a C-index of 0.710 for OS prediction [17].
However, due to the small number of medically relevant datasets involved, there are still few automatic segmentation and prognostic assessment models based on deep learning radiomics, and the accuracy of the models requires further improvement. Manual segmentation of a clinically large number of MRI images for cancer diagnosis is a complex and time-consuming task, so brain tumor image automatic segmentation is required. Deep learning methods can efficiently process large amounts of MRI image data. Therefore, in this study, we propose an automatic segmentation network based on a deep 3D convolutional neural network and a new radiomics model with depth features to predict overall survival in glioblastoma patients. The patient’s lesion area is obtained based on the automatic segmentation technique, and radiomic features are extracted using pyradiomics with Python 3.7. After combining other clinical features, the features with a correlation greater than 0.7 are screened using the preprocessing Pearson correlation coefficient method. Then t-test is used to remove redundant features, and a lasso is used to reduce the dimensionality to obtain the important features. In addition, nine machine learning methods, including support vector machine, random forest, and XGBoost, are used to predict the overall survival and prognosis of glioma patients. Finally, the advantages and disadvantages of these algorithms are successfully compared. This study may provide a clinical interpretation of GBM classification and help us better to understand the relationship between glioblastoma and radiomic features.
Our primary contributions in this study can be summarized as follows:
- •A novel hybrid model combines deep learning-based segmentation with radiomics and clinical features for survival prediction is proposed for medical image segmentation.
- •An improved feature extraction pipeline that integrates deep learning features with traditional radiomics features is designed to capture both high-level and low-level imaging patterns, which are critical for accurate glioma segmentation and survival prediction.
- •Advanced data preprocessing techniques, such as intensity normalization and adaptive contrast enhancement, are utilized to reduce data heterogeneity and improve the quality of MRI scans.
- •Our method aimed to be clinically applicable, with a focus on automating the segmentation and prognosis processes. By reducing the reliance on manual segmentation, our approach can save time and minimize inter-observer variability, which is a significant challenge in clinical practice.
The rest of the paper is organized as follows. Section II discusses related studies. Section III illustrates the proposed method. Section IV introduces the experiments and results. Section V presents discussion and conclusions.
II.RELATED WORKS
Deep neural network models represented by AlexNet, VGGNet, ResNet, DenseNet, and GAN have been successfully applied to many computer vision tasks and have gained widespread attention in academia and industry. Given the powerful automatic extraction of highly discriminative features demonstrated by deep neural networks, they have been rapidly applied to the field of medical image processing and analysis. Meanwhile, deep learning-based brain tumor computer-aided diagnosis research has also gained widespread attention, especially the International Association for Medical Image Computing and Computer-Assisted Intervention (MICCAI) has organized the Multimodal Brain Tumor Segmentation Competition for consecutive years since 2012, which has greatly promoted the development of deep learning-based MRI brain tumor image segmentation research. As deep learning automatically acquires MRI tumor feature information from the training sample set through an end-to-end learning approach, it changes the manual feature extraction of traditional methods and achieves breakthrough performance progress over traditional methods. Based on the use of sample data labeling during network training, deep neural networks can be classified into supervised, semi-supervised, and unsupervised deep neural networks. Since supervised networks are able to make full use of data class label information during training, they generally achieve better accuracy performance than semi-supervised and unsupervised networks. In the research of deep learning methods for MRI brain tumor image segmentation, most of the existing deep segmentation networks also adopt supervised learning and have effectively explored various aspects such as network architecture, global or local contextual information feature extraction, and multi-scale feature fusion. In addition, due to the relatively small size of finely labeled brain tumor samples, some scholars have also carried out research on semi-supervised and unsupervised MRI brain tumor segmentation networks and obtained effective progress. Jianwu Long et al. [18] proposed a feature similarity module and a reliable region enhancement module to utilize the dense feature information of unlabeled data by combining dense feature prediction and segmentation features. This method pays more attention to the information utilization at the feature level and reduces pseudo-label noise by enhancing the weights of reliable regions. Lin Wei et al. [19] designed a novel semi-supervised learning framework that is the dual consistency regularization network for medical image segmentation. Model-level consistency effectively reduces the noise interference of pseudo-labels, while task-level consistency fully utilizes multi-scale information. The combination of these two aims to approximate low-entropy decision boundaries.
In recent years, deep learning radiomics has been increasingly used in gliomas; however, there is still room to explore the depth characteristics and their prognosis and grading. Most of the research focuses on using deep learning networks in tumor grading and classification [20,21]. For example, Hiba Mzoughi et al. proposed an efficient and fully automated deep multiscale three-dimensional convolutional neural network (3D CNN) architecture that can classify gliomas into low-grade and high-grade gliomas using T1 Gado MRI sequences [20]. In addition, there is still a large room for progress in deep learning network research on survival prediction [22,23]. For example, Xue Feng et al. developed a deep learning model based on 3D U-Net to perform tumor segmentation and extract radiomic features and other clinical features to predict the overall survival of patients. However, their model failed to achieve consistent segmentation performance in testing and validating cases for comparison [22]. Likewise, Xue Fu et al. used a two-branch Dense Net based on multichannel features for prediction, achieving up to 94% classification accuracy. However, the choice of loss function settings, the possibility of insufficient network training, and the possibility of a discrepancy between the generated image and the actual image limit its application in clinical settings [23]. It is unclear which strategies may be effective in predicting gliomas. By studying these studies, we are not using radiomic features alone as predictors, given the complexity of the clinical situation. Rather, we select clinical features that are closely related to prognosis and combine the two for survival prediction. In addition, to avoid the shortcomings of a single prediction model, we improve the fit of multiple learning models and select the best performing set of them. We hope that it will provide some basis and experience for the development of the combination of artificial intelligence and medicine to help clinical problem solving. We chose to optimize the 3D U-Net and expect to provide additional clinical interpretation for GBM classification. We hope it will help us to better understand the relationship between glioblastoma and imaging histological features for survival prediction.
Compared to manual segmentation, which takes a long time, and many professionals, the automatic brain tumor segmentation method of 3D U-net used in our study can save significant time. It can also avoid the possible operational differences between segmentation personnel and reduce errors during the experimental process [10]. Furthermore, pyradiomics can extract our radiomic features of interest following automatic segmentation by deep learning networks, providing quantitative image-based prognostic biomarkers that outperform semi-quantitative estimates [22,24,25]. Axis I3, like f1, is strongly associated with overall survival in the current study and may be a potential prognostic marker. In addition, Yizhou Wan et al. proposed some volumetric features related to glioblastoma recognition and survival using deep learning networks. Tumors with higher proportions of necrosis and contrast enhancement have lower survival rates, while tumors with nonenhanced proportions have improved survival rates [24,28,29].
III.METHODS
We train a deep-learning network (3D U-net) to segment tumors automatically. After the tumor image is segmented, the image features of the region of interest are stored in a deep-learning network. Similarly, after obtaining the image features, machine learning is used to train and validate the data. Figure 1 depicts the flow of the prediction model that we designed.
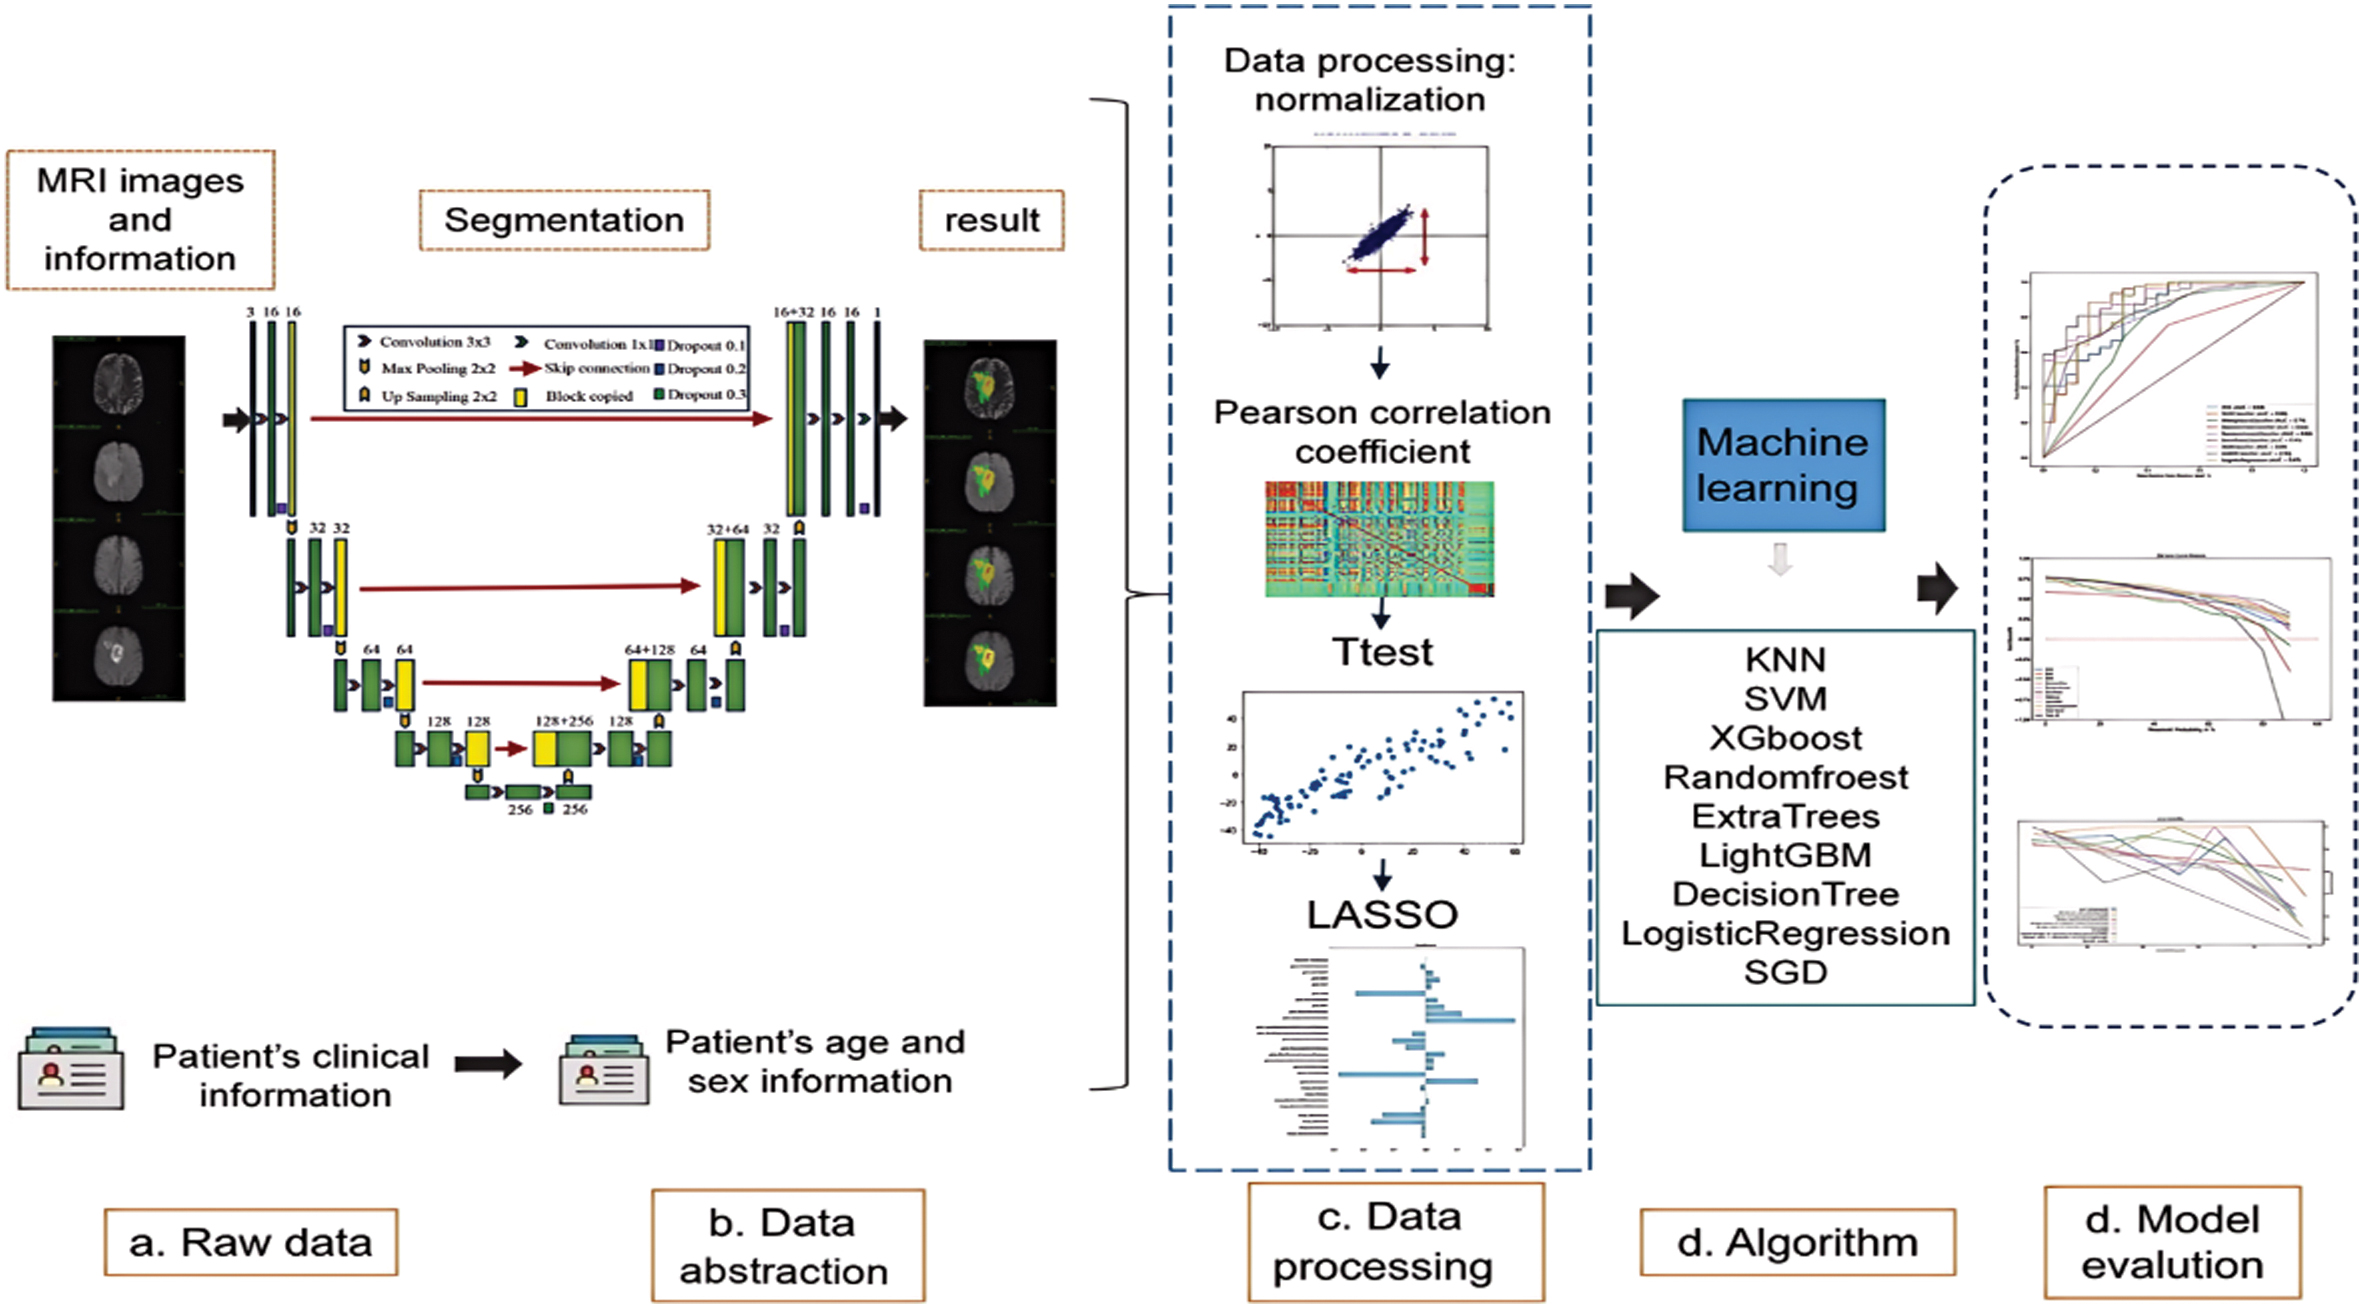 Fig. 1. Brain tumor classification and prediction flowchart.
A.DATA SET AND MRI IMAGE PREPROCESSING PROCESS
Precisely delineating brain tumors from multimodal MRI image data is a highly difficult undertaking in the field of medical image analysis. The International MICCAI Association has been organizing an annual Multimodal Brain Tumor Segmentation Challenge since 2012. As part of this challenge, they have released the MRI brain tumor segmentation dataset called BraTS2012–2018. This dataset has become the standard for evaluating MRI brain tumor segmentation methods.
The BraTS dataset comprises three components: a training set, a validation set, and a test set. Out of all the sets, the training set is made available to the general public. The validation set and test set are not released to the public, and they are mainly used for online evaluation of the methods. The initial BraTS2012 training set contained only 20 high-grade glioma (HGG) cases and 10 low-grade glioma (LGG) cases. All brain images were manually segmented with truth labels by experts. The work continued after 2013. In 2014, the organizing committee then significantly expanded the number of datasets, with the BraTS2014 training set containing 252 HGG cases and 57 LGG cases. BraTS2015 dataset was released in 2015 and screened and filtered based on the BraTS2014 dataset. It resulted in a training set containing 220 HGG cases and 54 LGG cases, which was also followed in 2016 and became a more widely used dataset. In the BraTS2012–2016 series dataset, each case included 4 different imaging modalities, FLAIR, T1, T2. and T1c, and the dimension of each MRI image was 155 × 240 × 240. There were 5 categories of labels in the imaging data in the dataset, which were normal tissue (label 0), necrosis (label 1), oedema (label 2), nonenhanced (label 3), and enhanced tumor (label 4). According to the actual clinical application, for the multi-category brain tumor segmentation task, the labeled complete tumor (complete tumor), core tumor (core tumor), and enhancing tumor (enhancing tumor) are used for automatic image segmentation. Where complete tumor includes all 4 internal structural categories of tumor, i.e., labeled as parts 1, 2, 3, and 4; core tumor includes all 3 internal structural categories of tumor except edema, i.e., labeled as regions 1, 3, and 4; and enhancing tumor is the region that includes only the enhancing tumor, i.e., labeled as region 4 only.
The BraTS2019 dataset contains 285 brain tumor cases, including four types of tumors (glioblastoma, astrocytoma, meningioma, and teratoma). A number of other metrics were utilized for evaluation, such as the Hausdorff distance and the dice coefficient.
Figure 2 displays a representative brain tumor image from the BraTS training set. The image showcases, from left to right, the FLAIR, T1, T2, and T1c different modality imaging results for the same patient.
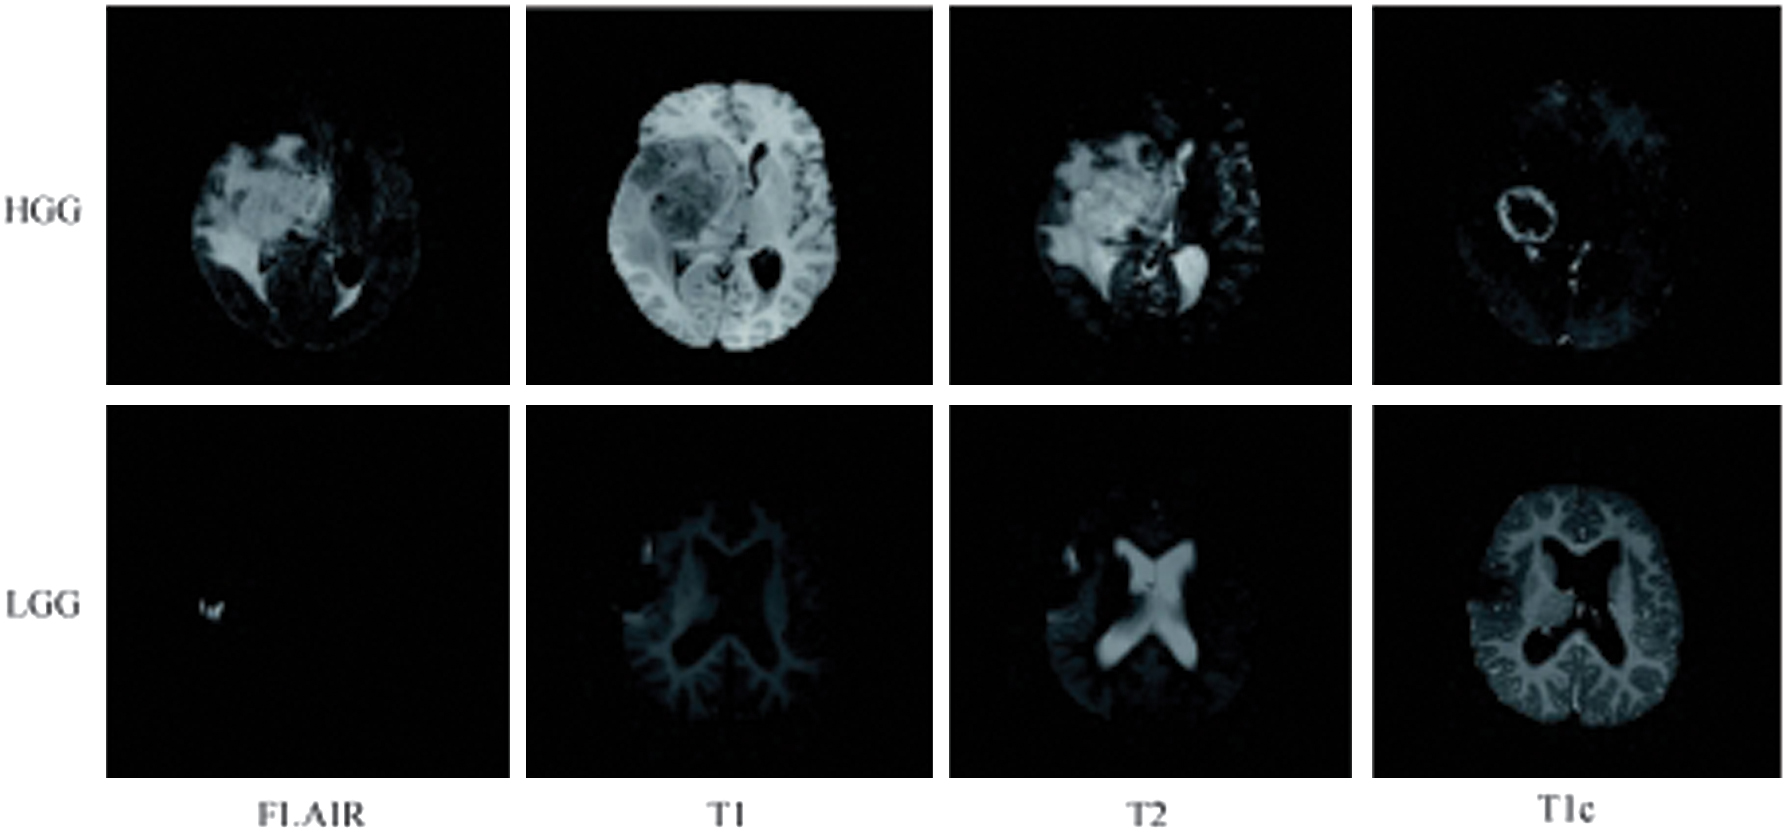 Fig. 2. Typical MRI brain images in training dataset of BraTS.
In this study, we acquire T1-Gado MRI sequences of 111 patients from BraTS2019 to use as our database source. MRI scans may be collected from multiple institutions, and their intensity may vary. Furthermore, noise present during MRI can reduce image accuracy, affecting the extraction of image features and making subsequent analysis more difficult [26]. We use data preprocessing techniques based on intensity normalization and adaptive contrast enhancement to reduce data heterogeneity and improve data quality.
B.TUMOR SEGMENTATION
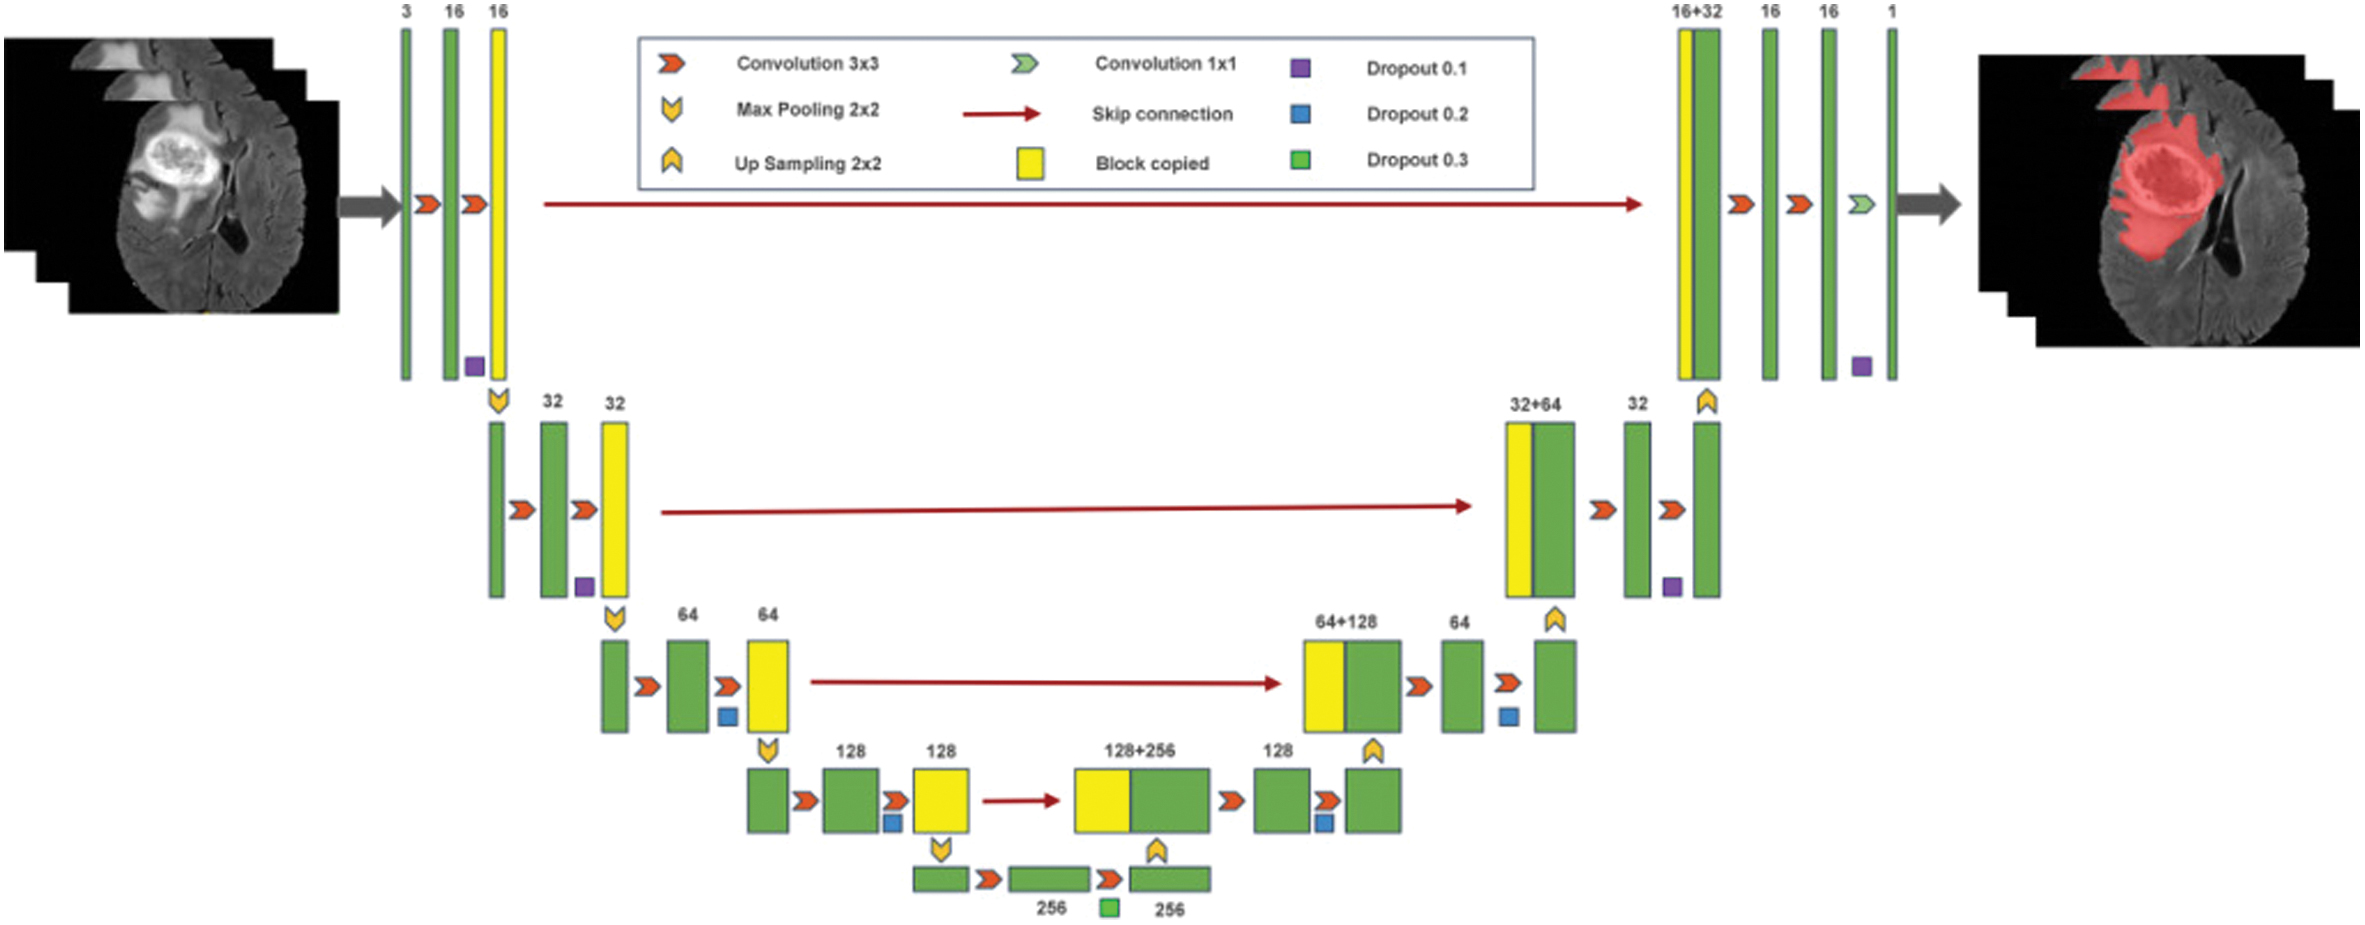
Figure 3 illustrates the process of automatic tumor segmentation. We train a deep-learning network (3D U-NET) to automatically segment the entire tumor region created by the preprocessed MRI sequence using a 3D neural network with a small convolutional kernel. To improve the application of migration learning, we randomly divide the data from the BraTS2019 dataset into a training and validation set in a 7:3 ratio for training and validation.
C.CLINICAL FEATURE SELECTION AND MODEL CONSTRUCTION
The study includes 104 patients from BraTS2019 with available clinical characteristics, and cases are randomized 7:3 into training and validation sets (73 cases in the training set and 31 cases in the test set). Table I shows the clinical characteristics we collect that are relevant for prediction, including the extent of tumor resection, age, and survival time.
Table I. Radscores and clinical features (n = 104)
| Surviving(N = 102) | Dead(N = 2) | P-value | Overall(N = 104) | |
|---|---|---|---|---|
| Resection status | ||||
| GTR | 100 (98.0%) | 1 (50.0%) | 0.059 | 101 (97.1%) |
| STR | 2 (2.0%) | 1 (50.0%) | 3 (2.9%) | |
| Age | ||||
| Mean ( | 62.4 (12.6) | 66.1 (6.39) | 0.559 | 62.5 (12.5) |
| Median (Range) | 64.0 (27.8, 86.7) | 66.1 (61.6, 70.7) | 64.0 (27.8, 86.7) | |
| Survival | ||||
| Mean ( | 450 (345) | 685 (472) | 0.597 | 455 (346) |
| Median (Range) | 381 (12.0, 1770) | 695 (361, 1030) | 381 (12.0, 1770) | |
| Radscore | ||||
| Mean ( | 0.922 (0.132) | 0.987 (0.107) | 0.547 | 0.923 (0.132) |
| Median (Range) | 0.940 (0.588, 1.23) | 0.987 (0.91, 1.06) | 0.940 (0.56, 1.2) |
Different degrees of tumor resection may be closely related to the prognosis of glioma [27,30]. In this study, we assess the significance of two resection degrees, gross-total resection and subtotal resection, which refers to a tumor resection degree of 90%, in predicting glioma prognosis. In Fig. 4, the K-M survival analysis of the two groups of patients based on tumor resection degree scores shows statistically significant discrimination (p = 0.03). It indicates that the degree of tumor resection can be used as an independent predictor of prognosis in glioma.
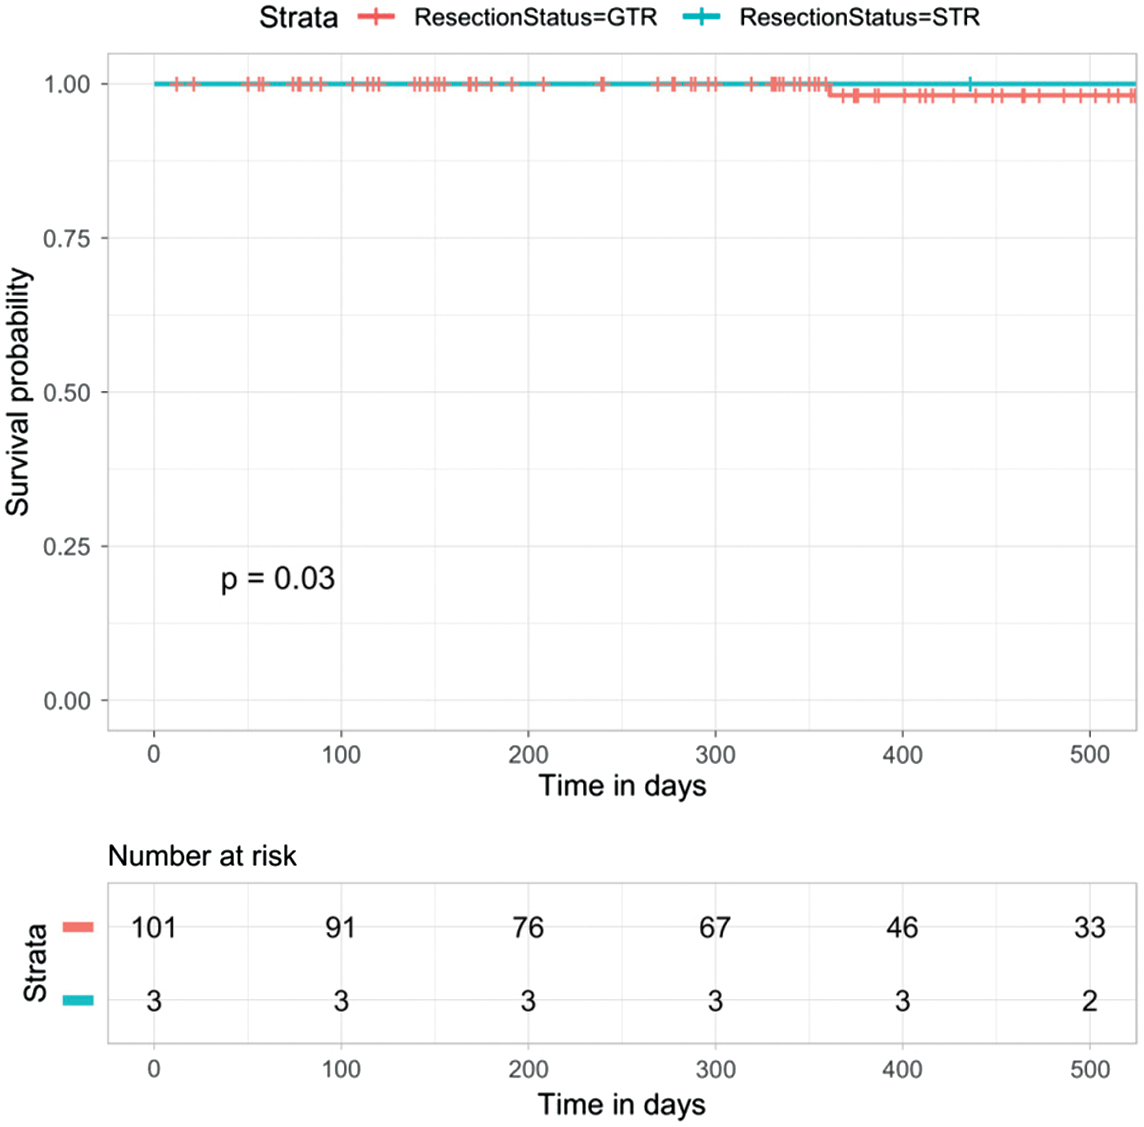 Fig. 4. Analysis of the degree of tumor resection in the prognosis prediction of glioma (p = 0.03).
A predictive nomogram of clinical characteristics is constructed to aid clinical judgment, and a specific nomogram is shown in Fig. 5a.
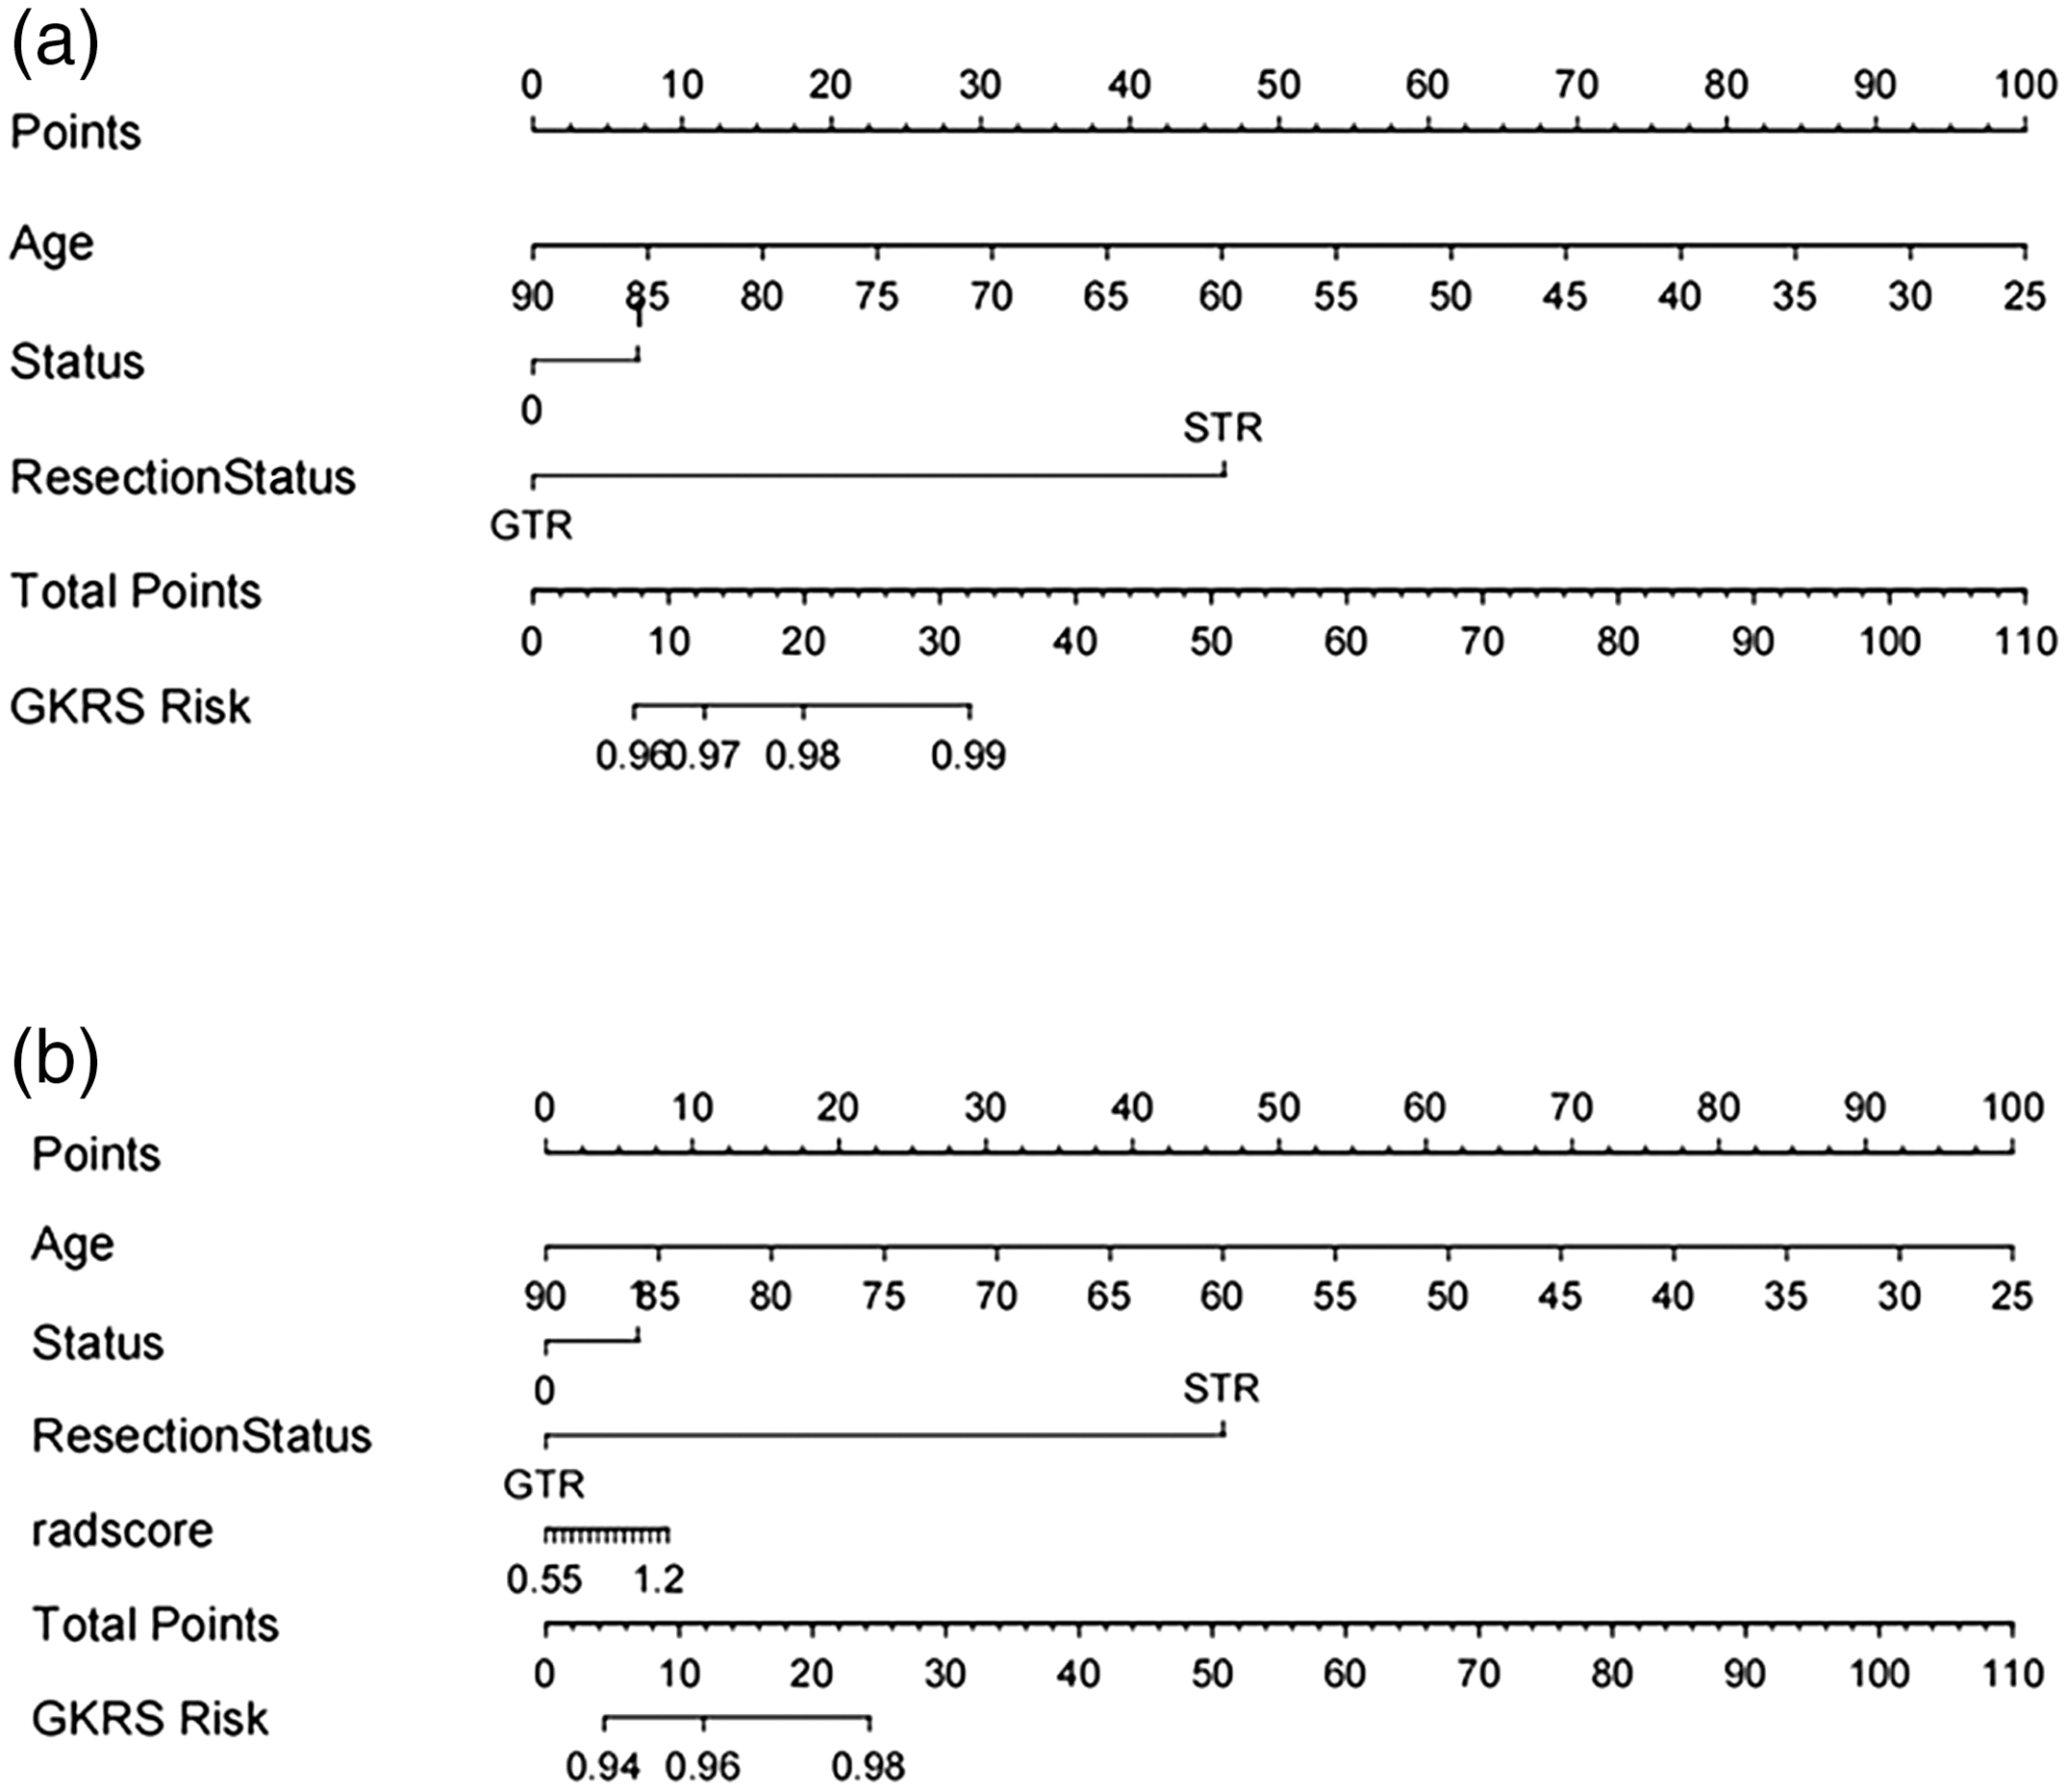 Fig. 5. The nomogram of predicting prognosis models. (a) The model of clinical features. (b) The hybrid model of radiomic features.
D.SELECTION OF RADIOMIC FEATURES
After screening the extracted 1050 radiomic features, 27 radiomic features with nonzero coefficients to predict the prognosis of glioma are retained. Figure 6 shows the feature clustering diagram representing the correlation between features.
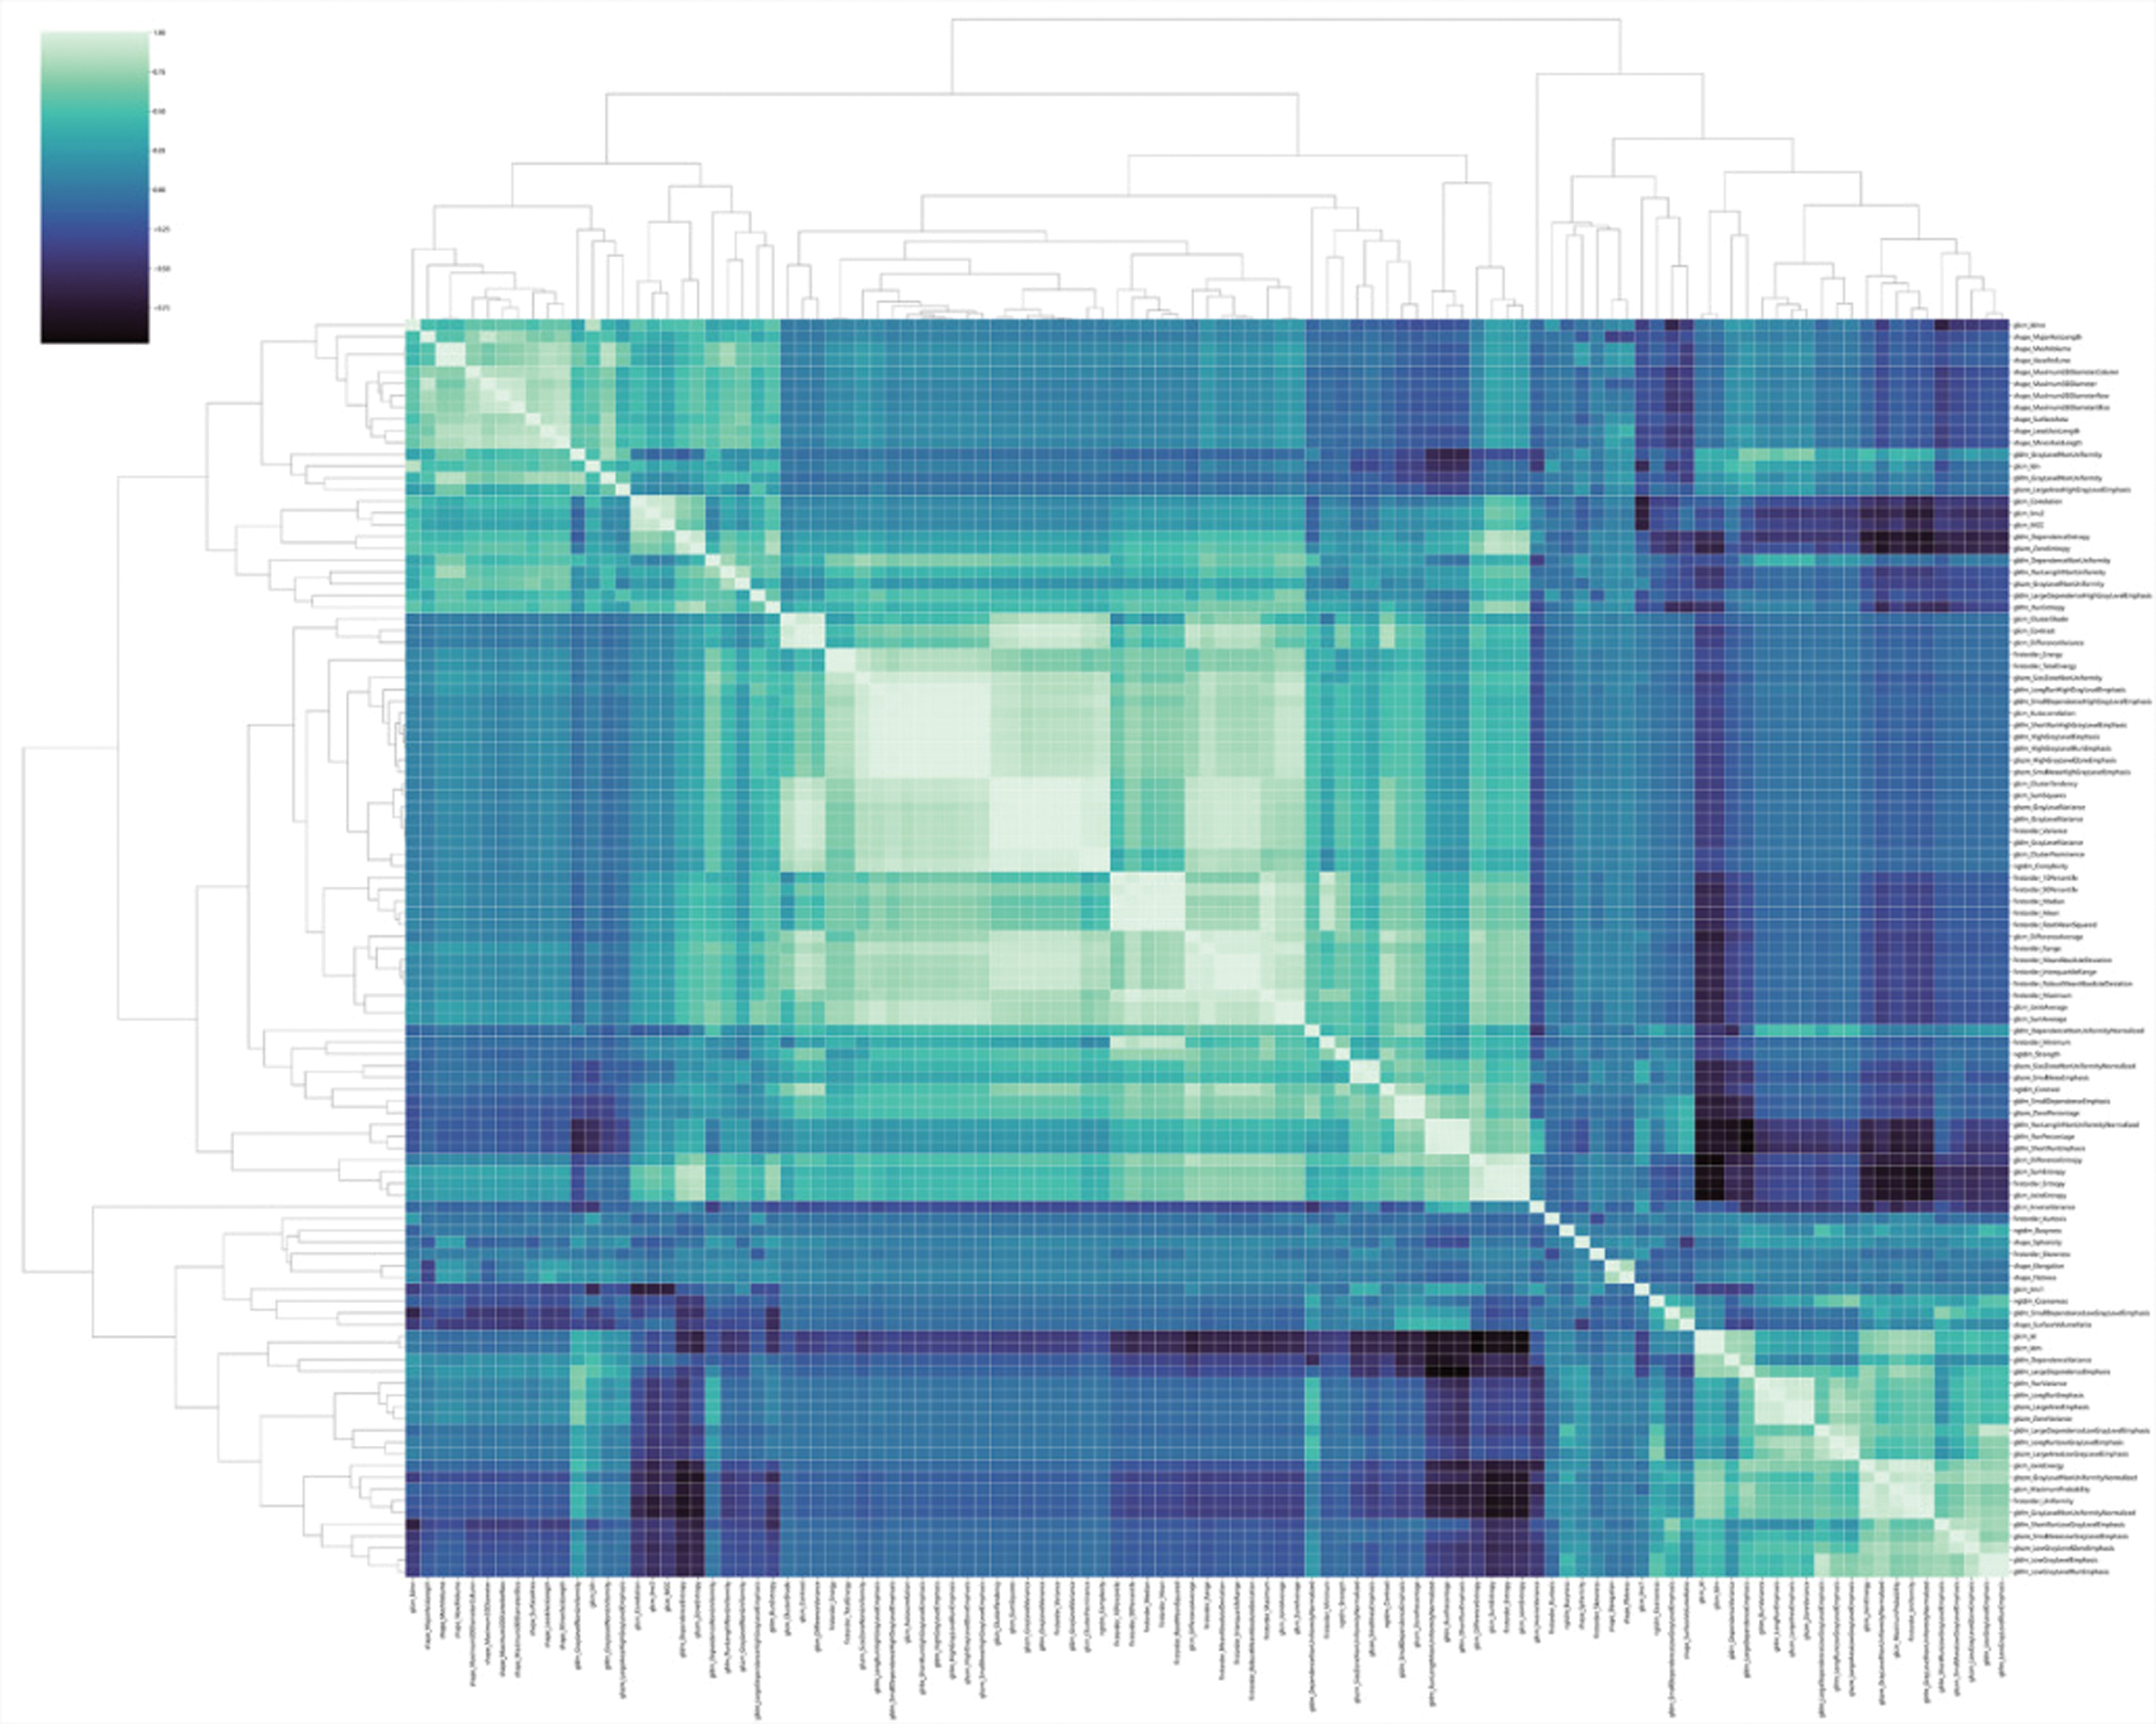 Fig. 6. Feature clustering diagram.
Figure 7 shows the Pearson correlation coefficients for radiomic features. We design to remove hotspots with Pearson correlation coefficients less than 0.7 to facilitate identifying important features.
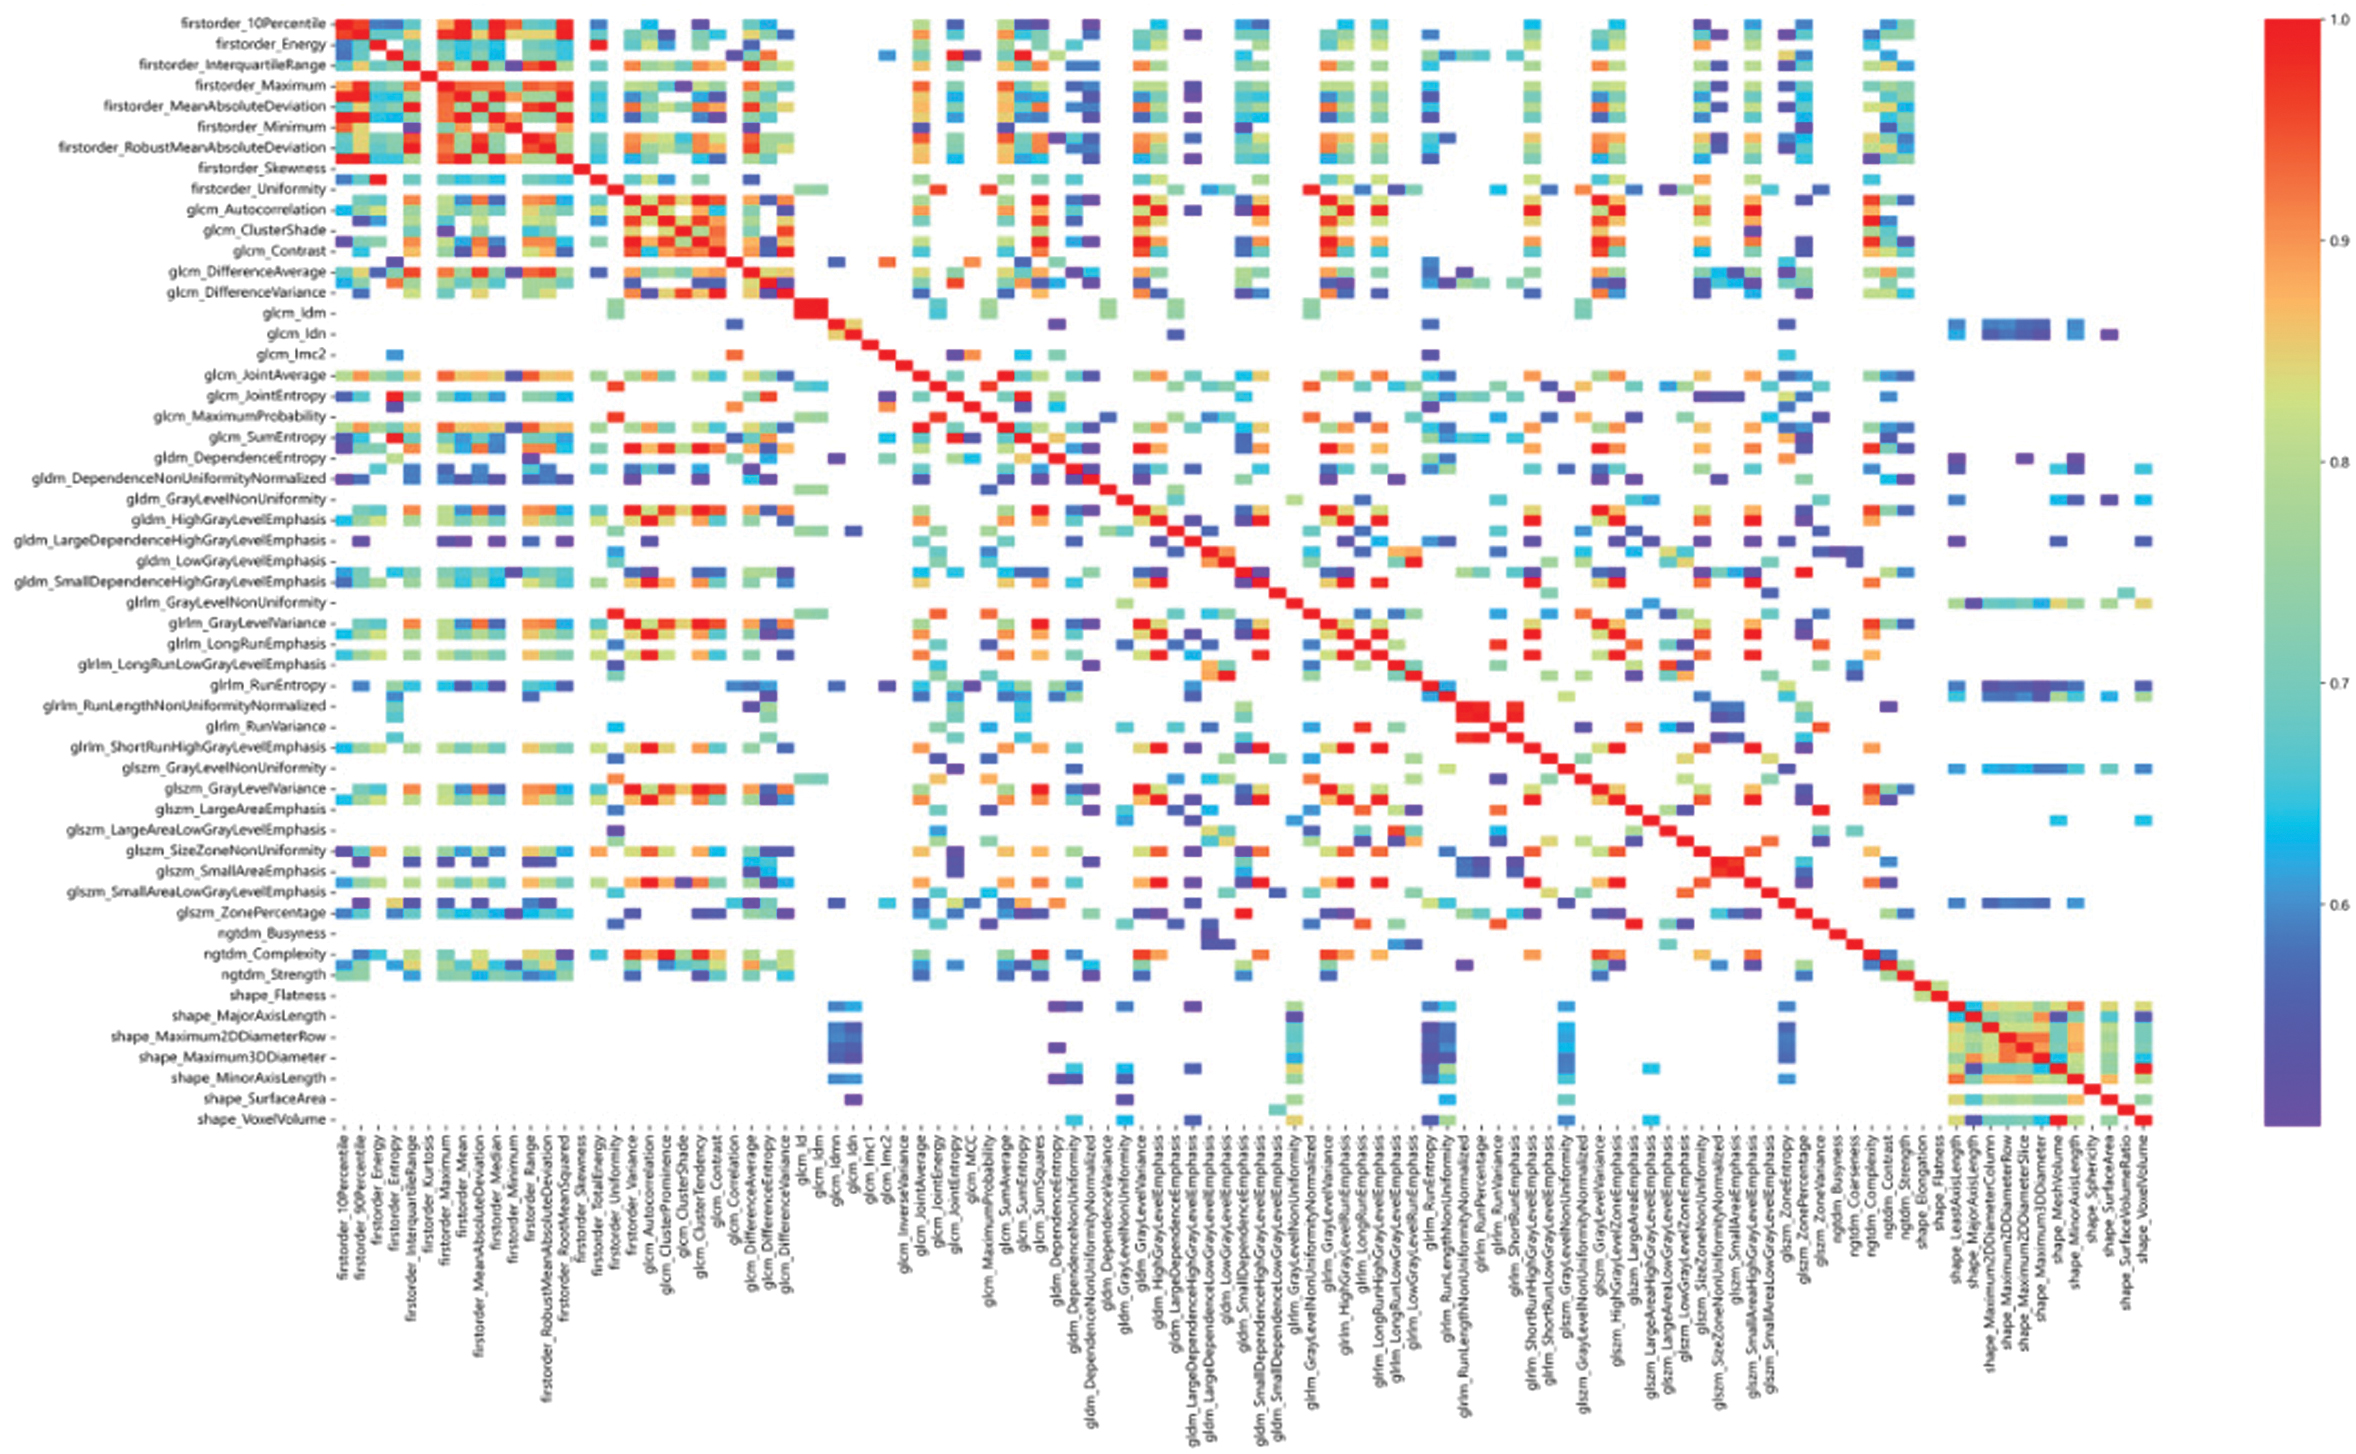 Fig. 7. Heat map of Pearson correlation coefficients between radiomic features (features with Pearson correlation coefficients greater than 0.7).
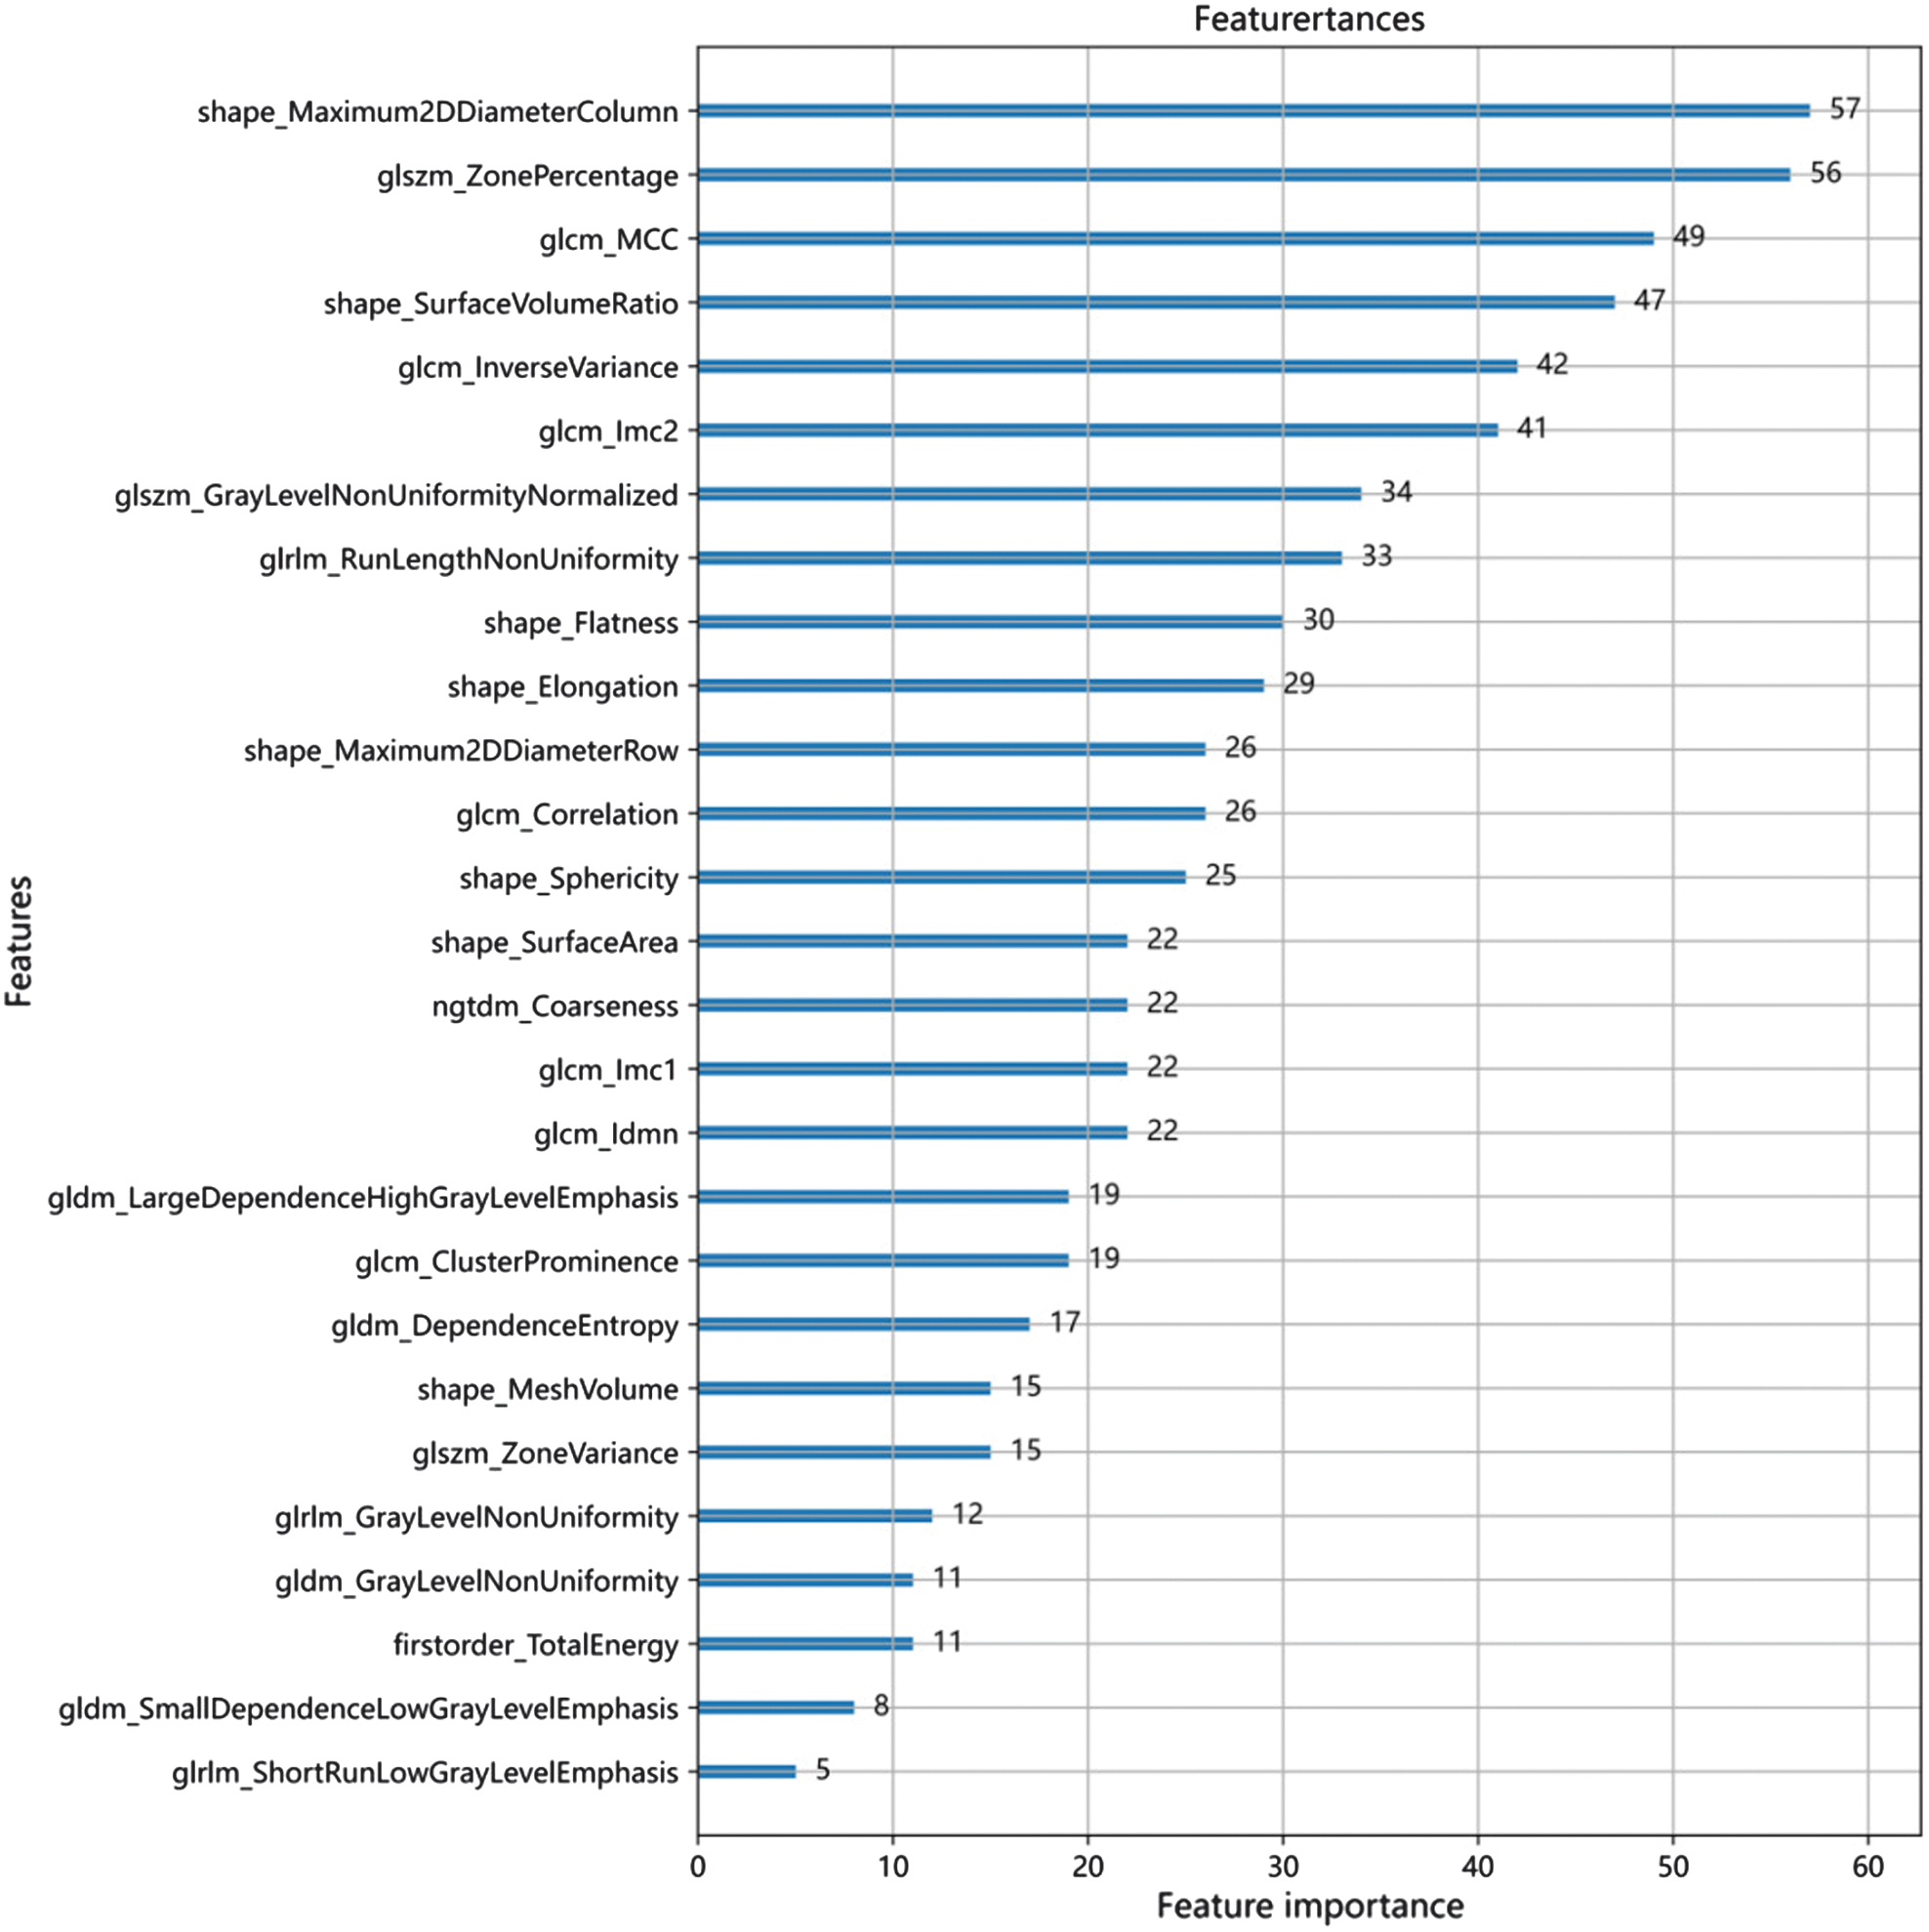
Figure 8 shows the optimal number of radiomic features to predict the prognosis of glioma, which is 27. Figure 9 shows the subset of radiomic features and their corresponding coefficients after LASSO screening. Figure 10 depicts the feature importance analysis, which shows that shap_Maximum2DDiameterColimn has the highest importance, followed by glszm_ZonePercentage.
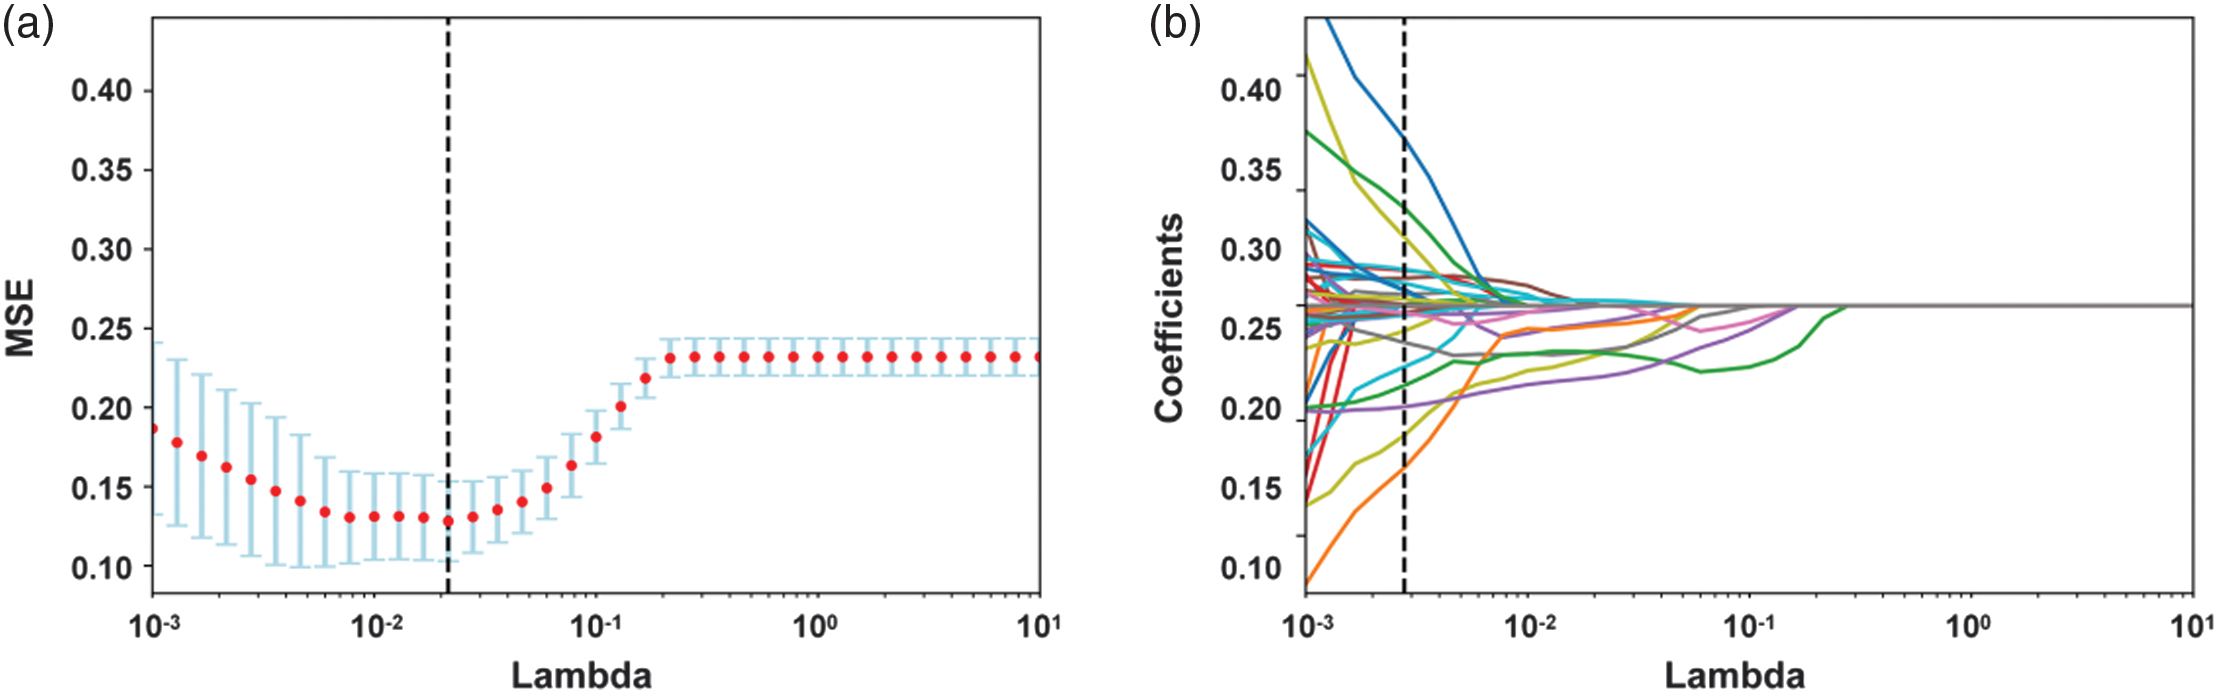 Fig. 8. Optimal number of imaging histological features for predicting prognostic preservation in glioma.
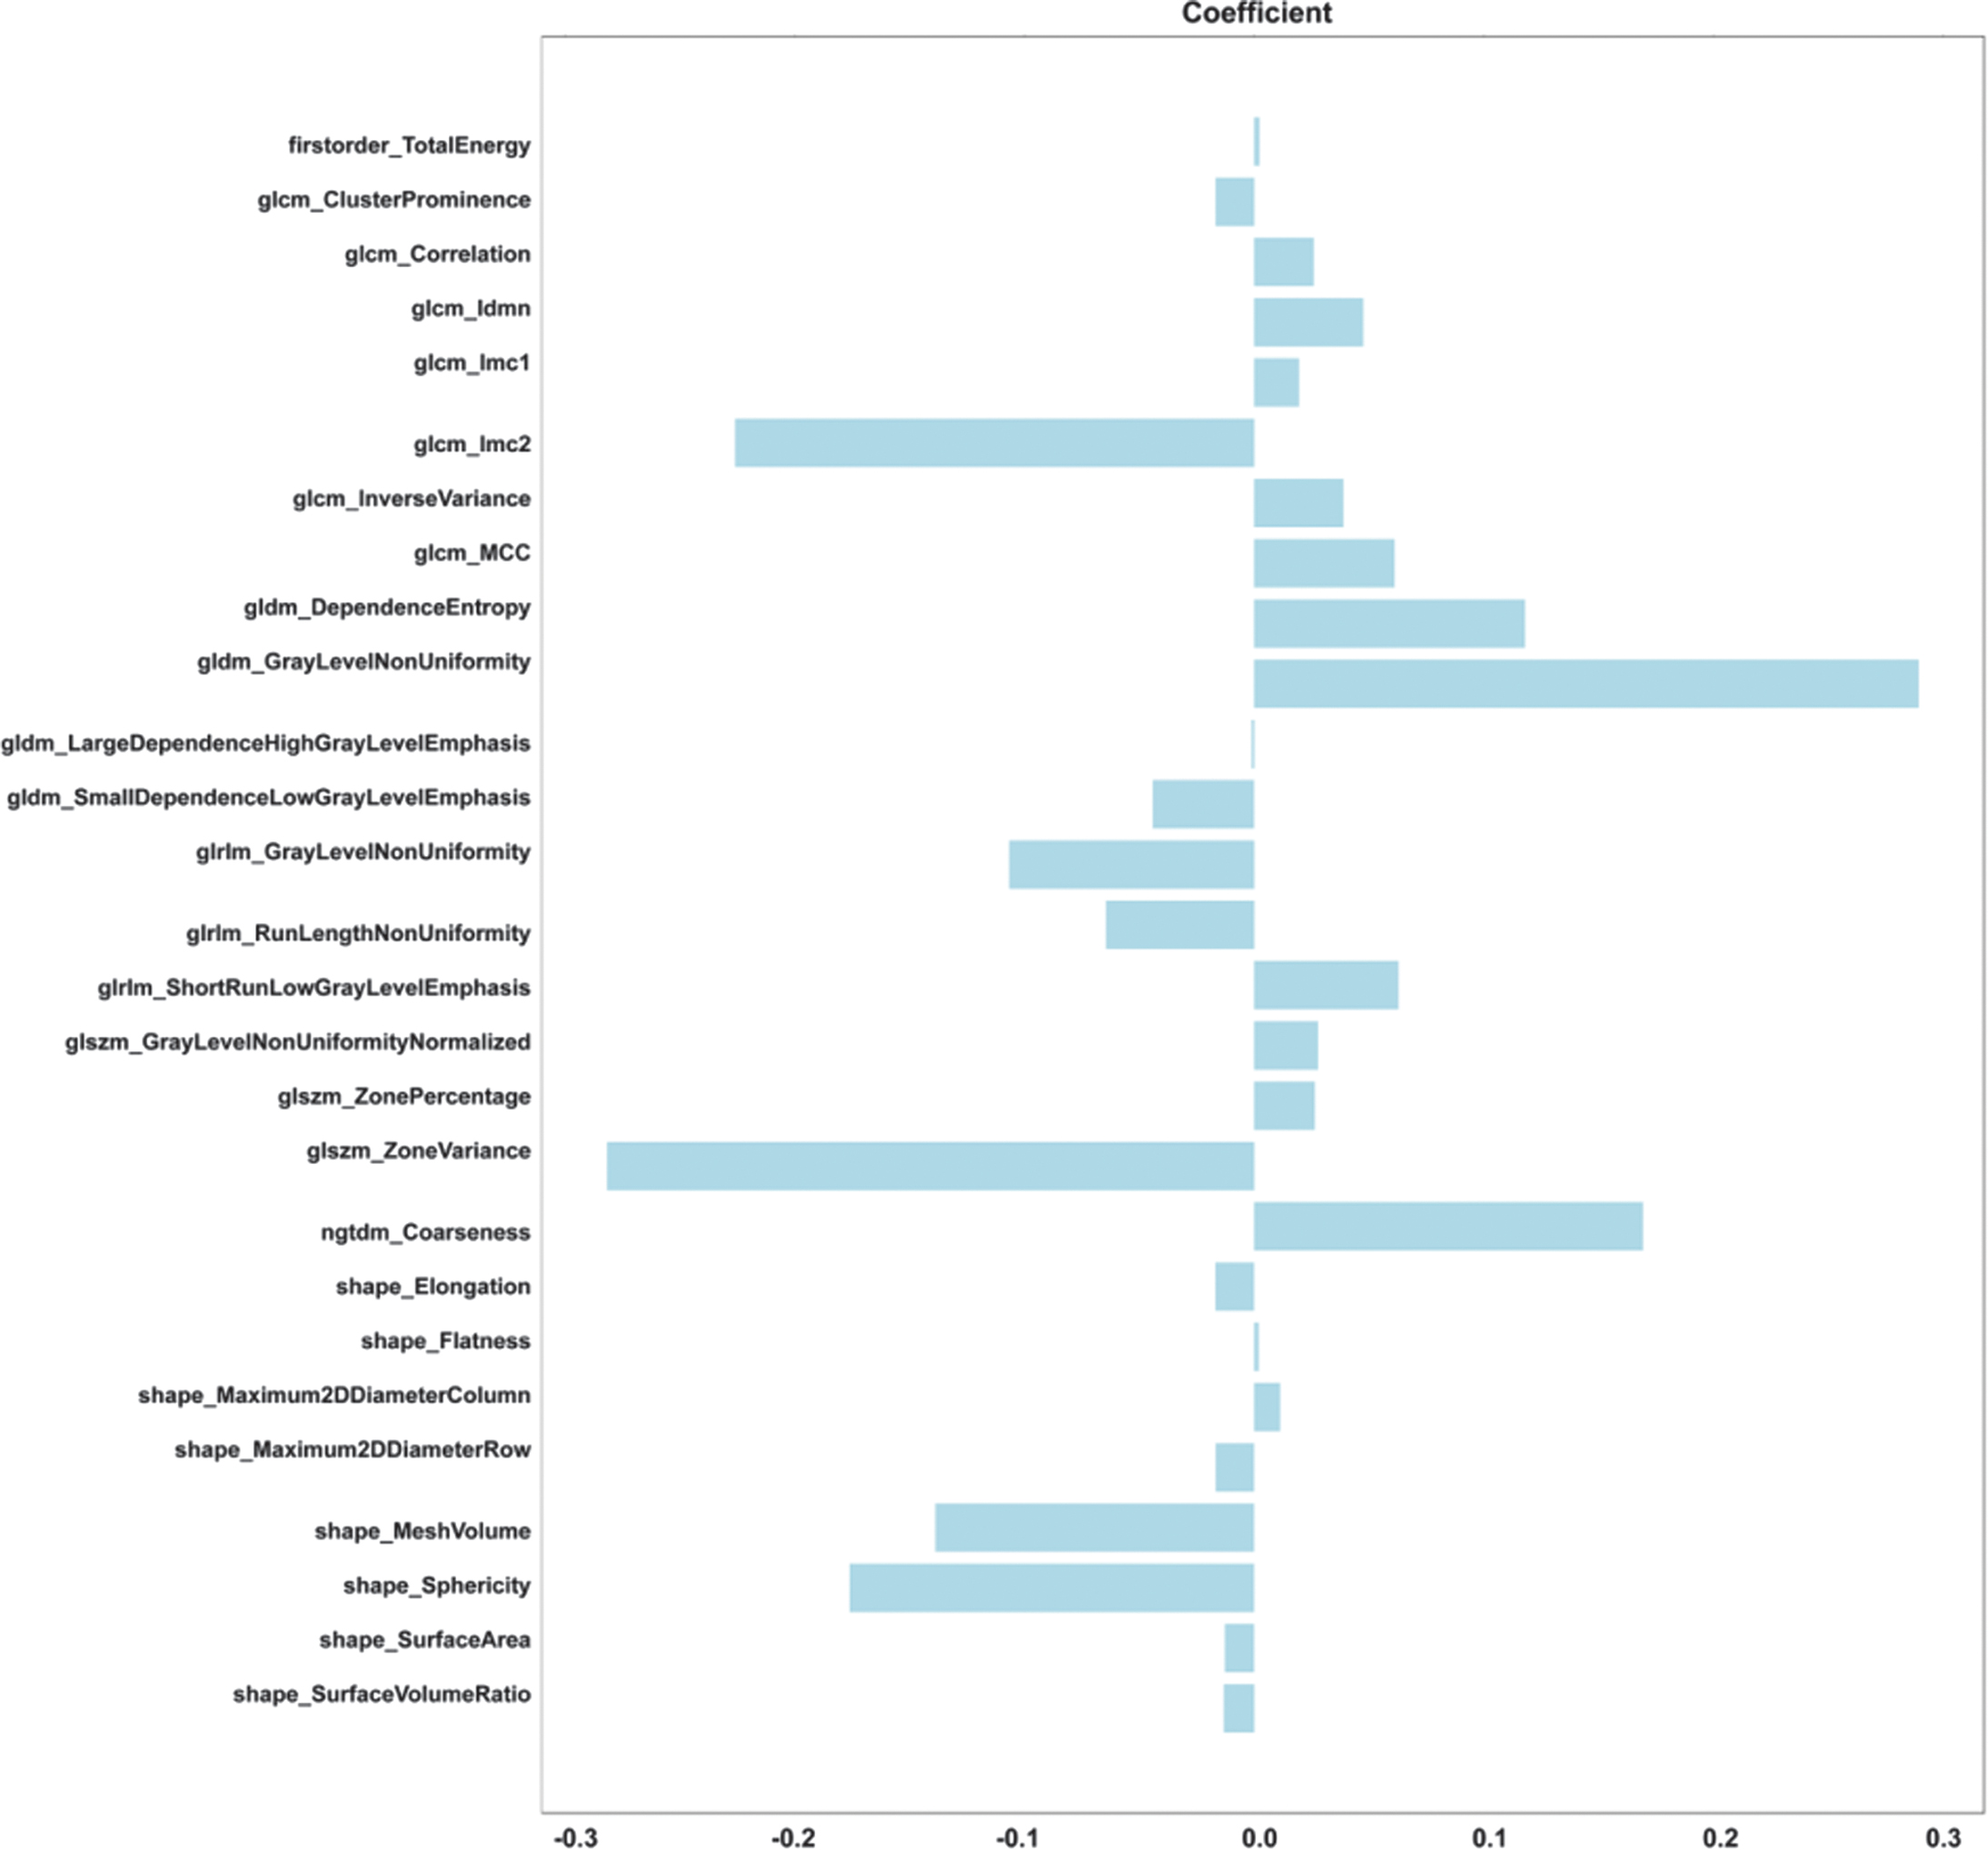 Fig. 9. Subset of LASSO-screened radiomic features and corresponding coefficients.
E.RADSCORE SCORE CALCULATION
The radiomic score (radscore) is calculated by weighting the coefficients of the radiomic features to produce three sets of radscore. The radiomic features are entered into the formula radscore to obtain the radiomic score. Figure 11 shows the respective radscore for the training and validation groups.
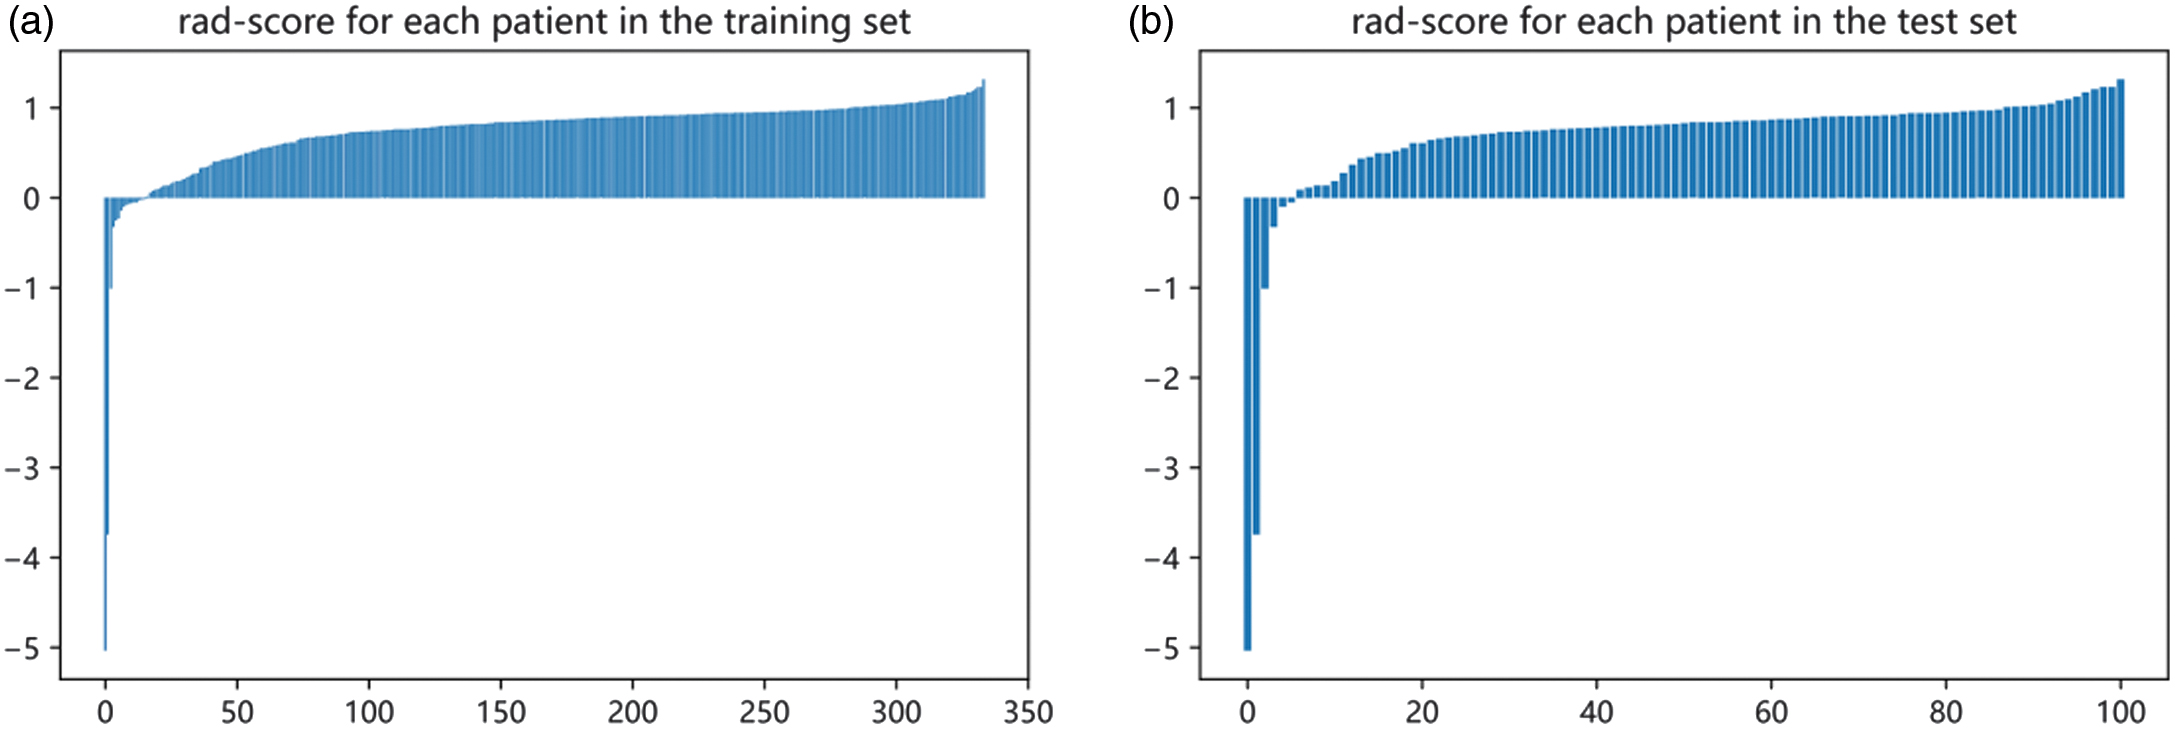 Fig. 11. Radscore for the training and validation groups. (a) Training group. (b) Validation group.
F.CONSTRUCTION OF A HYBRID MODEL OF RADIOMIC-CLINICAL FEATURES
We use logistic regression analysis to better predict the prognosis of glioma by averaging the weights of three clinical and radiomic features and then constructing a mixed model of radiomic-clinical features. Table I shows the predictive features included in the hybrid model. To further aid in clinical judgment, we construct a predictive nomogram for the hybrid model, presented in Fig. 5b. Figure 12 refers to the calibration curve of the validation set for the hybrid model of radiomic features (p = 0.03). The Hosmer–Lemeshow validation determines the degree of agreement between the radiomics and the observations. The specific curves with a p-value of 0.001, no significant difference, and a good model fit are shown in Fig. 12.
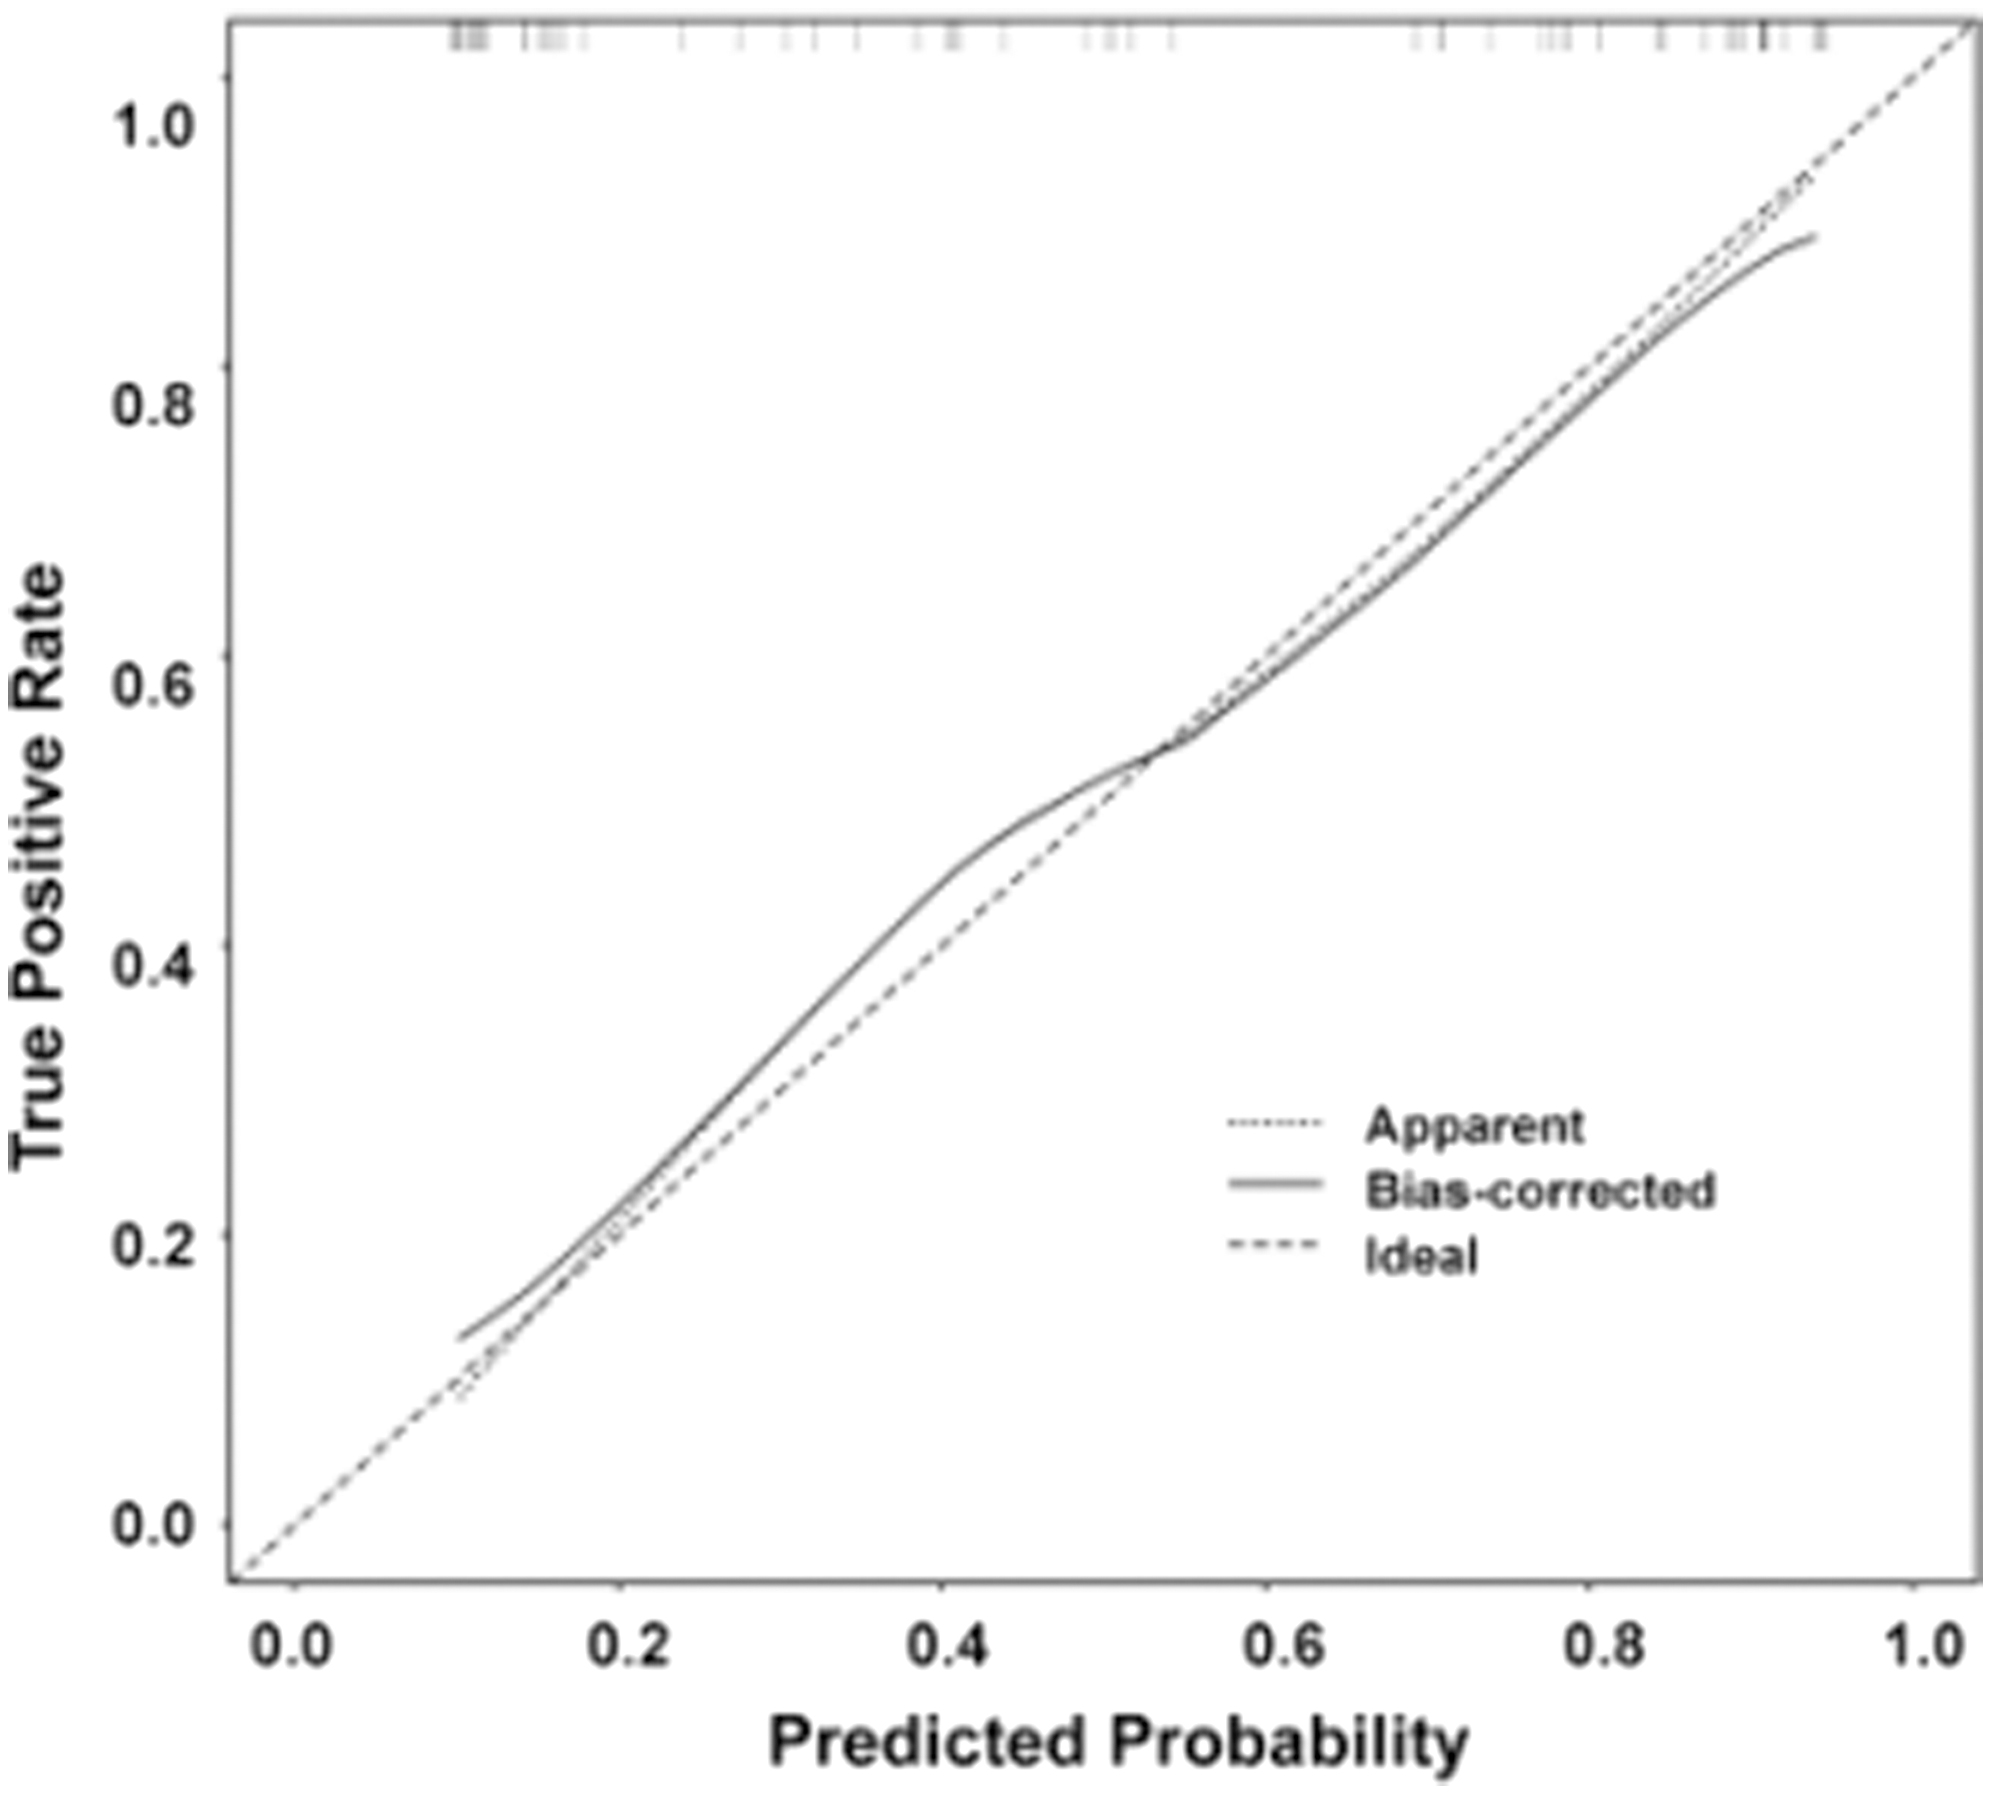 Fig. 12. Hosmer–Lemeshow validation calibration curves for the hybrid model of radiomic features (p = 0.03).
IV.EXPERIMENTS AND RESULTS
A.SCREENING FOR RADIOMIC FEATURES AND CLINICAL FEATURES
We extract 1050 features, remove outliers, and keep features with Pearson correlation coefficients greater than 0.7, then use independent samples t-tests to filter out features with statistically significant differences (p < 0.05). The standardization method is used to standardize the above characteristics data by independent sample t-test in a dimensionless way to ensure the reliability of the results. To avoid feature overfitting, the least absolute shrinkage and selection operator (LASSO) is used to construct a regression model that filters out radiomic features. Clinical indicators are also obtained by calculating features with Pearson correlation coefficients greater than 0.7 between features. Then, a t-test was used to remove redundant features, and finally, a LASSO was applied to reduce dimensionality to obtain the final clinical features. Moreover, clinical and radiomic features are combined by averaging the weights and applying logistic regression analysis.
B.MODELING
We use machine learning techniques that include support vector machine, stochastic gradient descent, k-nearest neighbor (KNN), decision tree (DT), random forest (RF), extremely random trees (ET), extreme gradient boosting (eXtreme gradient boosting, LightGBM, logistic regression, and extreme gradient boosting. Then, we classify gliomas and predict patient survival and prognosis based on the obtained radiomic and clinical features.
C.PERFORMANCE EVALUATION
We plot calibration curves and calibrate the nine models to assess the agreement between the predicted and actual probabilities. Figure 13 shows the calibration curves for the nine models, and it can be seen that the models all tend to overestimate risk.
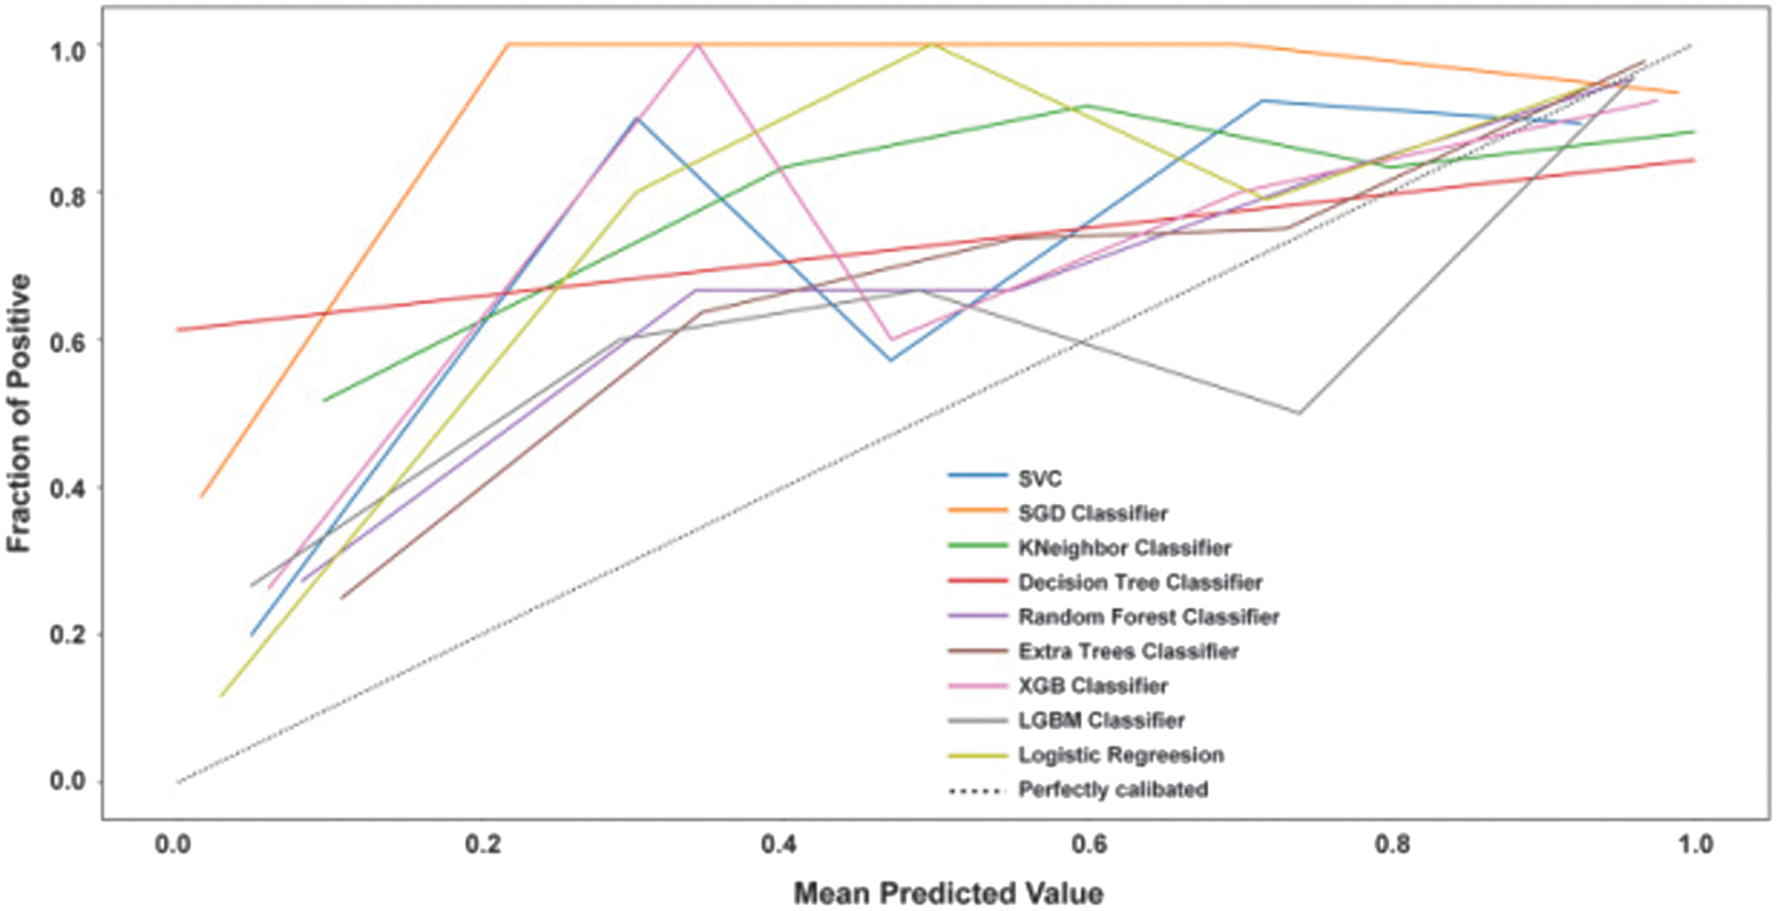 Fig. 13. Calibration curves for nine models.
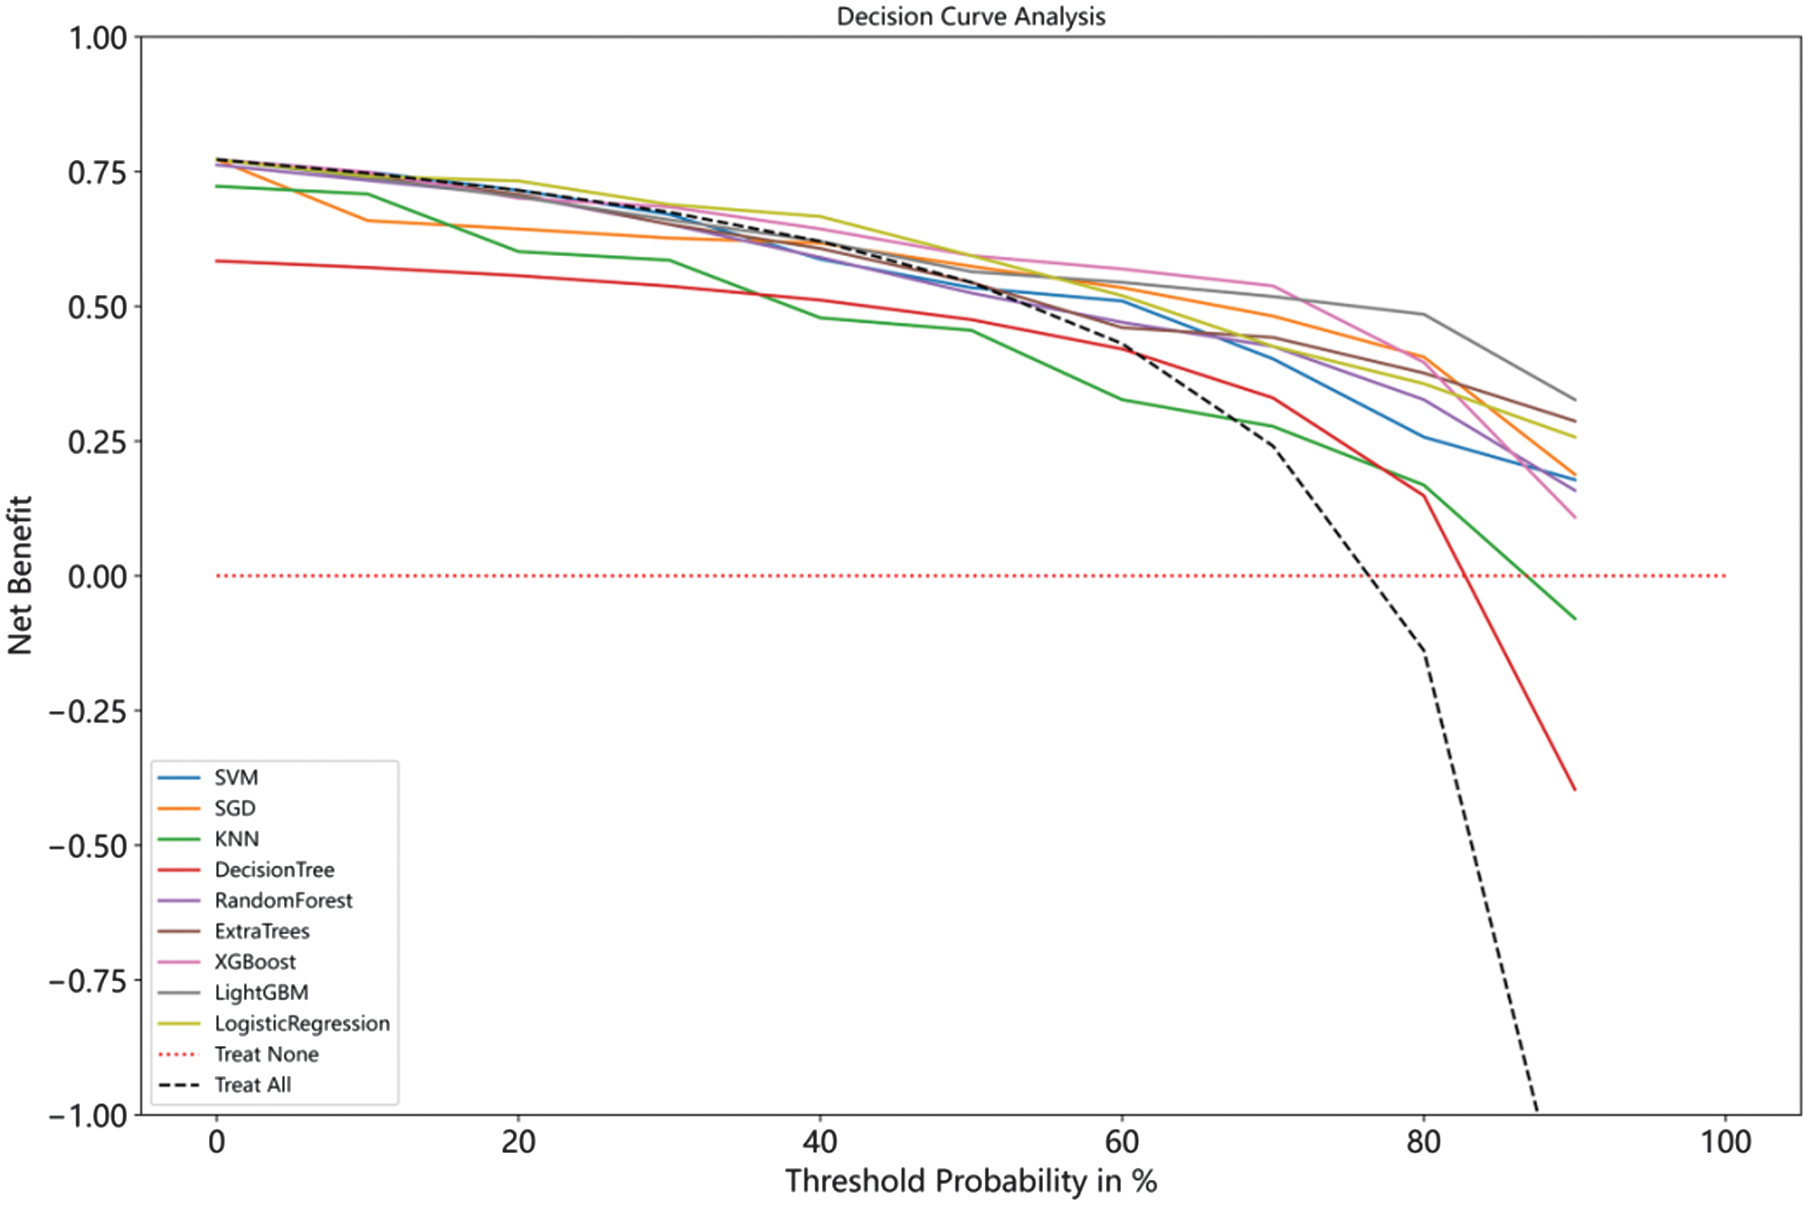
To assess the clinical utility of the model predictions, we plot decision curves for the nine models, and Fig. 14 shows the specifics of the decision curves. The horizontal red dashed line shows that all samples do not intervene and that the net benefit is zero. The black dashed diagonal line indicates that all samples receive an intervention. They are the two extreme cases. It can be seen that, except for the two models, DT and KNN, the rest of the models have a higher net benefit and clinical value for the majority of the risk probabilities.
V.DISCUSSION AND CONCLUSION
In this study, we proposed a fast and automated 3D U-NET framework to segment gliomas, using pyradiomics to extract and filter out important radiomic features. In addition, nine machine learning models were used in conjunction with other clinical features to predict the survival prognosis of glioma patients based on pretreatment MRI. The results of the experiments showed that all nine well-known learning model classification architectures could achieve accurate classification and reliable prediction results. Among them, XGBoost had the best overall performance. In addition, this study architecture is based on 3D neural networks with the potential to merge local and global contextual information through small convolutional kernels. We also used data preprocessing techniques such as intensity normalization and adaptive contrast enhancement, which significantly reduced data heterogeneity and positively affected tumor prediction.
The BraTS challenge has been running since 2012, and there are numerous publications based on participation in this challenge. We compared our segmentation results (e.g., Dice coefficient, Hausdorff distance) with those reported in recent BraTS challenge publications. For example, our 3D U-Net-based segmentation model achieved a Dice coefficient of 0.91 for the enhancing tumor region, which is comparable to the top-performing methods in BraTS2019 (e.g., Isensee et al., 2021, with a Dice score of 0.90). We also highlighted that our method performs particularly well in segmenting necrotic and edema regions, which are often challenging due to their heterogeneous appearance in MRI scans. We also compared our survival prediction results with those from previous studies. For instance, our hybrid model combining radiomic and clinical features achieved a C-index of 0.75, which is competitive with the results reported by Feng et al. (2020) and Lao et al. (2017), who achieved C-indices of 0.71 and 0.73, respectively. We also noted that our model outperforms traditional radiomics-based approaches by incorporating deep learning features, which capture more nuanced patterns in the imaging data.
In addition, there is still room for improvement in our research. There is a lack of opportunity for validation on different external datasets due to the dataset’s small sample content. Moreover, it may not be possible to fully validate all the problems that would occur, resulting in some errors. For example, although all nine models are calibrated in both the training and validation sets, the insufficient amount of data may result in over-fitting. In future research, we will continue to extend the data and test the performance of the learning model. The learning model’s predictions tend to overestimate the risk, so we must find additional ways to optimize the model.
Moreover, while we have identified some predictive radiomic and clinical features, it is unknown whether other features are closely related. Further radiomic and clinical screening is required in future studies. Given that different features may affect overall survival, we used a Pearson correlation coefficient heat map to analyze feature interrelationships and a hybrid model for prediction. However, unaccounted-for associations between radiomic and clinical features may still exist, resulting in biased prediction results. In subsequent studies, we will further explore the relationship between features.