I.INTRODUCTION
In the digital age, the utilization of social media has experienced exponential growth with the emergence of various platforms for community engagement and interaction. As of 2024, Indonesia has recorded approximately 139 million social media users, which the number reflects its significant penetration in the region [1]. Prominent social media platforms widely used in Indonesia include Facebook, Instagram, X, YouTube, and TikTok. A survey conducted by We Are Social and Meltwater highlights the primary motivations behind social media usage, which encompass occupying leisure time, maintaining connections with friends and family, staying informed about trending topics, seeking inspiration for activities or purchases, and accessing diverse content such as articles and videos [1].
Due to the vast volume of user-generated content on social media platforms, market participants increasingly rely on these channels to gain deeper insights into industry trends, enhance brand reputation, elevate brand awareness, conduct competitive benchmarking, and analyze customer behavior. Social media data, which predominantly comprise text, video, and image-based content—whether from posts or user comments—serve as a critical resource for these activities. However, these data are extensive in number; it is not uncommon for platforms to generate hundreds of thousands of comments or interactions daily. Manual analysis of such extensive datasets is not only time-intensive but also prone to inefficiency and human error, which highlights the need for more advanced analytical approaches to process and interpret this information effectively. Text mining, specifically sentiment mining [2–5] and emotion mining [6–8], offers a viable solution to this problem. By leveraging sentiment and emotion mining techniques, companies and organizations can efficiently analyze and interpret vast quantities of user-generated comment data in a relatively short time frame.
However, a new problem arises when people use sarcastic statements to comment on something. Sarcasm represents a distinctive form of communication characterized by the use of words or phrases that convey harsh criticism, ridicule, or insinuation, often with the potential to offend or hurt the feelings of the recipient [9]. While its tone may vary depending on the context, sarcasm is generally perceived as negative and unwelcome [10]. It, furthermore, is not only used to tease people but can also refer to a situation or idea. It generally expresses negative sentiments using positive words; hence, it often confuses the sentiment analysis model [11]. The presence of sarcasm in user-generated comments has been shown to reduce the predictive accuracy of these models since they often fail to correctly identify the true sentiment underlying sarcastic remarks [4,11]. Consequently, the development of effective sarcasm detection mechanisms is crucial for extracting accurate and meaningful insights from public comments, particularly in contexts such as evaluating consumer perceptions of products or brands [12].
In everyday communication, sarcasm can be identified from intonation, facial expressions, and body gestures. On the contrary, identifying sarcasm in textual data, such as online comments, presents a significant challenge due to the absence of these non-verbal indicators. Moreover, contemporary digital communication frequently incorporates multimodal elements such as emoticons, emojis, memes [10,13], and animations. These elements can serve to amplify the sarcastic intent of the message. Despite their potential utility in sarcasm detection, the majority of existing research has predominantly focused on textual analysis, often discarding emoticons, emojis, and memes during the preprocessing phase. Consequently, there remains a notable gap in the comprehensive analysis of multimodal data for the purpose of sarcasm identification [11,13,14].
Therefore, this study emphasizes the necessity of integrating multimodal information, including emojis, emoticons [5], and images [13], to improve the accuracy of sarcasm detection. Traditional methods of sarcasm detection, such as lexical and syntactic analysis, exhibit limitations in addressing the intricate interplay of linguistic complexity and social context prevalent in social media communication. This method or approach often fails to capture more nuanced forms of sarcasm, leading to suboptimal accuracy rates. Approaches that used machine learning methods have also yet to produce optimal accuracy [11,13]. In contrast, deep learning, with its capacity to model complex data patterns and representations, presents a more robust and promising solution for this task. Since deep learning has been demonstrated as the best device for identifying sarcasm [11,13,14], we will apply a deep learning-based model in this study to identify sarcasm.
Sarcasm, by its inherent nature, is a linguistic phenomenon that often expresses sentiments contrary to the literal meaning of a statement. For instance, a seemingly positive statement may carry a negative connotation. When both sentiment analysis and sarcasm detection require models capable of recognizing intricate, non-literal language patterns, deep learning techniques that have proven effective in sentiment classification, such as Long Short-Term Memory (LSTM)-based models, may also hold promise for sarcasm classification. Previous research has demonstrated that LSTM-based models excel at capturing contextual dependencies within text [15,16]. Consequently, it is anticipated that these models, along with their variants—such as Bidirectional LSTM (BiLSTM) and Gated Recurrent Units (GRU)—will be capable of identifying and distinguishing sarcastic patterns in the task of sarcasm detection. To determine the most effective model, this study will implement and evaluate multiple models based on LSTM, BiLSTM, and GRU architectures, comparing their respective performances in sarcasm classification tasks.
Further, the present study will elaborate the related works in Section II, methods used to detect sarcasm in Section III, findings and tests conducted to confirm the model’s validity in Section IV, and conclusion in Section V.
II.LITERATURE REVIEW
A.SARCASM DETECTION
Sarcasm detection is a challenging and dynamic area of research within the field of natural language processing (NLP). This task requires systems to understand both the literal meaning and the implied intent behind language, often riddled with irony, exaggeration, and humor. Over the years, researchers have developed a range of approaches, leveraging various datasets and advanced computational techniques. Numerous types of data were used in this field of study, from straightforward textual forms [17–26] to ones that involve audio data [27]. Textual datasets range from news headlines [17–19] to social media comments in English [19–21] and in Hindi [22].
Techniques for sarcasm detection span from machine learning-based methods [25,26] to deep learning-based approaches [23,24]. Each of these approaches brings unique benefits and drawbacks, with ensemble techniques often providing higher accuracy at the cost of increased complexity and computational demands.
1.DATASET SELECTION AND CHARACTERISTICS
Datasets form the cornerstone of sarcasm detection research, and their quality directly impacts the performance and generalizability of models. Most studies rely on textual data from social media platforms, particularly Twitter [28–30] and Reddit [11,31], due to their brevity and frequent use of humor and irony. The number of datasets used also varies from thousands [22,28] to millions of datasets [11]. Some notable datasets include SemEval-2015 Task 11 [30], SemEval-2018 Task 3 [31], Reddit SARC 2.0 [31], and domain-specific collections like Sarc-H [22].
- a.Social Media Datasets: Platforms like Twitter serve as primary sources for sarcasm detection datasets. Datasets often include tweets labeled as sarcastic or non-sarcastic, of which the labels are derived from hashtags like #sarcasm [28] or through manual annotation. For example, the SemEval datasets contain thousands of annotated tweets that focus on sarcasm and irony in short and informal texts. While hashtags simplify data collection, they are often removed during preprocessing to prevent models from overly relying on explicit indicators.
- b.Domain-Specific Datasets: Beyond general-purpose datasets, some studies focus on sarcasm detection in specific domains, such as political discussions (e.g., Reddit SARC 2.0 [31]) or news headlines [17–19]. These datasets highlight how sarcasm manifests differently across contexts, requiring tailored approaches for effective detection.
- c.English versus Non-English Languages: While datasets using the English language are used in most studies, some datasets also use the Indian language (the Sarc-H [30]), representing a pioneering effort in sarcasm detection for Hindi. It consists of 1,004 tweets annotated with sarcastic or non-sarcastic labels. The dataset includes textual and emoji-based inputs, emphasizing multimodal cues crucial for capturing sarcasm in non-English contexts.
Despite the richness of these datasets, challenges persist. Many datasets are biased toward English and, thus, limit their applicability to multilingual settings. Additionally, sarcastic expressions often constitute a minority in real-world data and lead to imbalanced distributions that complicate training and evaluation. Expanding dataset diversity to cover different languages, domains, and modalities remains a critical area for improvement.
2.PREPROCESSING TECHNIQUES
Preprocessing plays a vital role in preparing datasets for sarcasm detection models to ensure their consistency, clarity, and compatibility with computational frameworks. The steps vary across studies but generally include standard NLP techniques alongside sarcasm-specific considerations:
- •Text Normalization: Preprocessing typically begins with cleaning and normalizing text, including:
- •Tokenization: Breaking text into individual tokens (e.g., words or phrases).
- •Lowercasing: Converting all texts to lowercase to standardize inputs and reduce complexity.
- •Stemming and Lemmatization: Reducing words to their root forms to treat variations (e.g., “running” vs. “run”) as equivalent.
- •Noise Removal: Sarcasm detection datasets often contain extraneous elements like URLs, mentions (@usernames), and hashtags (e.g., #sarcasm). Removing these elements ensures that models rely on linguistic patterns rather than explicit markers.
- •Word Embeddings: Most studies employ pre-trained embeddings like GloVe [28], FastText [22,29], or transformer-based embeddings (e.g., BERT) [11,31] to represent words as dense vectors. These embeddings capture semantic relationships that enable models to discern subtle linguistic cues.
- •Punctuation and Auxiliary Features: Sarcasm often involves exaggerated punctuation (e.g., multiple exclamation marks) or capitalization for emphasis. Preprocessing may include extracting features like punctuation counts, repeated characters, or sentiment scores [11].
- •Emoji Processing: For multimodal datasets like Sarc-H, emoji embeddings (e.g., emoji2vec) are generated to capture non-verbal cues. Emojis often carry emotional or contextual information crucial for detecting sarcasm [22].
Preprocessing challenges include balancing simplicity with informativeness. Over-preprocessing may strip away meaningful context, while under-preprocessing could introduce noise that misguides the model.
3.MODELING APPROACHES
The choice of modeling approach determines how effectively a system can detect sarcasm, balancing complexity, accuracy, and computational efficiency. Three primary paradigms dominate sarcasm detection research: traditional machine learning models, deep learning models, and ensemble approaches.
- a.Traditional Machine Learning Models
Early studies in sarcasm detection rely on traditional machine learning algorithms, such as support vector machines, random forests, and logistic regression.
- b.Deep Learning Models
Deep learning has revolutionized sarcasm detection by automating feature extraction and capturing intricate patterns. Popular architectures include Convolutional Neural Networks (CNNs), LSTM, and Hybrid Models. Combining CNNs and LSTMs leverages their strengths.
- c.Ensemble Models
Ensemble approaches combine multiple models to improve accuracy and robustness.
The best-performing models in sarcasm detection often combine advanced architectures and auxiliary features to maximize accuracy. Notable examples include:
- •RCNN-RoBERTa: Integrating RoBERTa’s transformer embeddings with RCNN’s sequential processing achieves 82% accuracy on SemEval-2018.
- •sAtt-BLSTM ConvNet: Combining attention-based BiLSTM with CNN for enhanced feature extraction with auxiliary inputs like punctuation and sentiment achieves 91.60% accuracy on balanced datasets.
- •CNN-LSTM with Emoji Embeddings: Excels in Hindi sarcasm detection, leveraging multimodal cues for 97.35% accuracy on Sarc-H.
These models highlight the importance of hybrid architectures and multimodal inputs. Attention mechanisms, in particular, allow models to focus on critical words or phrases, improving interpretability and performance.
4.STRENGTHS AND WEAKNESSES
The research on sarcasm detection using a deep learning approach presents several strengths and weaknesses.
Strengths
- 1.High Accuracy: Advanced architectures consistently achieve accuracies exceeding 90%, demonstrating their effectiveness.
- 2.Robustness Across Datasets: Models like RCNN-RoBERTa and sAtt-BLSTM ConvNet generalize well across balanced and imbalanced datasets.
- 3.Multimodal Integration: Emoji embeddings and auxiliary features enhance performance, especially in non-English datasets.
- 4.Versatility: Ensemble methods adapt to diverse tasks by leveraging multiple models.
Weaknesses
- 1.Computational Demands: Ensemble and hybrid models require extensive resources to hinder scalability.
- 2.Complexity: Parameter tuning and integration of multiple components complicate implementation and risk overfitting.
- 3.Limited Dataset Coverage: A heavy focus on English and specific domains reduces applicability to global or multilingual contexts.
- 4.Real-Time Challenges: High latency in ensemble models limits their effectiveness in real-time systems.
III.MULTIMODAL FEATURE-BASED SARCASM DETECTION
This study adopted a multimodal preprocessing approach to leverage all elements existing in user comments. This approach was different from the standard techniques that discarded many features during preprocessing. These elements included emojis, punctuation, repeated characters, and images, which often carried nuanced emotional or contextual meanings. By retaining these elements and devising specific strategies to process them, the methodology aimed to enhance the ability to capture sarcasm in user-generated content. This approach not only acknowledged the richness of multimodal data but also sought to transform typically discarded features into valuable inputs for machine learning models.
A.PROCESSING IMAGES
Images were often included in comments and might provide additional context or meaning. This study focused solely on the textual content embedded within images. Using optical character recognition technology, the text was extracted [13] and used as a replacement for URLs within the comments, particularly for file types of .gif, .jpg, and .jpeg. However, other visual aspects of images, such as facial expressions or objects, were excluded. This selective inclusion ensured that the focus remained on textual analysis while reducing computational complexity. The extracted text replaced the image URL in the dataset to ensure a streamlined input for subsequent processing stages. This approach not only enhanced the interpretability of the data but also contributed to improved computational performance in downstream tasks.
B.HANDLING REPEATED EMOJIS
Repeated emojis were frequently used in comments to amplify emotional expressions. For instance, a single laughing emoji might convey humor, while multiple laughing emojis could emphasize hilarity. To capture this nuance, a new binary column, “isRepeatedEmoji,” was introduced. This column assigned a value of 1 if the comment contained repeated emojis and 0 if otherwise. Simultaneously, each emoji was translated into its corresponding textual meaning, preserving its semantic role within the comment. For instance, 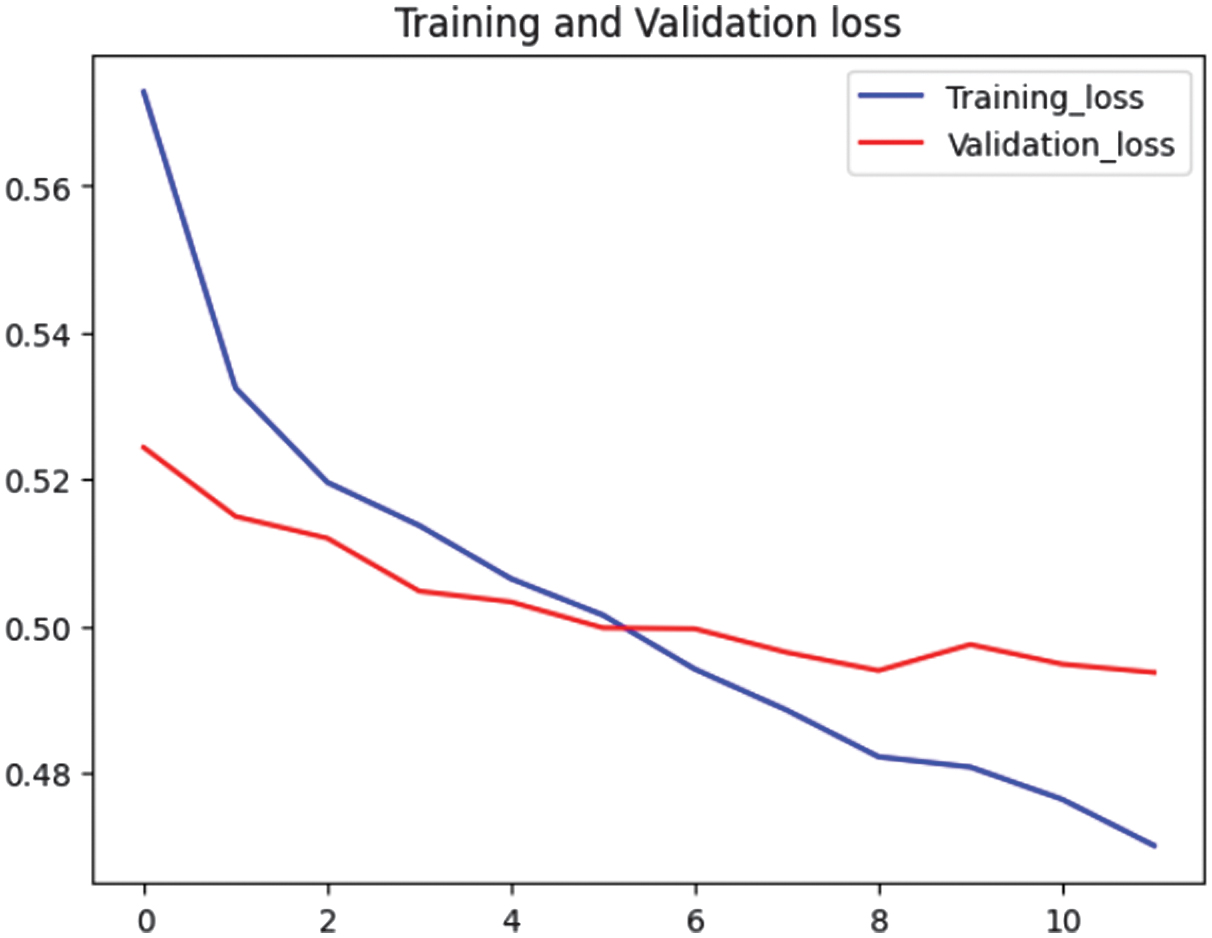 was translated to “smiling face.” These textual replacements helped integrate emojis into the text-based analysis seamlessly.
C.ADDRESSING REPEATED PUNCTUATION
Similar to emojis, repeated punctuation marks (e.g., “!!!” or “…”) often served to intensify emotions or convey specific tones in comments [11]. A separate binary column, “isRepeatPunctuation,” was created to flag comments containing repeated punctuation, with 1 indicating their presence and 0 indicating their absence. Once flagged, these punctuation marks were removed from the comment to prevent redundancy during subsequent text analysis. This approach captured the information conveyed by repeated punctuation while maintaining a cleaner textual representation.
D.HANDLING REPEATED CHARACTERS
Repeated characters, such as “sooo” or “yessss,” added expressiveness to written language by mimicking spoken emphasis [11]. To capture this phenomenon, the study introduced another binary column, “isRepeatChar,” with a value of 1 for comments containing repeated characters and 0 for otherwise. After this identification, the repeated characters were removed to standardize the text, converting exaggerated words like “sooo” back to their base form “so.” This step ensured that while the expressive intent was recorded, the text remained compatible with the machine learning models used later.
E.STANDARD PREPROCESSING TECHNIQUES
Following the processing of these unique elements, traditional preprocessing steps were carried out. These included:
- 1.Cleaning: Removing noise such as HTML tags, special characters, and unnecessary whitespace.
- 2.Case Folding: Converting all texts to lowercase to maintain consistency.
- 3.Stopword Removal: Eliminating frequently occurring but semantically insignificant words like “dan,” (and), “atau,” (or), and “yang” (which).
- 4.Stemming: Reducing words to their root forms to ensure lexical uniformity.
These steps helped create a clean, standardized dataset, which was critical for effective embedding and subsequent modeling.
F.EMBEDDING WITH WORD2VEC
After preprocessing, the text data were embedded using Word2Vec, a technique that mapped words into continuous vector spaces based on their contextual usage. This embedding captured semantic relationships between words to enable the models to understand similarities and differences in meaning. Word2Vec’s ability to preserve semantic and syntactic relationships ensured that the transformed data were rich in contextual information.
G.CLASSIFICATION USING DEEP LEARNING ALGORITHMS
The classification phase employed deep learning models, specifically LSTM, BiLSTM, and GRU. These algorithms were particularly well-suited for sequential data like text due to their ability to retain long-term dependencies and context. They were chosen over ensemble approaches because they typically required less computational power while delivering robust performance.
- 1.LSTM: handles long-range dependencies in text effectively, making it ideal for understanding the sequential nature of comments.
- 2.BiLSTM: enhances context understanding by processing text in both forward and backward directions.
- 3.GRU: offers a computationally efficient alternative to LSTM while maintaining performance on sequential tasks.
H.SCENARIOS AND EVALUATION
To evaluate the effectiveness of this preprocessing approach, the study designed fifteen scenarios combining different elements (i.e., Normal, RepeatedEmoji, RepeatedPunc, RepeatedChar, Composite). Each of these scenarios was applied to the three algorithms to identify the optimal model and feature combination. By systematically varying the inclusion of these multimodal elements, the study sought to understand their individual and combined contributions to model performance.
This methodology represented an approach to multimodal preprocessing by retaining and leveraging comment elements traditionally discarded. By systematically transforming emojis, punctuation, repeated characters, and image text into meaningful features, the study maximized the value of available data. Coupled with advanced embedding techniques and efficient deep learning models, this approach aimed to deliver robust and nuanced insights from user-generated content. The structured scenarios ensured comprehensive evaluation, providing a strong foundation for future work in multimodal text analysis.
IV.RESULT AND ANALYSIS
Data collection was carried out twice. The data collection was carried out twice. The initial phase focused on collecting data specifically around the keyword “TikTok Shop.” This phase spanned from October 2023 to November 2023, during which a total of 22,280 data points were gathered from YouTube. The keyword was strategically chosen due to its relevance in the e-commerce landscape, particularly as TikTok Shop gained popularity as a platform for both small and large businesses to market and sell products. In the second phase, data were collected more broadly across multiple social media platforms, including Instagram, Twitter, YouTube, and TikTok, between June 1, 2024, and August 31, 2024. A more extensive range of keywords was utilized to obtain data, including “E-commerce,” “online shop,” “online store,” “drop ship,” “affiliate marketing,” “digital marketing,” “social media marketing,” “content marketing,” “tiktok marketing,” “tiktok ads,” “tiktok shop,” “tokopedia,” “shopee,” “promosi,” “product listing,” and “marketplace.”
The combined efforts from both phases yielded 76,146 comments in Bahasa Indonesia, distributed across platforms as follows: (1) YouTube: 39,412 comments; (2) TikTok: 31,144 comments; (3) Instagram (MetaIG): 4,550 comments; and (4) Twitter (X): 1,040 comments. This distribution highlighted the dominance of YouTube and TikTok in discussions about e-commerce, emphasizing the platforms’ role as both content hubs and marketing tools. The dataset’s diverse origin helped ensure that the study captured a broad spectrum of online communication styles, ranging from formal to highly informal.
The next step was data labeling, a crucial process for supervised machine learning tasks. Initially, three human annotators were employed to label the dataset. However, the labeling consistency among them was low, as evidenced by a Fleiss kappa score of 0.325, indicating poor agreement. Sarcasm detection was inherently subjective and often context-dependent, which likely contributed to the annotators’ disagreements. And the sheer volume of data likely contributed to inconsistencies as annotators grew fatigued. The number of datasets made it impractical to replace annotators or re-evaluate the entire labeling process. To address these challenges, the study transitioned to using GPT-3.5 Turbo for labeling because of its capability to detect sarcasm, especially in comparison to traditional tools like VADER and TextBlob, which struggled with nuanced text [32]. Leveraging GPT-3.5 Turbo ensured consistency and efficiency in the labeling process and processed large datasets more efficiently than human annotators.
Once labeled, the dataset underwent a rigorous cleaning process to remove duplicate and irrelevant data. Comments were often nearly identical, with users simply appending a single word or copy-pasting previous remarks. These were removed using a Jaccard similarity index with a threshold of 0.8%. The excessively long comments (exceeding 100 words)—typically advertisements—were also discarded. This cleaning step reduced the dataset size by approximately 50%, leaving 28,272 comments for further processing.
The labeled dataset revealed a significant class imbalance: sarcasm class: 7,482 instances (26.5% of the data) and non-sarcasm class: 20,790 instances (73.5% of the data). To address this imbalance, the study employed an undersampling technique. The larger class (non-sarcasm) was reduced to match the smaller class (sarcasm), resulting in a balanced dataset of 14,964 comments (7,482 instances per class).
Fig. 1 displays a dataset snippet (rows 28096–28106) containing user-generated text with various emojis and informal language, repeated punctuation, and repeated letters. This highlighted the importance of emoji translation in the preprocessing step. Many entries used emojis to convey sentiment, urgency, or emphasis, such as 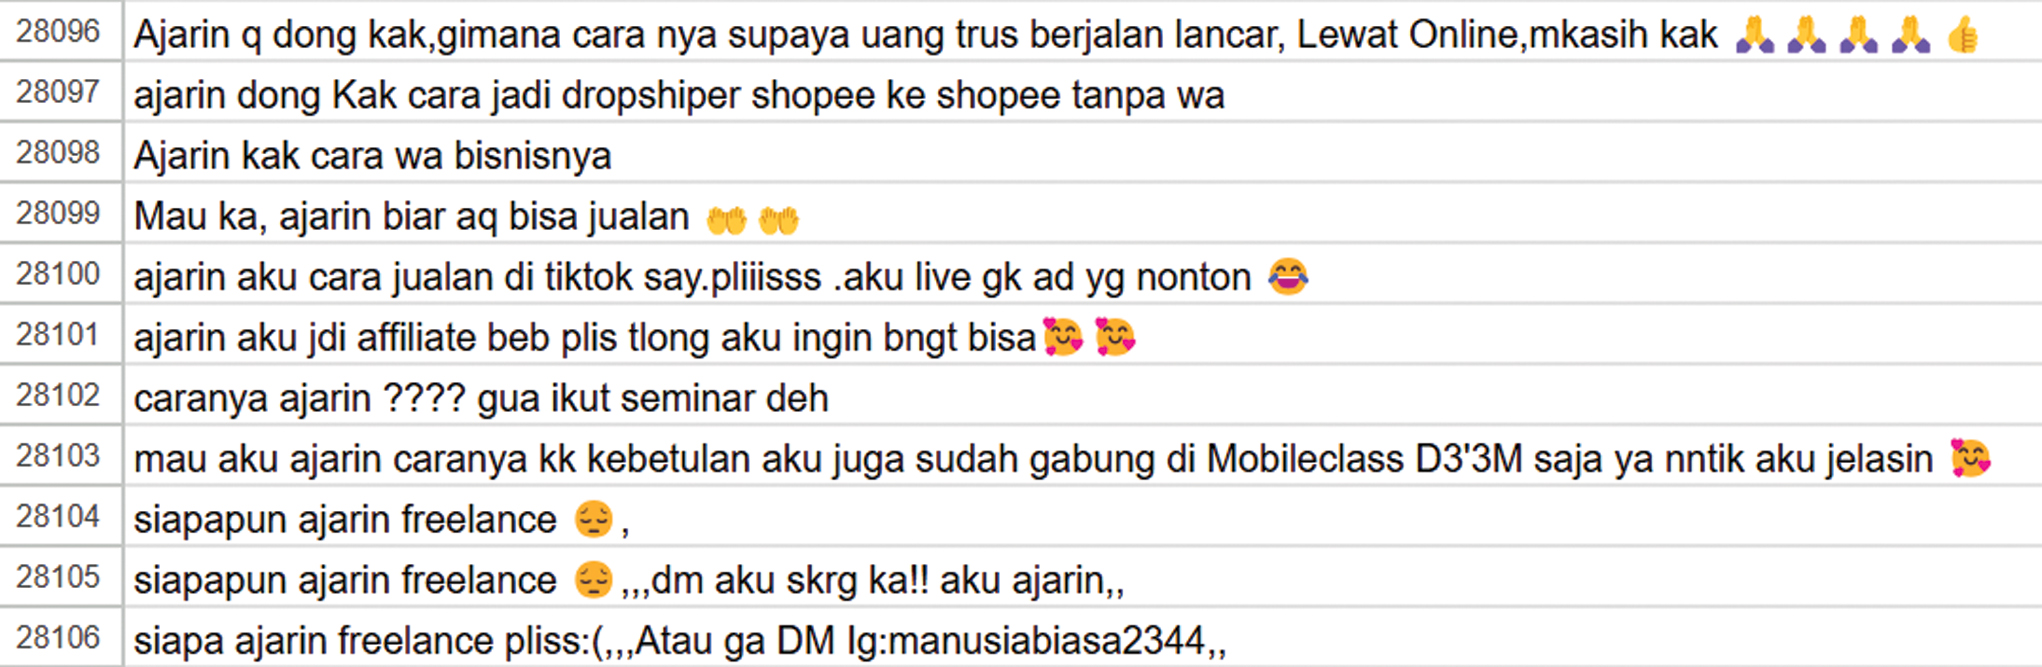 for gratitude,
 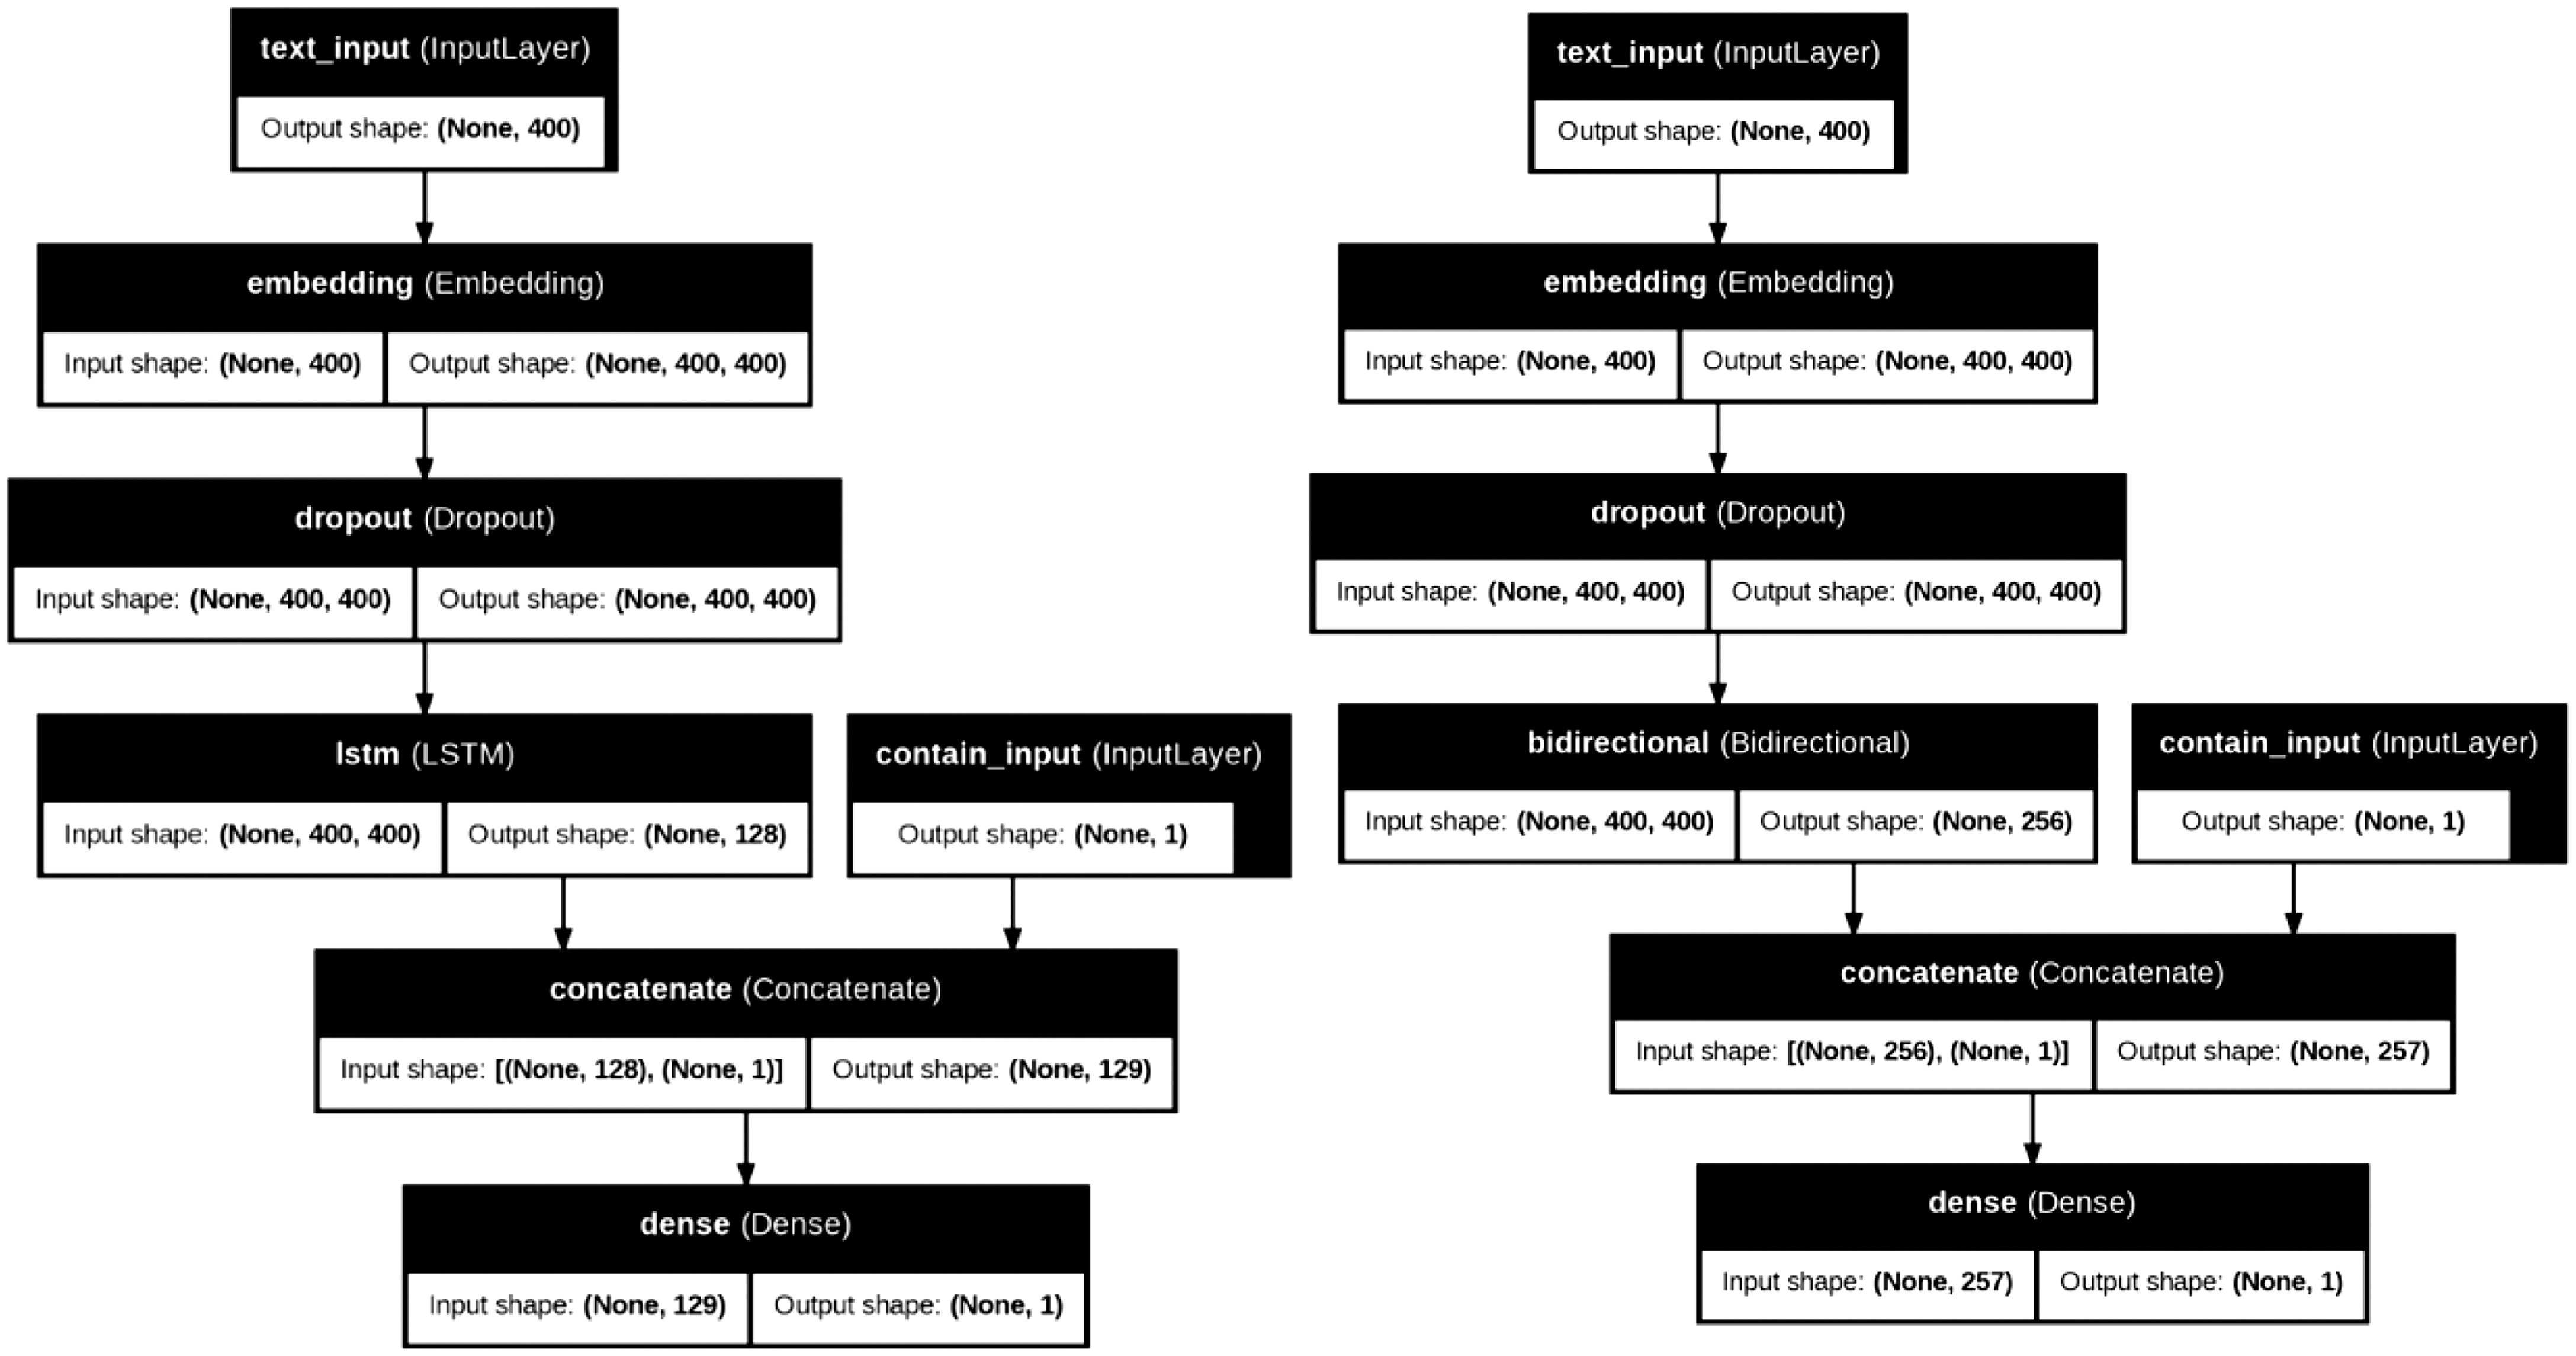 for amusement, and
 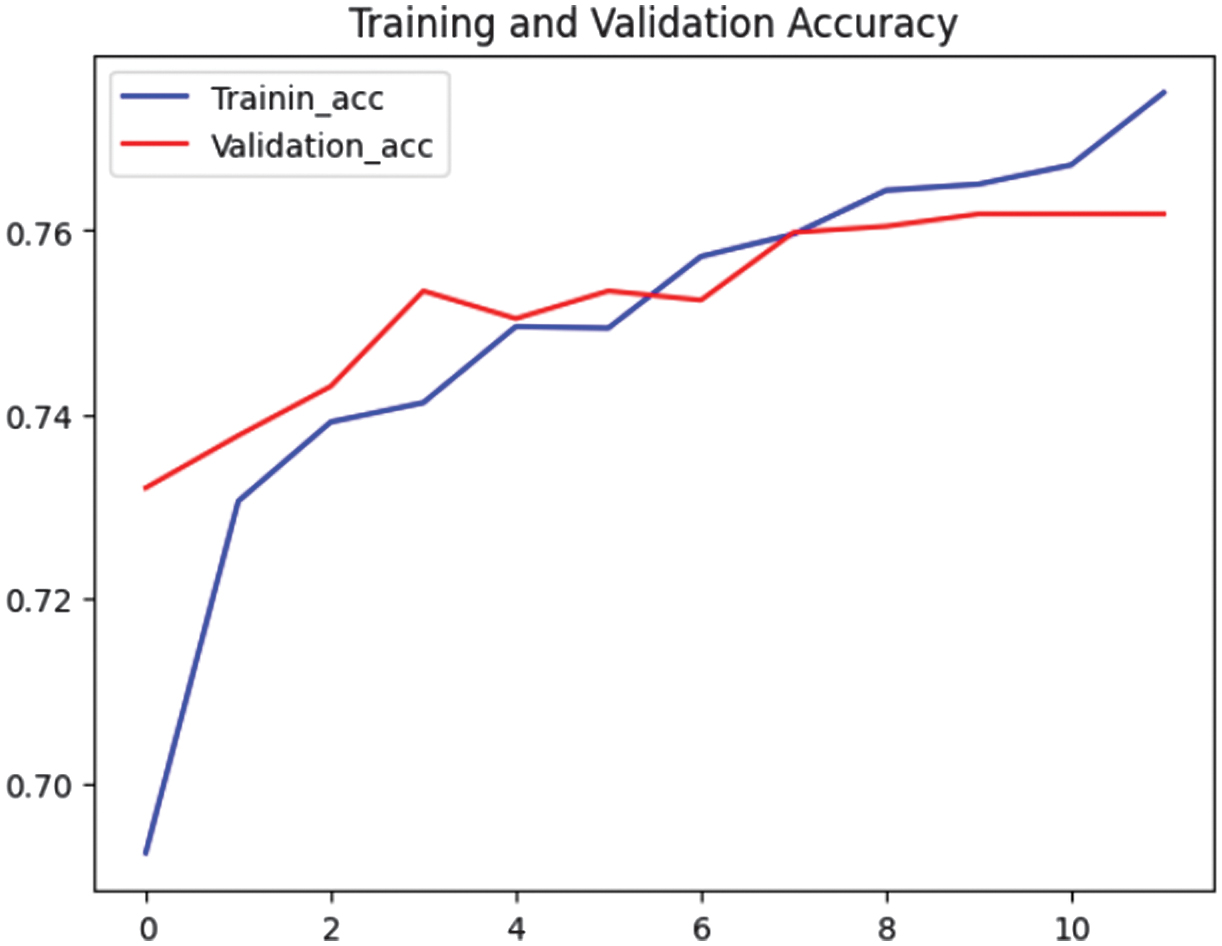 for desperation.
Fig. 1. Dataset snippet from rows 28096–28106.
To ensure better sarcasm detection, the preprocessing step replaced emojis with contextual meanings rather than their literal names. For example, instead of replacing with “smiling face with hearts,” it was mapped to “happy and affectionate feelings” to better reflect its intended use. This approach relied on a custom emoji dictionary because the standard dictionaries often lacked nuanced interpretations. However, the current dictionary was still evolving and required further refinement to handle a broader range of emoji usage.
The second stage was to capture unique linguistic and stylistic cues by creating five distinct scenarios based on specific features:
- (1)Normal Scenario used the cleaned dataset without additional features (only the text input is used).
- (2)Emoji Scenario introduced a binary column (IsRepeatedEmoji) to flag repeated emojis (text input +IsRepeatedEmoji).
- (3)Repeated Punctuation Scenario added a binary column (IsRepeatedPunct) for repeated punctuation (text input +IsRepeatedPunct).
- (4)Repeated Characters Scenario added a binary column (IsRepeatedChar) for repeated letters or combinations (text input + IsRepeatedChar).
- (5)Composite Scenario was composite from scenarios 2–4, which consisted of text input + IsRepeatedEmoji+ IsRepeatedPunct + IsRepeatedChar.
These five scenarios allowed the models to capture unique linguistic and stylistic cues, particularly relevant in detecting sarcasm. By systematically varying the features across these scenarios, the study explored the extent to which these multimodal elements influenced the performance of different deep learning architectures.
The study utilized three deep learning algorithms—LSTM, BiLSTM, and GRU—to evaluate the performance of the four scenarios. Some of the model architectures are shown in Fig. 2. The image presents two deep learning architectures designed for text processing with an additional non-text feature. Both models shared several key components. They began with a text input layer of 400 lengths, followed by an embedding layer that transformed text tokens into (400, 400) vector representations. To prevent overfitting, a dropout layer was applied while maintaining the same dimensions. Additionally, both architectures incorporated an extra non-text feature input (contain_input), which had a single value and was later concatenated with the output from the recurrent layers. The final step was binary classification using a thick layer, which yielded a single value indicating whether or not the text was sarcastic.
Fig. 2. LSTM and BiLSTM model architecture.
The primary difference between the two architectures laid in their recurrent layers. The left model employed a standard LSTM layer, producing an output of 128 dimensions, whereas the right model utilized a BiLSTM, which processed text in both forward and backward directions, resulting in an output of 256 dimensions. Due to this condition, the concatenation layer in the left model had a total dimension of 129 (128 from LSTM + 1 from the non-text feature), while in the right model, it expanded to 257 (256 from BiLSTM + 1 from the non-text feature).
The GRU model-based scenario performed the worst out of the three algorithms in the fifteen created scenarios, with an accuracy of only 72%. LSTM and BiLSTM were nearly identical, with an accuracy of 76%. Table I summarizes the minor variations. LSTM-based models comprised models 1–5, while models 6–10 were based on BiLSTM. Each model adopted a unique combination of data preprocessing and feature engineering to understand its impact on performance metrics.
Table I. Proposed approach result for each indicator
| Indicator\model | 1 | 2 | 3 | 4 | 5 | 6 | 7 | 8 | 9 | 10 | |
|---|---|---|---|---|---|---|---|---|---|---|---|
| Accuracy | 0.76 | 0.76 | 0.76 | 0.76 | 0.76 | 0.76 | 0.76 | 0.75 | 0.76 | 0.76 | |
| Sarcasm class | Precision | 0.74 | 0.74 | 0.74 | 0.74 | 0.73 | 0.74 | 0.74 | 0.73 | 0.74 | 0.74 |
| Recall | 0.78 | 0.8 | 0.77 | 0.79 | 0.82 | 0.79 | 0.77 | 0.78 | 0.79 | 0.78 | |
| F1-score | 0.76 | 0.77 | 0.76 | 0.76 | 0.77 | 0.76 | 0.76 | 0.75 | 0.77 | 0.76 | |
| Train in 12 epochs | Time per step | 643–675 ms | 599–625 ms | 599–622 ms | 595–677 ms | 602–677 ms | 1 s | 1 s | 1 s | 1 s | 1 s |
| Total time per epoch | 69–84 s | 61–83 s | 62–83 s | 62–89 s | 62–83 s | 90–146 s | 115–149 s | 115–145 s | 113–144 s | 108–144s | |
| CPU usage | Average (%) | 6.58 | 27.98 | 2.17 | 5.78 | 13.45 | 10.92 | 11.02 | 11.83 | 2.67 | 11.72 |
| Max (%) | 24 | 56.8 | 4 | 24.7 | 51.1 | 56 | 56.6 | 55.5 | 5.5 | 45 | |
| RAM usage | Average (%) | 18.98 | 18.93 | 19.03 | 18.38 | 17.82 | 20.95 | 20.85 | 18.53 | 19.55 | 19.12 |
| Max (%) | 19 | 19.1 | 19.1 | 19.1 | 17.9 | 21.1 | 20.9 | 18.6 | 19.60 | 19.2 | |
Models 1 and 6 (Normal Scenario) served as the baseline, relying solely on a single column, comment, which contained text that had undergone standard preprocessing. The simplicity of this approach made it computationally efficient, but it excluded features like repeated emojis, punctuation, or characters, which might capture additional nuances. Models 2 and 7 (isRepeatedEmoji Scenario) utilized two columns, namely, comment and isRepeatedEmoji. This added feature allowed the models to capture the intensity or emphasis conveyed through emoji repetition, a common way to express emotions in user-generated content.
Models 3 and 8 (isRepeatedPunct Scenario) combined the comment column with isRepeatedPunct, a binary feature flagging the presence of repeated punctuation. Repeated punctuation (e.g., “!!!” or “…”) conveyed emotional intensity or hesitation, making it a valuable input for sentiment or intent analysis. Models 4 and 9 (isRepeatedChar Scenario) incorporated comment and isRepeatedChar, a binary feature indicating repeated characters within words (e.g., “sooo” or “yessss”). Repeated characters were another form of emphasis that added expressiveness to text, particularly in informal digital communication.
Models 5 and 10 (Composite Scenario), on the other hand, used composite approaches to integrate multiple features to improve predictive accuracy. Unlike the other models, which focused on individual linguistic markers, composite models like Model 5 merged different indicators, such as repeated punctuation and repeated emojis, to provide a more nuanced understanding of sarcasm detection. Model 10 combined multiple extracted features with a BiLSTM-based architecture to offer a deeper contextual understanding but at a higher computational cost.
Performance evaluation went beyond accuracy to include precision, recall, and F1-score. While accuracy measured the overall correctness of predictions, precision, recall, and F1-score provided deeper insights into a model’s ability to handle imbalanced or nuanced datasets. Of the scenarios exploring individual features, scenarios 2 and 9 had fairly good scores and were nearly identical based on these metrics. Models 2 and 9 outperformed the others, indicating that the inclusion of repeated emojis (Model 2) and repeated characters (Model 9) contributed significantly to capturing nuances in the dataset. However, of all the scenarios developed, Model 5 had the best performance. Model 5 had the highest recall (0.82); henceforth, it was better at detecting sarcasm. Models 2, 9, and 10 had slightly better precision (0.74) but lower recall (0.8 and 0.79), indicating they were better at avoiding false positives but might miss some sarcastic instances.
LSTM-based models (1–5) exhibited relatively faster training times due to the single-layer design of LSTMs. LSTMs were designed to handle sequential dependencies efficiently but process data in only one direction (forward). BiLSTM-based models (6–10) generally achieved better performance because they processed data in both forward and backward directions to provide a more comprehensive understanding of the context. However, this dual-layer design doubled the computation time, making BiLSTMs slower to train compared to LSTMs. Models 2 and 5 were more efficient in completing training faster (under 677 ms per step and ∼83 s per epoch). Models 9 and 10 took significantly longer (1 s per step, over 100 s per epoch). Meanwhile, Model 10 was the most computationally expensive, yet it did not show an improvement in accuracy or recall compared to Model 5.
BiLSTM models required longer training periods than LSTM models, primarily due to their parallel processing layers. This was a critical consideration when working with limited computational resources or time constraints. While BiLSTM models demanded more RAM than LSTM models, the increase was not directly proportional to the doubled computation time. This indicated efficient memory management in BiLSTM implementations. From the CPU Utilization aspect, Models 2 and 5 stood out for their higher CPU consumption, exceeding 6–10 times the average CPU usage of Model 9. Despite their quicker training time, Models 2 and 5’s high CPU demands might limit their practicality in resource-constrained environments. In contrast, Model 9 demonstrated remarkable efficiency, with an average CPU usage of only 2.67% and a peak of 5.5% over 12 epochs. This made it a more sustainable choice for large-scale or long-term deployment.
While precision, recall, and F1-score highlighted the strengths of Models 2, 5, and 9, other factors like computational efficiency, resource utilization, and overall training time must also be considered. While Model 9 excelled in efficiency, Models 2 and 5’s higher CPU usage might pose challenges in real-world applications. To make the final decision, Figs. 3–8 analyze the trends in accuracy and loss during training.
Fig. 3. Accuracy graphs for Model 2.
Fig. 4. Loss graphs for Model 2.
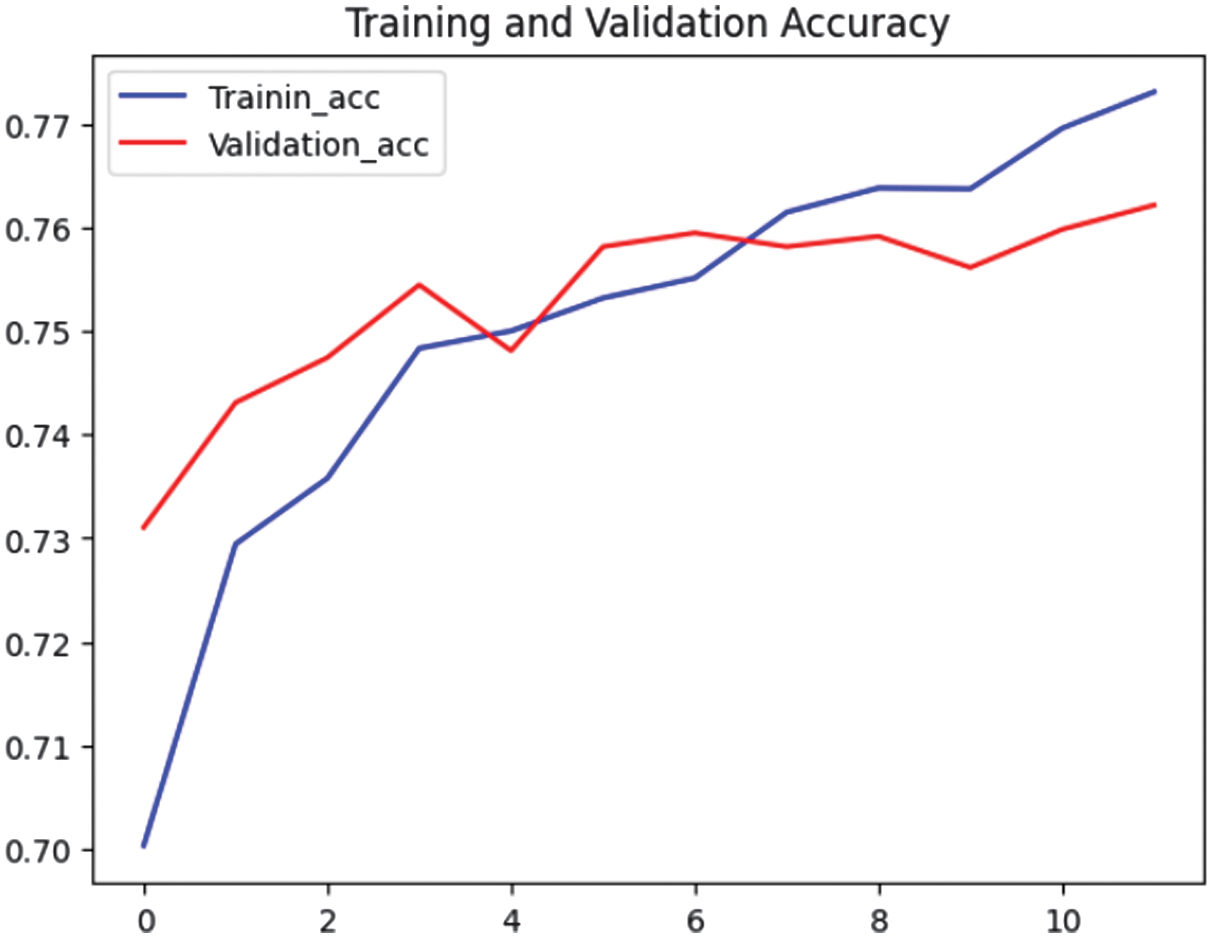 Fig. 5. Accuracy graphs for Model 9.
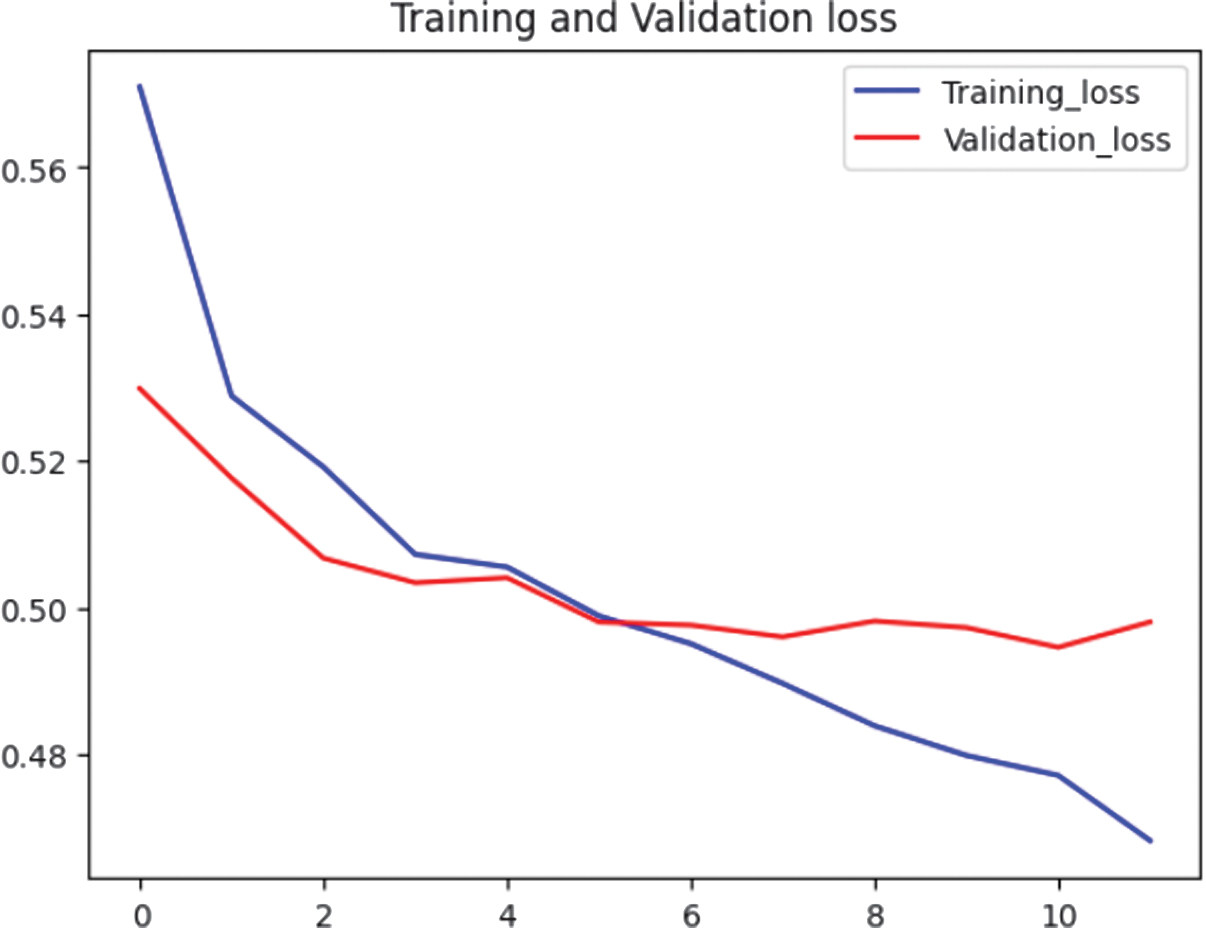 Fig. 6. Loss graphs for Model 9.
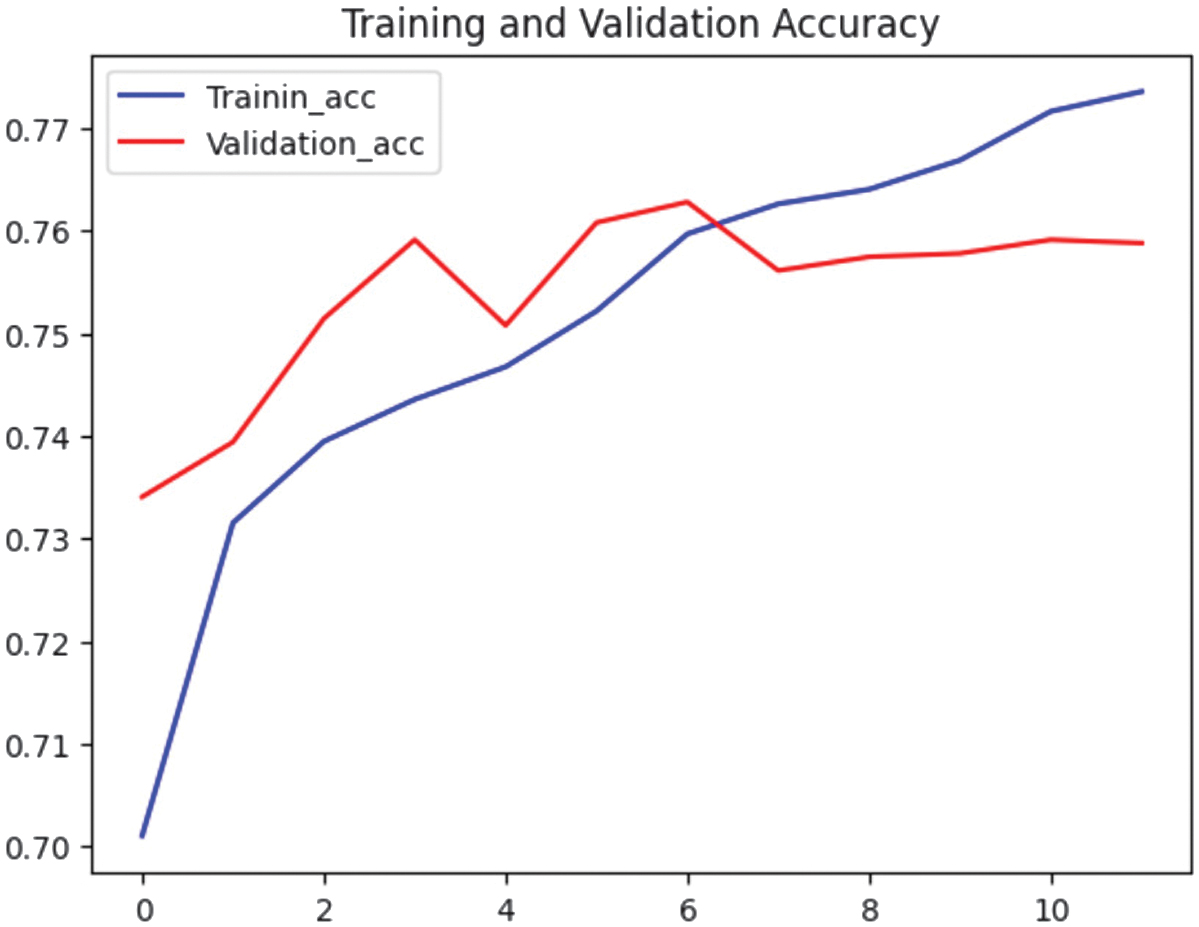 Fig. 7. Accuracy graphs for Model 5.
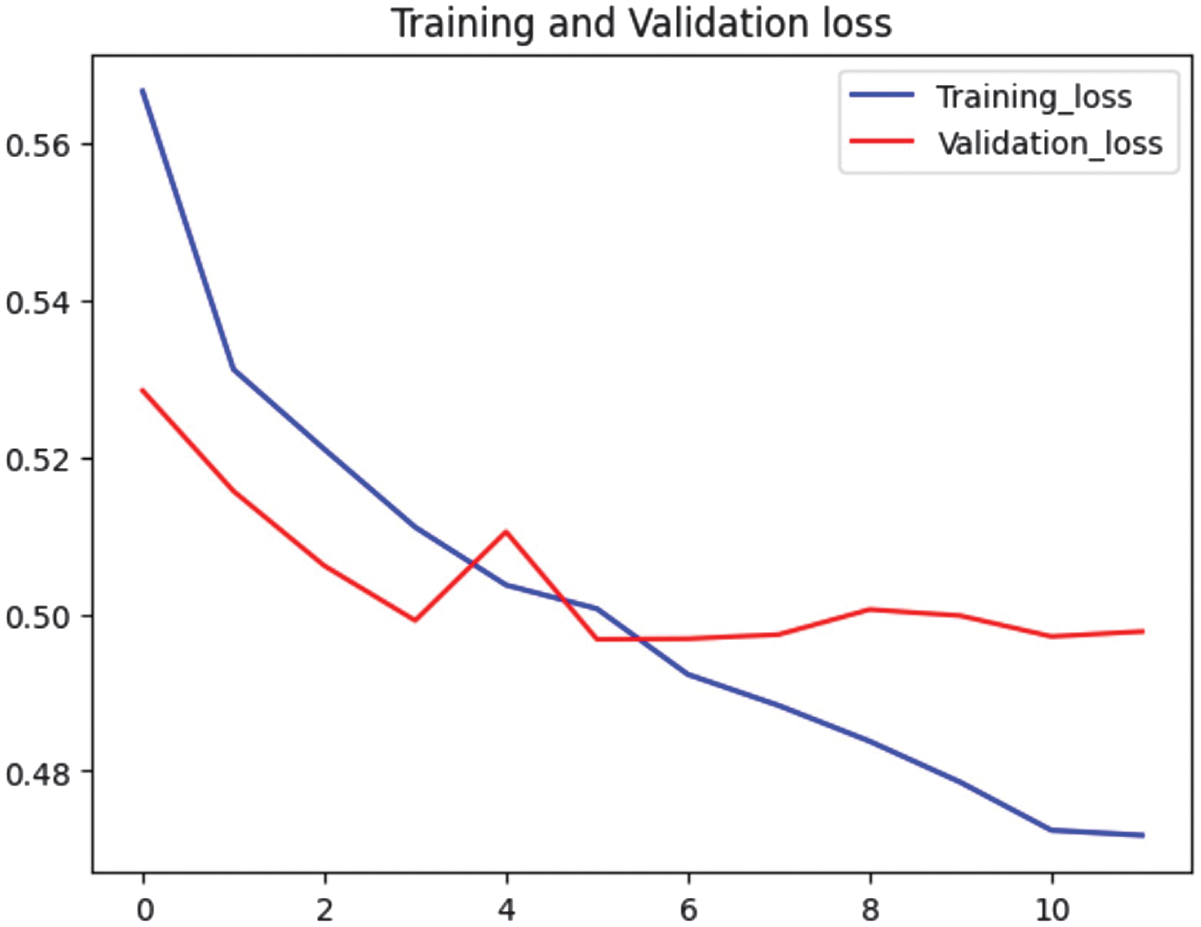 Fig. 8. Loss graphs for Model 5.
Fig. 3 demonstrates a steady rise in both training and validation accuracy in Model 2. Although validation accuracy varied a little, it still followed a similar pattern to training accuracy.
Fig. 4 displays the training and validation losses that kept declining until the end of the epoch without a discernible rise in the validation loss. This figure demonstrated that Model 2’s learning and generalization stability were good.
Fig. 5 illustrates that Model 9’s validation accuracy fluctuated, particularly in the last few epochs. Even though it had increased generally, this variation might be a sign that Model 9 was beginning to struggle with generalization. Finally, the last epoch showed an increase in validation loss, which might be a sign of overfitting (see Fig. 6).
By examining the trends in accuracy and loss during training, the study evaluated the model’s convergence behavior and generalization ability. Smooth convergence with minimal overfitting was a desirable characteristic, indicating that the model could perform well on unseen data. Based on the evaluation metrics outlined above, Model 2 (isRepeatedEmoji) emerged as the superior choice due to its consistent accuracy and stable loss trends, without exhibiting a significant rise in validation loss. In contrast, Model 9 (isRepeatedChar) demonstrated fluctuations in validation accuracy and displayed signs of overfitting, as evidenced by its loss trajectory. These findings suggest that Model 2 offers greater reliability and generalizability for the task at hand.
Fig. 7 shows that training accuracy improved, reaching 0.77. Validation accuracy fluctuated slightly but stabilized close to 0.76, indicating better generalization compared to Model 2. Training loss also decreased, while validation loss remained more stable, indicating a better balance between fitting the training data and generalizing to unseen data (see Fig. 8).
Model 5 outperformed Model 2 in generalization since its validation accuracy remained stable while maintaining a decreasing training loss. Model 2 was more prone to overfitting as suggested by its validation loss behavior. While both models achieved similar accuracy (∼0.76–0.77), Model 5 was more robust for real-world applications due to better validation loss stability. Thus, the environment and application requirements determined what kind of model would be used. Model 9 demonstrated exceptional predictive performance while maintaining low computational overhead, positioning it as an ideal choice when the primary objective was to balance accuracy, efficiency, and scalability. However, for applications requiring a more comprehensive approach with enhanced contextual awareness, Model 5 proved to be the superior alternative.
V.CONCLUSION
This study highlights the importance of scenario-specific preprocessing and feature selection in improving sarcasm detection performance. The results indicate that incorporating repeated emojis, repeated characters, and composite features significantly enhances model accuracy. Additionally, the trade-offs between resource usage, computational efficiency, and predictive performance across different architectures are analyzed.
Model 5 (LSTM–composite) demonstrates stable accuracy and loss trends, achieving an accuracy of 76%, precision of 73%, and recall of 82%. While this model integrates multiple features and offers better generalization, it comes at a higher computational cost, making it less ideal for large-scale deployment. In contrast, Model 9 (BiLSTM–isRepeatedChar) strikes a balance between efficiency and predictive performance, with an accuracy of 76%, precision of 74%, and recall of 79%, while maintaining low computational costs, making it more suitable for resource-limited environments.
The choice between models depends on the application requirements. If balancing accuracy, efficiency, and scalability is the priority, Model 9 is the optimal choice due to its lower computing overhead. However, for applications requiring stronger contextual awareness and where higher computational resources are not a constraint, Model 5 is a better fit.
Future studies are suggested exploring meme-based sarcasm detection, incorporating both visual and textual features, along with emoji translation dictionaries for better semantic understanding. Additionally, techniques like model pruning or quantization can be applied to reduce computational demands while maintaining accuracy.