I.INTRODUCTION
It is seen that humans show their emotions by variety of vocal attributes [1,2]. The two-way communication between human and computer is easy using speech, face and body gestures [3]. Two types of data is included in human speech one is verbal second is nonverbal. Verbal data is more important to understand the semantic of speech [4]. Furthermore, some other factors also effect like cough, laughter and yawns. We can express less feeling while interacting with machines [5]. There has been a lot of research and development into speech emotion recognition (SER), which uses speech cues to determine emotion states [6,7]. However, SER is still a challenging process because to the need of extracting both practical and emotional components. Use of SER simplifies research on human-computer identification. This implies that the system has to comprehend the user’s emotions in order to describe its functions accurately. Voice-to-text translation, feature extraction, feature selection, and feature classification are just a few examples of the many functions that need to be performed by a well-designed framework that incorporates all of these elements. The successful categorization of characteristics is another tough technique that calls for the use of several emotional systems.
Speech provides both textual and emotional information [8]. The computer should be able to detect the emotional content of speech signals automatically in order to create a harmonious human-computer interaction experience. In a customer service system, for instance, the voice may determine the client’s feelings. When combined with an educational assistant system, it has been demonstrated to improve kids’ academic and social-emotional capabilities [4]. Parents and teachers are able to solve problems quickly. Through speech, the operating system is able to identify emotions. The technology will give a head’s up when the motorist becomes overly agitated or worried. By doing this, the chance of traffic accidents may be reduced. There are several uses for automatic speech emotion detection across numerous sectors.
Feelings may be conveyed by one’s vocal tone, one’s facial expressions, or any other biological means. Computing with an emphasis on emotion seeks to automatically recognize and synthesize such emotions. There have been plethora’s of research on the topic of emotion detection in facial expressions by automation [9]. Despite the need of high-quality cameras for capturing facial pictures, real-time implementation is challenging due to the computational demands of emotion identification through face acknowledgement. Emotion recognition based on language has greater potential than that based on facial expressions [10,11]. Vocal emotions are also highly essential in multimodal human-computer interaction. Emotion recognition in language is essential since speech is the primary means of human communication. Consequently, this piece will discuss many features of speech emotion recognition (SER) methods.
By talking to the computer instead of putting orders into it, one may ensure that it understands not only the words being spoken but also the nuances of tone that an attentive human ear would pick up on immediately. If machines can read human emotions, the human-machine bond will grow in significance. In the last decade, SER has gone from being a side problem to a major one in the fields of speech processing and Human-Computer interface (HCI). SER may be used in a broad range of contexts. For example, a human-computer interface may be programmed to react differently depending on the user’s mood. This might be crucial in scenarios where interacting with a computer mostly involves voice [12]. Therefore, SER is crucial for adding personality to the following software.
Normally, there are three divisions of the mechanism that is involved to create human voice. The first one is called articulators, the lungs and the third one is the vocal folds [13]. Many characteristics are involved in human voice and their relative patterns. Among them loudness, timber, tone and pitch. On the behalf of observation of vibration in cycles per second on a musical scale a listener is assigned with number of tones to distinguish them by using auditory sense which called pitch [14]. Observation of echoic pressure in sound wave is known as loudness. The loudness of sound can be perceived in a range from calm to shrill. The sound pressure varies from ambient, medium and to atmospheric pressure which is created by sound wave [15]. To differentiate the semantic of words, tone is used of pitch in language. To show different emotions the tone excellence of humane voice varies. Machine learning is a growing field of artificial intelligence. Now it is working on machine to make them brilliant enough that they should take decision like human beings. Machine learning is an area of research by using algorithm.
The two modal emotion detection system using speech and facial data was used by Tu and Yu [16]. Slow response time was observed due to dependency issue with frequency domain. Another study on comparison with pitch and energy was showed by Busso et al. [17]. Audio characteristics have good accuracy but less efficient with emotion prediction Banse and Scherer [18]. Decision level fusion methodologies facilitate robustness to emotion detection system Chao et al. [19]. To increase the exactness the experiments were performed by using machine learning [5]. Up to now date the best architecture on statistical pattern techniques were given by Dellaert et al. [20]. An impressive toolkit is open-EAR that is currently famous open-source emotion and effect recognition [21].
II.LITERATURE REVIEW
The purpose of this study is to develop an efficient method of classifying emotional states based on recordings of human speech that is both rapid and accurate. In order to accomplish our goal, we improved upon the state-of-the-art MLP layouts. Because the training dataset was not updated to equalize the classes, the model’s learning performance could be evaluated with less training examples. Cognitive psychologists’ theories of emotion provide a good foundation from which to describe how individuals really feel [22]. Dimensional and definite models of emotion are often utilized despite the existence of other theoretical frameworks [23]. For convenience, emotional computing increasingly employs a category categorization of emotions. For instance, in a previous study [24], computers were employed to classify eight distinct emotional states from participants’ facial expressions. Oudeyer [25] created such algorithms to generate and recognize the five moods using voice features. According to Ekman and Friesen [13], there are six fundamental categorical emotions that are universal and may be detected and portrayed via facial expressions.
In the literature, ML paradigms are widely used, and many publications on SER rely significantly on them. In a plethora of publications, researchers present their findings from their study utilizing a variety of categorization methods [26]. Prosodic, disfluent, and lexical data from real-world oral human-human interactions were utilized in previous work to train support vector machines (SVMs) and decision trees (DTs) to identify important emotional states. Emotional speech classification utilizing two datasets (Berlin German and Chinese) using the SVM approach has been done before [27]. In another study [28], scientists developed a hybrid system that could tell a person’s emotional state from their voice and look alone. Three machine learning methods, including k-nearest neighbors (KNN), support vector machines (SVMs), and adaBoost decision trees, were explored by Akçay and Oğuz [8] and applied to the emotional speech datasets Kismet, BabyEars, Danish, and Berlin. Using physiological data, Rani et al. [26] examined the effectiveness of the KNN method; regression trees (RTs), Bayesian networks, and support vector machines (SVMs) machine learning (ML) approaches for emotion identification [29]. A neural network classifier was proposed in a previous research for detecting changes in human vocal emotion [30].
Most systems that can recognize emotions in conversational discourse are developed with English in mind, just as most effective databases are written in the language [28,31]. Voice recognition techniques have been refined to make use of a lot less feeling when dealing with languages like Basque and Spanish. For those interested in Basque, check out by Luengo and Dalmau [32] are examples of Spanish literature. Another example is the research conducted by Alnuaim et al. [33], who compared how different languages (including Spanish) handle the identification of emotions. There was a total of 26 “high-level” (AHL) and 14 “database-specific” (DSE) affective variables considered in this analysis. AHL is the abbreviation for an abstract high-level representation of a set of low-level qualities (low-level features are composed of pitch, pitch derivatives, energy, and a period of speech sections). DSE refers to a collection of emotional characteristics that are unique to a certain speaker. Emotion classification was performed with the aid of artificial neural networks, and the findings were compiled using the max-correct evaluation method. Utilizing max-correct with AHL attributes resulted in an average identification success rate of 55.21 percent, whereas using DSE characteristics resulted in a success rate of 45.766 percent. These looked into how differences in language and culture affect the efficacy of expressions of emotion in communication. It has been the subject of several studies; some examples are [34]. In [35], researchers compared the Swedish and Spanish civilizations experimentally. However, it must be stressed that the Basque language has not been mentioned in any of the research conducted on cross-cultural communication.
Schröder [36] study is required due to his extensive citations of literature on affective aspects of language. The majority of them make references to English, and the authors’ cited characteristics are most often encountered in works written in English. To the best of the authors’ knowledge, Alnuaim et al. [33] study is the only one of its kind focusing on emotional components of conversation in Basque, but it does include some of the more prevalent ones. The situation in Spanish is somewhat similar, with just a handful of references and widespread use of some of the most prevalent elements. But two studies from the past provided a novel signal processing approach that brings new and interesting dimensions to the study of vocal affect [37,38]. Emotion detection feature extraction has been the subject of a large number of scholarly articles. Picard [39] described and contrasted many approaches for feature-based identification of the emotional state from this data. To choose features for a neural network classifier, makes use of a quick correlation-based filter; has a trained expert handle the sampling; and applies nonlinear dimensionality reduction to complete the recognition process [8,40].
III.TOOLS, MATERIALS AND TECHNIQUES
To find out the patterns in data, data mining is very helpful. Data mining can be used as tool to assist the work and it can also assist to make good decisions. Decision tree is one of the good approaches for such assistance. There are number of nodes in decision tree some called roots and other are leaf nodes.
A.NAÏVE BAYES
There is a broad acceptance of Naïve Bayes in classification as well as in training. Naïve Bayes classifier is quick, trouble free and effective. It is good with the data sets having many dimensions. Naive Bayes works on the maximum likelihood of a problem [41]. Mostly the implementation of NB is Pi is the probability that occur in event i, xi will count the occurrence of event I in specific time. Likelihood of observing x is given as [41].
Where in multi-dimensional the equation will be
B.K-NEAREST NEIGHBORS (KNN)
To classify the text K Nearest Neighbor is most commonly used algorithm. K nearest neighbor has good results with many datasets. Method to select points from training sets is alike when it chooses class for new prediction is to choose that points which are very frequent among the class. For this reason it is named as KNN [42]. KNN works as:
C.TOOL
Our tool to analyze data is WEKA [43], which is empower with intelligent set of rules and is written in java. It is open-source software. It is reliable and can work strongly, it is very effective and used for classification problems and for the execution of data for results.
1.INTRODUCTION OF DATA SETS
An important challenge in sensation or feeling detection is to select the record used to create and to analyze the execution of the system. There are three forms of emotional dialogue based system.
- 1.Performance based trained voice database
- 2.Induced database of voice
- 3.Fundamental emotional database.
2.CRITERIA FOR SELECTING A DATABASE:
To choose a suitable database for the investigation is an important factor which effects on the results. The selection of database highly dependent on requirements. We consider some factors while selecting database for experiment. These factors are size of database under organized environment, trustworthiness; emotions according to real feelings, emotions should be categorized and continuous interpretation with time.
3.DESCRIPTION OF IEMOCAP
A database was designed by analysis and explanation laboratory (SAIL) at the South California University, called IEMOCAP. There were ten experts’ five males and five females, their duty to record 5 sessions with different emotions during their communication.
4.EXPERIMENT
Firstly, we will run Naïve Bayes algorithms with four session and then we will repeated these four sessions using K Nearest Neighbors. We will explain results both in the form of table and also in the form of graph. We will consider rate of TP, rate of FP, accuracy, Re, F-Measure, MCC., Receiver Operating Characteristic and PRC area.
IV.NAÏVE BAYES
A.FOR FIRST SESSION
Our experiment involving the first session recorded a total of 343 instances, as summarized in Table I. The table presents the results obtained using the Naïve Bayes algorithm applied to these 343 occurrences. From the analysis, it is evident that the ROC area values range from a highest value of 0.463 to a lowest of 0.048. Similarly, the PRC area values vary, with the highest being 0.09 and the lowest at 0.003. Among the identified classes, sadness emerged as the most prevalent emotional category. Figure 1 further illustrates the dominance of sadness as the primary emotion across the first three sessions. It can be observed that during these sessions, the true positive (TP) and false positive (FP) rates alternate between zero and one. Following this pattern, the emotions shift briefly to neutral before returning to sadness.
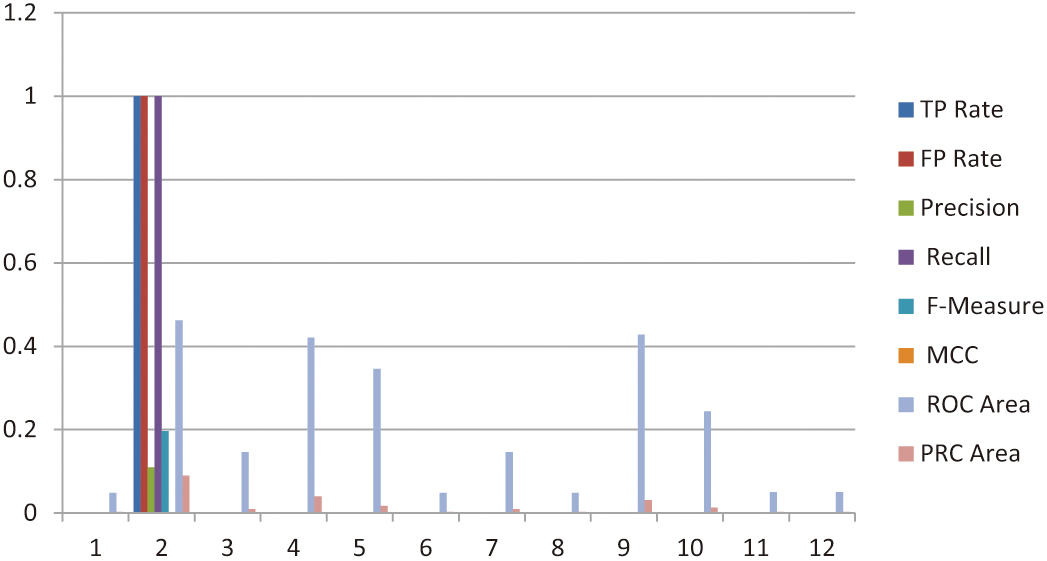 Fig. 1. Represents the sadness and neutral feelings (First Session).
Table I. Naïve Bayes for 343 instances
| Value of TP rate | Value of FP Rae | Value of Pre | Value of Re | Value of F-M | Value of MCC | Value of ROC Area | Value of PRC Area | Classes |
|---|---|---|---|---|---|---|---|---|
| 0 | 0 | 0 | 0 | 0 | 0 | 0.048 | 0.003 | sad |
| 1 | 1 | 0.109 | 1 | 0.196 | 0 | 0.462 | 0.09 | Sadness |
| 0 | 0 | 0 | 0 | 0 | 0 | 0.146 | 0.009 | Sadness; Fear |
| 0 | 0 | 0 | 0 | 0 | 0 | 0.421 | 0.04 | Neutral |
| 0 | 0 | 0 | 0 | 0 | 0 | 0.346 | 0.017 | Sadness |
| 0 | 0 | 0 | 0 | 0 | 0 | 0.048 | 0.003 | tense |
| 0 | 0 | 0 | 0 | 0 | 0 | 0.146 | 0.009 | |
| 0 | 0 | 0 | 0 | 0 | 0 | 0.048 | 0.003 | sad |
| 0 | 0 | 0 | 0 | 0 | 0 | 0.428 | 0.031 | Sadness |
| 0 | 0 | 0 | 0 | 0 | 0 | 0.244 | 0.013 | |
| 0 | 0 | 0 | 0 | 0 | 0 | 0.05 | 0.003 | resigned |
| 0 | 0 | 0 | 0 | 0 | 0 | 0.05 | 0.003 | sad |
B.SECOND SESSION
The second session of the experiment involved 640 instances, with the corresponding results presented in Table II. These results were generated using the Naïve Bayes algorithm applied to the dataset. Analyzing the outcomes, the ROC area values ranged from a maximum of 0.072 to a minimum of 0.049. Similarly, the PRC area values varied, with the highest value recorded at 0.09 and the lowest at 0.002. Among the identified classes, neutral emerged as the most frequently observed emotional state during this session. Figure 2 provides additional insights, highlighting frustration as the most significant emotional sensation detected, followed closely by neutral. These findings illustrate the nuanced shifts in emotional patterns observed during the second session, offering further evidence of the algorithm’s ability to classify and distinguish emotional states within the dataset.
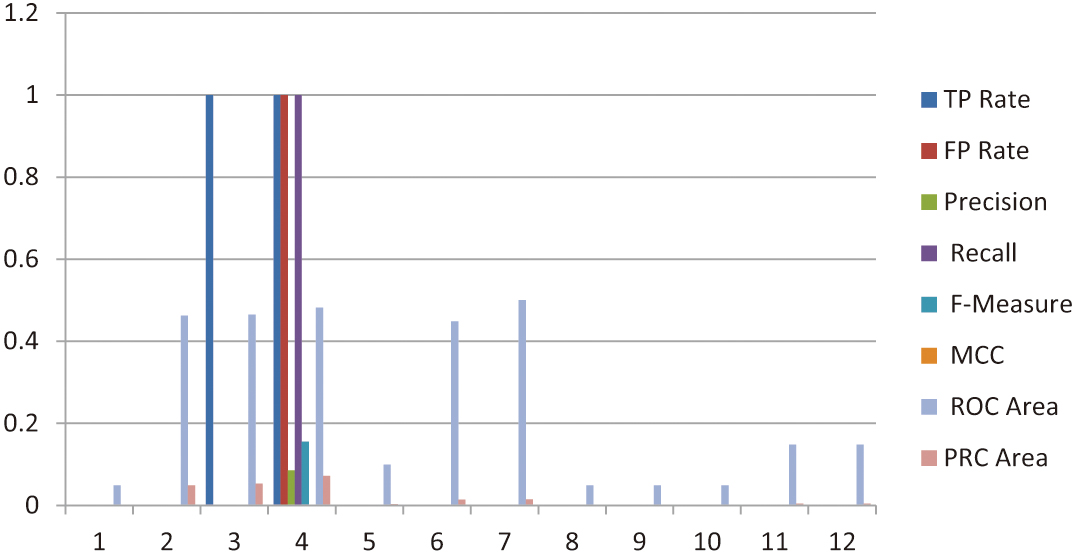 Fig. 2. Represents the sadness and neutral feelings (Second Session).
Table II. Naïve Bayes for 640 instances
| Value of TP | Value of FP | Value of Pre | Value of Re | Value of F-Measure | Value of MCC | Value of ROC Area | Value of PRC Area | Classes |
|---|---|---|---|---|---|---|---|---|
| 0 | 0 | 0 | 0 | 0 | 0 | 0.049 | 0.002 | neutral |
| 0 | 0 | 0 | 0 | 0 | 0 | 0.463 | 0.049 | Frustration |
| 1 | 0 | 0 | 0 | 0 | 0 | 0.465 | 0.053 | neutral |
| 1.000 | 1 | 0.085 | 1 | 0.156 | 0 | 0.482 | 0.072 | neutral |
| 0 | 0 | 0 | 0 | 0 | 0 | 0.099 | 0.003 | neutral |
| 0 | 0 | 0 | 0 | 0 | 0 | 0.449 | 0.014 | |
| 0 | 0 | 0 | 0 | 0 | 0 | 0.5 | 0.015 | |
| 0 | 0 | 0 | 0 | 0 | 0 | 0.049 | 0.002 | |
| 0 | 0 | 0 | 0 | 0 | 0 | 0.049 | 0.002 | |
| 0 | 0 | 0 | 0 | 0 | 0 | 0.049 | 0.002 | neutral |
| 0 | 0 | 0 | 0 | 0 | 0 | 0.148 | 0.004 | neutral |
| 0 | 0 | 0 | 0 | 0 | 0 | 0.148 | 0.004 |
C.THIRD SITTING
The third session of the experiment comprised 604 instances, with the results obtained using the Naïve Bayes algorithm summarized in Table III. The analysis reveals that the PRC area values reached a maximum of 0.05 and a minimum of 0.002. Similarly, the ROC area values also ranged between a highest value of 0.05 and a lowest of 0.002. Among the identified emotional classes, frustration was the most frequently observed category during this session. Figure 3 provides a deeper understanding of the emotional landscape captured in this session. It highlights a mix of emotions, starting with an underlying sense of tension masked by a seemingly pleasant greeting. This is followed by prominent expressions of frustration and anger. These results further underscore the complexity of emotional states detected in the data and demonstrate the algorithm’s ability to identify subtle emotional transitions within the dataset.
 Fig. 3. Represents the sadness and neutral feelings (Third Session).
Table III. Naïve Bayes for 604 instances
| Value of TP Rate | Value of FP Rate | Value of Pr | Value of Re | Value of F-Measure | Value of MCC | Value of ROC Area | Value of PRC Area | Classes |
|---|---|---|---|---|---|---|---|---|
| 0 | 0 | 0 | 0 | 0 | 0 | 0.049 | 0.002 | Frustration |
| 0 | 0 | 0 | 0 | 0 | 0 | 0.484 | 0.05 | anger |
| 0 | 0 | 0 | 0 | 0 | 0 | 0.297 | 0.007 | Frustration |
| 0 | 0 | 0 | 0 | 0 | 0 | 0.414 | 0.019 | Frustration |
| 0 | 0 | 0 | 0 | 0 | 0 | 0.297 | 0.007 | Frustration |
| 0 | 0 | 0 | 0 | 0 | 0 | 0.246 | 0.006 | |
| 0 | 0 | 0 | 0 | 0 | 0 | 0.05 | 0.002 | tense behind the pleasant greeting |
| 0 | 0 | 0 | 0 | 0 | 0 | 0.147 | 0.004 | |
| 0 | 0 | 0 | 0 | 0 | 0 | 0.05 | 0.002 | Frustration |
| 0 | 0 | 0 | 0 | 0 | 0 | 0.05 | 0.002 | |
| 0 | 0 | 0 | 0 | 0 | 0 | 0.049 | 0.002 | annoyed |
| 0 | 0 | 0 | 0 | 0 | 0 | 0.1 | 0.003 |
D.FOURTH SESSION
The fourth session of the experiment included 424 instances, with the results generated using the Naïve Bayes algorithm summarized in Table IV. Analysis of the data reveals that the PRC area values ranged from a maximum of 0.345 to a minimum of 0.048, while the ROC area values varied between a highest value of 0.2 and a lowest of 0.048. Among the detected emotional classes, sadness emerged as the most prevalent category during this session. Figure 4 provides additional insights into the emotional dynamics captured in the fourth session. It highlights a spectrum of emotions, including happiness, sadness, neutrality, and frustration. This variety in emotional states reflects the complexity of the dataset and underscores the effectiveness of the Naïve Bayes algorithm in identifying and classifying distinct emotional patterns. These findings contribute to a broader understanding of the emotional trends observed throughout the experiment.
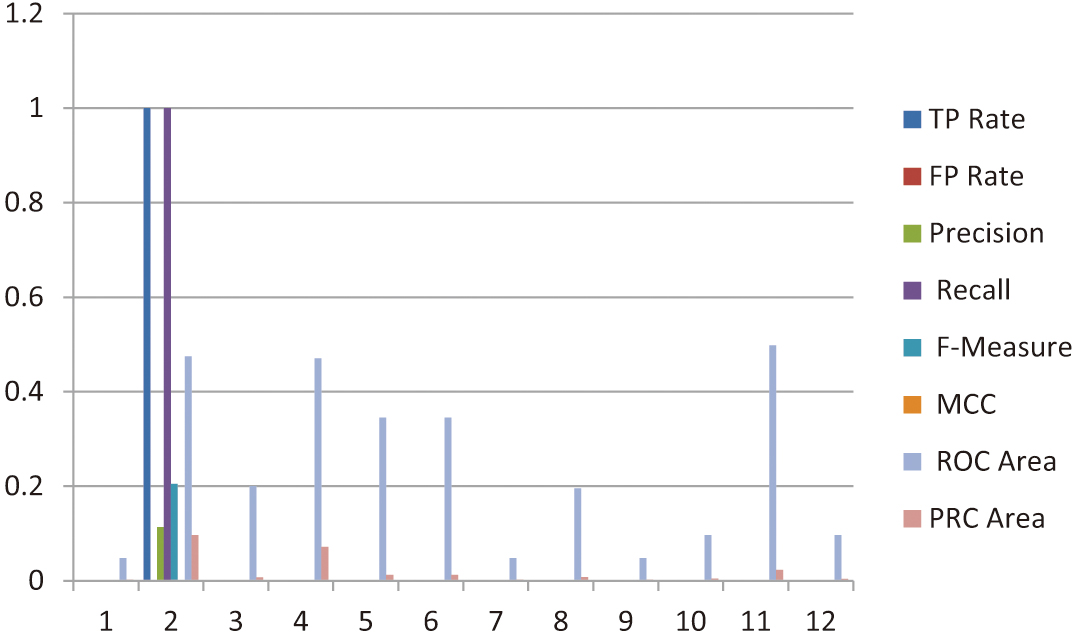 Fig. 4. Represents the sadness and neutral feelings (Fourth Session).
Table IV. Naïve Bayes for 424 instances
| Value of TP Rate | Value of FP Rate | Value of Pre | Value of Re | Value of F-Measure | Value of MCC | Value of ROC Area | Value of PRC Area | Classes |
|---|---|---|---|---|---|---|---|---|
| 0 | 0 | 0 | 0 | 0 | 0 | 0.048 | 0.002 | |
| 1 | 0 | 0.114 | 1 | 0.205 | 0 | 0.475 | 0.097 | Sadness |
| 0 | 0 | 0 | 0 | 0 | 0 | 0.2 | 0.007 | happy |
| 0 | 0 | 0 | 0 | 0 | 0 | 0.471 | 0.072 | Neutral |
| 0 | 0 | 0 | 0 | 0 | 0 | 0.345 | 0.013 | sadness |
| 0 | 0 | 0 | 0 | 0 | 0 | 0.345 | 0.013 | sadness |
| 0 | 0 | 0 | 0 | 0 | 0 | 0.048 | 0.002 | |
| 0 | 0 | 0 | 0 | 0 | 0 | 0.195 | 0.008 | |
| 0 | 0 | 0 | 0 | 0 | 0 | 0.048 | 0.002 | |
| 0 | 0 | 0 | 0 | 0 | 0 | 0.097 | 0.005 | Frustration |
| 0 | 0 | 0 | 0 | 0 | 0 | 0.498 | 0.023 | Sadness |
| 0 | 0 | 0 | 0 | 0 | 0 | 0.097 | 0.004 |
V.K-NEAREST NEIGHBORS (KNN)
In this phase of the study, we analyzed the emotional data collected from all four sessions using the K-Nearest Neighbors (KNN) algorithm. By applying KNN, we aimed to further investigate and classify the emotional states present in the dataset. This approach provided a comparative perspective to evaluate the performance of KNN against other algorithms, such as Naïve Bayes, in detecting and categorizing emotions. The inclusion of all four sessions allowed for a more comprehensive analysis, ensuring that the algorithm accounted for the diverse emotional patterns observed across the sessions. This step not only deepened the understanding of the dataset but also provided valuable insights into the strengths and limitations of KNN for emotion classification.
A.FIRST SESSION
The analysis of the first session, which included 343 instances, was conducted using the K-Nearest Neighbors (KNN) algorithm. The results of this analysis are presented in Table V. Among the identified emotional classes, sadness was the most frequently observed category. The PRC area values ranged from a maximum of 0.04 to a minimum of 0.003, while the ROC area values varied between a highest value of 0.2 and a lowest of 0.048. Figure 5 provides additional insights into the emotional patterns observed in this session. The figure highlights three key emotional sensations: sadness, neutrality, and tension. These findings illustrate the nuanced emotional landscape captured during the session and reflect the ability of the KNN algorithm to effectively classify and differentiate between distinct emotional states within the dataset. This analysis contributes to a deeper understanding of the emotional trends observed in the first session and underscores the importance of utilizing multiple algorithms for robust emotion classification.
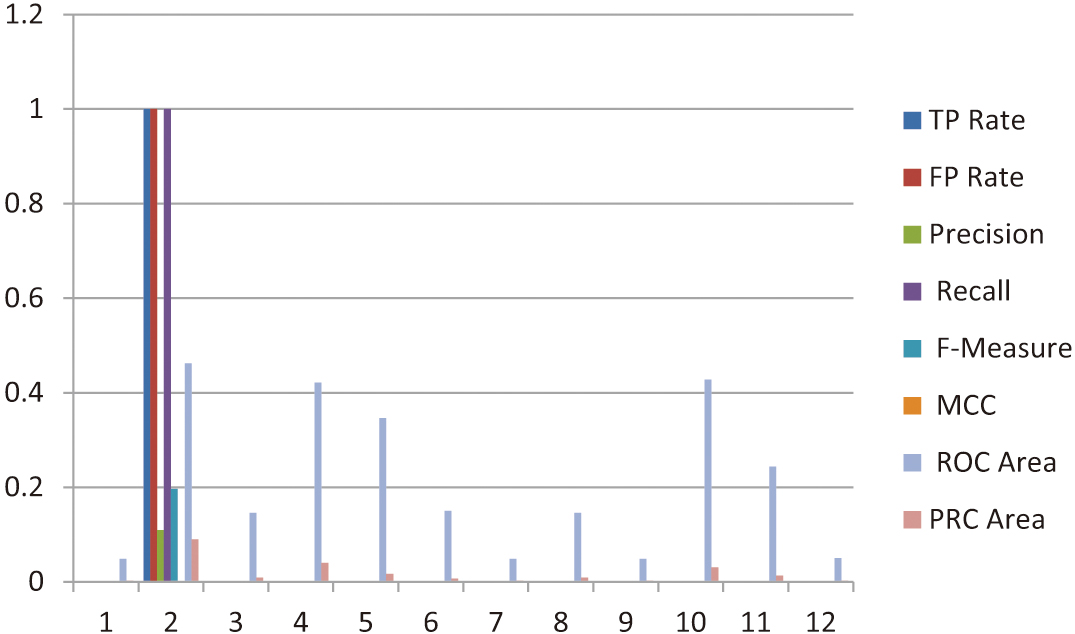 Fig. 5. Represents the sadness, neutral and tense (Fourth Session).
Table V. KNN with 343 instances
| Value of TP Rate | Value of FP Rate | Value of Pre | Value of Re | Value of F-Measure | Value of MCC | Value of ROC Area | Value of PRC Area | Classes |
|---|---|---|---|---|---|---|---|---|
| 0 | 0 | 0 | 0 | 0 | 0 | 0.048 | 0.003 | sad |
| 1 | 1 | 0.109 | 1 | 0.196 | 0 | 0.462 | 0.09 | Sadness |
| 0 | 0 | 0 | 0 | 0 | 0 | 0.146 | 0.009 | Sadness |
| 0 | 0 | 0 | 0 | 0 | 0 | 0.421 | 0.04 | Neutral |
| 0 | 0 | 0 | 0 | 0 | 0 | 0.346 | 0.017 | sadness |
| 0 | 0 | 0 | 0 | 0 | 0 | 0.15 | 0.007 | sadness |
| 0 | 0 | 0 | 0 | 0 | 0 | 0.048 | 0.003 | tense |
| 0 | 0 | 0 | 0 | 0 | 0 | 0.146 | 0.009 | |
| 0 | 0 | 0 | 0 | 0 | 0 | 0.048 | 0.003 | |
| 0 | 0 | 0 | 0 | 0 | 0 | 0.428 | 0.031 | Sadness |
| 0 | 0 | 0 | 0 | 0 | 0 | 0.244 | 0.013 | Sadness |
| 0 | 0 | 0 | 0 | 0 | 0 | 0.05 | 0.003 |
B.SECOND SESSION
The third session of the experiment consisted of 640 instances, with the results obtained using the K-Nearest Neighbors (KNN) algorithm summarized in Table VI. Among the identified emotional classes, neutral emerged as the most frequently observed emotion during this session. The PRC area values ranged from a maximum of 0.053 to a minimum of 0.002, while the ROC area values varied between a highest value of 0.5 and a lowest of 0.049. The emotional patterns captured in this session are further illustrated in the accompanying chart, which highlights the prevalence of three key emotional states: neutrality, sadness, and frustration. These results demonstrate the diversity of emotions detected within the dataset and underscore the effectiveness of the KNN algorithm in classifying these emotional states. This analysis provides valuable insights into the emotional dynamics of the third session and adds to the broader understanding of the dataset (see Fig. 6), showcasing the importance of advanced classification algorithms like KNN for identifying and distinguishing between complex emotional trends.
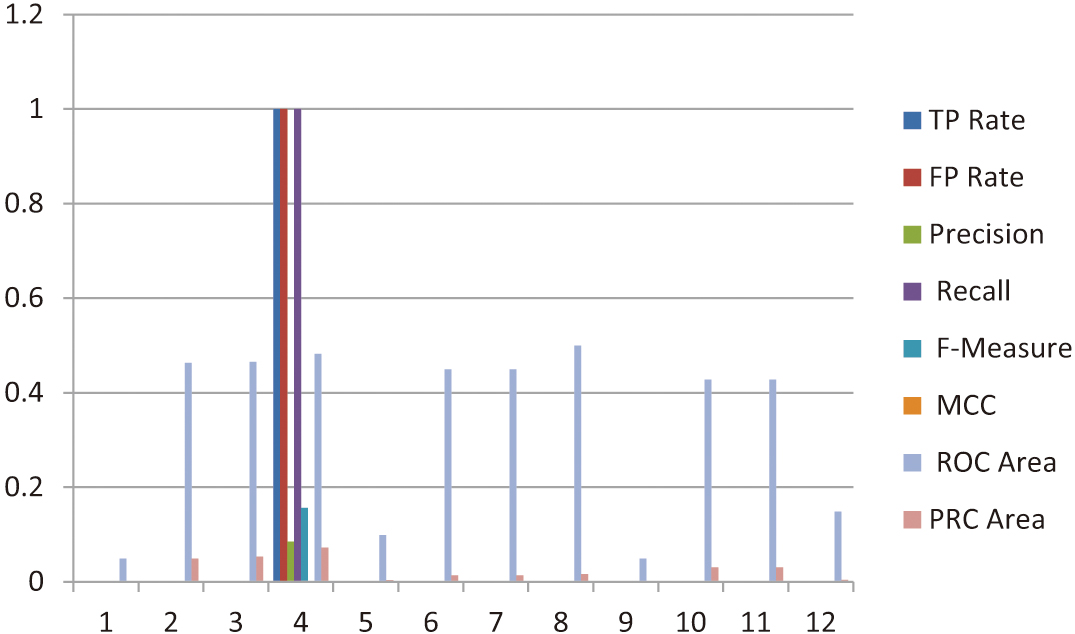 Fig. 6. Represents the sadness, neutral and tense (Fourth Session).
Table VI. KNN with 640 instances
| Value of TP Rate | Value of FP Rate | Value of Precision | Value of Recall | Value of F-Measure | Value of MCC | Value of ROC Area | Value of PRC Area | Classes |
|---|---|---|---|---|---|---|---|---|
| 0 | 0 | 0 | 0 | 0 | 0 | 0.049 | 0.002 | Neutral |
| 0 | 0 | 0 | 0 | 0 | 0 | 0.463 | 0.049 | Frustration |
| 0 | 0 | 0 | 0 | 0 | 0 | 0.465 | 0.053 | Neutral |
| 1 | 1 | 0.085 | 1 | 0.156 | 0 | 0.482 | 0.072 | Neutral |
| 0 | 0 | 0 | 0 | 0 | 0 | 0.099 | 0.003 | Neutral |
| 0 | 0 | 0 | 0 | 0 | 0 | 0.449 | 0.014 | |
| 0 | 0 | 0 | 0 | 0 | 0 | 0.449 | 0.014 | |
| 0 | 0 | 0 | 0 | 0 | 0 | 0.5 | 0.016 | |
| 0 | 0 | 0 | 0 | 0 | 0 | 0.049 | 0.002 | |
| 0 | 0 | 0 | 0 | 0 | 0 | 0.428 | 0.031 | Sadness |
| 0 | 0 | 0 | 0 | 0 | 0 | 0.428 | 0.031 | Neutral |
| 0 | 0 | 0 | 0 | 0 | 0 | 0.148 | 0.004 | Neutral |
C.THIRD SESSION
The third session of the experiment included 604 instances, with the results of the K-Nearest Neighbors (KNN) algorithm summarized in Table VII. Among the observed emotional classes, frustration emerged as the most frequently occurring emotion during this session. The analysis revealed that the ROC area values ranged from a maximum of 0.48 to a minimum of 0.049. Similarly, the PRC area values varied, with the highest recorded value at 0.05 and the lowest at 0.002 as presented in Fig. 7. The emotional patterns identified in this session are further illustrated in the accompanying chart, which highlights the presence of multiple emotions, including frustration, anger, greetings, and sadness. This diversity in emotional states reflects the complexity of the dataset and demonstrates the capability of the KNN algorithm to effectively classify a wide range of emotions. This analysis of the third session provides valuable insights into the emotional variability within the data and reinforces the significance of utilizing advanced classification algorithms for understanding nuanced emotional trends across sessions.
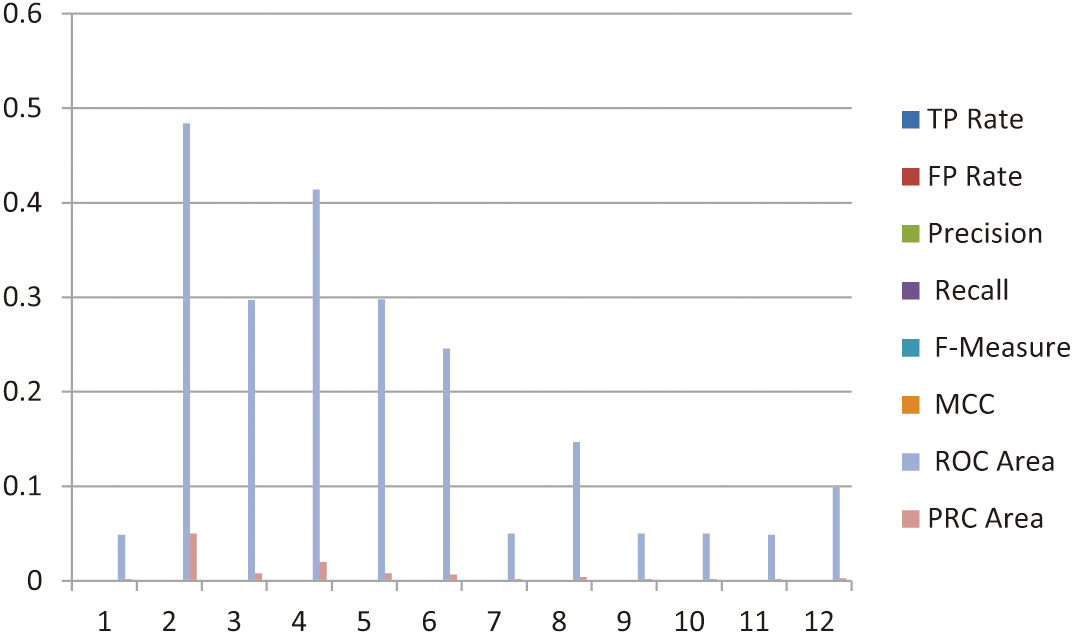 Fig. 7. Represents the sadness, neutral and tense (Fourth Session).
Table VII. KNN with 604 instances
| Value of TP Rate | Value of FP Rate | Value of Pre | Value of Re | Value of F-Measure | Value of MCC | Value of ROC Area | Value of PRC Area | Classes |
|---|---|---|---|---|---|---|---|---|
| 0 | 0 | 0 | 0 | 0 | 0 | 0.049 | 0.002 | Frustration |
| 0 | 0 | 0 | 0 | 0 | 0 | 0.484 | 0.05 | anger |
| 0 | 0 | 0 | 0 | 0 | 0 | 0.297 | 0.008 | Frustration |
| 0 | 0 | 0 | 0 | 0 | 0 | 0.414 | 0.02 | Neutral |
| 0 | 0 | 0 | 0 | 0 | 0 | 0.298 | 0.008 | Frustration |
| 0 | 0 | 0 | 0 | 0 | 0 | 0.246 | 0.007 | |
| 0 | 0 | 0 | 0 | 0 | 0 | 0.05 | 0.002 | greeting |
| 0 | 0 | 0 | 0 | 0 | 0 | 0.147 | 0.004 | |
| 0 | 0 | 0 | 0 | 0 | 0 | 0.05 | 0.002 | |
| 0 | 0 | 0 | 0 | 0 | 0 | 0.05 | 0.002 | Sadness |
| 0 | 0 | 0 | 0 | 0 | 0 | 0.049 | 0.002 | irritated |
| 0 | 0 | 0 | 0 | 0 | 0 | 0.1 | 0.003 |
D.FOURTH SESSION
The fourth session of the experiment comprised 424 instances, with the results of the K-Nearest Neighbors (KNN) algorithm summarized in Table VIII. Among the observed emotional classes, frustration and sadness were the most frequently identified categories in this session. The analysis revealed that the ROC area values ranged from a maximum of 0.49 to a minimum of 0.048, while the PRC area values varied, with the highest recorded at 0.072 and the lowest at 0.002. The emotional trends observed during this session are further illustrated in the corresponding chart, which highlights the prevalence of several key emotions, including frustration, irritation, sadness, and happiness. These results underscore the diversity and complexity of the emotional patterns present in the dataset, reflecting the nuanced emotional states captured during this session. This detailed analysis of the fourth session contributes to a broader understanding of the dataset and demonstrates the capability of the KNN algorithm to effectively classify and distinguish a wide range of emotional states. These findings also emphasize the importance of employing advanced machine learning techniques for accurate emotion classification in similar studies (see Fig. 8).
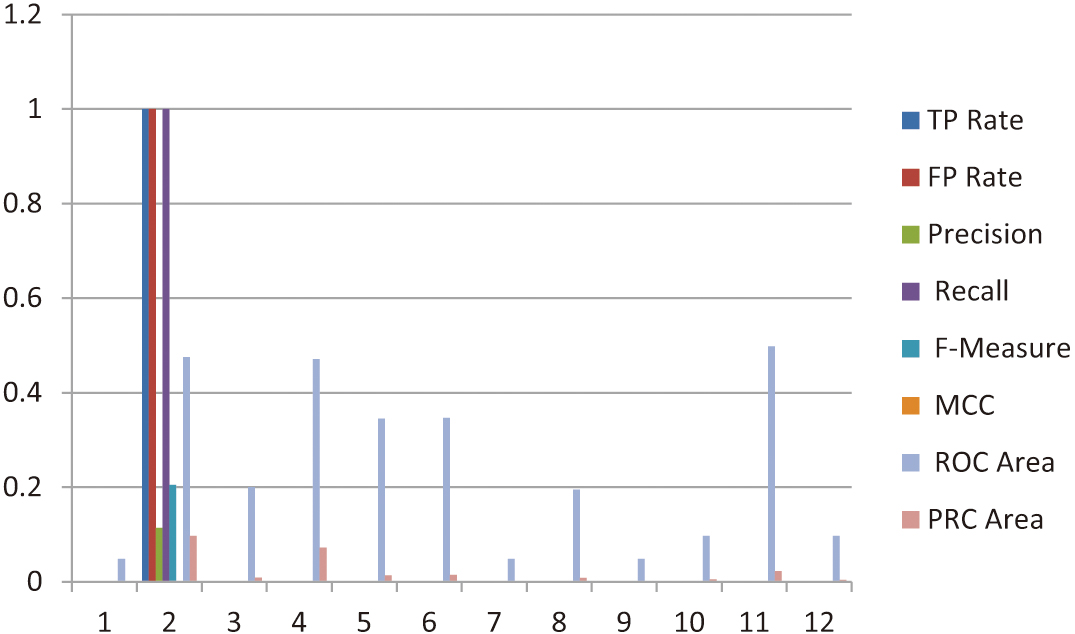 Fig. 8. Represents the sadness, neutral and tense (Fourth Session).
Table VIII. KNN with 424 instances
| Value of TP Rate | Value of FP Rate | Value of Pr | Value of Re | Value of F-Measure | Value of MCC | Value of ROC Area | Value of PRC Area | Classes |
|---|---|---|---|---|---|---|---|---|
| 0 | 0 | 0 | 0 | 0 | 0 | 0.048 | 0.002 | Frustration |
| 1 | 1 | 0.114 | 1 | 0.205 | 0 | 0.475 | 0.097 | Sadness |
| 0 | 0 | 0 | 0 | 0 | 0 | 0.2 | 0.009 | hapiness |
| 0 | 0 | 0 | 0 | 0 | 0 | 0.471 | 0.072 | Neutral |
| 0 | 0 | 0 | 0 | 0 | 0 | 0.345 | 0.014 | Sadness |
| 0 | 0 | 0 | 0 | 0 | 0 | 0.347 | 0.015 | |
| 0 | 0 | 0 | 0 | 0 | 0 | 0.048 | 0.002 | |
| 0 | 0 | 0 | 0 | 0 | 0 | 0.195 | 0.008 | |
| 0 | 0 | 0 | 0 | 0 | 0 | 0.048 | 0.002 | |
| 0 | 0 | 0 | 0 | 0 | 0 | 0.097 | 0.005 | Frustration |
| 0 | 0 | 0 | 0 | 0 | 0 | 0.498 | 0.023 | irritated |
| 0 | 0 | 0 | 0 | 0 | 0 | 0.097 | 0.004 |
VI.DISCUSSION
The dataset in question contains eight distinct emotions, which is significantly greater in variety than what is commonly available in existing emotion classification studies. Classifying emotions based solely on speech data remains a challenging task due to the complexity of vocal expressions and their subtle nuances. To enhance model performance and improve generalizability, it is a common practice to merge multiple datasets into a larger and more robust one. However, this study adopts a distinct approach by focusing specifically on the classification of these eight emotions within the dataset, aiming to produce actionable and meaningful results. One of the most demanding aspects of this research was leveraging this extensive dataset to train a model capable of effectively performing the classification task for all eight emotions. While reducing the number of emotions in the classification task might yield better performance metrics [44], it posed a significant challenge to preserve the diversity of emotional states while ensuring accurate categorization. The complexity of distinguishing between these emotions and developing a model capable of addressing such granularity was a core obstacle.
A critical concern during the study was the risk that the model, even if it performed reasonably well without data augmentation, might fail to converge adequately. Such a failure could potentially lead to suboptimal outcomes on the test dataset. As mentioned earlier, the creation of a more comprehensive dataset combined with the application of state-of-the-art models is generally recommended for achieving improved results. Surprisingly, despite utilizing a relatively simple model, the results we obtained were promising. These findings underscore the potential of streamlined models to achieve meaningful outcomes, even within the constraints of a limited dataset. The insights from this study pave the way for future research to explore data augmentation techniques and advanced methodologies, enabling more refined and accurate emotion classification systems.
VII.CONCLUSION
We applied two different algorithms with five different sessions with varying number of instances and then we calculate Value of True positive rate, Value of False positive rate, Value of Precision, Value of Recall, and Value of F-measure, Value of MCC, Value of ROC area and Value of PRC area. The emotions detected by WEKA are Neutral, happy, irritated, sad, and frustrated and anger. Our work explains more than basic emotions. For example by using these data sets we also found frustration and irritation. Our paper proposed an approach based on algorithms to detect emotions which are helpful in many fields.
VIII.LIMITATION AND FUTURE
We use two algorithms but in future number of algorithms and also sessions can be analyzed to find better results. In future more complex emotions can be detected by the machine. This analysis of emotions can be implemented in business to make good customer relationship and to observe the success of product in the market. It can also be applied on how emotions can influence the decision of managers and also how these emotions can influence the work performance of employees in the industry.