I.INTRODUCTION
The number of patients with diabetes has shown a significant growth trend worldwide. According to the latest data released by the International Diabetes Federation (IDF), the number of patients with diabetes in adults aged 20–79 years worldwide reached 589 million in 2024. Therefore, it is urgent to propose an effective treatment for diabetes [1]. However, modern medical drugs in the treatment of diabetic cardiomyopathy are often accompanied by major side effects, such as liver and kidney function damage, cardiovascular event risk, and so on, which limits their clinical use. Traditional Chinese medicine (TCM) compounds can regulate multiple pathological links at the same time, such as anti-oxidation, anti-inflammation, and immune regulation, through the action mechanism of too many targets and multiple pathways, so as to comprehensively improve the pathological state of diabetic patients. And compared with modern medical drugs, TCM usually has less side effects and is more suitable for long-term treatment [2]. Medication patterns refer to the specific way in which patients use drugs during treatment. This includes the name and category of the specific drug used, the change of the initial dose of the drug, the total duration of medication, and whether to use other drugs at the same time. The medication law refers to the common characteristics or trends summarized through the data analysis of a large number of patients’ medication patterns. For example, the combined use of high-frequency drugs in disease treatment, the change of drug dose over time, and the concomitant drugs that must be used for the disease. In the treatment of patients with diabetic cardiomyopathy, the analysis of the pattern of TCM medication can ensure the efficacy and safety of drugs. This application can reduce the adverse effects of irregular medication use on patients, improve the utilization of medical resources, and reduce the risk of patient treatment [3]. There are many scholars who have studied the medication pattern analysis models. However, these models need to be optimized due to the large data size and high dimensionality of the medication law analysis and also have the disadvantages of low analysis accuracy and high error [4]. Deep reinforcement learning (DRL) is a machine learning algorithm in the field of artificial intelligence that combines deep learning and reinforcement learning [5]. The algorithm is capable of handling large-scale data, high-dimensional data, and data uncertainty. However, the algorithm analyzes the data with a large number of features and attributes, which leads to a substantial increase in the spatial state of the DRL during the analysis. This reduces the computational and storage efficiency and thus adversely affects the computational results as well. The K-means clustering (K-means) algorithm is an artificial intelligence learning algorithm that can partition large-scale data. By analyzing each class of data sequentially, the spatial state of data can be reduced and the computational speed can be increased [6]. Therefore, this research uses the K-means algorithm to optimize DRL and proposes a K-means-DRL algorithm. This algorithm is also used to construct a model for analyzing the medication pattern of diabetic cardiomyopathy in order to improve the accuracy of the analysis through the model so as to reduce the waste of resources and accelerate the speed of patients’ recovery. The innovation of the study is that the K-means-DRL analysis model first uses the K-means algorithm to classify the data of various medication data of diabetic cardiomyopathy patients according to the dosage or medicinal properties. Then the classified data are analyzed by DRL for different types of data. Finally, the medication pattern of diabetic cardiomyopathy is obtained based on the results.
The rest of the paper is organized as follows. The second section discusses the related research on the analysis model of medication law. The content of the third section is the construction of the analysis model of TCM medication law based on K-means-DRL model. The fourth section is to test the actual effect of the model proposed in the study. The fifth part is a comparative discussion of this study and previous studies, as well as a summary of the whole study.
II.RELATED WORKS
To analyze the medication patterns of various diseases, many scholars have used different analytical models to do so. Zghaibeh et al. designed an analytical model about investment cost, net profit, and standardized hydrogen energy cost in order to analyze the economic benefits of green hydrogen production technology in photovoltaic power plants. This analytical model was used to test the model in a real situation, and the results showed that the accuracy of the model in analyzing the economic benefits reached 89.7% [7]. McNeish et al. proposed a dynamic fit index analysis model based on factor analysis to address the problem that the fit assessment in some current mathematical fitting models is affected by various fit indices. The model was used for mathematical fitting model assessment for experiments. The results showed that the model was able to accurately analyze the weights of different fitting indices [8]. In addition, to analyze the implementation of relevant learning policies introduced by the government during the epidemic, Suryana et al. proposed an analytical model for improvement-oriented evaluation. A comparative experiment was conducted to compare this model with the traditional analytical model. The results indicated that the analysis of the model took 2.3 s less time [9]. Aiming at the problem that the current analytical model was poor in analyzing the change in temperature of the box solar cooker’s sensible heat storage medium over time, Verma et al. proposed an analytical model based on the sinusoidal function of the driving parameter of the system. The analytical model was used in real situations for testing. The results showed that the model analyzed the temperature variation of the solar cooker with an accuracy of 90.6% [10].
DRL algorithms are widely used in a variety of models due to their adaptability, their ability to handle highly complex problems, and their ability to improve the quality and efficiency of decision-making [11]. Wurman et al. designed a training model based on the DRL method in order to learn and train the driving techniques and tactical maneuvers of drivers in a racing game. The model was used in real situations for testing. The results showed that the model was able to learn the driver’s driving techniques and tactical maneuvers in only 3.2 s [12]. In addition, Mankowitz et al. designed an optimized sorting model based on the DRL method to address the slow speed of sorting as well as hashing algorithms for data analysis. The model was compared with the pre-optimization sorting model for experiments. The results indicated that the DRL-optimized sorting model increased the speed of data analysis and sorting by 12.7% [13]. The K-means algorithm is a data analysis algorithm. This algorithm is also widely used in various fields due to its computational simplicity and fast convergence [14]. For example, Ikotun et al. designed a large-scale data collection framework based on the K-means algorithm to address the complexity of data collection in the era of big data. The framework was used in real-world situations for testing. The results showed that the method achieved a collection speed of 6.8 bps for various data [15].
In summary, it can be concluded that although many scholars have studied the analytical models, these analytical models still have the problems of slow analysis speed, low accuracy, and high consumption of computational resources, which still need to be optimized. Therefore, this research combines the K-means algorithm with DRL to construct an analytical model. The computational resources are optimized by the K-means algorithm in the model, and the model analysis accuracy can be improved by DRL. Then the model is used in the analysis of the medication pattern of diabetic cardiomyopathy in order to improve the accuracy of the analysis and thus improve the medical resource utilization.
III.K-MEANS-DRL-BASED MEDICATION PATTERN ANALYSIS
A.DRLs COMBINED WITH DATA ANALYSIS
Diabetic cardiomyopathy is a myocardial disease that occurs in diabetic patients and cannot be explained by other cardiac pathologies [16,17]. There are many TCM treatments for diabetic cardiomyopathy. The use of artificial intelligence methods to analyze the medication patterns of these treatments can reduce the adverse effects of medication. It can also save medical resources by avoiding drug wastage through rational drug administration [18,19]. However, many of the current analysis models have low accuracy for drug dosage analysis and need to be optimized [20]. DRL algorithm can improve its performance by connecting deep learning and reinforcement learning [21]. The specific flow of this algorithm is shown in Fig. 1.
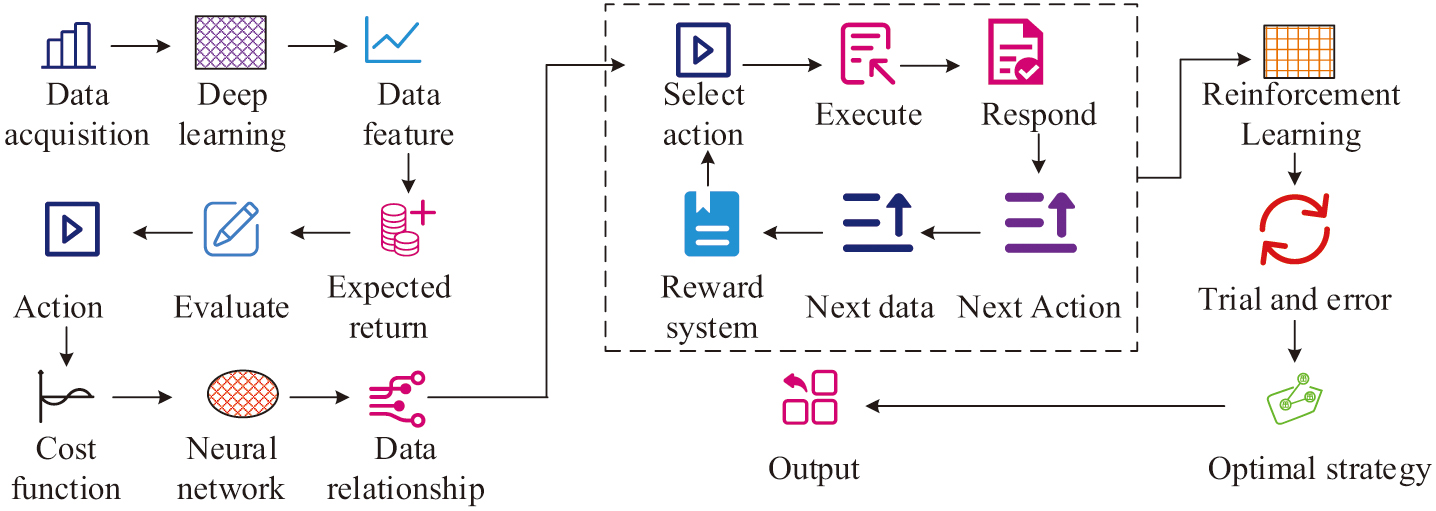
In Fig. 1, DRL first needs to acquire high-dimensional observation data and utilize the powerful perceptual ability of deep learning to perceive the specific feature representation of the acquired data. Then it evaluates the value function of each action based on the expected return. Moreover, the relationship between the state and the action is fitted by the neural network in deep learning, and the DRL then selects an action to execute based on the strategy. The surrounding environment reacts to the action and gives the next observation data and reward mechanism based on the action. The execution of the above action repeats until the given condition is satisfied. The DRL then updates the initial strategy based on all the feedback results obtained after the execution of the action. The above process is repeated continuously with trial and error until the DRL algorithm is able to learn the optimal solution to achieve the goal. In this process, the data state value function is calculated as shown in Equation (1):
In Equation (1), is the value function of the strategy in the current state . is the immediate reward obtained after taking the action. is the discount factor. is the value function of the next action state and the expected value. The data action value function is calculated as shown in Equation (2):
In Equation (2), denotes the action value function. denotes the reward received after taking an action. denotes the optimal action taken in the next state . Whereas, when performing strategy iteration, the optimal strategy is found by calculating the optimal value function. The calculation is shown in Equation (3):
In Equation (3), represents the optimal value function. represents the optimal action value function. is calculated as shown in Equation (4):
However, in practical application, DRL algorithm leads to the increase of spatial states due to more features and attributes of data states. This improves the difficulty of computation and data storage, which affects the analysis results [22,23]. The K-means algorithm is a data clustering analysis algorithm for iterative solving [24]. This algorithm is able to divide the state space into different clusters by K-means, and by learning each cluster, it will reduce the amount of computation and improve the learning efficiency [25]. The basic flow of the K-means algorithm is shown in Fig. 2.
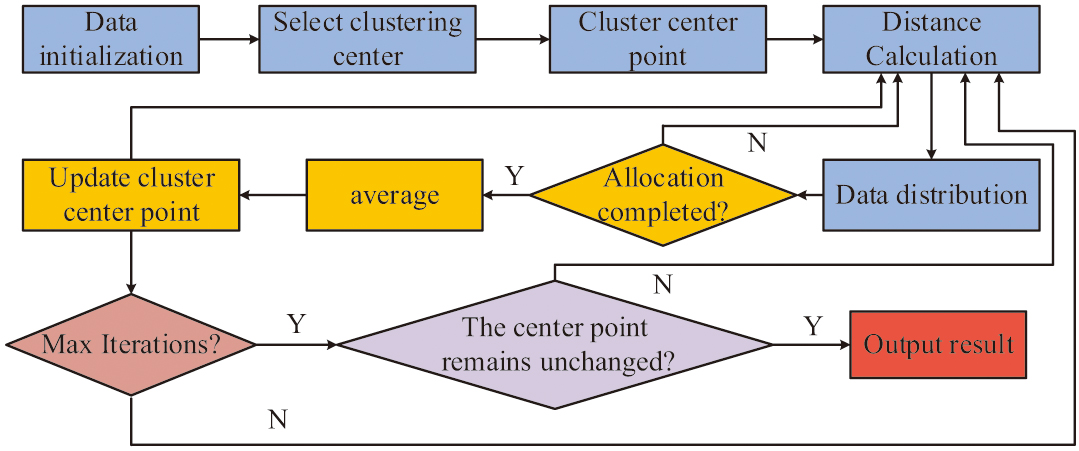 Fig. 2. Flowchart of the K-means algorithm.
In Fig. 2, the K-means algorithm first requires initialization of the data. K data points are selected as initial cluster centroids in the collected data. Then the distance of each data point from the center point of each cluster is calculated, and the data points are assigned to the cluster with the closest distance to it. After the data is assigned, the average value of all data points in each cluster is calculated. The calculated value is used as the new cluster center point. The above steps are repeated until the maximum number of iterations is reached or the cluster centroids no longer change. Finally, the clustering results are output to obtain the cluster label of each data point and complete the data clustering. In this regard, the calculation of the clustering center selection is shown in Equation (5):
In Equation (5), denotes the th clustering center. The distance for data point assignment is calculated using Euclidean distance. It is calculated as shown in Equation (6):
In Equation (6), represents the dimension of the data points. represents the data in the clustering center of the first class of data. represents the clustering center of the first class of data. The data points are assigned in the way as shown in Equation (7):
In Equation (7), denotes the data assigned to the cluster center. The cluster center position, that is, the cluster centroid position, is calculated as shown in Equation (8):
In Equation (8), represents the number of data points contained in the clustering center . represents the sum of data points contained in all clustering centers. The above calculations are used to distribute the collected data into different clusters to reduce the computational effort of datasets. The DRL algorithm is optimized using the K-means algorithm. The data points are assigned to different clusters through data point allocation, cluster centroid update, and iteration in the K-means algorithm as a way to reduce the subsequent computational complexity. DRL is then used to analyze the allocated data to reduce the data storage space and improve the calculation speed. The process is shown in Fig. 3.
B.K-MEANS-DRL-BASED MODEL FOR ANALYZING MEDICATION PATTERNS
To solve the problem of inaccurate analysis of drug dosage in the current medication analysis model, this study constructs a medication law analysis model using the K-means-DRL algorithm mentioned in the previous section to analyze the dosage and taking pattern of various drugs. The basic framework of the medication pattern analysis model based on the K-means-DRL algorithm is shown in Fig. 4.
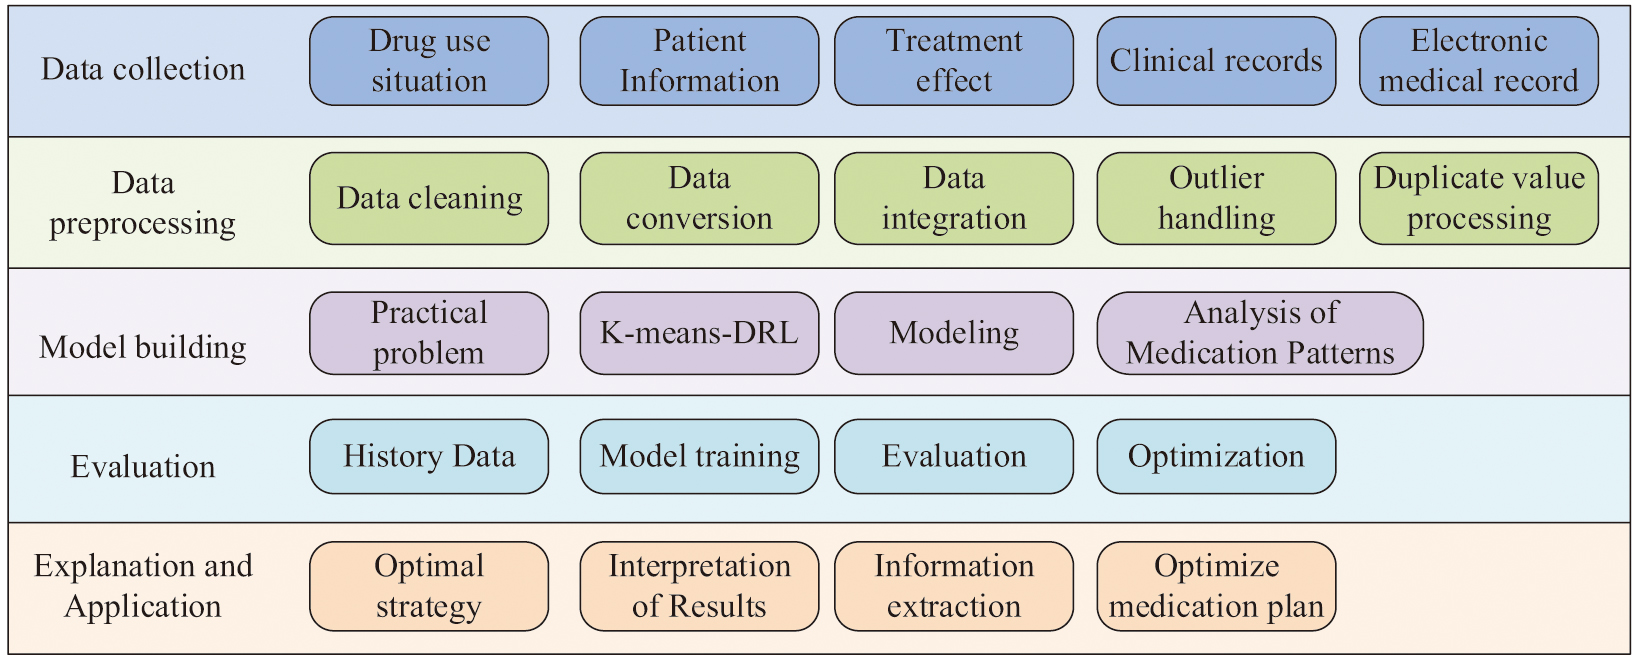 Fig. 4. K-means-DRL medication pattern analysis model.
In Fig. 4, the model consists of five parts: data collection, data preprocessing, model construction, model evaluation, and result interpretation and application. In the data collection section, medication information such as drug use, patient information, patient treatment status, and treatment effects needs to be collected. These data generally come from patients’ clinical records, electronic medical records, and drug management systems. In the data preprocessing section, the collected data are clarified, transformed, and integrated to ensure the accuracy and consistency of the data. Duplicates in the data are removed, and outliers are handled. Afterward, a suitable model is selected for modeling based on the actual solution problem. In this study, the K-means-DRL algorithm is used to construct an analytical model to analyze the dosage and taking pattern of drugs. Then the constructed model is evaluated using historical data to verify the accuracy and reliability of the model, and the model is optimized and adjusted. Finally, the optimal strategy obtained from the analytical model is interpreted, and useful information is extracted to optimize the medication regimen and improve the therapeutic effect. In this process, for the determination of the content of the raw drug, the direct titration method is used. Its calculation formula is shown in Equation (9):
In Equation (9), represents the volume of titrant consumed for titration. T represents the degree of titration. T represents the concentration correction factor of the titrant. W represents the weighed volume of the pharmaceutical agent specimen. The content determination of the pharmaceutical drug uses the experimental violet spectrophotometric method for calculation. The formula is shown in Equation (10).
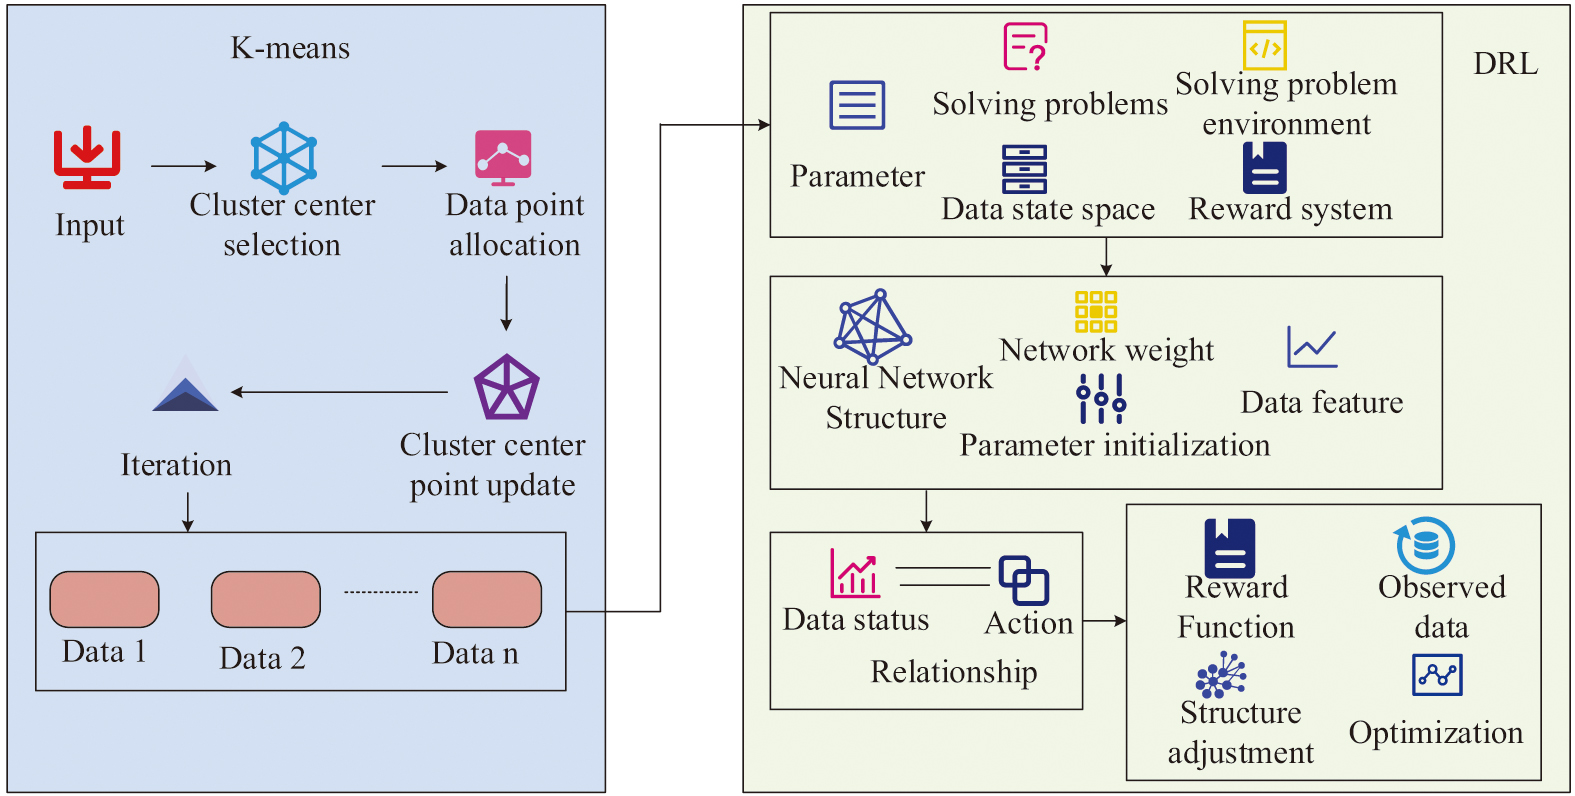
In Equation (10), represents the concentration of the pharmaceutical reagent solution. represents the absorbance of the agent test solution. represents the absorbance of the control solution. represents the concentration of the control solution. The compositional content and dosage content of different drugs are obtained by the above calculations. In this medication analysis model, the principle of using K-means-DRL algorithm is shown in Fig. 5.
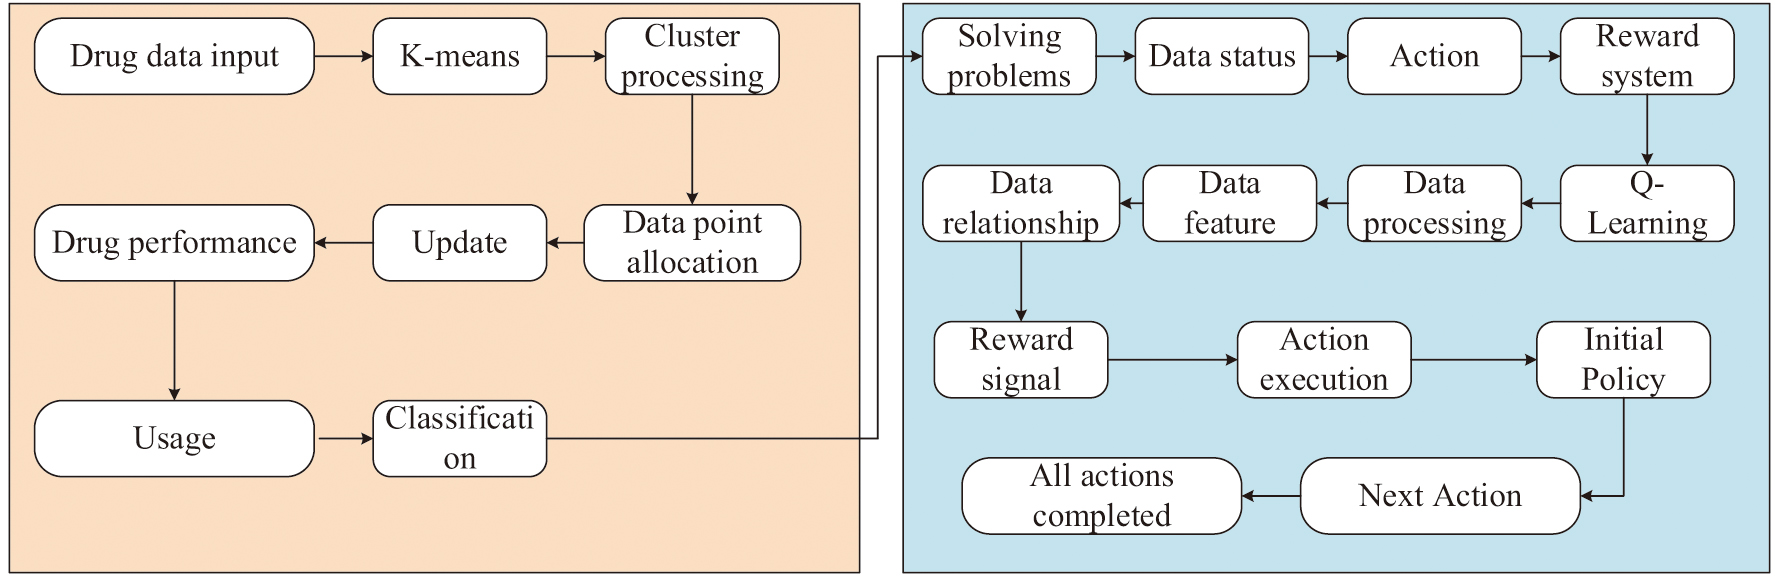 Fig. 5. K-means-DRL application principle.
In Fig. 5, in the medication analysis model, the K-means-DRL module receives the incoming various medication data. The various data are first processed into clusters in the K-means module. That is, the collected medication data are divided into different clusters based on drug properties or medication time through operations such as data point assignment and cluster center point update. After all the medication data are assigned, these assigned clusters are entered into the DRL module. In this module, the problem to be solved, that is, analyzing the medication pattern of drugs, is first entered. Then the states, actions, and reward mechanisms of DRL are defined. Then the appropriate learning algorithm is selected according to the actual situation. Since this research is about the analysis of drug medication patterns and the medication scenarios are complex, the Q-Learning algorithm, which can learn the optimal strategy in different scenarios, is chosen for model construction. The algorithm is used to process the complex data and represent the characteristics of the data and the relationship between them. Then a data action is randomly executed according to the initial strategy. The surroundings return a reward signal as well as observational data based on that action, and the next action is performed based on the returned reward signal. The process is repeated until all medication data actions are completed. In this process, the Q-value in the Q-Learning algorithm is updated by the formula shown in Equation (11):
In Equation (11), represents the expected return of action taken under state . represents the learning rate. represents the immediate payoff of action taken under state . represents the maximum expected return of a different action taken under the new state . The medication analysis model is used to analyze the medication pattern in the treatment of diabetic cardiomyopathy. The model is used to analyze the dosing pattern of the disease so as to ensure the efficacy and safety of the drugs, reduce the side effects of the drugs, improve the therapeutic effect, and promote the health of the patients.
IV.EMPIRICAL ANALYSIS OF K-MEANS-DRL ANALYTICAL MODELS
A.PERFORMANCE ANALYSIS OF THE K-MEANS-DRL ALGORITHM
To analyze the predictive superiority of the proposed K-means-DRL algorithm, comparative experiments are conducted between the K-means-DRL algorithm and backpropagation algorithm long short-term memory (BP-LSTM), least squares adaptation support vector machine (LS-SVM) algorithm, and sparrow search algorithm variational mode decomposition (SSA-VMD) algorithm. The environmental configuration during the experiment is shown in Table I.
Table I. Experimental environment configuration
| Experimental environment | Index | Style |
|---|---|---|
| Hardware environment | CPU | Intel Core i9 |
| EMS memory | 64GB DDR4 3200MHz | |
| Software environment | OS | Windows 10 |
| Python edition | Python 4.0 | |
| Python environment | Anaconda 3 |
For the experiments, the Iris dataset is chosen for the experiments. The Iris dataset contains 150 pieces of data, with a total of 50 pieces of data, each of which contains four features. The prediction performance of the four algorithms is analyzed using the above experimental environment and dataset. The prediction accuracy of the four algorithms is analyzed. The results are shown in Fig. 6.
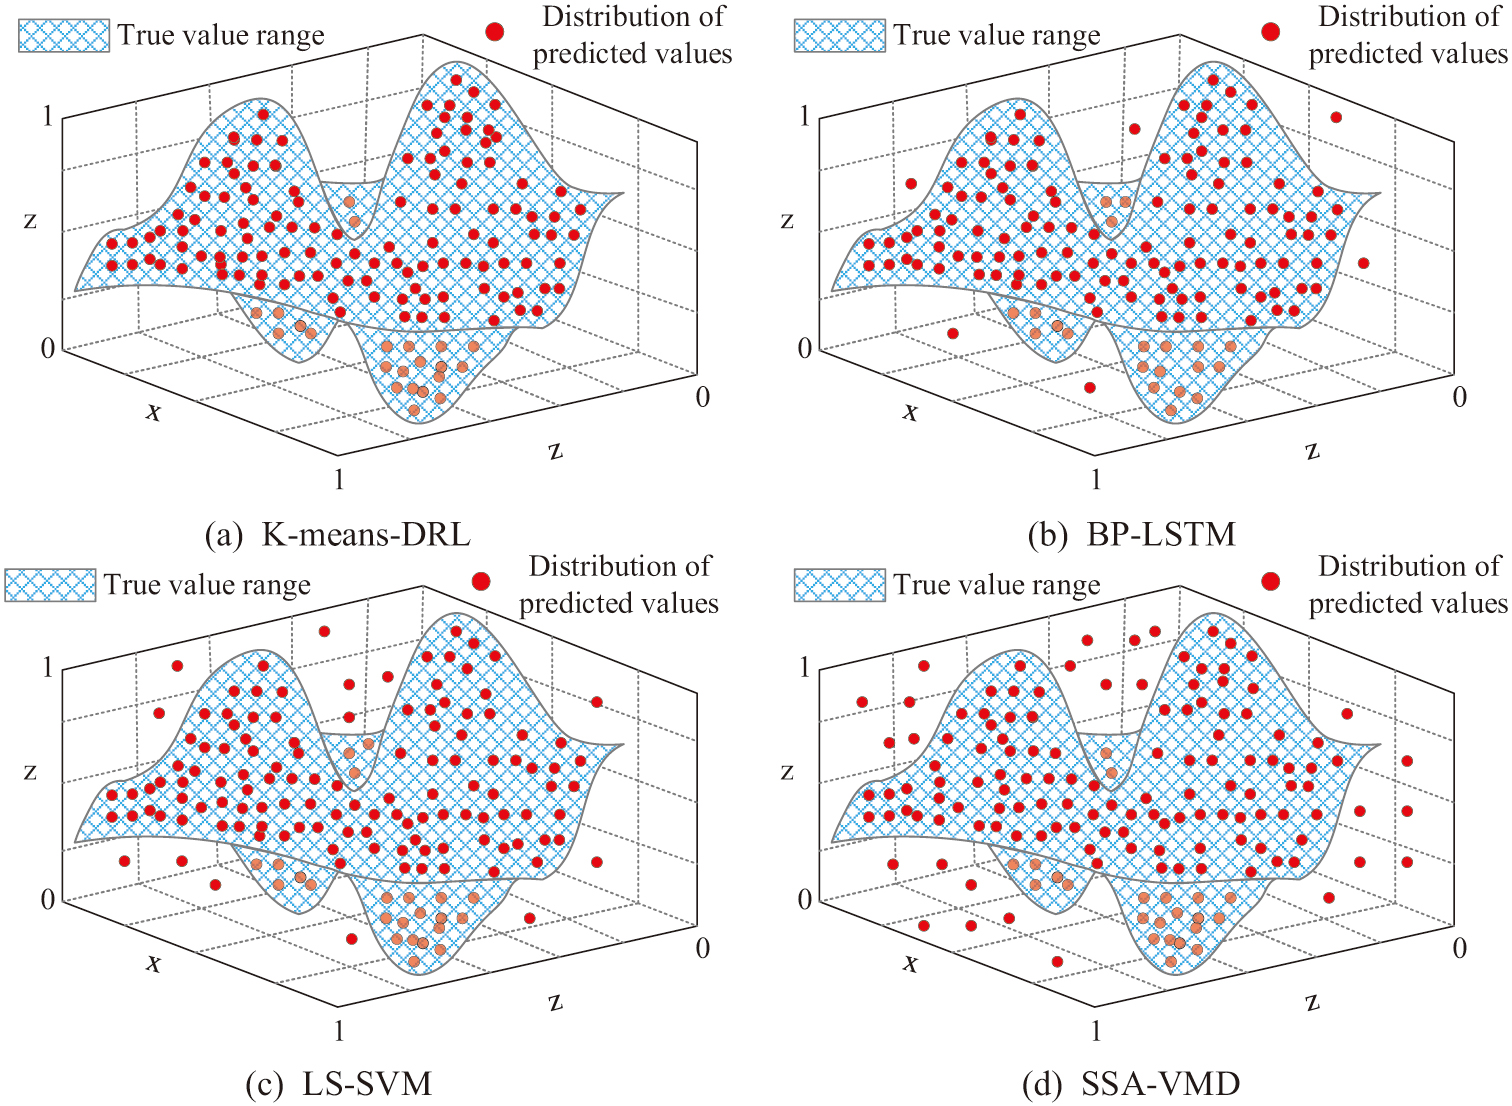 Fig. 6. Comparison of algorithm prediction accuracy.
In Fig. 6(a), the distribution of the predicted values of the K-means-DRL algorithm are within the range of the true values, and the algorithm has high prediction accuracy. In Fig. 6(b), when the BP-LSTM algorithm predicts the dataset, there are very few predicted values that are not within the range of true values. However, most of the predicted values overlap with the range of true values, and the algorithm’s prediction accuracy is lower than that of the K-means-DRL algorithm. In Figs. 6(c) and 6(d), when the LS-SVM algorithm and the SSA-VMD algorithm predicted the data, the two algorithms had most of the distribution of the predicted values not within the range of the true values. This result shows that the K-means-DRL algorithm has the highest prediction accuracy among the four algorithms. Moreover, the prediction effect is significantly better than the other algorithms to predict the data accurately. Then the prediction speed and prediction error rate of the four algorithms are compared. The results are shown in Fig. 7.
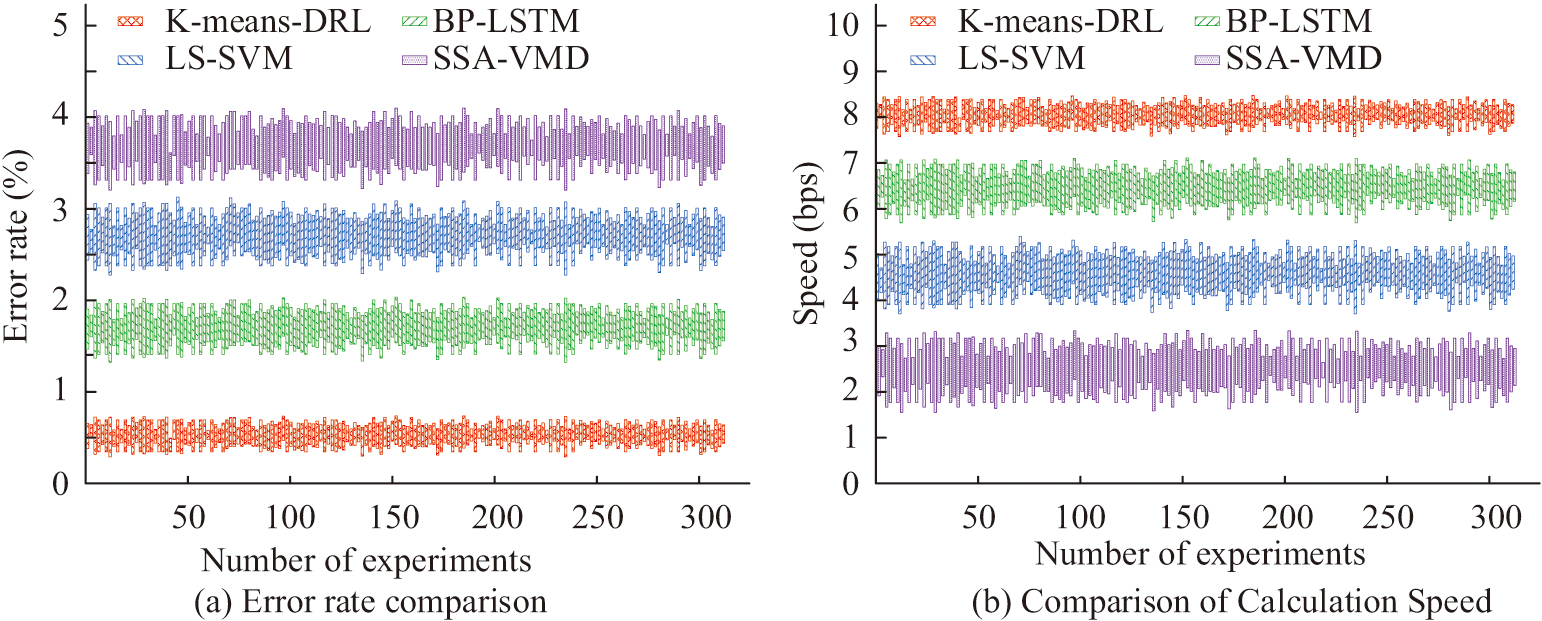 Fig. 7. Comparison of prediction error and prediction time.
In Fig. 7(a), the K-means-DRL algorithm has the lowest prediction error among the four algorithms. After 300 repeated experiments, the average prediction error rate of this algorithm is only 1.2%. The BP-LSTM algorithm has an average prediction error rate of 1.6%. The LS-SVM algorithm and SSA-VMD algorithm have an average prediction error rate of 2.7% and 3.6%, respectively, which is much higher than the K-means-DRL algorithm proposed in the study. In Fig. 7(b), the SSA-VMD algorithm has the slowest speed of only 2.8 bps for data prediction, and the K-means-DRL algorithm has the fastest prediction speed of 8.2 bps. The prediction speeds of the BP-LSTM algorithm and the LS-SVM algorithm are 6.6 bps and 4.5 bps, respectively, which are higher than the SSA-VMD algorithm but lower than the K-means-DRL algorithm. From the above experimental results, it can be concluded that the K-means-DRL algorithm can substantially improve the speed of data prediction, thus reducing the consumption of computational resources and optimizing the allocation of resources. Finally, the cross-entropy of the four algorithms as well as the check-full rate are compared, and the results are shown in Fig. 8.
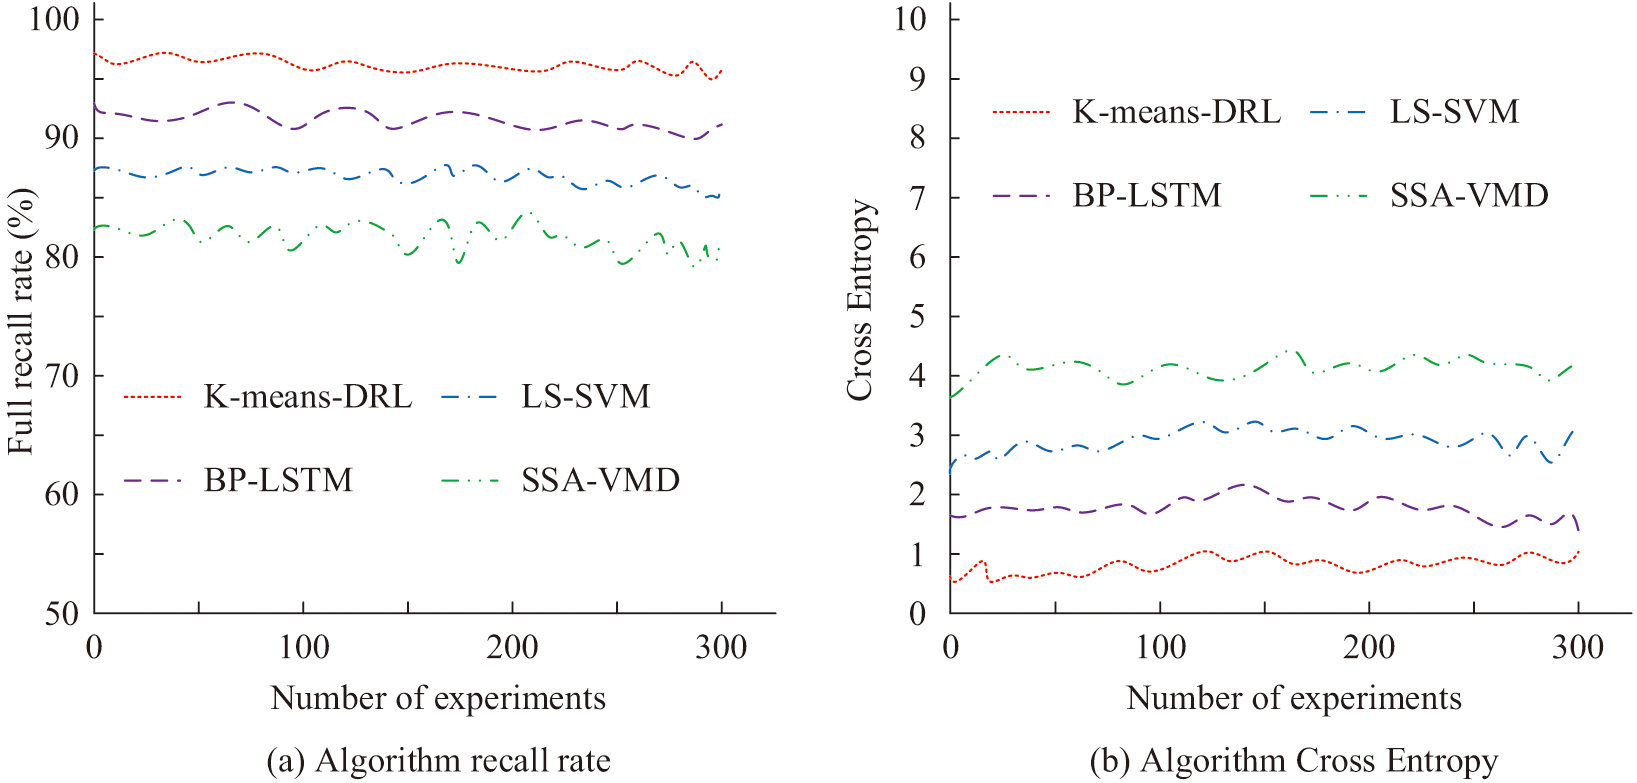 Fig. 8. Comparison of algorithm recall and cross-entropy.
In Fig. 8(a), among the four algorithms, the one with the highest detection rate is the K-means-DRL algorithm, which has a detection rate of 98.7%. The lowest checking rate is SSA-VMD algorithm, which has a checking rate of only 83.2%. Algorithmic cross-entropy is often used as a loss function in deep learning to indicate the difference between the algorithm’s predicted results and the actual results. The smaller the value, the more stable the algorithm is. In Fig. 8(b), the average values of cross-entropy of K-means-DRL algorithm, BP-LSTM algorithm, LS-SVM algorithm, and SSA-VMD algorithm are 0.53, 1.78, 2.43, and 3.91, respectively. Among the four algorithms, the K-means-DRL algorithm has the lowest cross-entropy. This result indicates that the K-means-DRL algorithm has the best stability among the four algorithms. Overall, the K-means-DRL algorithm proposed in the study has the highest prediction accuracy, the lowest prediction error, and the shortest prediction time. The overall performance of the algorithm is significantly better than other algorithms. Therefore, this study utilizes the algorithm to construct an analytical model with the aim of improving the analytical accuracy and analytical speed of the analytical model by this algorithm.
B.EFFECTIVENESS OF THE APPLICATION OF K-MEANS-DRL ANALYTICAL MODELING
After validating the predictive effectiveness of the algorithm proposed in the study, the performance of the analytical model based on the algorithm is analyzed. The study compares the performance of K-means-DRL analysis model with support vector machine principal components analysis (SVM-PCA), random forest logistic regression analysis (RF-Logistic), and least squares support vector regression (LS-SVR). The clinical records and electronic medical records of 100 patients with diabetic cardiomyopathy in a hospital over a period of 6 months are selected as the experimental dataset. The performance of the models is verified by analyzing the samples in the dataset. The inclusion criteria of patients are as follows: 1. Meet the diagnostic criteria of diabetic cardiomyopathy; 2. The course of diabetic cardiomyopathy ranges from 6 months to several years; 3. The patient is between 30 and 45 years old; 4. The patient’s gender, body mass index, and other basic information are complete; 6. The patient has no family history of genetic disease and other complications. 7. The patient is willing to participate, and the guardians are aware of it. The patient’s acceptance criteria are as follows: 1. The diagnosis of diabetic cardiomyopathy is not clear; 2. The condition is too serious and the stability of the condition is poor; 3. The patient’s treatment record is incomplete; 4. The patient has other serious diseases; 5. The patient is allergic or intolerant to TCM. Selecting 100 patients, the number of books is relatively moderate and easy to manage, and the sample size is too large to extend the research cycle. Selecting 100 patients is helpful to complete the study in a relatively short time. The 100 medical records are obtained through the electronic medical record system in the hospital cooperating with medical institutions, including the basic characteristics such as the patient’s name and age, as well as the characteristics of clinical variables such as the patient’s admission date, discharge date, medical history, treatment plan, rehabilitation variables such as the patient’s recovery time, rehabilitation effect, and resource utilization variables such as the patient’s medical expenses and drug use. In order to ensure the representativeness of the data, cases with different degrees of illness are selected at different time periods in the outpatient department and inpatient department of the hospital. Then the validity of the records is verified by quality assessment of the medical records and checking with the original medical records. In the treatment of patients with diabetic cardiomyopathy, clinical benefits refer to the improvement of patients’ health status through treatment, such as the reduction of symptoms, the recovery of cardiac function, and the improvement of quality of life. Resource utilization refers to the medical expenses, hospitalization time, examination, treatment equipment, and other resources used by patients in the medical process. Patient rehabilitation refers to the recovery of heart function, disappearance of symptoms, improvement of quality of life, etc. The time-consuming analysis and accuracy analysis of the four models are firstly compared. The results are shown in Fig. 9.
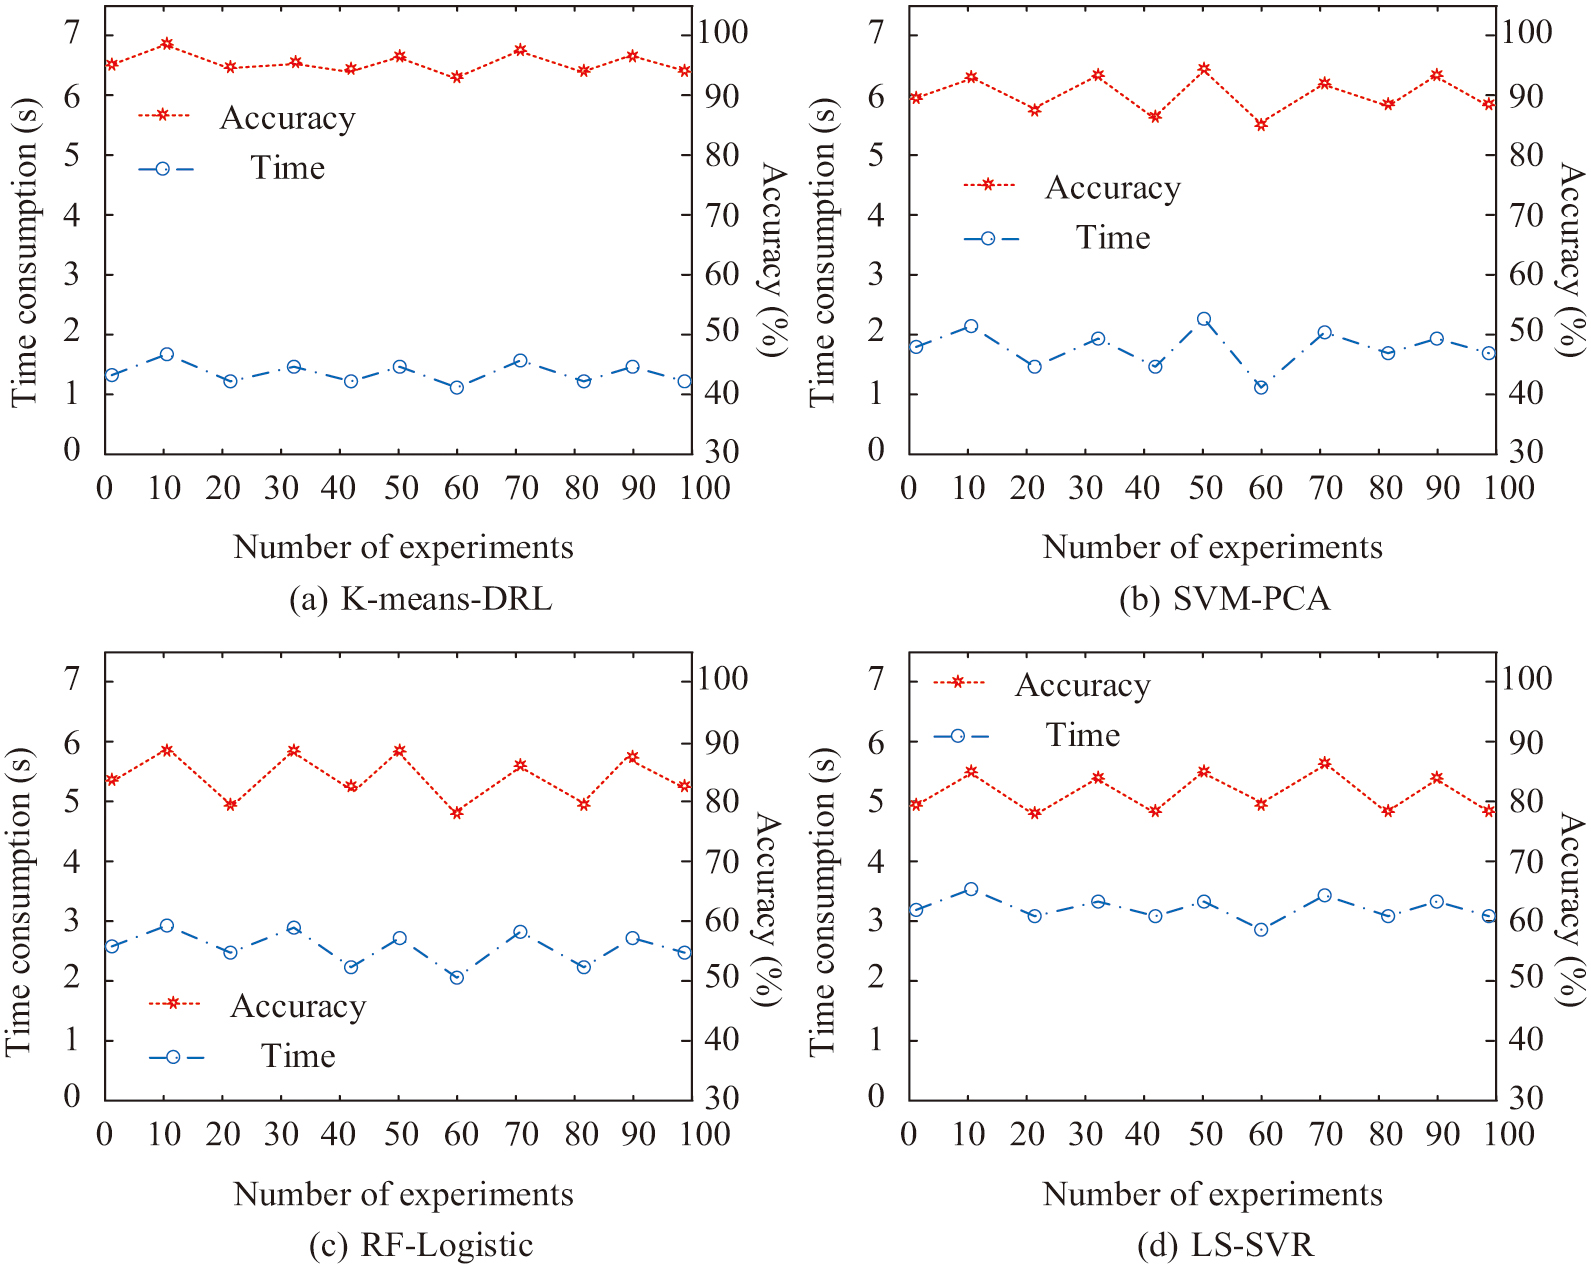 Fig. 9. Comparison of model analysis time and analysis accuracy.
In Fig. 9(a), the analysis accuracy of the K-means-DRL analysis model is 99.5% on average. Moreover, the average time consumed by this model to analyze the patients’ medication patterns is only 1.3 s. In Fig. 9(b), the analysis accuracy of SVM-PCA analysis model is 90.2%. Furthermore, the average time consumed for the analysis of the SVM-PCA model is 1.9 s, which is an increase of 0.6 s compared to the time of the K-means-DRL model. In Fig. 9(c) and Fig. 9(d), the analytical accuracy of both RF-Logistic model and LS-SVR model is decreasing. The analysis accuracy of the RF-Logistic model is 81.2% and that of the LS-SVR model is 80.4%. The analysis time consumed by the RF-Logistic model is 2.3 s, and the analysis time of the LS-SVR model reaches 3.2 s. From this result, it can be concluded that the K-means-DRL model has the highest accuracy in analyzing the medication exchange pattern and the shortest time consumed in the analysis. The results of the analysis of the four models for diabetic cardiomyopathy medication are then compared. The results are shown in Table II.
Table II. Comparison of medication results
| Model | Promoting blood circulation for removing blood stasis | Tonifying Qi and lifting yang | Heat-clearing drug | Yin tonics |
|---|---|---|---|---|
| K-means-DRL | 29.8% | 20.2% | 33.7% | 16.3% |
| SVM-PCA | 32.1% | 17.9% | 35.1% | 14.9% |
| RF-Logistic | 27.1% | 22.9% | 32.1% | 17.9% |
| LS-SVR | 34.2% | 16.8% | 30.2% | 19.8% |
| Fact | 30.0% | 20.0% | 34.0% | 16.0% |
In Table II, the TCMs for patients with diabetic cardiomyopathy are mainly blood-activating and stasis-removing, qi-tonifying, yin-tonifying, and heat-clearing herbs. Moreover, among the four models, the K-means-DRL analysis model proposed by the study is the most accurate in analyzing the types of herbal medications used in diabetic cardiomyopathy. All of its discrepancies with the actual situation are within 1%. Whereas, the errors of the other models in analyzing the types of Chinese medicines used are all above 1%. Moreover, the largest error value of the LS-SVR model for analyzing the types of Chinese medicines used in patients with diabetic cardiomyopathy reaches 4.2%, and the accuracy of the analysis of the types of medicines is low. Then the changes of medical resource utilization and patient rehabilitation time in diabetic cardiomyopathy are compared after using the four models. The results are shown in Fig. 10.
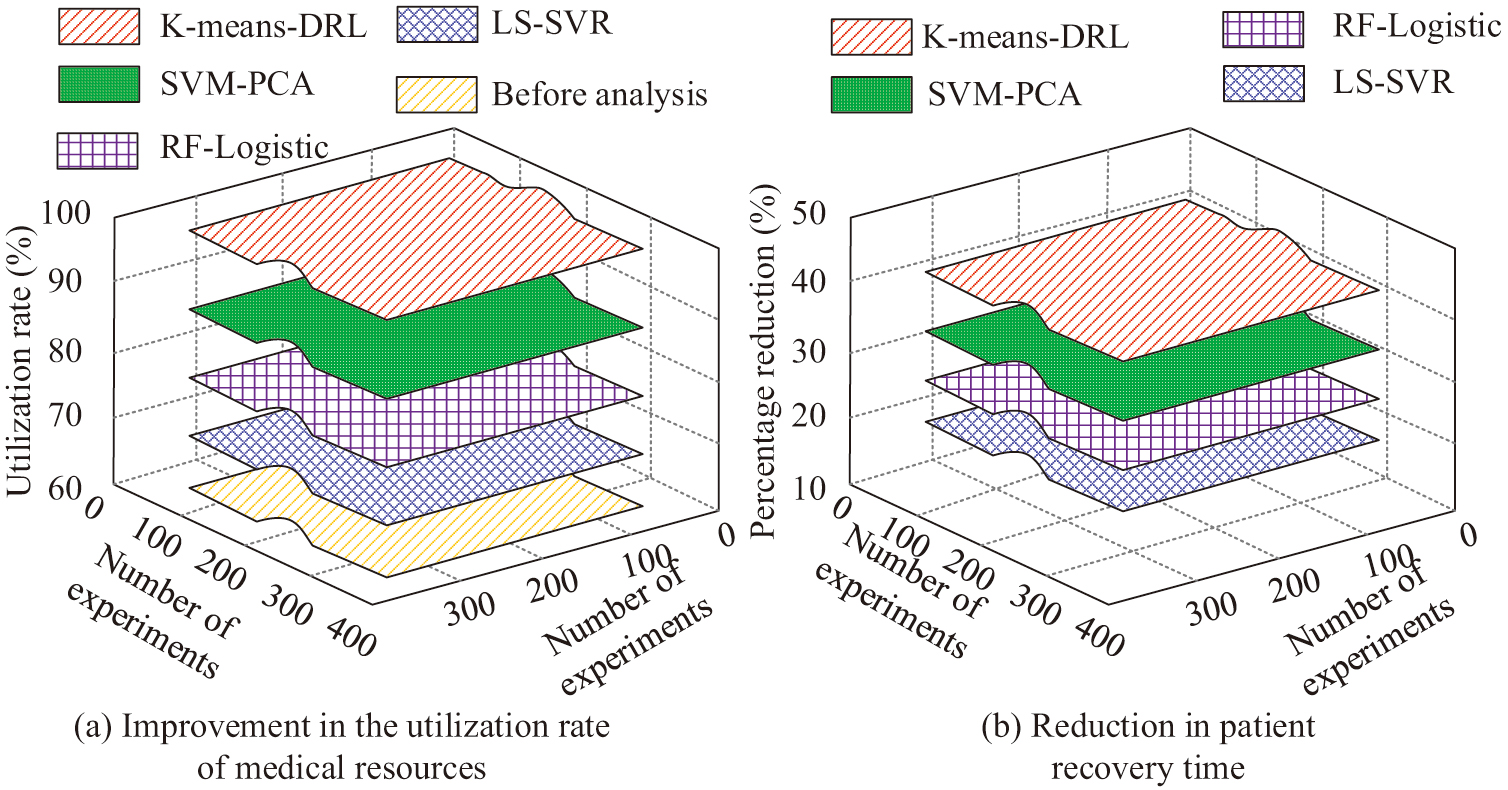 Fig. 10. Comparison of medical resource utilization and patient rehabilitation time.
In Fig. 10(a), medical resource utilization is only 64.3% before using the analytical models. Whereas, after analyzing the medication pattern of diabetic cardiomyopathy patients using all four analytical models, the medical resource utilization is improving. Among them, the medical resource utilization of K-means-DRL model reaches 98.6%, and the resource utilization rate is improved by 34.3%. The SVM-PCA, RF-Logistic, and LS-SVR models, on the other hand, can improve the resource utilization rate, but their enhancement is smaller. The medical resource utilization of SVM-PCA model, RF-Logistic model, and LS-SVR model are 82.4%, 71.5%, and 68.9% respectively. Compared with before the use of the models, their medical resource utilization increases by 18.1%, 7.2%, and 4.3%, respectively. In Fig. 10(b), the recovery time of patients with diabetic cardiomyopathy is decreasing after using all four models. Among them, the K-means-DRL model is able to reduce the recovery time of patients by 39.3%. While the SVM-PCA model, RF-Logistic model, and LS-SVR model reduce the recovery time of the patients by 30.2%, 22.7%, and 17.5%, respectively, which is much lower than the K-means-DRL model. In order to verify the accuracy of the proposed method again, the study collects patients’ cases from multiple hospitals through medical institutions. Among them, 100 cases of diabetic cardiomyopathy patients in primary hospitals, secondary hospitals, and tertiary hospitals are collected as validation datasets. The variables in this dataset are the same as the test dataset. The K-means-DRL model proposed in the study is used for analysis. The results of medication analysis are shown in Table III.
Table III. Analysis of drug use patterns
| Model | Promoting blood circulation for removing blood stasis | Tonifying Qi and lifting yang | Heat-clearing drug | Yin tonics |
|---|---|---|---|---|
| Primary hospitals | 29.8% | 20.2% | 33.7% | 16.3% |
| Secondary hospitals | 29.7% | 20.3% | 33.6% | 16.4% |
| Tertiary hospitals | 30.1% | 19.9% | 34.2% | 15.8% |
| Fact | 30.0% | 20.0% | 34.0% | 16.0% |
It can be seen from Table III that when the K-means-DRL model is used to verify and analyze the medication rules of patients with diabetic cardiomyopathy in different hospitals, the analysis errors of medication types and doses are less than 1%. From the above results, it can be concluded that the K-means-DRL medication pattern analysis model proposed in the study has the highest accuracy and the smallest error in analyzing the medication pattern of patients with diabetic cardiomyopathy. Furthermore, the utilization rate of medical resources is the highest, and the patient rehabilitation time is reduced the most after using this model. The practical application of the model is optimal.
V.DISCUSSION AND CONCLUSION
The current artificial intelligence analysis model has low precision in analyzing the medication pattern of diabetic cardiomyopathy patients and inaccurate analysis of drug dosage accuracy. To address this problem, this study combined the K-means data analysis method with the DRL algorithm and constructed an analysis model based on the combined algorithm. The model was then used in the analysis of drug dosage patterns of diabetic cardiomyopathy patients in order to improve the analysis accuracy. To verify the performance of the analytical model, the study first tested the K-means-DRL algorithm against the BP-LSTM algorithm, the LS-SVM algorithm, and the SSA-VMD algorithm. The experimental results indicated that the prediction error rates of the four algorithms were 1.2%, 1.6%, 2.7%, and 3.6%, respectively. The K-means-DRL algorithm had the fastest computational speed of 8.2 bps. Moreover, the cross-entropy of this algorithm was 0.53, which was lower than that of 1.78 for BP-LSTM, 2.43 for LS-SVM algorithm, and 3.91 for SSA-VMD algorithm. The analytical model based on the K-means-DRL algorithm was then compared with the SVM-PCA model, RF-Logistic model, and LS-SVR model. The results indicated that the K-means-DRL model had the highest analytical accuracy of 99.5% and the shortest analytical time of only 1.3 s. Moreover, the analytical errors of this model for different types of Chinese medicine dosage were all less than 1%. The above results were similar to the results of Liu’s team’s diabetes diagnosis research based on multitask learning [26]. However, the segmentation accuracy of Liu’s team’s multitask learning on the patient’s image was 98.897%, and the image segmentation error was greater than 1%, and the final error of diabetes diagnosis and medication rule analysis was also greater than 1%. Liu’s analysis accuracy was slightly lower than the method proposed in this study. The reason for this result might be that the K-means-DRL model used in this study could reduce the impact of noise and outliers on the model by clustering with the k-means algorithm, and the k-means algorithm can deal with the spatial structure of data, reduce the dimension of data, and reduce the complexity of data so as to improve the calculation accuracy, leading to its analysis effect better than other models. However, the analysis accuracy of Wu et al. on the medication law was low, that is, 80.1%, while the analysis accuracy in this study reached 99.5% [27]. The low analysis accuracy of Wu et al. might be due to the low control accuracy of the comparative analysis used in this study on the drug dose, resulting in the low analysis accuracy.
In summary, the results demonstrated that the proposed medication pattern analysis model exhibited low analysis error, high processing speed, and the potential to enhance medical resource utilization. However, the K-means algorithm in the K-means-DRL model was highly susceptible to noise and isolated points, which could readily result in inaccurate analysis outcomes. In addition, in clinical application, there are large individual differences in the patient’s condition, constitution, and genetic background, which makes the model based on group data analysis, which may intelligently meet the needs of most patients, and may need to be adjusted for a few patients. In order to solve the above problems, other artificial intelligence algorithms can be used in the future to remove the noise and outliers in the data and then cluster them to reduce the impact of noise on the analysis results. And in clinical use, some special patients can be selected for personalized medication experiments to observe the therapeutic effect of patients and evaluate the effectiveness of the scheme.