I.INTRODUCTION
Stud is widely used in the modern machine building industry because of its high interchangeability [1]. There are hundreds of welded studs in a car and these studs are used for interior assembly in the car body. Whether the position of the welded studs meets the design requirements not only determines the subsequent assembly but also affects the performance of the vehicle directly. It is necessary to detect the poses of all studs in a car for quality control during the modern industrial automation production.
Coordinate-measuring machine (CMM) [2] cannot be adapted accordingly to different objects, and its material in probe damages the surface of the measured target easily. What’s more, the speed of CMM is far from meeting the demand of more efficient measurement in higher precision. Recently, with the continuous development of computer technology, machine vision is widely used for 3D measurement of objects [3,4] due to its advantages of noncontact, fast speed, and high accuracy so that researchers prefer studying noncontact measurements for objects. There are three types of noncontact measurement methods: acoustic [5], optical [6], and electromagnetic methods [7], of which the optical 3D measurement is the most widely applied. Conventional optical measurement systems are laser scanner [8], laser radar [9], structure light scanner [10], monocular vision [11–13], multi-view stereo vision [14,15], and so on. Recently, neural networks have shown to superior performance in many object detection tasks due to its ability to learn from raw data automatically [16]. There are many kinds of networks in 3D object detection [17–20]. However, there are few studies in studs pose detection by machine vision and networks. In other words, the defects (e.g., large lens distortions, focal blur, heavy noise, and extreme poses) of the stud images limit the stud pose detection using only neural networks. Wu et al. [21] developed a novel method based on monocular vision for measuring the weld studs pose. Liu et al. [22] proposed a stud measurement system based on photometric stereo vision and Histogram of Oriented Normal (HON) feature extractor. Studies above have been limited in detecting stud poses due to the fact that there has a highly variant reflection property in studs.
Photometric stereo [23], an emerging technology estimating normal maps under different illuminations, has been extensively applied for precision improvement in object measurement combined with deep learning [24–27]. Photometric stereo uses normal maps to evaluate the 3D shape which contains more accurate information than 2D images and possesses lower cost. For this reason, more and more researchers dedicate to the combination with photometric stereo and deep learning for 3D reconstruction and 3D measurement; however, there are few studies for object detection. Liu et al. [28] implemented optical measurements of studs through normal vector map estimation and heat map training. On the basis of these studies, this paper proposes the method for stud pose detection based on photometric stereo and neural network. The main contributions in this work are threefold:
- (1)The monocular vision is applied to calculate the coordinate parameters of the camera for calibration, which can achieve the stud dataset labelling automatically.
- (2)Photometric stereo algorithm is applied to estimate the stud normal map which as input is fed to the neural network.
- (3)The lightweight YOLOv4 network is improved to locate the stud by analysing the normal map images in studs, which directly processes normal maps and outputs prediction results with multi-prediction size.
The structure of the rest of this paper is as follows: Section II provides basic methods in automatic labelling of stud datasets, estimating normal maps and building neural network; Section III presents the detailed experiments; in Section IV, data and the experimental results are presented; and Section V draws the conclusions of this work.
IIBASIC METHOD
Combining photometric stereo and deep learning, as shown in Fig. 1, we first build a photometric stereo vision system and a machine vision measurement system to capture images of studs under eight different light sources (LED lights). We calculate the closed solution in camera calibration to obtain the internal and external parameters of the camera. Then, we derive the image pixel coordinates of studs in the images by Harris corner point detection algorithm [29] for automatically labelling the studs. Secondly, all stud images are processed by the light vector pseudo-inverse matrix to obtain the normal maps of the studs, which as the training images are input to the neural network. Finally, all the training images and the corresponding labels (ground truth) are input to the neural localisation network for iterative training and testing to achieve the pose detection of studs. As long as the nominal position of the stud is accurate, the pixel coordinates of the top and bottom centre points of the studs agree with the nominal position of the suds.
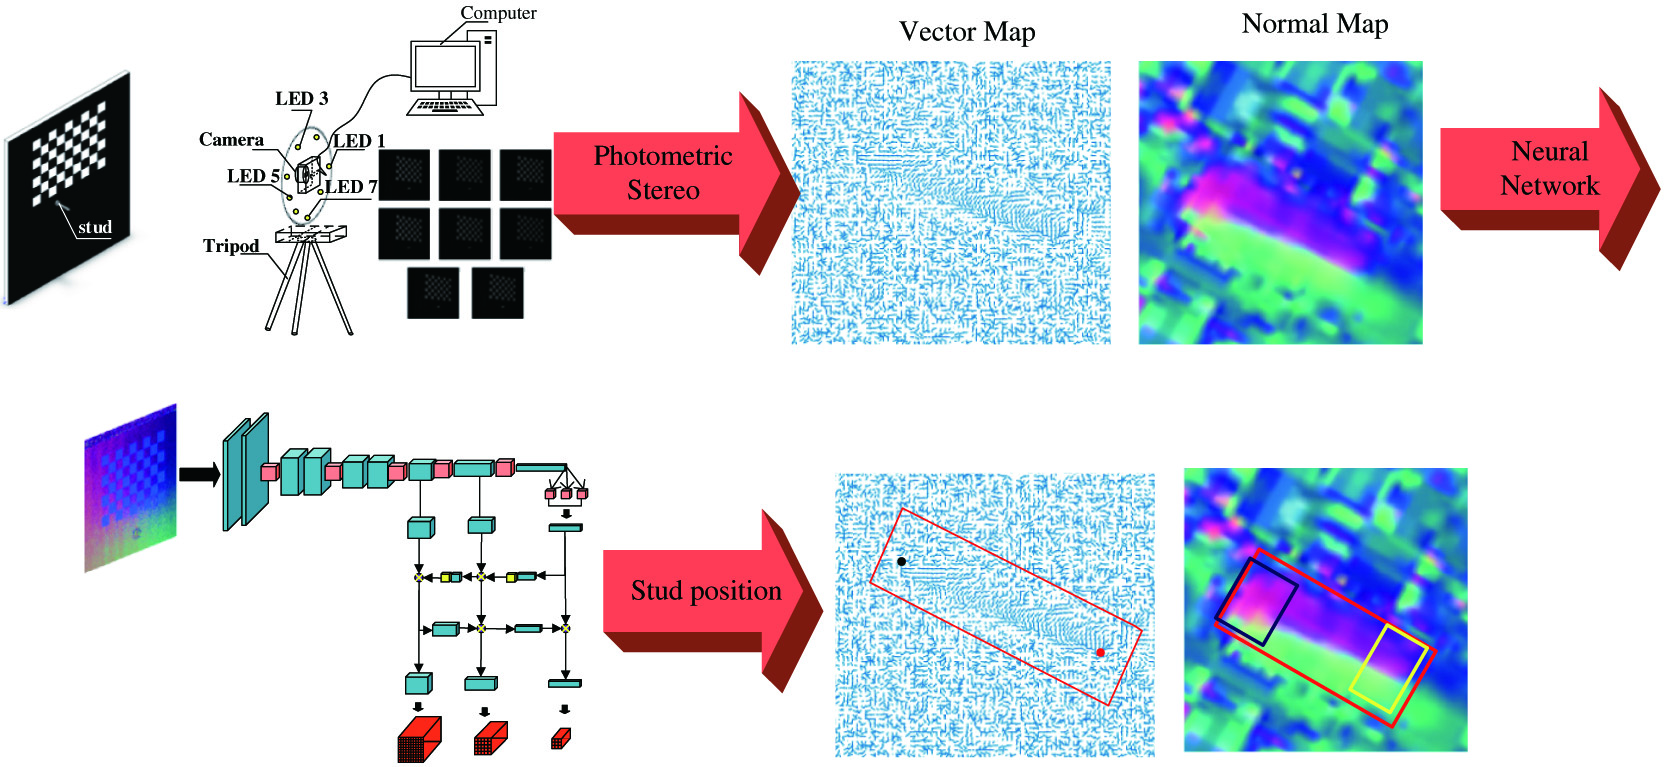 Fig. 1. Stud pose detection system.
A.MONOCULAR VISION-BASED DATASET CONSTRUCTION
Figure 2 illustrates the interrelationship between the point P in 3D space and its corresponding point p in the image, which contains coordinate transformation in four coordinate systems. These four coordinate systems are the world coordinate system, camera coordinate system, image coordinate system, and pixel coordinate system, respectively. As shown in Fig. 2, the 3D right-angle coordinate is the world coordinate, which can be set artificially. The 3D right-angle coordinate is the camera coordinate, is located at the projection centre of the lens; the axis is perpendicular to the image sensor and coincides with the optical axis of the lens; the axis is parallel to the long side of the image sensor image array; and the axis is determined by the right-hand rule. The 2D right-angle coordinate is the image coordinate, and is the pixel coordinate [30].
 Fig. 2. Dataset collection system based on monocular vision.
The relationship of the transformance between the world coordinates and the pixel coordinates is expressed as:
where . is the focal length of the lens, and are the physical dimensions of a pixel in x-axis and y-axis, respectively. As the external parameters of the camera, R and T are the rotation matrix and the translation vector, respectively. By equation (1), the parameters of the camera are obtained for camera calibration. On the basis of which, we construct the stud datasets. The details in dataset construction are as follows:- a.Calculating the internal and external parameters of the camera for the camera calibration.
- b.Calculating the pixel values of the top and bottom centre points of the stud in the image coordinate from the 3D coordinate of the stud.
- c.Labelling the stud by the image coordinate and defining the bottom centre point of the stud as studb, the top centre point as studt.
- d.Feeding the pixel coordinates of the studs as ground truth to the neural network.
B.PHOTOMETRIC STEREO SYSTEM
Photometric stereo is a method to obtain local normal maps in several images under different illuminations. This paper applies eight LED lights with different orientations for improving the accuracy and robustness of the result. The complexity of the threads on the stud surface and the soot from welding leads to a more pronounced diffuse reflection of the stud itself, so the photometric stereo vision system is established based on the Lambertian reflection.
According to the Lambertian reflection, the intensity of any pixel in the image can be expressed as:
where is the pixel intensity under illumination in row and column, and is the albedo at the corresponding point of pixel , denotes the direction of light source projection. The equation (2) can be formulated as: where is the surface unit normal vector, which is estimated by applying eight LEDs and calculating the pseudo-inverse matrix of the light source vectors in this research. On the basis of which, the equation (3) can be described as:The surface normal of pixel can be estimated:
Finally, calculating every pixel through equation (6) repeatedly for normal map.
C.DEEP NETWORK-BASED NORMAL MAP OF STUDS IN LOCALISATION
In this paper, a lightweight YOLOv4 network based on YOLOv4 [31] is proposed to locate the stud by analysing the normal map images in studs. As shown in Fig. 3, the size fed to the network is , where 3 indicates the three channels. The lightweight YOLOv4 network applies convolution layers, upsampling, downsampling, and deep concatenation layers to directly process normal maps and output prediction results with multi-prediction size. The multi-size output contains three kinds of sizes: , which can get better network performance in extracting important features from the training data. Root mean squared error (RMSE) is used as the regression loss function during the training process:
where is the ground-truth value, is the predicted value, and N is the number of the testing samples of stud normal maps.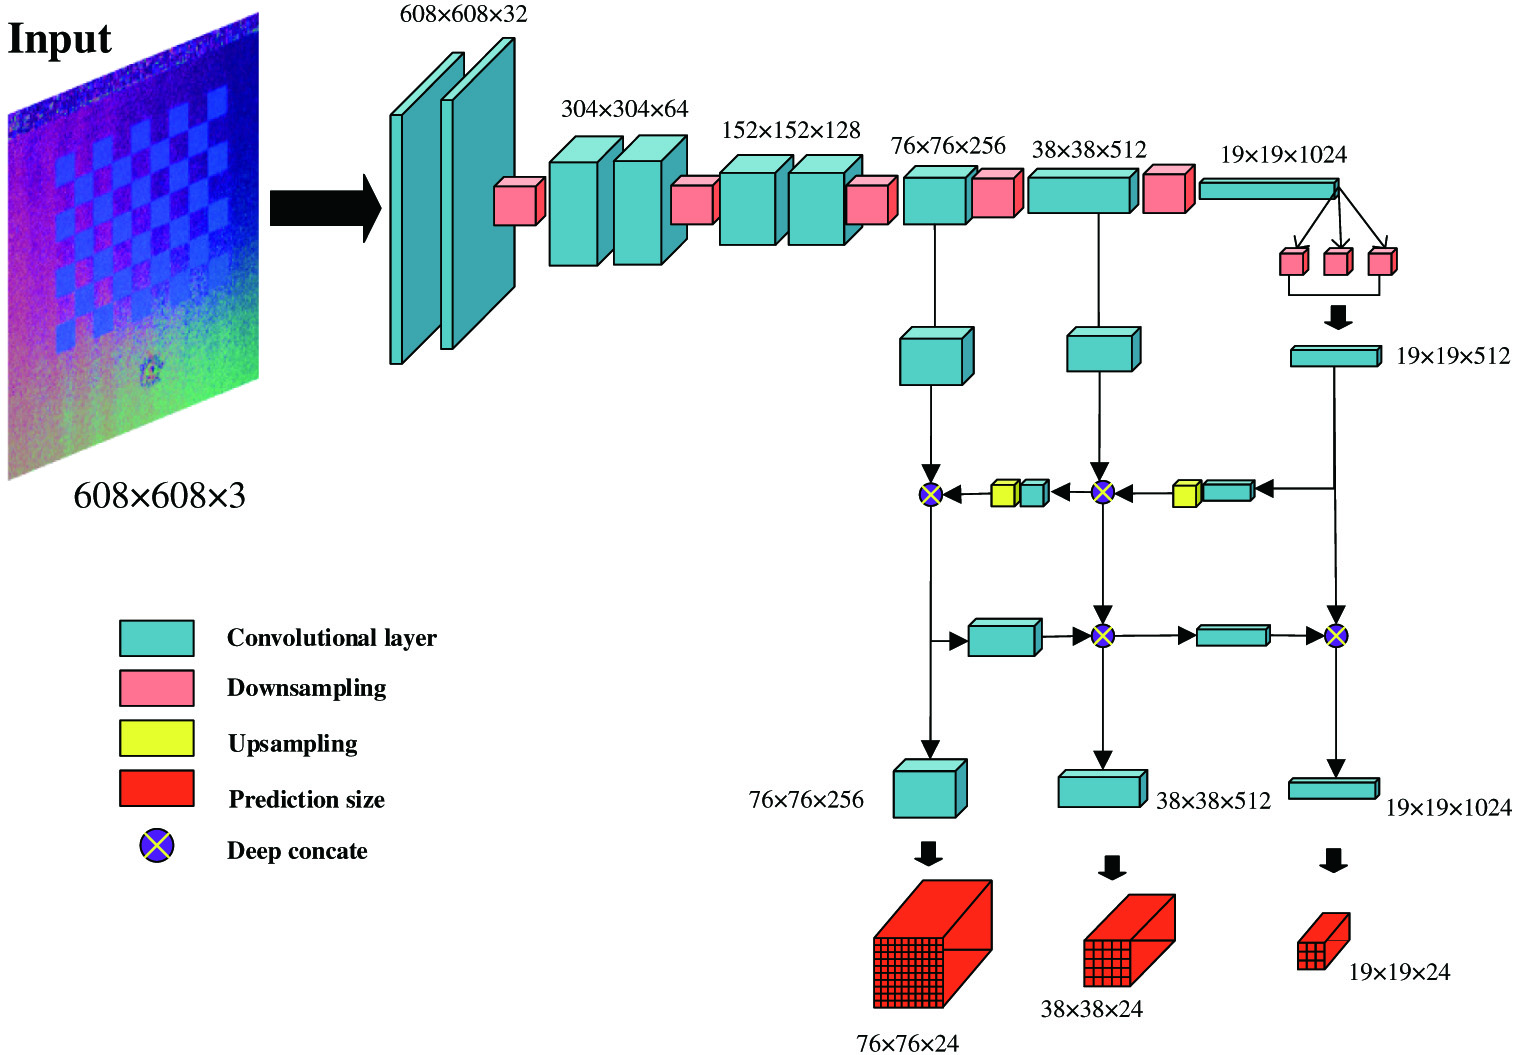
IIIEXPERIMENTS
A.DATASET AND EXPERIMENTAL PLATFORM
In this study, a total of 5000 groups of samples for studs are constructed. We apply the software MTLAB to program the microcontroller program Arduino to ensure that the LEDs are lit in the clockwise from the number 1 in Fig. 2 for capturing stud images. Every group of the stud sample contains eight stud images from different illuminations. These images are calculated by photometric stereo to obtain the normal maps of studs, which as the input are fed to neural network for training.
The hardware server configuration for the experiments is: Intel(R) Core (TM) i5-9600KF processor, NVIDA GeForce GTX 2080Ti graphics card. The software environments are Ubuntu 18.04, Python 3.7.7, TensorFlow-gpu-2.1.0, and PyCharm 2020. 1. Proposed method in this paper utilises several libraries such as NumPy, Pillow, and OpenCV.
B.NORMAL MAPS OF STUDS
We estimate the vector maps of studs by the least square algorithm based on photometric stereo. Eight stud images of the same stud pose with different illuminations are integrated into a stud vector map. The normal maps of studs are obtained by converting the channels of the stud vector map. This paper displays the normal map of one stud pose in Fig. 4.

C.EVALUATION METRICS
In this paper, the RMSE and mAP (mean Average Precision) are used to evaluate the model:
RMSE suggests the precision of the measurement, which indicates the overall difference between the predictions and the ground truth for all testing samples. TP stands for true-positive, FP for false-positive, and mAP as an important evaluation metrics is used to evaluate the accuracy of object detection.
D.NETWORK TRAINING
The network is trained on Adaptive moment (Adam) estimation method, which possesses a very fast convergence rate and powerful generalisation ability with optimisation. Mosaic and Image augmentation (Imgaug) are applied to expand the stud dataset with a total of 30,000 data samples. All the labelled data (corresponded with ground truth) are randomly divided into the training and testing datasets with the ratio of 4∶1. During the network training, the epoch and batch size of the training data are set to 60 and 4, respectively. The weights of the Pascal VOC (Pascal Visual Object Classes) are used as the initial weight input. The learning rate given an initial value with 0·001 is updated every 2500 iterations.
IVRESULTS
The training loss curves are shown in Fig. 5. The numbers on x-axis and y-axis represent the training epochs and the loss values, respectively. Figure 5(a) shows the trend of loss values, Figs. 5(b) and 5(c) show the distribution of loss values in the locally enlarged region of Fig. 5(a) respectively. Figure 5 indicates that the loss function converges rapidly at the beginning of the training with oscillating decrease in the followed training. After 60 epochs of the network training, the loss value is 13·9392 (unnormalised) and the prediction result performs best.
 Fig. 5. Loss trend during training.
The weights perform best trained in network are used to predict the stud pose. Figures 6(a) to 6(d) illustrate the prediction result in stud normal map images and stud images captured by the camera directly. It is obvious that the neural network provides a good performance in detecting stud normal maps with its key points on the top and bottom of the stud in Figs. 6(a) and 6(b). However, the raw image of the stud is detected incorrectly under the complex background shown in Figs. 6(c) and 6(d). Figures 6(c) and 6(d) show that the top and bottom key points of the stud are not accurately recognised, or are arbitrarily recognised as other key points, or are not recognised. RMSE and mAP in proposed network are 0·074% and 99·65%, respectively, a low error and high precision. In terms of detecting the speed for every stud image, our method requires less average computation time of 0·002584 s, which indicates that the proposed method can be applied in a real production environment for stud real-time detection.
 Fig. 6. Prediction of stud normal map image and stud raw images. (a, b) prediction of stud normal map images; (c, d) prediction of stud raw images. The blue box, red box, and green box indicate the position, the top point, and the bottom point of stud, respectively.
V.CONCLUSIONS
In this paper, a dataset system for automatically collecting and labelling studs was built. The photometric stereo with eight light sources was applied to estimate stud normal maps as input to improved neural network with good experimental results in stud poisoning. After the prediction, RMSE and mAP were used as the evaluation metrics to validate the prediction performance. A comparison of stud normal maps with stud raw images fed in network was made and suggested that proposed method indicated superior prediction performance. The conclusions in this paper are also applicable to multi-stud identification and detection. This research provides the foundation combining the photometric stereo and deep learning for object detection in industrial production. In future, the combination of deep learning and photometric stereo will be studied more intensively to improve the accuracy and speed of object detection.