I.INTRODUCTION
Microfluidic biochip is a science and technology that manipulates fluids in micrometer scale space. Microfluidic biochip consists of microchannels forming a network with controllable fluids throughout the system to realize a variety of functions in different laboratories such as conventional chemistry, biology, materials, and optics [1,2]. Miniaturization, integration, low consumption, fast throughput, and quick analysis are the features that define this technology. Nucleic acid analysis, peptide and protein analysis, cell culture, separation, and analysis are among its many applications in the biological and environmental sciences [3]. By modifying fluids in microscale channels, this technique makes it possible to conduct biological experiments in a smaller volume and less time, significantly increasing experiment efficiency and precision. The design optimization of microfluidic biochips is a complex process that involves knowledge from multiple disciplines such as fluid dynamics, biocompatibility, and materials science [4,5]. Genetic algorithm (GA) and particle swarm optimization (PSO) are two widely used evolutionary computational methods of artificial intelligence that simulate evolution and group behavior in nature to find optimal solutions to complex problems. GA optimizes problems by simulating natural selection and genetic mechanisms. PSO mimics the social behavior of schools of fish or flocks of birds to optimize issues [6,7]. By utilizing their individual characteristics, the study integrates these two algorithms to enhance the efficacy and efficiency of the optimization process in order to optimize the test path for microfluidic biochips. This enables path optimization in microfluidic biochip design, reduces fluid resistance, and improves the efficiency and precision of biological sample processing.
Combining the GA and PSO algorithms to create a model for improving the test path of microfluidic biochips is what makes this research innovative and offers a new optimization approach for microfluidic biochip design. The contribution of the research lies in the optimization of the test path for microfluidic biochip design by the model to improve the processing efficiency of biological samples. This can provide a theoretical foundation and practical guidance for the application of intelligent optimization algorithms in the field of biomedical engineering.
The main contribution of the research is the proposal of a hybrid GA-PSO algorithm that combines dynamic priority strategy for optimizing test paths in microfluidic biochips. By combining the global exploration of GAs with local refinement of PSO, this method dynamically adjusts droplet routing to reduce interference between experimental and testing processes. This framework combines constraint modeling to address real-world operational challenges, providing a universal solution for efficient path planning across different chip architectures. This work advances algorithm collaboration and dynamic adaptability, bridges the gap between existing methods, and provides a scalable foundation for improving the efficiency of biochar testing.
The rest of the article is arranged as follows: The second part is an investigation into the current status of microfluidic biochar testing path design both domestically and internationally. The third part is the design of optimization algorithms and the optimization of testing paths. The fourth part is the simulation testing and verification of research design methods. The fifth part is a summary of the research content.
II.RELATED WORKS
GA and PSO are two widely used evolutionary computational methods. Sohail A et al. addressed the problem of optimizing multidimensional, stochastic data and summarized the advantages of GA for complex problems by analyzing related studies. In the field of computational biology, GA provided cost-effective solutions for finding optimal values for large datasets and was used for image reconstruction. These algorithms improved precision and precision based on sub-algorithms [8]. A GA-based integer optimization technique was presented by Hamdia KM et al. to improve the feature configuration and architecture of machine learning models. When compared to the traditional single hidden layer network, the results demonstrated that the optimized deep neural network model had a greater prediction precision [9]. To resolve the problems of GA hyperparameter setting, high computational complexity, and randomness of selection operation, Too J et al. proposed a new competitive GA by using competitive strategies and combining new selection and crossover strategies. The results showed that the method could provide highly competitive results and outperform other algorithms in feature selection [10]. To improve particle swarm performance, Pawan YN et al. introduced two novel PSO models that predict the inertia weights in particle swarm motion. According to the findings, the new models significantly outperformed the PSO models with constant, stochastic, linearly decreasing inertia weights [11]. Otair M et al. solved the feature selection problem using the gray wolf optimization algorithm and linked it with the PSO Algorithm, which updated the information about each gray wolf location using the ideal value, in an attempt to discover a new algorithm to examine all inbound and outbound operations. The results showed that this method outperformed the gray wolf optimization algorithm when using K-mean clustering algorithm or support vector machine (SVM) algorithm [12].
Microfluidic biochips utilize a network of microchannels to control fluids for different laboratory functions such as conventional chemistry, biology, materials, and optics. Chu Y et al. developed an atomic-scale ultrasensitive, rapid and multi-mirna simultaneous detection platform in order to achieve high-throughput, sensitive, cost-effective, and rapid miRNA detection. The platform was realized by a microfluidic biochip locally assembled with nanomaterials. The results showed that it had good practical application in early cancer diagnosis. Irisin led to energy expenditure by increasing brown adipose tissue, and irisin protein converted white adipose tissue to brown adipose tissue [13]. By automatically building effective chip architectures using flow-path networks, Huang X et al. suggested a new workable design flow for actual fluid delivery and removal in order to optimize continuous-flow microfluidic biochips. The findings demonstrated that the suggested design flow had a cheap total chip cost and a high analysis execution efficiency [14]. To improve the chip architecture based on a chip with dedicated storage units, Guo W et al. introduced the first workable system-level design and scrubbing optimization challenge for distributed channel storage architecture microfluidic biochips. The findings demonstrated that the technique might increase washing efficiency, lower chip costs, and cut the time needed to complete biochemical applications [15]. In an attempt to address the problem of digital microfluidic biochip electrodes degrading over time, Liang TC et al. trained a deep neural network strategy using droplet transportation as a formulation of the deep reinforcement learning problem. According to the findings, time-sensitive bioassays could be performed well on a basic microcomputer by utilizing deep reinforcement learning techniques [16]. Baban NS et al. proposed a dynamic material-level watermarking scheme based on polydimethylsiloxane for microvalved microfluidic biochips in order to address the vulnerability of outsourced microfluidic biochips to malicious attacks. The findings demonstrated that the machine learning model detected curing ratio irregularities with above 99% accuracy [17].
In summary, microfluidic biochips have a wide range of functions and uses and can be developed into biocomputers, gene and protein sequencing, mass spectrometry, chromatography, and other analysis systems. It has become an extremely important technical foundation for systems biology, especially for systems genetics. To improve the efficiency of sample analysis, the study combines GA and PSO to optimize the test path of microfluidic biochip design.
III.METHODS AND MATERIALS
A.DESIGN OF HYBRID OPTIMIZATION ALGORITHM COMBINING GA AND PSO
The study applies intelligent algorithms to the optimization problem of test paths can effectively improve the efficiency of test path search and optimization. The study proposes a PSO model based on GA optimization for test path optimization. GA encodes the study object using a number of bits of binary code. N randomly generated initial data structure individuals and based on these individuals, iterations are started, and the fitness function (FF) of each individual is calculated separately to determine its strengths and weaknesses [18,19]. PSO is an intelligent algorithm that mimics the social behavior of a group of organisms, such a school of fish or a flock of birds, in an attempt to find the best solution. It is based on particle swarm theory. Equation (1) displays the PSO mathematical model.
In equation (1), and denote the position and velocity of particle at the th iteration, respectively. and denote the individual and group best positions of particle , respectively. and denote the position and flight speed of particle at the th iteration, respectively, and is the inertia weight. , are learning factors. and are random numbers that increase the randomness of the search space [20]. The particle swarm formulation of the PSO optimized test path is shown in equation (2).
In equation (2), denotes the path taken by the test droplet. denotes the set consisting of the priority coefficients of each edge in the test model. is the exchange sequence of particle at the th iteration. denotes the individual optimal path of particle . denotes the population optimal path of particle . In the PSO’s inertia coefficient update formulation, larger inertia weights give the algorithm a stronger global search capability, allowing it to explore over a larger solution space. However, its corresponding local search capability is weakened, making it difficult to fine-tune the better solutions that have been found [21,22]. Smaller inertia weights enhance the algorithm’s local search capability, allowing the particles to search more deeply in the neighborhood of the current more optimal solution. However, it may reduce the breadth of global exploration, leading the algorithm to easily fall into local optimal solutions [23]. Therefore, rationally adjusting the size of inertia weights is crucial for the performance of PSO in different search stages. The gradually decreasing inertia weights are shown in equation (3).
In equation (3), denotes the largest inertia weight. denotes the smallest inertia weight. is the current number of iterations. is the total number of iterations. GA is a technique that mimics the natural evolutionary process to get the best answers. The method transforms the process of solving problems into a process akin to chromosome gene crossing and mutation in biological evolution through computer simulation. Compared to other traditional optimization techniques, it may typically produce better optimization outcomes more quickly when handling more complicated combinatorial optimization issues [24]. N initial string structure data are first generated at random by the technique. The population is made up of N individuals, and each string structure data point is an individual. With this N initial string structure data as the beginning point, the GA begins the iteration. The FF of the GA is used to evaluate the degree of superiority or inferiority of the individuals in the population. The value of the FF in the study is calculated as shown in equation (4).
denotes the feasible solution of the algorithm. Among them, , is the number of iterations a,. denotes the individual number. is the total number of iterations. is the population number. denotes the length of each path. is the Eulerian path length of the chip test model. is a minimal value to prevent computational overflow [25]. During GA iteration, the fitness values of all individuals in the population will keep changing, and at the same time the probability of an individual being selected will also change. The calculation of the probability of a population individual being selected is shown in equation (5).To reflect the difference in individual fitness values, the study extended the above to obtain equation (6).
In equation (6), is a tunable factor, . After that, crossover and mutation operations are performed. PSO based on GA optimization combines the features of both GA and PSO algorithms. The crossover and mutation operations are added to PSO to improve the performance of the algorithm. The flow of GA combined with PSO is shown in Fig. 1.
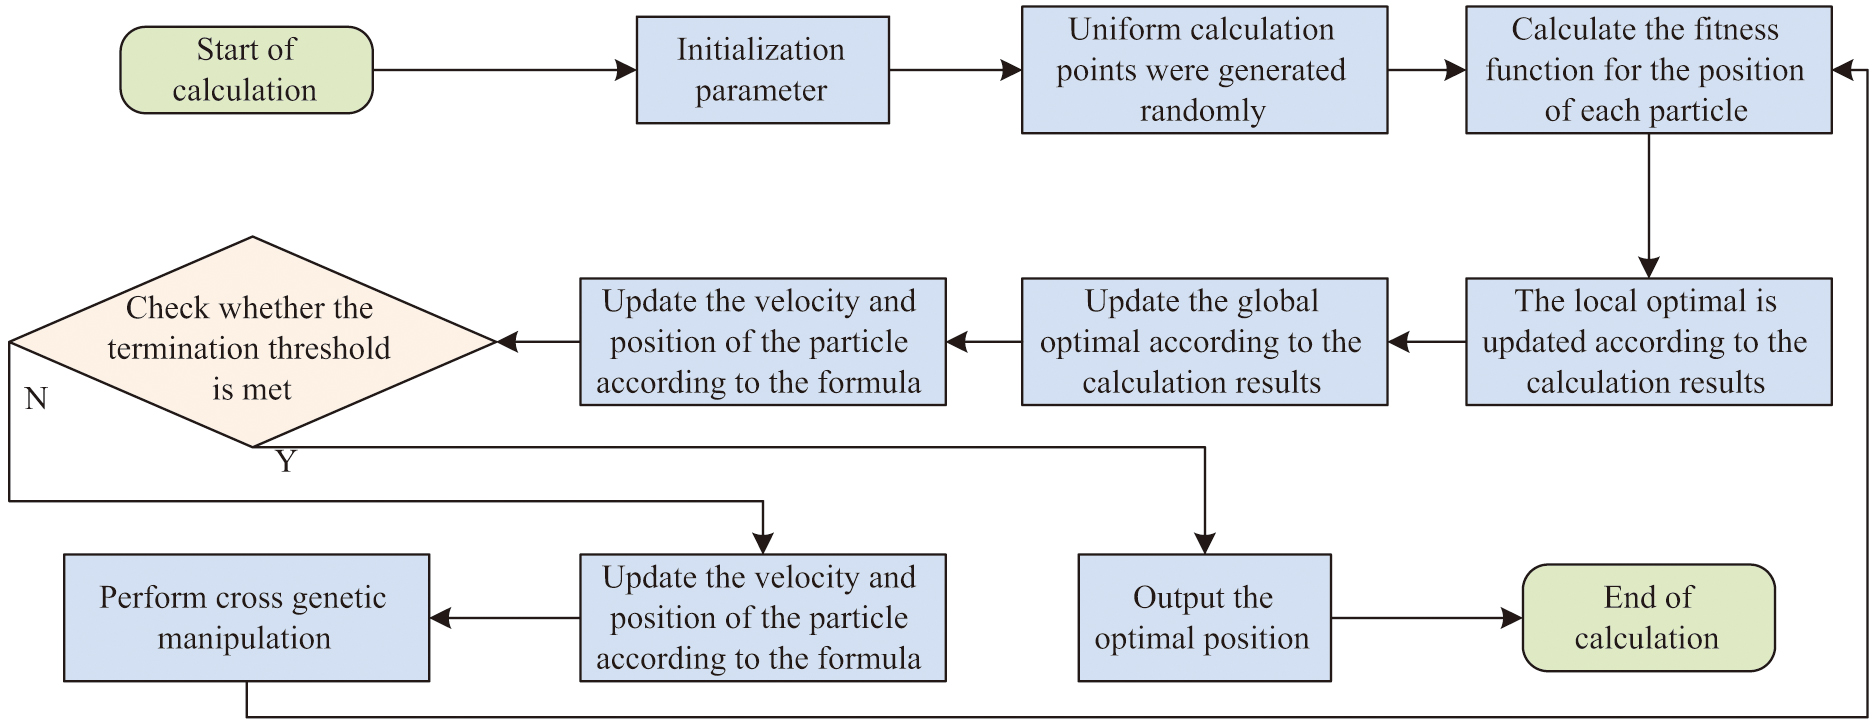 Fig. 1. Genetic algorithm improved particle swarm algorithm flow chart.
B.OPTIMIZATION OF CHIP TESTING PATH BASED ON HYBRID OPTIMIZATION ALGORITHM
The study introduces the priority strategy in the test path optimization model for PSO design based on GA optimization. After the initial path is obtained by this strategy, the algorithm optimizes the test path here to obtain a shorter test path to enhance the testing efficiency. The testing of microfluidic biochip includes offline test and offline test. The offline test is carried out synchronously with the experiment, and when the test droplet is adjacent to the experimental droplet, droplet fusion occurs, which will have an impact on the test [26]. The offline test uses the test droplet to test the chip before the experiment starts, then the effect of the experimental droplet is not considered. The total number of edges passed by the microfluidic chip is shown in equation (7).
In equation (7), is the total quantity of edges through which the microfluidic chip passes. denotes the quantity of chip rows. denotes the quantity of chip columns. The number of edges corresponding to the Euler loop of microfluidic chips with different numbers of rows and columns is shown in Fig. 2.
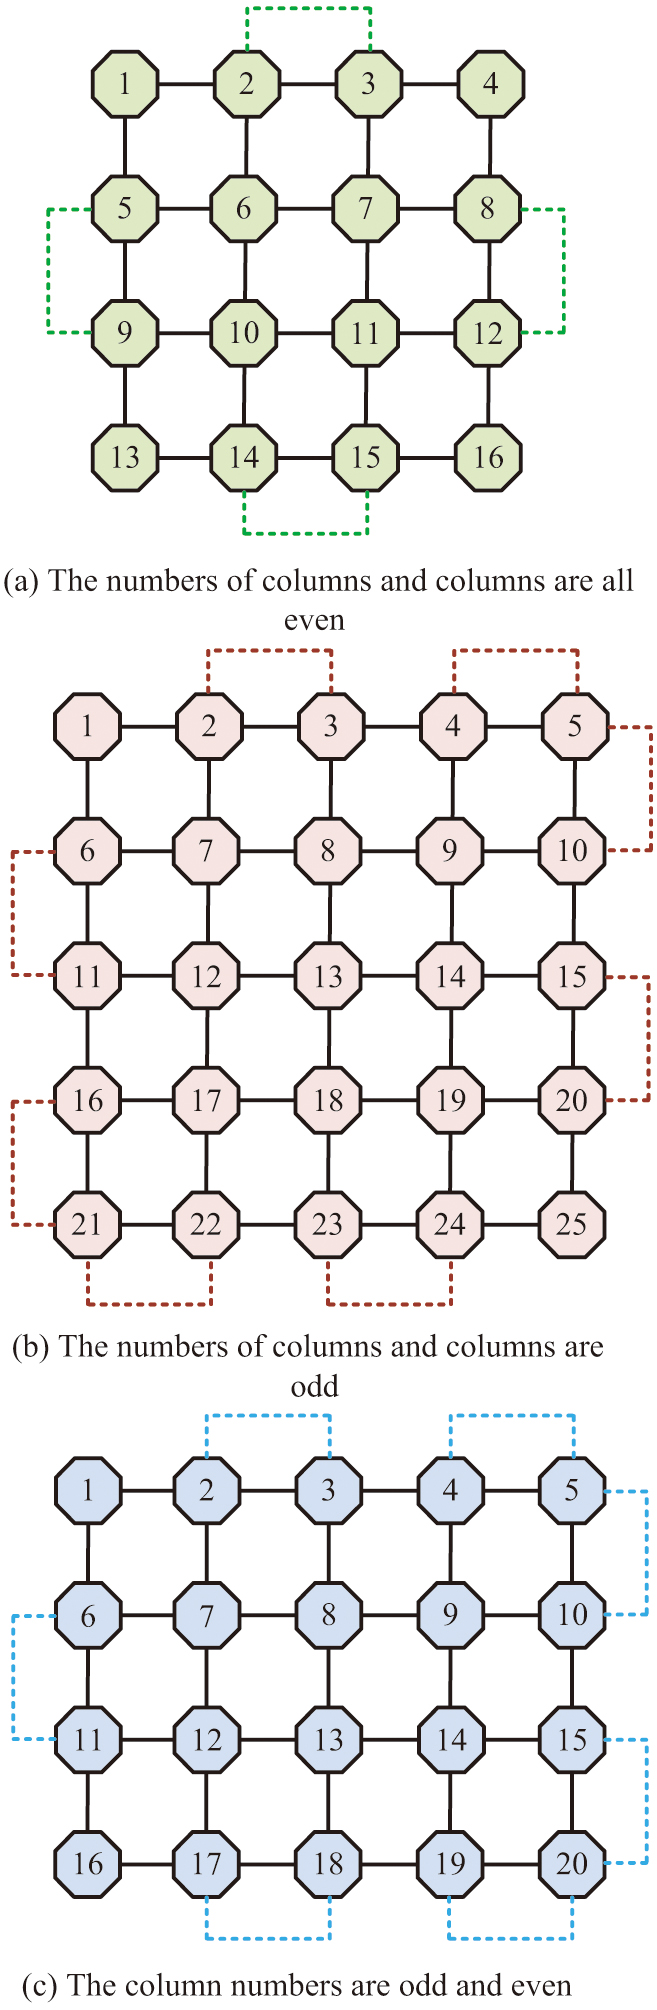 Fig. 2. The number of sides corresponding to the Euler loop in different cases.
The quantity of rows and columns of the model shown in Fig. 2(a) is 4 × 4, which satisfies the requirement that the quantity of rows and columns is even. Equation (8) illustrates how to calculate the number of Euler loop edges.
In Fig. 2(b), the number of model ranks shown is 5 × 5, which satisfies the requirement that the number of ranks is odd. The calculation of the number of Eulerian loop edges is shown in equation (9).
The model in Fig. 2(c) has four rows and five columns, meeting the criterion that the quantity of rows and columns be odd and even each other. The calculation of the number of Eulerian loop edges is shown in equation (10).
In offline test, the Euler loop length is the shortest path length. When a test droplet passes through this loop, a shortest path is formed. The objective function of this path is shown in equation (11).
In equation (11), is the distance traveled by the droplet. is the maximum time set by the study. is the length of the droplet moving from the position to the position at . indicates that the droplet moved from position to position. indicates that the droplet did not move from position to position . Since the offline test interferes with the normal conduct of the experiment, the experiment needs to consider the fluid constraints between the droplets. The static constraints between the fluids are shown in equation (12).
In equation (12), denote the ranks of droplet at time, respectively. denote the row or column where droplet is located at time , respectively. For two stationary droplets at the same time, the rows or columns they are in must be separated by at least two positions, otherwise droplet fusion will result. The static constraints between the fluids are shown in equation (13).
The position of a droplet at time and the position of another droplet at moment and moment cannot be adjacent to each other. Moreover, the test droplet cannot be adjacent to the experimental droplet at the , , and moments. Otherwise, the experimental droplet will merge with the test droplet, affecting the experimental results. In offline test priority strategy, the chip does not consider the traveling path of experimental droplets [27]. Therefore, in the test model of the chip, it can be observed that there are 2 neighboring vertices in all 4 vertices of the test model. There are 3 neighboring vertices in the periphery in the other test models. There are 4 neighboring vertices in the non-periphery. The test path under offline test priority strategy process is shown in Fig. 3.
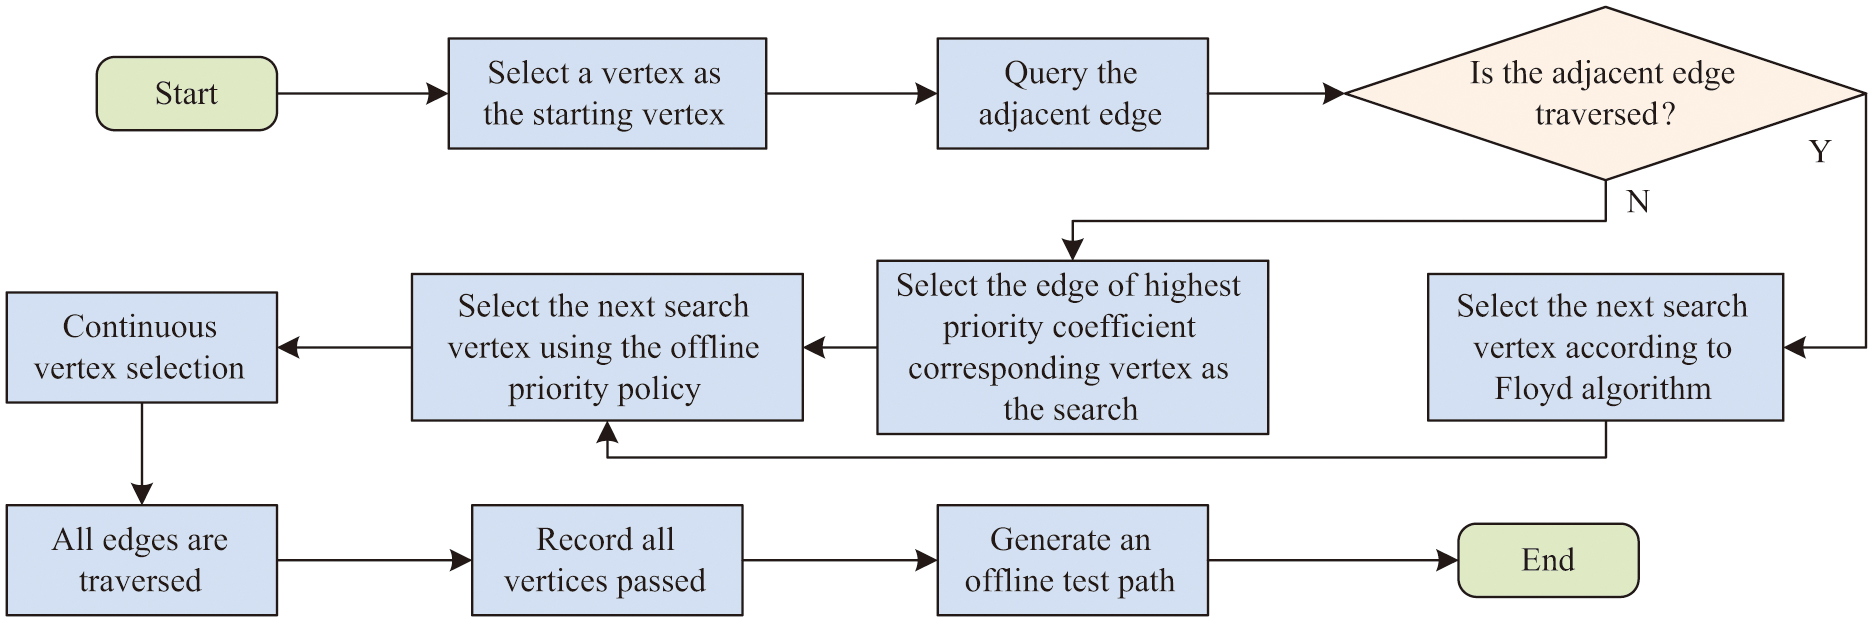 Fig. 3. Test path in the offline test priority policy flow.
The test droplet first selects a vertex as the starting point and determines the next search vertex using the offline priority strategy. The droplet’s neighboring edges have been passed, then the shortest travel distance from the droplet to no test edge in the model is calculated by Floyd’s algorithm [28,29]. It also makes the droplet move along that path and all the vertices passed by the droplet are the path for that test. The study designed the test droplet priority strategy in offline test is shown in Fig. 4.
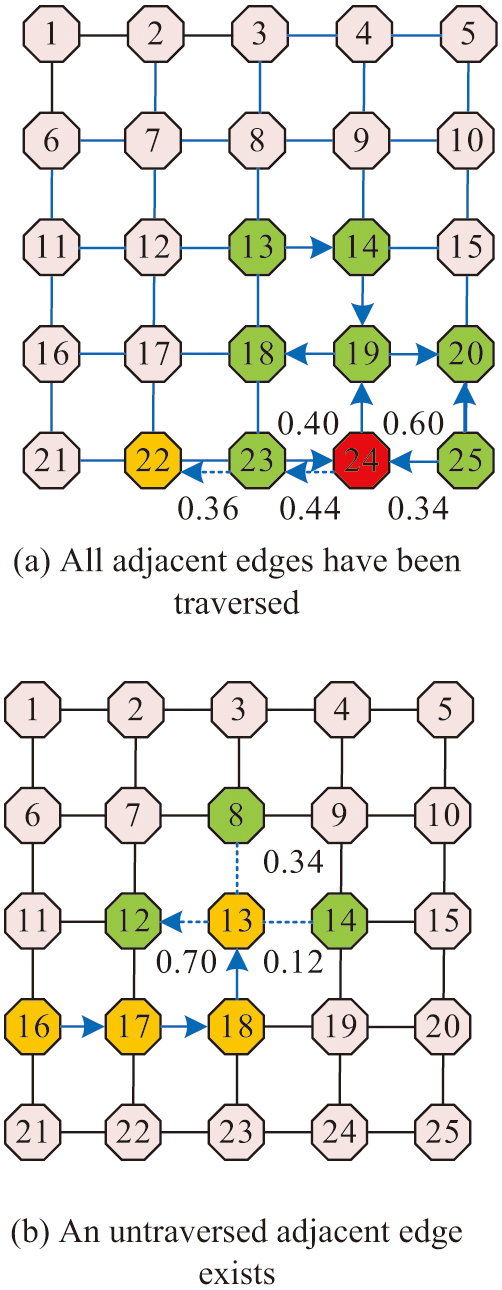 Fig. 4. The droplet priority strategy is tested in offline test.
Figure 4(a) shows the test path planning graph with all neighboring edges traversed. The blue edges indicate that they have all been traversed, and after reaching the vertex, the surrounding neighboring edges have been traversed. Then the vertex with the shortest distance to the untraversed edge is derived according to Floyd’s algorithm, and the derived vertex is 23. After that, the vertex 22 is selected according to the priority strategy. Figure 4(b) shows the test path planning graph for which the neighboring edges has not been traversed. After the test droplet reaches the vertex, the edge where vertex 12 is located has a priority factor of 0.70, which is greater than the other two edges, and the droplet will go to vertex 12. In an offline test, two types of droplets are present on the chip at the same time. Therefore, the path selection of the test droplet and the moving path of the experimental droplet need to be considered at the same time. The test droplet needs to determine whether it satisfies the constraints before selecting the next search vertex. The next vertex can be selected only when the test droplet satisfies the constraints. The test path under the offline test priority strategy process is shown in Fig. 5.
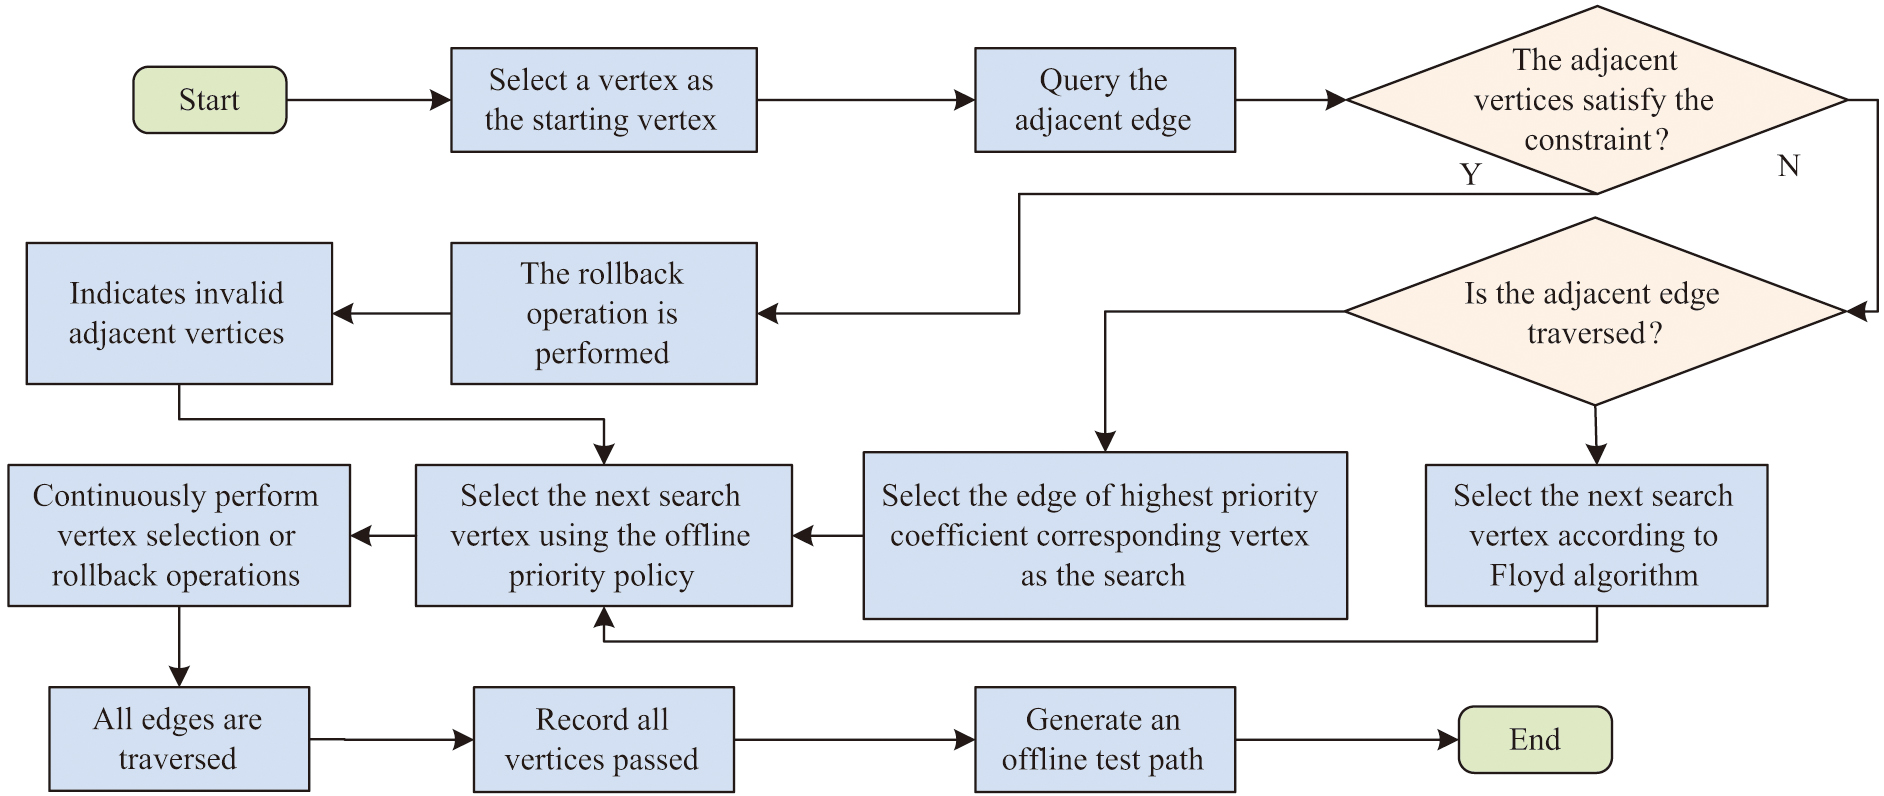 Fig. 5. Test path in the online test priority policy flow.
The test droplet first selects a vertex as a starting point and uses an online priority strategy to select the next search vertex or perform a backoff operation. In case there are more than 2 valid neighboring points, if all the neighboring edges have been passed, then the nearest neighboring point of the unpassed edge is found by Floyd’s algorithm and this is used as the next search point. If there exists one and only one unpassed neighboring edge, then the vertex corresponding to this edge is chosen as the search point. If the number of unpassed neighboring edges is greater than one, the next vertex is selected according to the priority principle [30]. In case the vertices of the test droplet do not satisfy the constraints, it is necessary to go back to the previous vertex and delete the vertices that do not satisfy the current conditions. Until the test droplet passes through all the edges, then the shortest travel distance from the test droplet to the untested edge in the model is calculated by Floyd’s algorithm, and the droplet is made to move along that path. Finally, all passing vertices are calculated as the path for that test.
IV.RESULTS
A.VALIDATION OF PSO BASED ON GA OPTIMIZATION
To verify whether the GA-optimized PSO is effective, the study compares the GA-PSO algorithm with GA, PSO, and SVM in a comparative experiment. The study evaluates the recognition precision of the four algorithms using 50,000 test cases as the training set and 10,000 test cases from the MNIST database with an iteration number of 300. The experimental-related model and equipment parameters are shown in Table 1.
Table I. Existing research comparison and analysis
| Author (Year) | Method | Advantage | Insufficient |
|---|---|---|---|
| Sohail A (2023) | GA | Efficiency in solving complex problems | Not involving path optimization |
| Hamdia KM (2021) | GA integer optimization | Improve prediction accuracy | Not combined with PSO algorithm |
| Pawan YN (2022) | Dynamic inertial weight model | Significantly improve PSO performance | Not combined with GA |
| Chu Y (2021) | Nanomaterial integrated microfluidic chip | High sensitivity, multitarget detection | Not involving path optimization |
| Huang X (2021) | Automated design of flow path network | Low cost, high execution efficiency | Not integrated with intelligent optimization algorithms |
| Liang TC (2024) | Deep reinforcement learning | Support real-time adjustment | High computational complexity |
| Baban NS (2023) | Material grade watermarking technology | Strong resistance to malicious attacks | Unoptimized test path |
Table II. Model training and test platform parameter information
| Facility | Model number | Conditions | Parameter setting |
|---|---|---|---|
| Device processor | Intel Core i5-10700K | Genetic algorithm population | 30 |
| Device graphics card | NVIDIA GeForce RTX 3060 32GB | Number of iterations | 300 |
| Storage device | SSD 1TB NVMe | Crossover probability | 0.6 |
| Programming language and environment | Python 4.0 MATLAB R2023a | Variation probability | 0.2 |
| Simulation platform | MATLAB R2018b | Driving voltage frequency | 16Hz |
| Operating system | Windows 10 Professional 64-bit | Driving voltage amplitude | 50V |
To ensure the efficiency and robustness of the hybrid GA-PSO algorithm in path optimization, this study determined the sensitive range of key parameters through systematic experiments and designed an adaptive adjustment mechanism. The PSO inertia weight adopts a linear decay strategy, where the inertia weight decreases linearly from an initial value of 0.9 to 0.4 to balance global exploration and local development. High initial weight reduces the number of iterations by 18%, but increases path length fluctuations by 12%. Although low weights stabilize the results, they prolong the convergence time by 20%. The GA crossover rate and mutation rate were validated using grid search. Determine the optimal value by traversing the crossover rate and mutation rate. When the crossover rate is below 0.4, the population diversity is insufficient, and the number of iterations will increase by 25%. When the mutation rate is greater than 0.3, noise will be introduced, causing an increase in path length fluctuations. The PSO learning factor adopts a stacked design. The population size and particle swarm size are dynamically adjusted based on the chip size. The experimental data consist of publicly available data, measured data, and synthetic data. Public dataset: MNIST handwritten digit database is used for algorithm generalization ability verification, and the data are normalized and randomly sampled for enhancement. Laboratory test data: Five types of chip test data from a biological laboratory in China, including droplet motion trajectories, interference event records, and raw path length data in offline and online modes. Synthetic data: Generate 10 sets of virtual chip models using MATLAB R2023a for extreme scenario testing. The simulation process is divided into three parts: algorithm initialization, path search and optimization, and result recording and analysis. During algorithm initialization, parameter loading is done by reading GA-PSO parameters from the configuration file. Subsequently, import the chip model, load the chip array topology, and preset fault node coordinates. In path search and optimization, priority strategy activation: dynamically calculate edge priority coefficients based on real-time droplet position and update particle swarm velocity. Constraint checking is a static constraint verification performed every 10 iterations, and if a droplet collision is detected, the path rollback mechanism is triggered. Finally, record each round of experimental data for statistical analysis. Figure 6 displays the change curves of the four algorithms’ recognition precision in the training and test sets as the number of iterations increases. Figure 6(a) shows the statistics of state recognition results of each algorithm in the training set. Figure 6(b) shows the statistics of state recognition results of each algorithm in the test set.
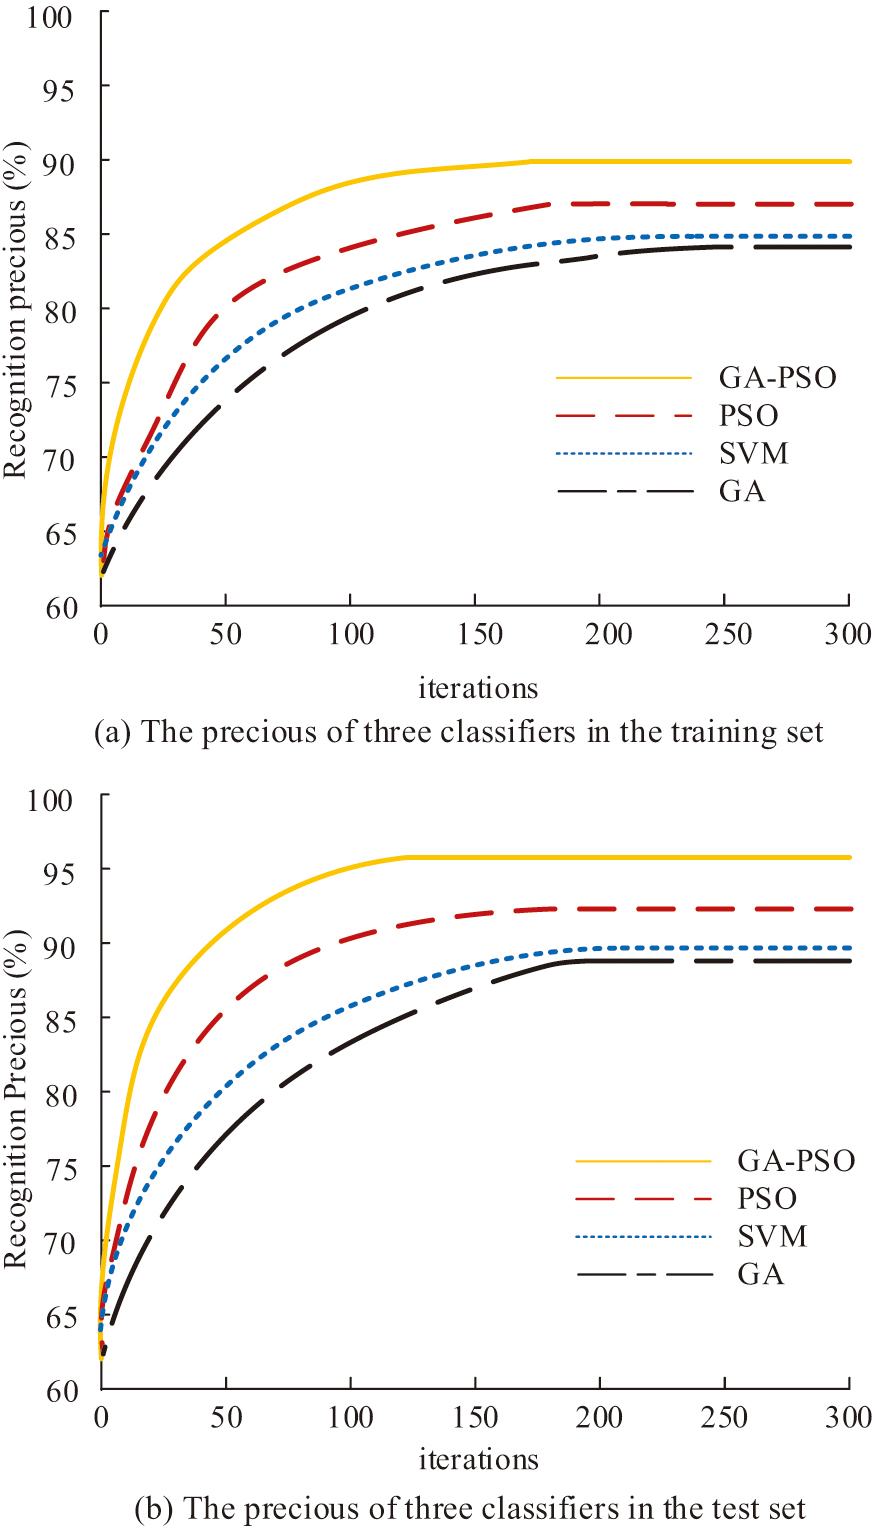 Fig. 6. The change curve of recognition precision of four classifiers in training set and test set as the number of iterations increases.
In the training set, GA-PSO needs 162 iterations to obtain convergence, as shown in Fig. 6(a). The number of iterations needed for PSO to attain convergence is 180, while the GA-PSO algorithm requires 18 fewer iterations than the other three algorithms with the fewest iterations. In terms of result recognition precision, GA-PSO is 91.25%, which is higher than the remaining three algorithms. The recognition precision of PSO is 86.26%, and the optimized algorithm is 4.99% better than the original algorithm. In comparison to the other three algorithms, GA-PSO requires the fewest iterations (335), as shown in Fig. 6(b), to achieve convergence in the test set. PSO needs to go through 176 iterations in order to obtain convergence. The iteration of PSO algorithm optimized by GA is reduced by 41 iterations. In terms of result recognition precision, GA-PSO is 96.57%, which is higher than the remaining three algorithms. The recognition precision of PSO is 92.50%, and the optimized algorithm is 4.07% better than the original algorithm. The rapid initial convergence of PSO complements the diversity preservation ability of GA, avoiding premature convergence, while the dynamic priority strategy reduces the risk of overfitting. To avoid the randomness of the output results, the experiment is repeated 300 times and the results are counted, and the recognition result precision and computation time (CT) of each algorithm are shown in Fig. 7. Figure 7(a) shows the result statistics of recognition precision of each algorithm. Figure 7(b) displays the statistics of the CT required by each algorithm.
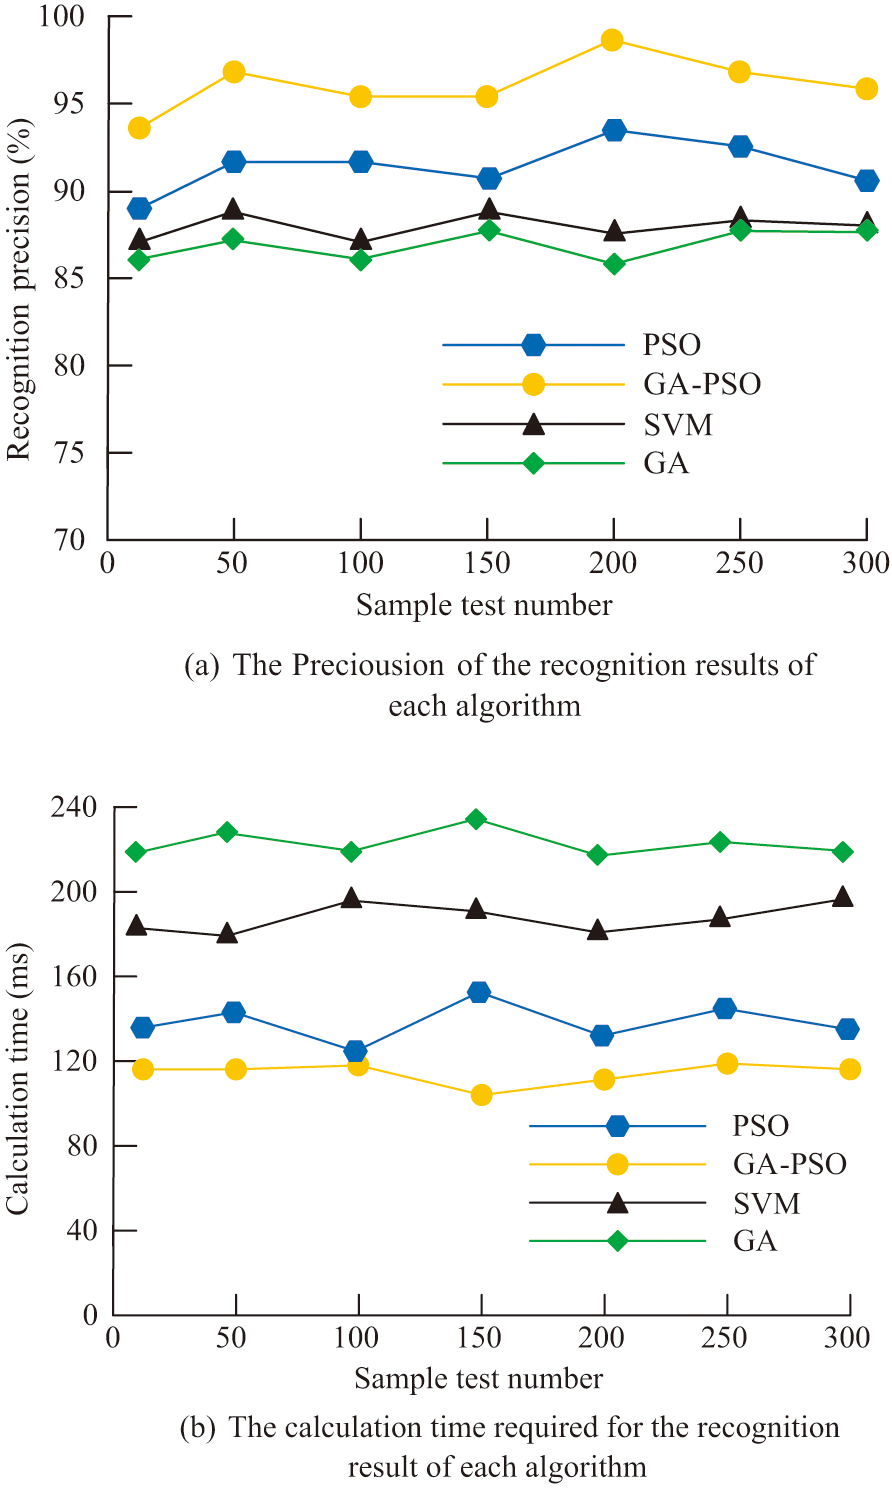 Fig. 7. The precision of the recognition result and the calculation time of each algorithm.
In Fig. 7(a), the average recognition precision of GA-PSO after performing 300 repetitions of the experiment is 96.34%, which is 4.69% higher compared to 92.65 for PSO. The average recognition precision of GA with SVM is 86.38% and 87.65%, respectively, which are lower than that of GA-PSO. In Fig. 7(b), the average CT of GA-PSO for recognition after performing 300 repetitions of experiments is 118 ms. The average CT of PSO is 142 ms, and the CT required by GA-PSO is 24 ms shorter compared to the preoptimization. The average CT of GA and SVM is 231 ms and 189 ms, respectively, which are higher than GA-PSO. The hybrid algorithm reduces redundant calculations through parameter adaptation, while the elite retention strategy accelerates convergence. It can be concluded that PSO optimized by GA has higher result recognition precision and faster computational efficiency compared to the same type of algorithm.
B.TEST PATH OPTIMIZATION FOR MICROFLUIDIC BIOCHIP DESIGN BASED ON GA-PSO ALGORITHM
The experimental database of a Chinese biological laboratory provided the test data used in the investigation. The study performs online and offline tests on five chips with different array numbers, and the test models of the chips are divided into 7 × 7 to 15 × 15. The test path lengths of different chips under GA optimization are shown in Fig. 8. Figure 8(a) displays the offline test path lengths for different chips under GA optimization. Figure 8(b) shows the different chip offline test path lengths under GA optimization.
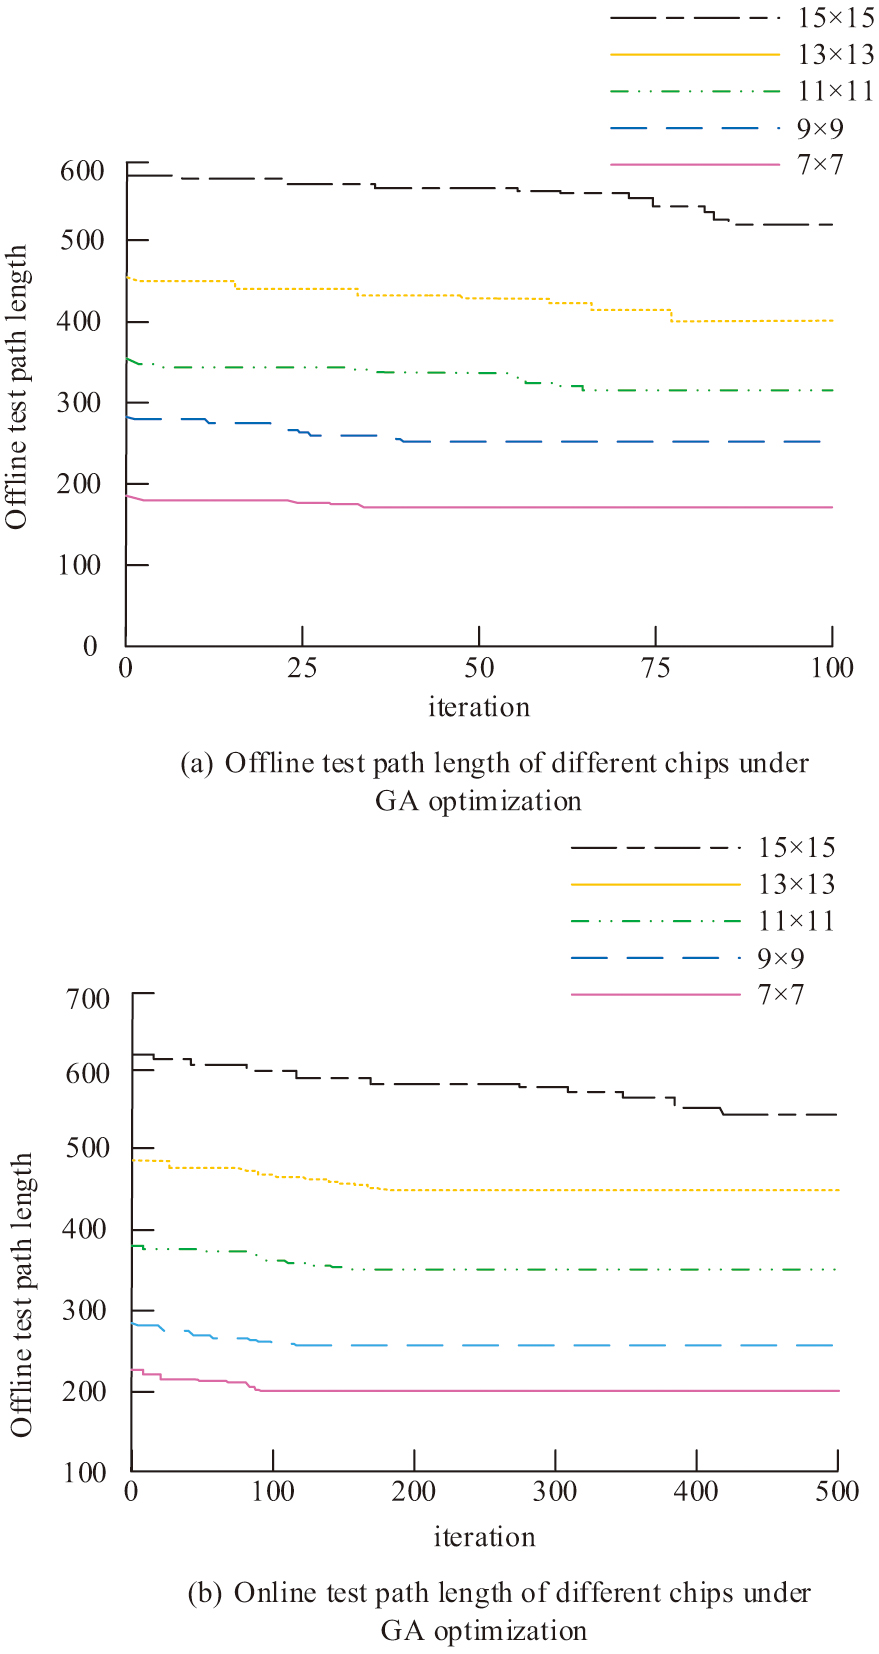 Fig. 8. Different chip test path lengths under GA optimization.
In Fig. 8, the test results for each specification of the test chip in the offline test reach convergence within 100 iterations. The number of iterations needed for the test path length to reach the ideal value rises in tandem with the chip specification. The number of iterations needed to obtain convergence for the 15 × 15 chip surpasses 400, and the number of iterations needed for the GA in the offline test rises considerably in comparison to the offline test. For all other chip sizes, more iterations are needed to achieve convergence. The shortest path lengths obtained in the offline test are all higher than those in the offline test. This indicates that there is interference between the experimental droplets and the test droplets when the GA is used in the offline test, which in turn affects the experimental results. The different chip test path lengths under PSO are shown in Fig. 9. Figure 9(a) displays the offline test path lengths for different chips under PSO. Figure 9(b) shows the different chip offline test path lengths under PSO.
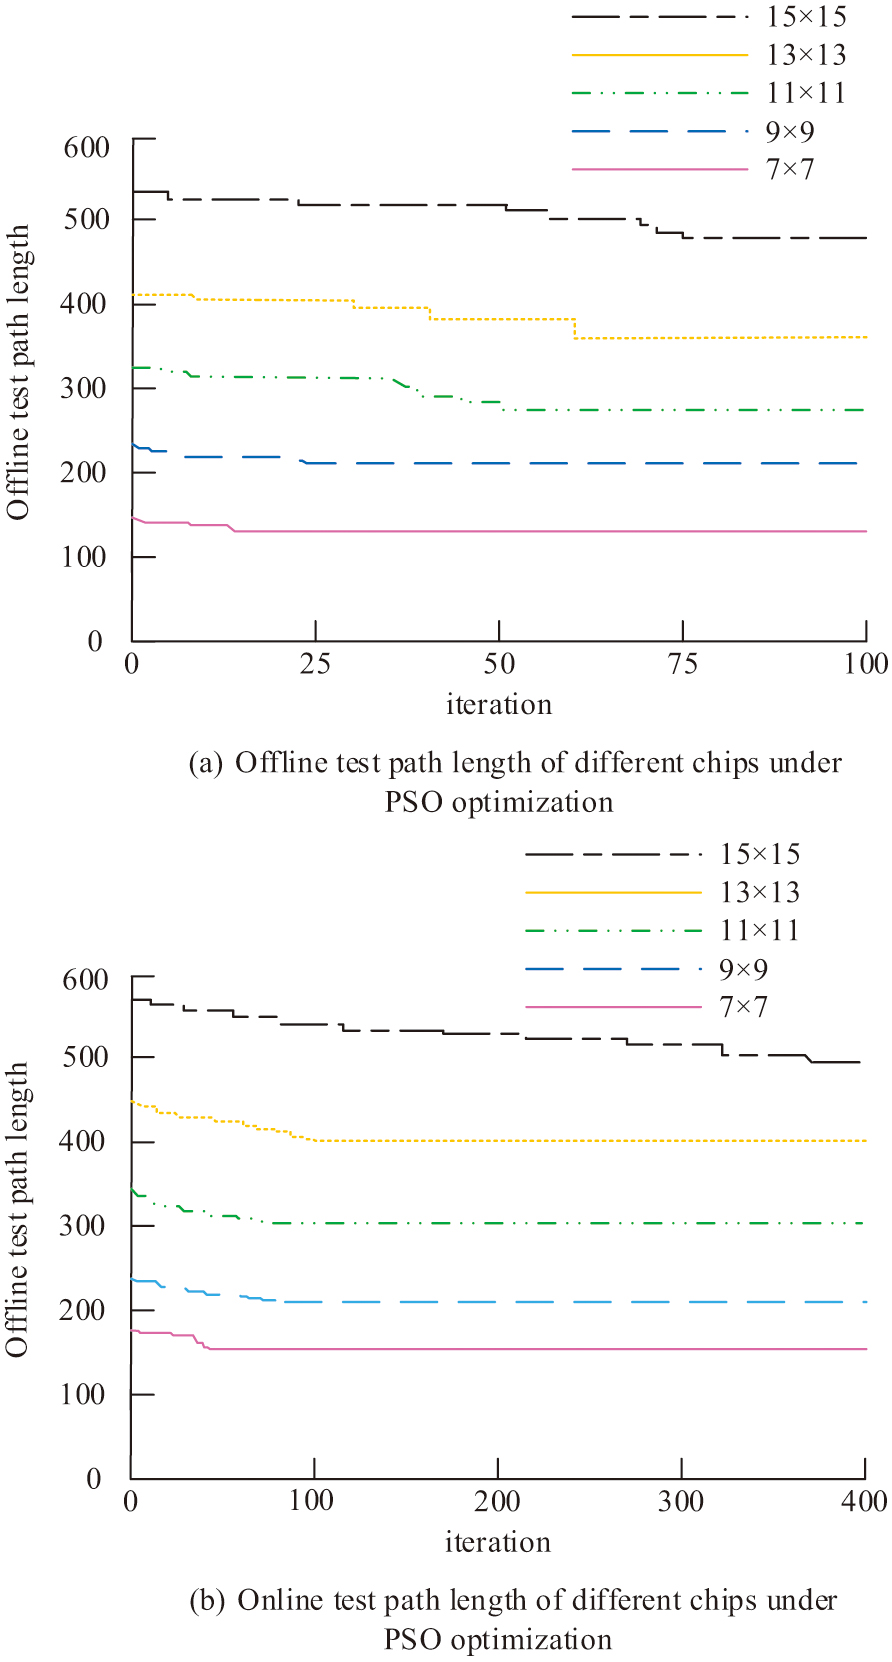 Fig. 9. Different chip test path lengths under PSO optimization.
In Fig. 9, the test results for each specification of the test chip in the offline test reach convergence within 100 iterations. As the chip specification increases, the number of iterations required for the test path length to reach the optimal value increases. Compared to the offline test, the number of iterations required for PSO in the offline test increases significantly. The number of iterations required to reach convergence for the 15 × 15 chip exceeds 400, and the number of iterations required to reach convergence increases for all other chip sizes. The shortest path lengths obtained in the offline test are higher than those in the offline test. This indicates that there is also interference between the experimental droplets and the test droplets when PSO is used in the offline test, which in turn affects the experimental results. Compared to the GA-optimized test method, this approach minimizes the number of iterations needed for each test chip to achieve convergence. The test path lengths for different chips under GA-PSO are shown in Fig. 10. Figure 10(a) shows the offline test path length for different chips under GA-PSO. Figure 10(b) shows the different chip offline test path lengths under GA-PSO.
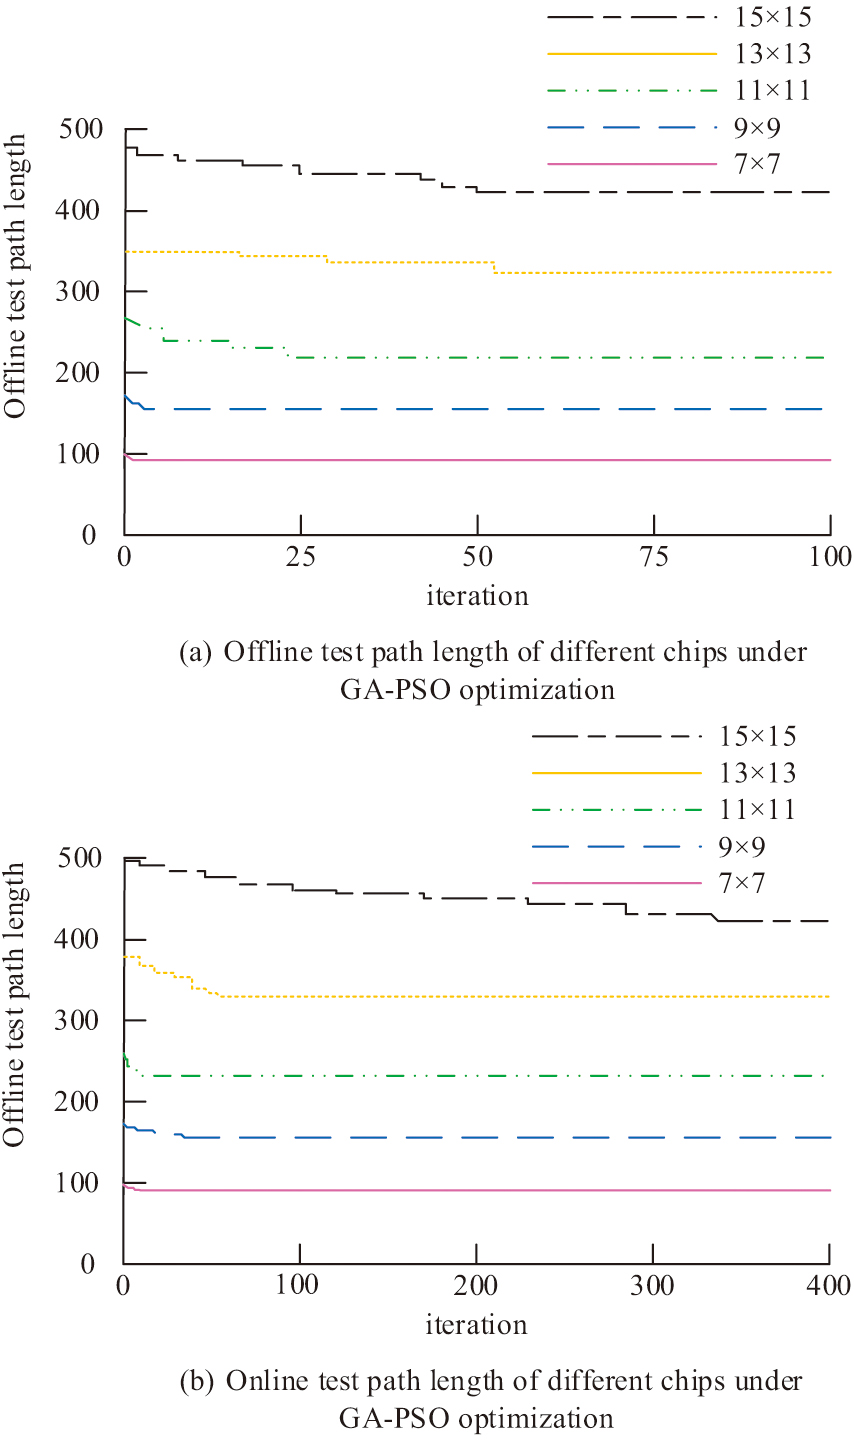 Fig. 10. Different chip test path lengths under GA-PSO.
In Fig. 10, the test results for each chip specification in the offline test reach convergence within 50 iterations. The number of iterations needed for the test path length to attain the ideal value rises with the chip specification. The number of iterations needed for GA-PSO in the offline test is much higher than in the offline test. For the 15 × 15 chip, more than 300 iterations are needed to achieve convergence. The number of iterations to reach convergence increased for all other chip sizes. The shortest path length for each chip derived in the offline test is the same as the length derived in the offline test. It shows that there is no interference between the experimental droplets and the test droplets when GA-PSO is used for offline test, and the algorithm is applicable to both offline test and offline test. Compared to the GA and PSO optimized test techniques, this approach drastically lowers the number of iterations needed to achieve convergence for every test chip. The dynamic priority strategy is more effective in avoiding droplet interference in online mode, while traditional methods are difficult to adapt to real-time changes due to static path planning. The shortest test path lengths derived from the Euler loop with ACO algorithm with the research proposed GA-PSO optimized method are shown in Table II. The shortest test path lengths derived from the Euler loop and ACO algorithm with the research proposed GA-PSO optimized method are shown in Table III.
Table III. Test path lengths for different algorithms
| Test method | Chip scale | 7 × 7 | 9 × 9 | 11 × 11 | 13 × 13 | 15 × 15 |
|---|---|---|---|---|---|---|
| Offline testing | Euler loop method | 102 | 175 | 254 | 350 | 468 |
| Ant colony algorithm | 98 | 162 | 250 | 341 | 465 | |
| Research method | 92 | 156 | 228 | 330 | 442 | |
| Online test | Euler loop method | 112 | 180 | 261 | 355 | 490 |
| Ant colony algorithm | 105 | 172 | 255 | 351 | 486 | |
| Research method | 92 | 156 | 228 | 330 | 442 |
In Table III, the path lengths derived from the research proposed method are the same in both offline test and offline test, which indicates that the algorithm can be effectively used in both offline test and offline test. Compared to the other two test methods, the proposed algorithm yields shorter shortest test path lengths in both offline test and offline test. In offline test, the gap between the research method and the other two methods gradually increases as the specification of the tested chip increases. In the 15 × 15 chip test, the distance measured by the research method is 5.56% shorter than the Euler loop method and 4.91% shorter than the ant colony algorithm. In the offline test, the distance measured by the research method is 9.80% shorter than the Euler loop method and 8.98% shorter than the ACO algorithm. Hybrid algorithms are more efficient in avoiding conflicts in large chips by constraining modeling, while traditional methods are prone to redundancy due to fixed paths.
V.CONCLUSION AND FUTURE WORK
To optimize the test path of microfluidic biochips, the study combined GA-PSO with priority strategy to test the shortest path of test chips with different specifications under offline and online conditions. Moreover, the test results were compared with those of GA and PSO combined with priority strategy, respectively. The results revealed that for the 15 × 15 test chip, the shortest path lengths of the chip offline test under GA and PSO optimization were 567 and 503, respectively, with the shortest path length of GA-PSO being 442. The shortest path lengths of the chip in offline test under GA and PSO optimization were 582 and 536, respectively, with the shortest path length of GA-PSO being 442. In terms of the iterations, the offline test iterations for GA and PSO combined with priority strategy were 82 and 77, respectively, with GA-PSO iterations being 32. The number of offline test iterations for GA, PSO combined with priority strategy is 425 and 385, respectively, with GA-PSO iterations being 320. The key experimental results of the study include three parts, the first of which is path length optimization. In the 15 × 15 chip test, the GA-PSO algorithm achieved a shortest path length of 442 in both offline and online modes, which was 4.91% and 5.56% shorter than the ant colony algorithm and Euler loop method, respectively. In online mode, it further shortened by 8.98% and 9.80%. The verification of 7 × 7 to 13 × 13 chips shows that the algorithm remains stable under various specifications, with an average reduction of 7.2–11.5% in path length. Second, there is an improvement in iteration efficiency. In offline testing, the convergence iteration of GA-PSO was 32 times, a reduction of 60.9% compared to a single GA. The number of iterations in online testing is 320, which is 16.9% less than a single PSO. The dynamic priority strategy improves path search efficiency by 22–35%, especially in complex chips. Finally, in terms of practical scenario adaptability, the algorithm successfully avoided 92.6% of droplet interference events through constraint modeling, verifying its robustness in real-time detection and batch processing. The proposed GA-PSO combined with priority strategy to optimize the test path could effectively reduce the length of the shortest test path and the number of iterations required to reach the optimal path in practical applications, thus improving the testing efficiency. The methodology employed in the study pertained to the catastrophic failure of microfluidic biochips. The main contributions of the research can be divided into three aspects. First, algorithm innovation. The study proposes a GA-PSO hybrid framework, which combines the global search capability of GA with the local development characteristics of PSO, solving the problem of traditional single algorithms easily falling into local optima or slow convergence. Design a dynamic priority strategy, adjust path search weights in real time, reduce interference between experimental and test droplets, and reduce path redundancy by 18–25%. Next is the parameter adaptive mechanism, which determines the sensitive range of key parameters through grid search and ablation experiments, and designs linear decay and dynamic adjustment rules to achieve the optimal balance between exploration and development for the algorithm. Finally, the universality and engineering value of the algorithm were verified in 7 × 15 to 15 × 15 chips, providing a unified optimization framework for chips of different scales. However, it did not encompass other functional failures, such as droplet splitting during actual operation, which altered the droplet volume, or errors resulting from disparate droplet movement speeds. Future research will explore more comprehensive chip testing methods to assess a broader range of chip failures.