I.INTRODUCTION
In the process of continuous development of society, the pressure faced by people gradually increases. While the pressure increases, the inability to vent emotions may lead to a series of mental health problems [1]. Psychological crisis is a serious mental health problem that may lead to serious consequences and even endanger life [2]. In recent years, with the increasing pressure of medical students’ academic pressure, employment pressure, and clinical internship pressure, the problem of psychological crisis among medical students has become increasingly prominent [3]. The traditional methods of psychological crisis identification often rely on questionnaires, psychological interviews, and other means. Although these methods are effective, they have the disadvantages of being subjective and time-consuming [4]. Moreover, with the development of computer technology and artificial intelligence, more and more scholars began to devote themselves to the intelligent exploration of psychotherapy. To evaluate the effectiveness of the psychological diagnostic tool based on the large language model, Pellert et al. applied it to the corpus analysis of large language model. The corpus contained human authors’ personality, values, beliefs, and prejudices. It explored the validity of the measure by asking law schools to indicate their responses to a scale based on language modeling. The results indicated that the diagnostic accuracy of the language model in psychometrics for the psychology of textual expression reached 85.45% [5]. Nayan et al. conducted a structured online questionnaire survey on 2121 college students in Bangladesh in order to find out the best machine learning algorithm for predicting mental illness in college students. In this process, their machine algorithms such as support vector machine, random forest, and logistic regression were used to predict mental illnesses, respectively. The findings showed that random forest algorithm and support vector machine provided superior prediction results [6]. Christensen et al. proposed an exploratory graph analysis method based on network psychometrics in order to achieve accurate psychometrics. It performed Monte–Carlo simulations using community detection algorithms on the basis of this method. The simulation results showed that this graph analysis method combined with the Graphical Lasso method could realize higher accuracy psychometric measurements [7]. Exploring the impact of cognitive-behavioral therapy on psychiatry and psychotherapy, Bennemann et al. compared different machine learning algorithms using nested cross-validation and used the best models from these algorithms to analyze the influences of psychotherapy. The results showed that education level and age were significant influencing indicator data for the predictive accuracy of machine learning algorithms [8].
It has been suggested that improvements in posture and walking patterns may affect the brain neurotransmitters that trigger positive emotions and those associated with emotions. A growing body of research suggests that physical expression is as powerful as facial expression when conveying emotions [9]. Mahfoudi et al. systematically collected relevant studies from several disciplinary fields, including psychology, biomechanics, and computer vision, in order to quantify and reproduce movements that express emotions. The quantification of action expression was achieved by means of meta-analysis. The results showed that their quantitative data were of high value for psychological analysis [10]. Albohn et al. found that body gestures, visual scenes, and sounds can facilitate judgments of facial expressions or emotions. They conducted a series of practical experiments in order to explore whether body and facial emotion recognition can enhance recognition results by integrating common interest cues. The results showed that the integration effect could further enhance recognition accuracy in facial and body expressions with low emotional clarity [11]. Yu Meng et al. proposed an emotion recognition method based on prior knowledge and graph neural networks in order to perceive emotions from gait. The method fused gait features as spatio-temporal features and used graph neural network to learn emotion features for emotion recognition. The results indicated that the recognition accuracy of the method reached 85.2% [12].
In summary, the current AI-based psychotherapeutic approach mainly starts from psycho-emotional recognition and then develops corresponding intervention strategies. However, many students spend most of their time walking or maintaining a certain posture in their daily study and life. Therefore, walking patterns and postural characteristics provide new perspectives for the identification of emotional states [13]. However, there are relatively few studies combining walking patterns for emotion analysis, and the accuracy of the analysis results has a large room for improvement [14]. Moreover, current methods of recognizing psychological emotions have issues, such as limited data characteristics and inaccurate analysis results. Furthermore, the generalization performance of many methods is poor. This is because the scale of the dataset is limited and fails to cover diverse situations, resulting in the model’s difficulty in adapting to mood changes in different environments. Meanwhile, feature extraction technology still needs optimization to fully capture the subtle differences of complex emotions.
To address this situation, the study proposes a method for recognizing students’ emotional state and preventing psychological crisis based on integrated learning and walking pattern analysis. The method extracts the features of students’ walking patterns and realizes the recognition of their emotional states by using machine learning methods. It further realizes the psychological crisis assessment and assists teachers to give corresponding prevention programs. The research has solved the problems of single feature extraction and low recognition accuracy in traditional emotion recognition methods through the analysis of walking patterns. Furthermore, the research adopts the method of ensemble learning to further enhance the robustness and generalization ability of the recognition model. The innovation of the study is that the walking pattern of medical students is used as a characterization of their mental-emotional states, which opens up new ideas of mental state recognition. In addition, the study integrates the recognition results of multiple machine learning models through the integrated learning algorithm. It further improves the recognition accuracy of psychological states and provides more accurate and effective analysis results.
The rest of the paper is structured as follows. Section II provides a detailed description of the method for identifying the emotional states of medical students and preventing psychological crises. This method is based on ensemble learning and walking patterns, as proposed in the research. Section III is the experimental analysis section. It conducts a comparative analysis of research design methods and discusses their respective advantages and disadvantages. Section IV is the conclusion section. It summarizes the proposed research methods and experimental analysis results and presents prospects for future research.
II.PSYCHOLOGICAL STATE IDENTIFICATION AND CRISIS PREVENTION METHODS BASED ON INTEGRATED LEARNING AND WALKING PATTERN ANALYSIS
The study proposes a mental state recognition method based on integrated learning and walking pattern analysis. The method takes students’ walking patterns as the basic features for recognition, utilizes machine learning methods to achieve emotion recognition, and finally improves the recognition accuracy based on integrated learning.
A.WALKING PATTERN FEATURE EXTRACTION AND DATA PROCESSING
Existing emotion recognition methods based on electroencephalogram (EEG), voice, expression, etc., require the subjects to complete different test tasks or wear specific equipment, which has certain limitations in practical applications. In contrast, walking patterns are natural and unnoticeable physiological features that can be collected without affecting subjects’ normal activities. They can also accurately assess students’ psychological states in real time [15–17]. During the training data collection process, the study selects a total of 234 students from a Medical University as the data collection subjects. The experiment is formulated that the participants walk 10 m toward the camera each time and the video of the students’ walking is recorded. The video length contained at least one gait cycle.
To avoid potential biases in the data, the study uses a stratified sampling strategy. This strategy ensures that the samples covered students of different grades, academic performance levels, and family backgrounds. The strategy places particular emphasis on including groups that are easily overlooked, such as rural boarding students.
To obtain informed consent, a hierarchical approach to explanation should be adopted. For students, the research process should be explained using comic books. For parents, the use of data should be explained through video conferences. Both consent forms need to be electronically signed and verification records should be kept. Emotional induction is achieved by designing natural scenario tasks. For example, a 10-minute math competition can be arranged to simulate real exam pressure. Heart rate changes can be monitored simultaneously with a smart bracelet. Video data security adopts hardware-level encryption measures. The collection device is equipped with a face-blurring chip that achieves real-time desensitization. The storage server is located in an electromagnetic-shielded room and uses dual fingerprint and iris authentication. During the acquisition process, each participant recorded gait in four states: happy, angry, sad, and no special emotion. The specific acquisition process is shown in Fig. 1.
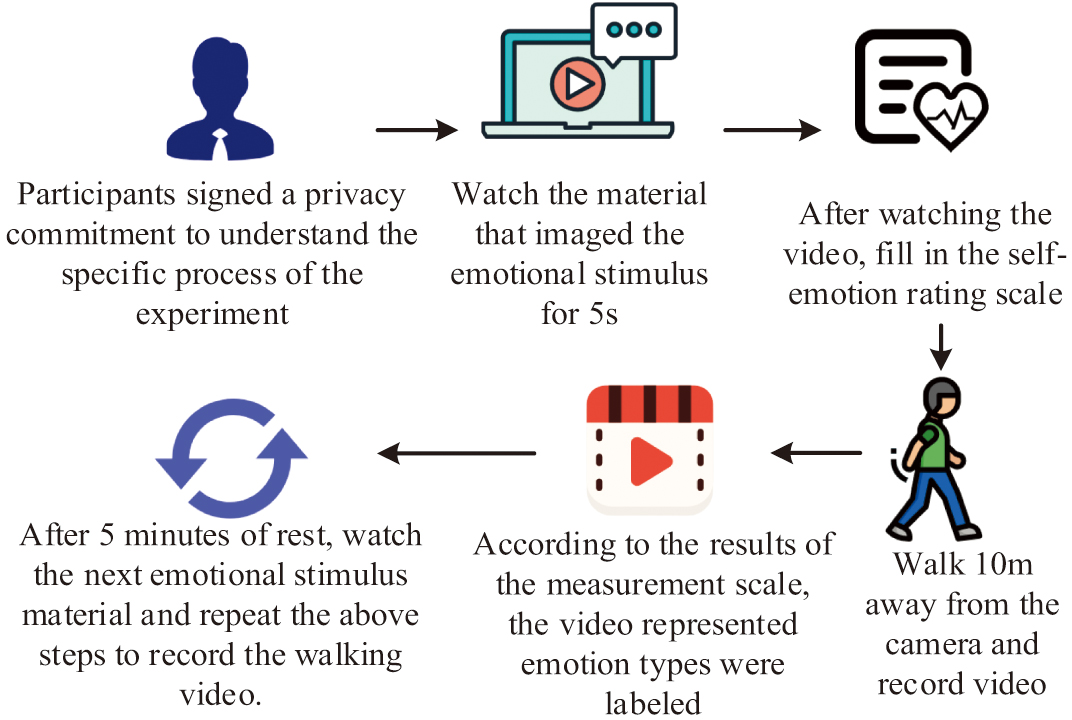 Fig. 1. Walking mode training data acquisition process.
In Fig. 1, the study presents participants with videos containing different emotional stimuli to elicit their emotions. After watching the videos, participants completed the self-emotion rating scale to assess their emotional state. Based on the test results, the walking mode video is recorded. Once the recording is finished, the video according to the test results is labeled. Then, the next state walking video is recorded 5 minutes later. To ensure the accuracy of recognizing subsequent psychological states, the research conducts three-dimensional feature extraction of walking patterns based on video images and two-dimensional features. At present, most two-dimensional feature extraction methods require the extraction of a large number of traditional features. These methods have low computational efficiency and low recognition accuracy [18,19]. In response to this, the study considers using the method based on pose estimation for two-dimensional feature extraction. The study extracts the topology of the shoulderless pose after ignoring the information of hand and head joint points through the BlazePose algorithm. The derivation process is shown in Equation (1):
In Equation (1), is the initial coordinate of the left shoulder joint. is the initial coordinate of the right shoulder joint. is the median value of the coordinates of the left and right joints. and are the coordinates of the left and right shoulder joints after movement, respectively. After extracting the obtained 2D feature, the study uses a convolutional neural network to convert the 2D walking pattern features into 3D features. The specific process is shown in Fig. 2.
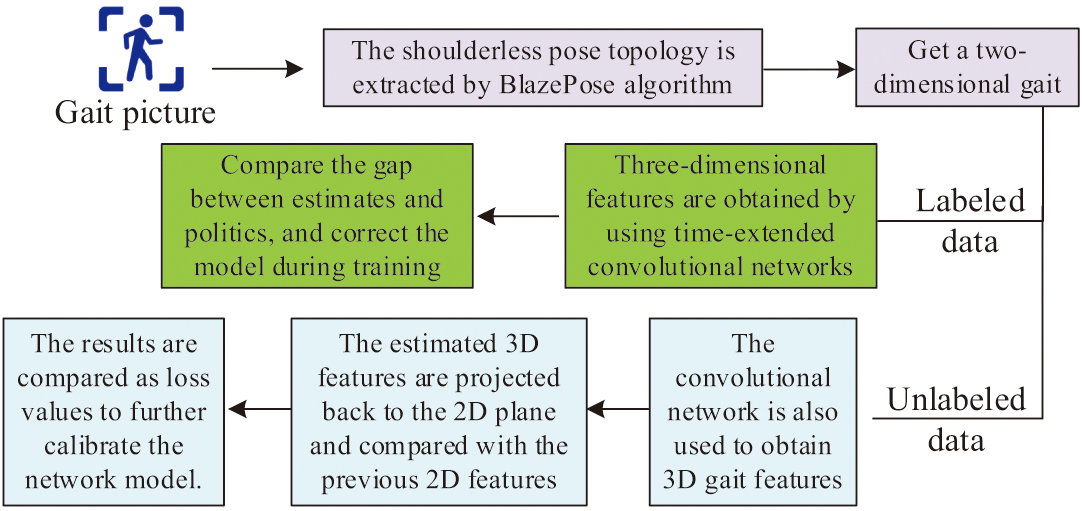 Fig. 2. The concrete process of conversion from 2D feature to 3D feature.
In Fig. 2, the research utilizes the designed expanded convolutional network to achieve the transformation from two-dimensional features to three-dimensional features. To improve the model’s accuracy further, the research divides the two-dimensional features into two categories during training: labeled and unlabeled data. For labeled data, the supervised learning method is used for training. For unlabeled data, feature extraction is carried out through self-supervised learning. The conventional dilation convolution will have some information loss; for this, the study sets the dilation convolution as a multi-scale structure [20,21].
The detailed process of converting 2D features to 3D features is shown in Fig. 3.
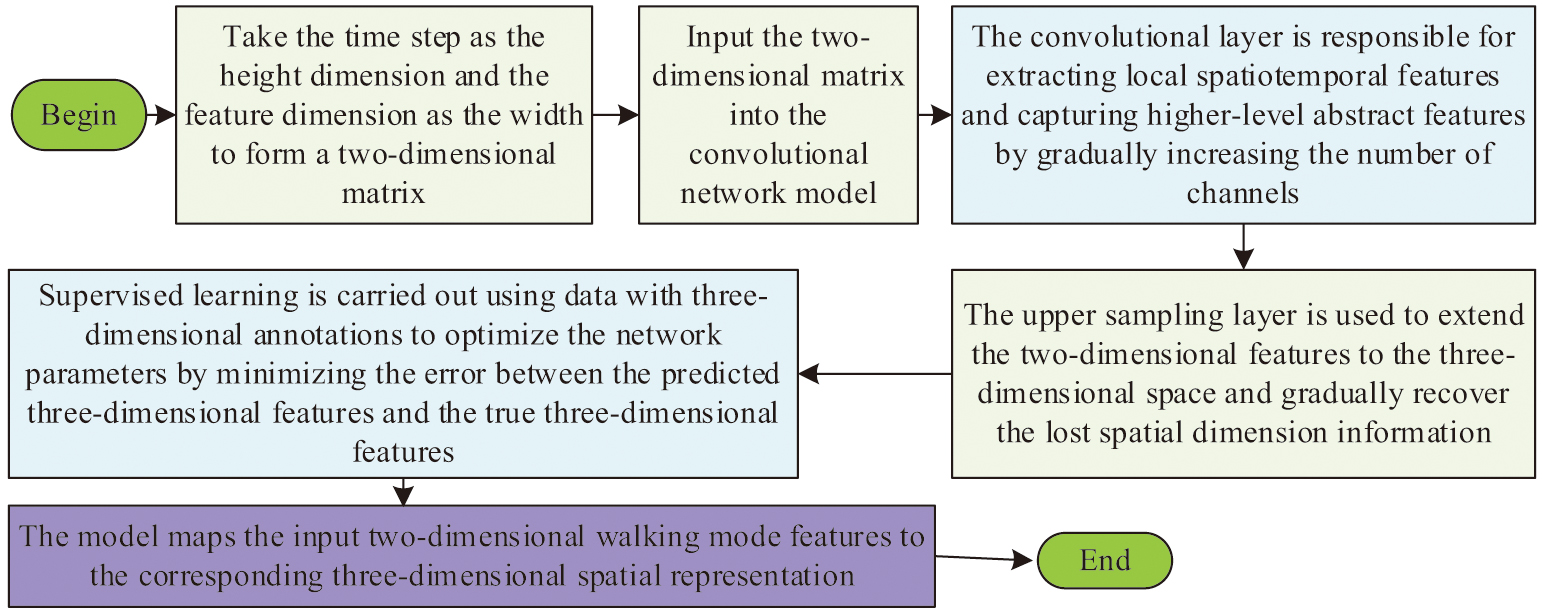 Fig. 3. The detailed process of converting 2D features to 3D feature.
Fig.ure 3 shows the first step of the study, which involves converting the two-dimensional features into a structure similar to an image. The time step is taken as the height dimension, and the feature dimension is taken as the width, forming a two-dimensional matrix. The next step is for it to be input into the convolutional layer. The convolutional layer gradually increases the number of channels to extract local spatio-temporal features and capture higher-level abstract features. The upper sampling layer is used to extend the two-dimensional features to the three-dimensional space and gradually recover the lost spatial dimension information. Supervised learning is conducted during the training process using data with three-dimensional annotations. This optimizes the network parameters by minimizing the error between the predicted and true three-dimensional features. Ultimately, the network is capable of mapping the input two-dimensional walking mode features to the corresponding three-dimensional spatial representation. It can achieve the feature transformation from two-dimensional to three-dimensional.
Dilated convolution expands the receptive field by increasing the interval between convolution kernels. The convolution layer is used to extract features. The dilation rate determines the size of the receptive field. The feature weights, on the other hand, reflect how much each feature influences the model output. The calculation of the dilation rate of the dilation convolution of each layer is shown in Equation (2):
In Equation (2), represents the dilation rate of each dilated convolution layer. represents the sequence number of the convolution layer. represents the initial dilation rate. The research ensures that the receptive field covers a wider area, reducing information loss by gradually expanding the field layer by layer. The study sets the number of layers of the dilation convolution to 4 and the size of the convolution kernel is 3 × 3. The structure of the dilation convolution designed by the study is shown in Fig. 4.
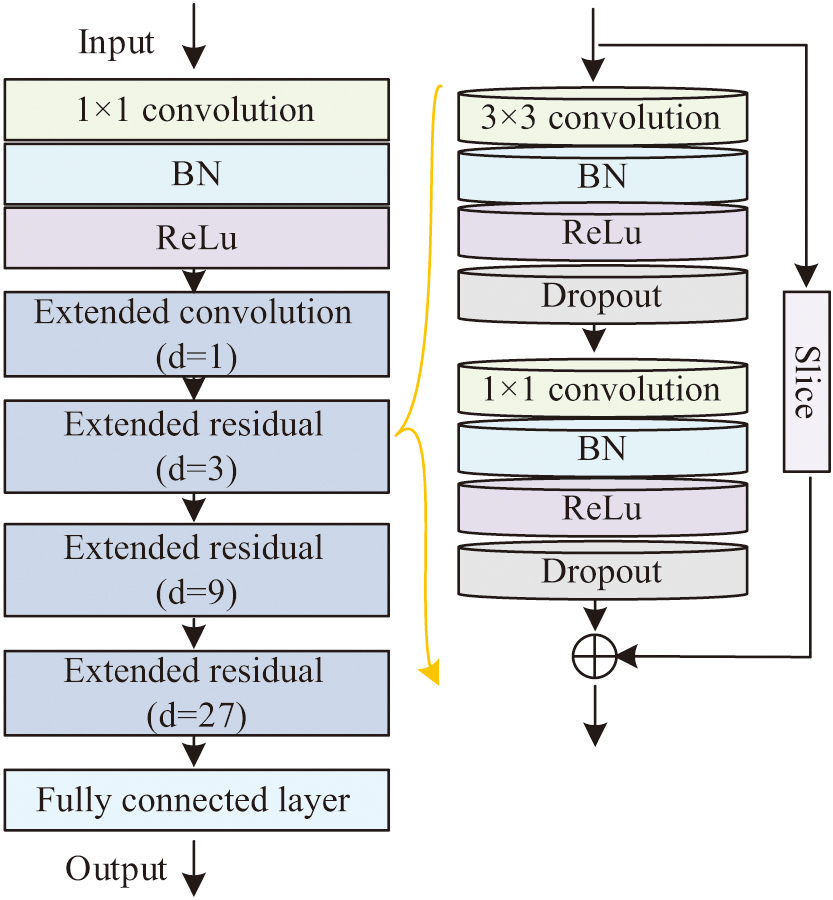 Fig. 4. Convolutional structures designed in this study.
In Fig. 4, the expanded convolution includes multiple convolution layers. Additionally, batch normalization layers and Rectified Linear Unit (ReLu) activation functions enhance the model’s stability and nonlinear expression ability. The ReLu activation function is shown in Equation (3):
In Equation (3), refers to the original data distribution. is the activation operation. is the output result after activation layer. After the above network layers, the data are fed into the dropout layer for random deactivation to prevent model overfitting. The method of applying the Dropout layer to calculate the selection probability of neurons is shown in Equation (4):
In Equation (4), and are the original and probabilistically calculated inputs to the neuron, respectively. is the final neuron after probabilistic selection. is the weight parameter. is the probability distribution state. is the bias value. In order to avoid degradation of the network layers, the study improves the time dilation convolution module by residual structure. The study leaves the first dilation convolution layer untouched and uses the residual structure for all the last three convolutions. Combining the above, the study utilizes the posture estimation algorithm and convolutional network to realize the feature extraction and data preprocessing of the walking pattern, which provides the database for the subsequent mental state recognition.
B.PSYCHOLOGICAL STATE RECOGNITION AND CRISIS PREVENTION BASED ON 3D FEATURE AND INTEGRATED LEARNING
After extracting the obtained features of walking patterns in different emotional states, the study applies them to the training and learning of the model. Before that, it is necessary to determine the features applicable to mental state recognition. The features selected for the study include three types: spatio-temporal features, joint kinematic features, and postural features. Among them, the postural features include the human body corner box volume, the angle feature, the distance feature, and the walking triangle area feature. The human body edge box volume is calculated as shown in Equation (5):
In Equation (5), is the body boundary frame volume. is the maximum coordinate value of the skeletal point in the three axes. is the minimum coordinate value of the skeletal point in the three axes. The included angle feature is an important indicator of individual differences in posture. By calculating the angles between each joint, the subtle changes during walking can be accurately captured. The calculation method of the included angle feature is shown in Equation (6):
In Equation (6), , , and are the coordinates of the three skeleton points involved in the pinched angle. is the value of the pinched angle, the points and are the endpoints, and is the corner point. In addition to the pinch angle feature and the edge box volume feature, the study uses the distance between specific joints as an important indicator for recognizing emotions. The triangle area feature, on the other hand, characterizes subtle changes in walking patterns by calculating the area of triangles formed by specific skeletal points. Two triangle area features are chosen to characterize emotions. These are the triangle area between the neck of the hand (Triangle 1) and the triangle area between the foot and hip (Triangle 2). The study choose the velocity of the right and left hands, the right and left feet, and the head for a total of five joint points as spatio-temporal features. For the kinematic features, the study used variable acceleration as an indicator. The study takes the higher-order derivatives of the acceleration to obtain the variable acceleration. The specific characterization of triangle area, boundary frame volume, angle feature, and distance feature is shown in Fig. 5.
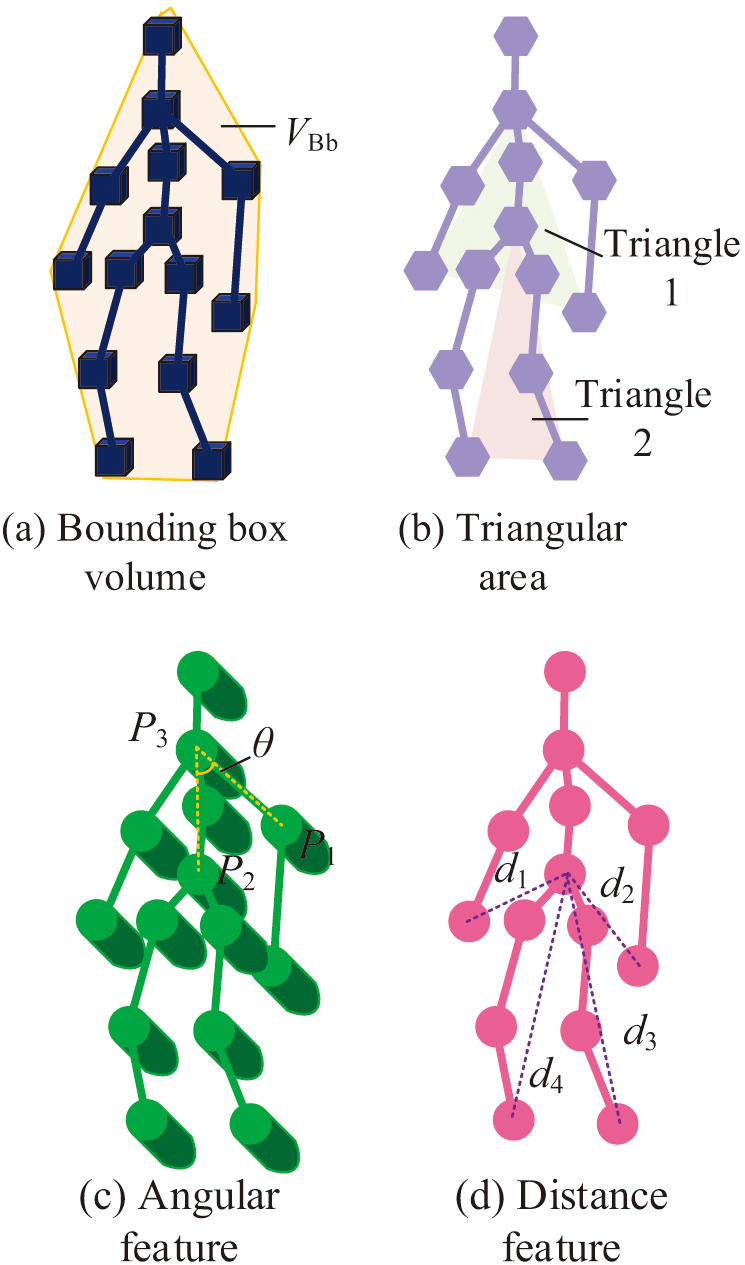 Fig. 5. The triangle area, boundary frame volume, angle feature, and distance feature are characterized.
Figure 5 shows that angular features are characterized by three skeletal points. Distance features are calculated from skeletal points of the lower body and reflect dynamic changes during walking. The characteristics of the triangular area are as follows. Triangle 1 is formed by the hand and neck of the upper limb. Triangle 2 is formed by the foot and hip of the lower limb. The changes in their areas reveal the influence of emotional fluctuations on gait. The study uses K-nearest neighbor (KNN), decision tree algorithm, and support vector machine totaling three classifiers to classify the four types of emotions. The KNN algorithm is simple and efficient and is suitable for small sample datasets. Decision trees are easy to understand and implement and can handle nonlinear relationships. Support vector machines perform well when dealing with high-dimensional data and can effectively distinguish different emotion categories. The choice of these three classifiers can leverage the strengths of each to improve the accuracy and robustness of emotion recognition. This ensures stable recognition of emotional states in different situations. Therefore, these three classifiers are selected as the weak classifiers for ensemble learning in the study. The ensemble learning strategy integrates their respective advantages to optimize emotion recognition further. The data distribution of each type of feature under the four types of emotions is shown in Fig. 6.
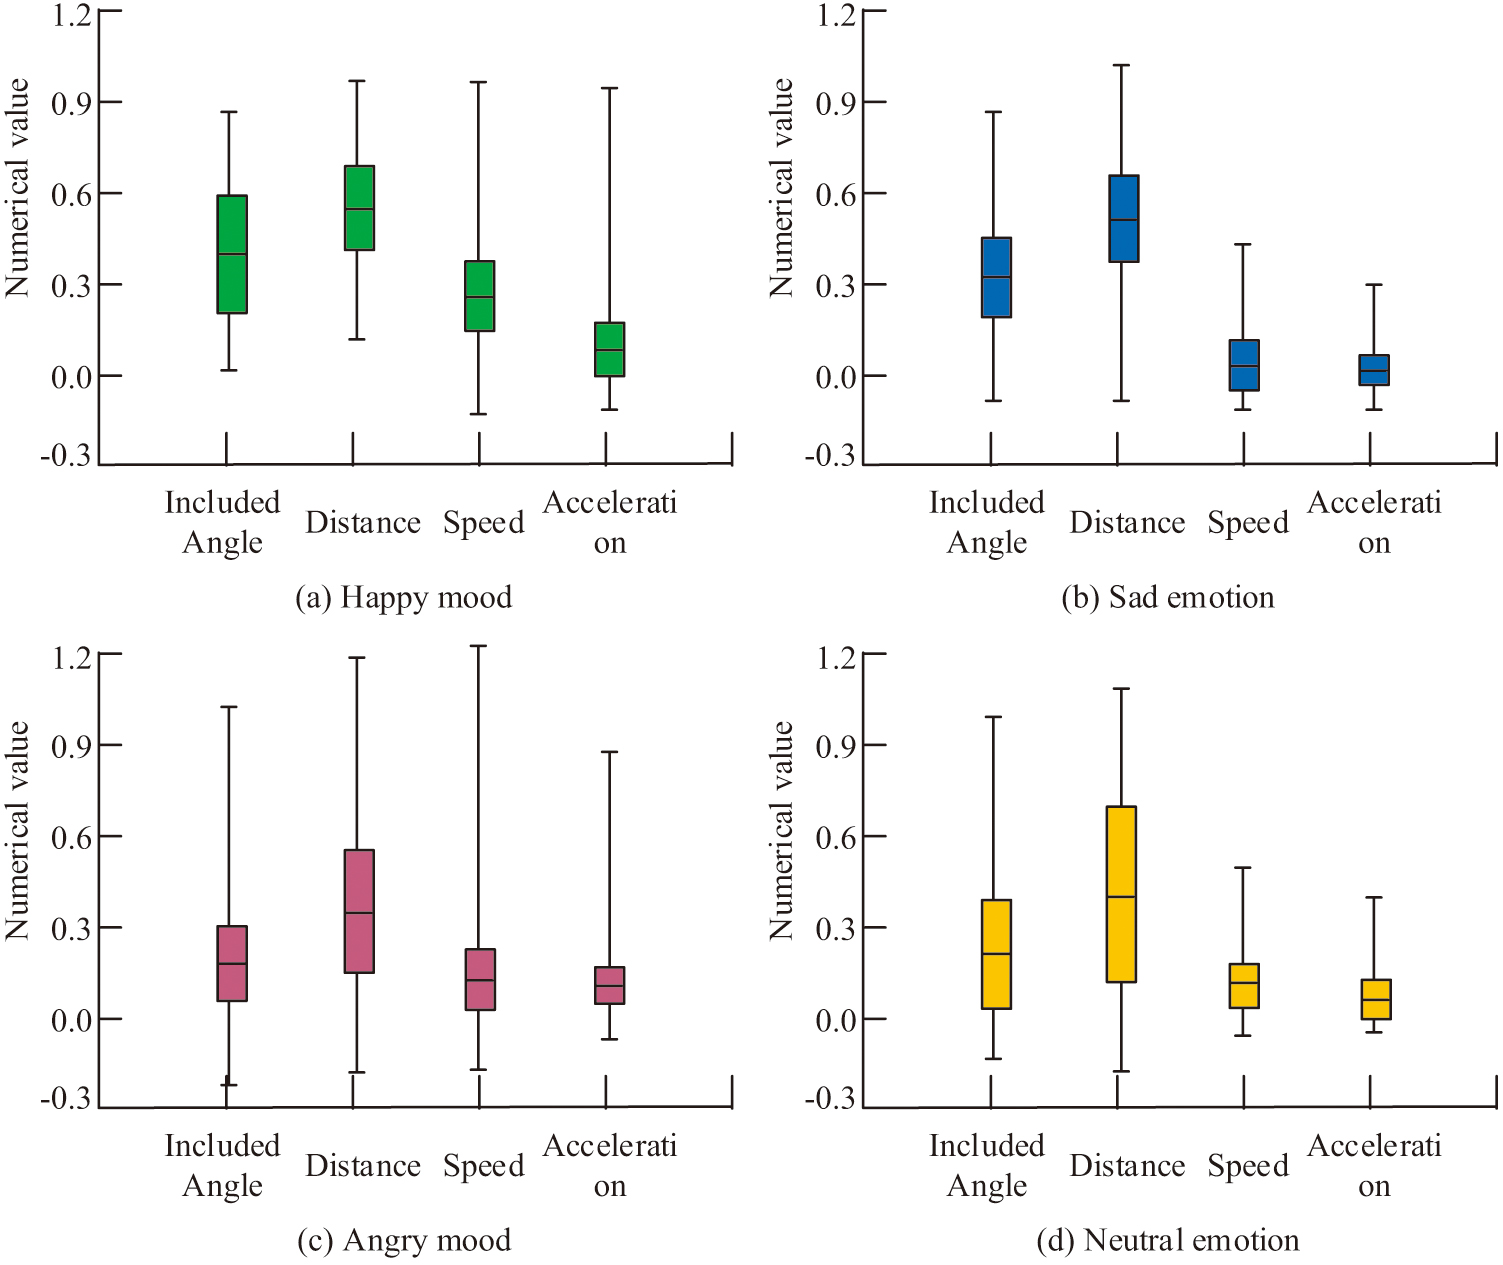 Fig. 6. Data distribution of various characteristics under four emotions.
In Fig. 6(a), in a happy emotional state, there is a significant increase in the participants’ upper and lower limb movement speed. In Fig. 6(b), under the sad emotional state, the participants’ movement speed decreases and the amplitude of their movement decreases accordingly. In Fig. 6(c), under the emotion of anger, there is also a relative decrease in the triangular area of their movements. In Fig. 6(d), under neutral emotion, all the metrics are at relatively intermediate values. To improve the accuracy of mental state recognition, the study ranks the various types of features in terms of scores and then assigns weights. The study utilizes the recognition results of various types of features and the F-score method to rank the importance according to the random forest. It is found that upper and lower limb velocity and variable acceleration are ranked in the top two. According to the ranking results, the weights of the six types of indicators are assigned as 1, 0.8, 0.6, 0.4, 0.2, and 0.1 in turn. To improve recognition accuracy, the study adopts adaptive boosting (AdaBoost), an integrated learning algorithm, to integrate the classification results of the three classifiers in order to obtain the final psychological state recognition results. The specific integration process is shown in Fig. 7.
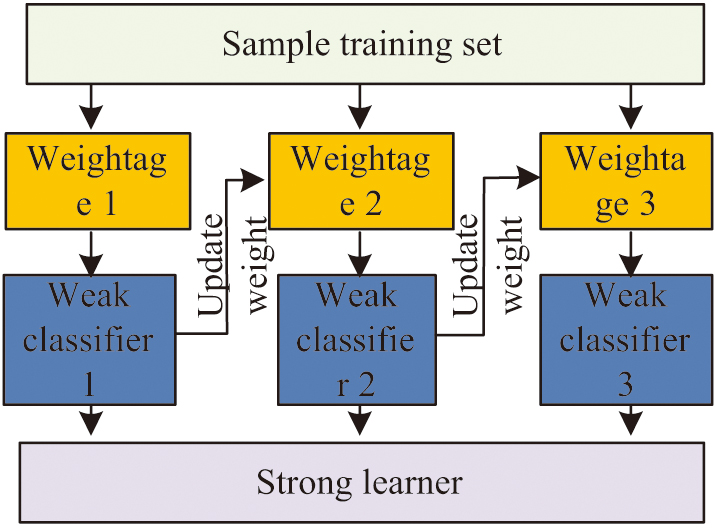 Fig. 7. The integrated learning process of each classifier.
In Fig. 7, the study calculates the weights of three weak classifiers based on their classification errors. The specific calculation method is shown in Equation (7):
In Equation (7), is the classification error rate of the weak classifier. is the weak classifier serial number. Finally, the study is provided to the corresponding teachers based on the identification results. Within 1 month of the detection cycle, if the emotional state of the same medical student shows more than 30% frequency of sadness or more than 40% frequency of anger, the system marks the student as an object of key concern and sends an early warning message to the counselor or the relevant teaching department.
Collecting the walking patterns of medical students involves issues such as privacy and data security. The research will introduce anonymization processes and informed consent mechanisms to ensure the legality and compliance of data collection. It will also establish strict permissions for accessing data to prevent information leakage. Meanwhile, regular ethical reviews are organized to assess the risks and benefits of technology application and ensure that students’ rights and interests are not infringed upon.
III.PERFORMANCE ANALYSIS OF PSYCHOLOGICAL STATE IDENTIFICATION AND CRISIS PREVENTION METHODS COMBINED WITH WALKING PATTERNS
To test the performance of the psychological state identification method proposed in the study and the effectiveness of its application in psychological crisis prevention, the study designs a series of experiments to analyze it.
A.PERFORMANCE ANALYSIS OF WALKING PATTERN FEATURE EXTRACTION MODELS
To improve the feature extraction accuracy of the walking pattern, the study obtains 2D information through 2D pose estimation and inputs it into a 3D network to realize feature extraction. To test the performance of the proposed feature extraction model, the study compares it with the classical pose from orthography and scaling with iterations (POSIT) algorithm and OpenPose algorithm. The average spatial error of each method for extracting the 3D coordinates of the keypoints is compared. The variation of the error values of the three methods under the training and test sets is shown in Fig. 8.
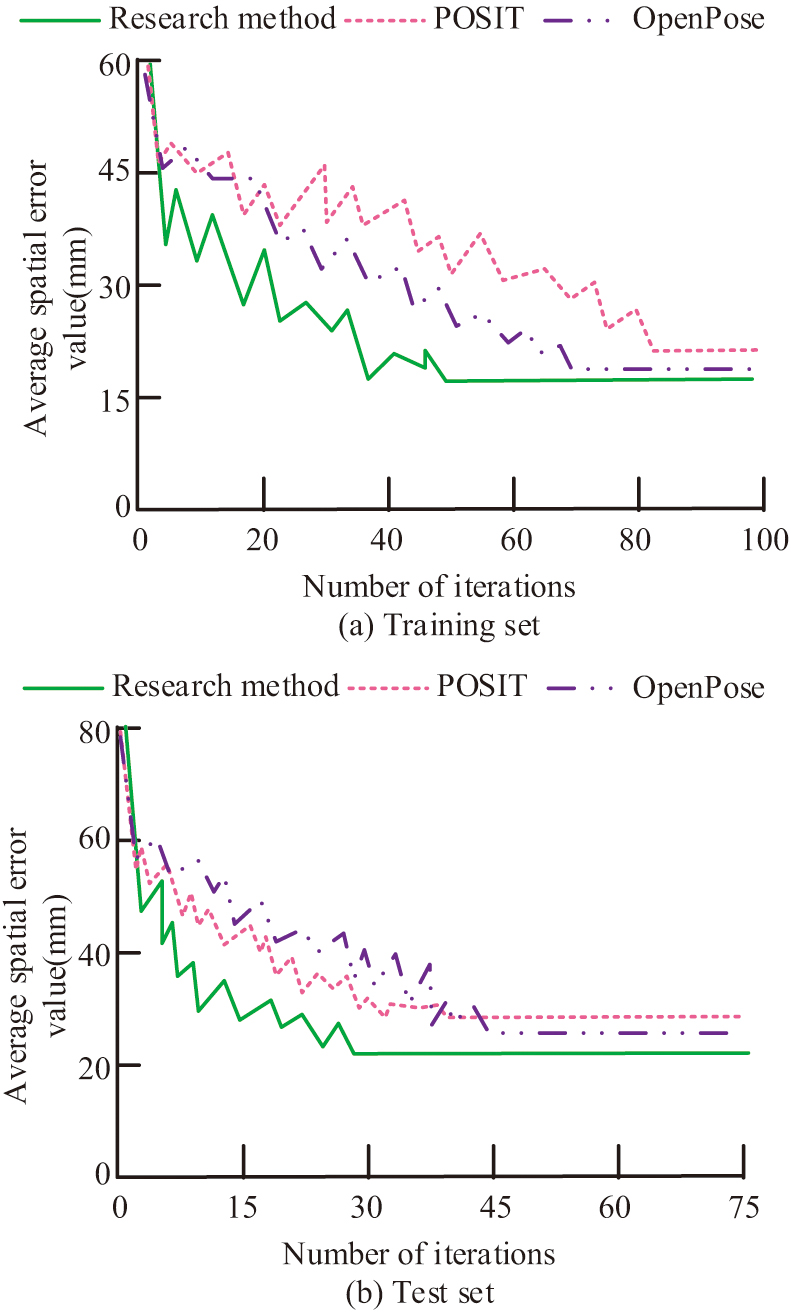 Fig. 8. Comparison of 3D attitude estimation effect of three methods.
In Fig. 8(a), the investigated method decreases rapidly in the first 20 iterations, stabilizes at the 50th iteration, and finally stabilizes around 21.02 mm. Compared to the other two algorithms that converge faster, its convergence value is lower. In Fig. 8(b), in the test set, the research method finally converges to 21.54 mm, which is significantly lower than the other two algorithms. It can be concluded that the proposed method of the study is able to achieve higher accuracy of attitude estimation with better convergence.
To determine the optimal dilation rate and the number of convolutional layer channels, the study compares the mental state recognition accuracy and average spatial error after applying the feature extraction method by varying the values of these two parameters. Meanwhile, the study uses the sensory field to characterize the dilation rate. The results are shown in Fig. 9.
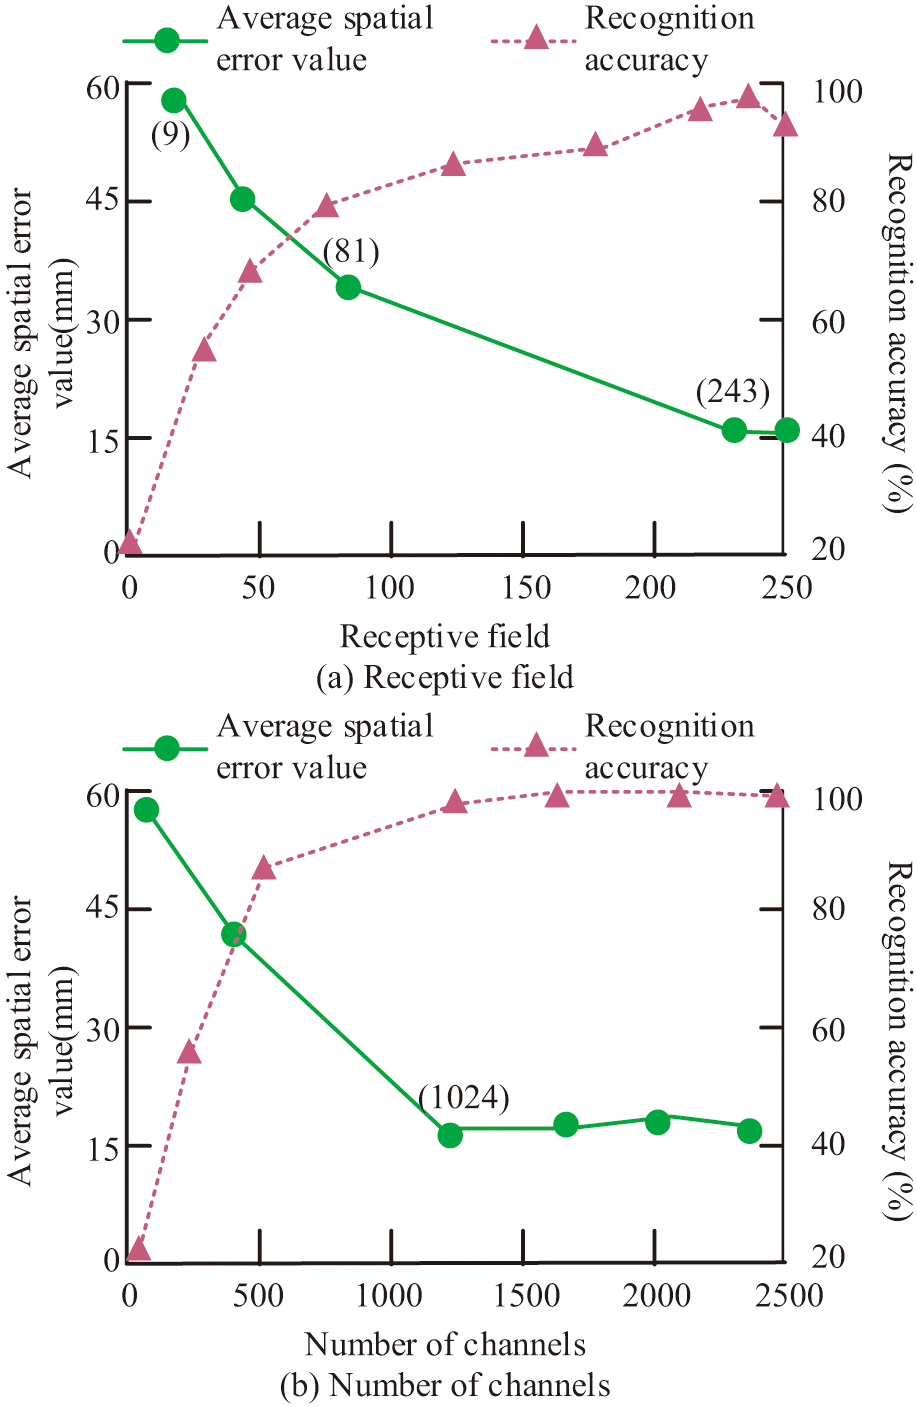 Fig. 9. The change of recognition accuracy and error value under different expansion rate and number of channels.
In Fig. 9(a), the recognition accuracy shows an increasing and then decreasing trend with the increase in the receptive field when the number of channels is 1024, and the average spatial error reaches a minimum of 29.8 mm when the receptive field is 343, which is the highest. It reaches the highest at a receptive field of 243, which is 92.6%. The average spatial error shows a gradual decreasing trend and reaches the minimum value of 29.8 mm when the receptive field is 343. In Fig. 9(b), with the increase in the number of channels, the recognition accuracy gradually rises with the increase in the number of sensing field of 243. When the number of channels exceeds 1024, the improvement of accuracy is no longer obvious, while the average spatial error gradually decreases. When the number of channels reaches 1024, the error value is already low. Continuing to increase the number of channels has a limited effect on the improvement of the error value. Therefore, the optimal sensing field is 243, and the number of channels in the convolutional layer is 1024.
B.PERFORMANCE ANALYSIS OF MENTAL STATE RECOGNITION METHOD BASED ON INTEGRATED LEARNING AND 3D FEATURE
To test the effectiveness of the proposed integrated learning approach, the study compares it with three single weak classifiers and compares the response times of the four in terms of receiver operating curve (ROC), area under curve (AUC), and recognition of the four emotional states. The results are shown in Fig. 10.
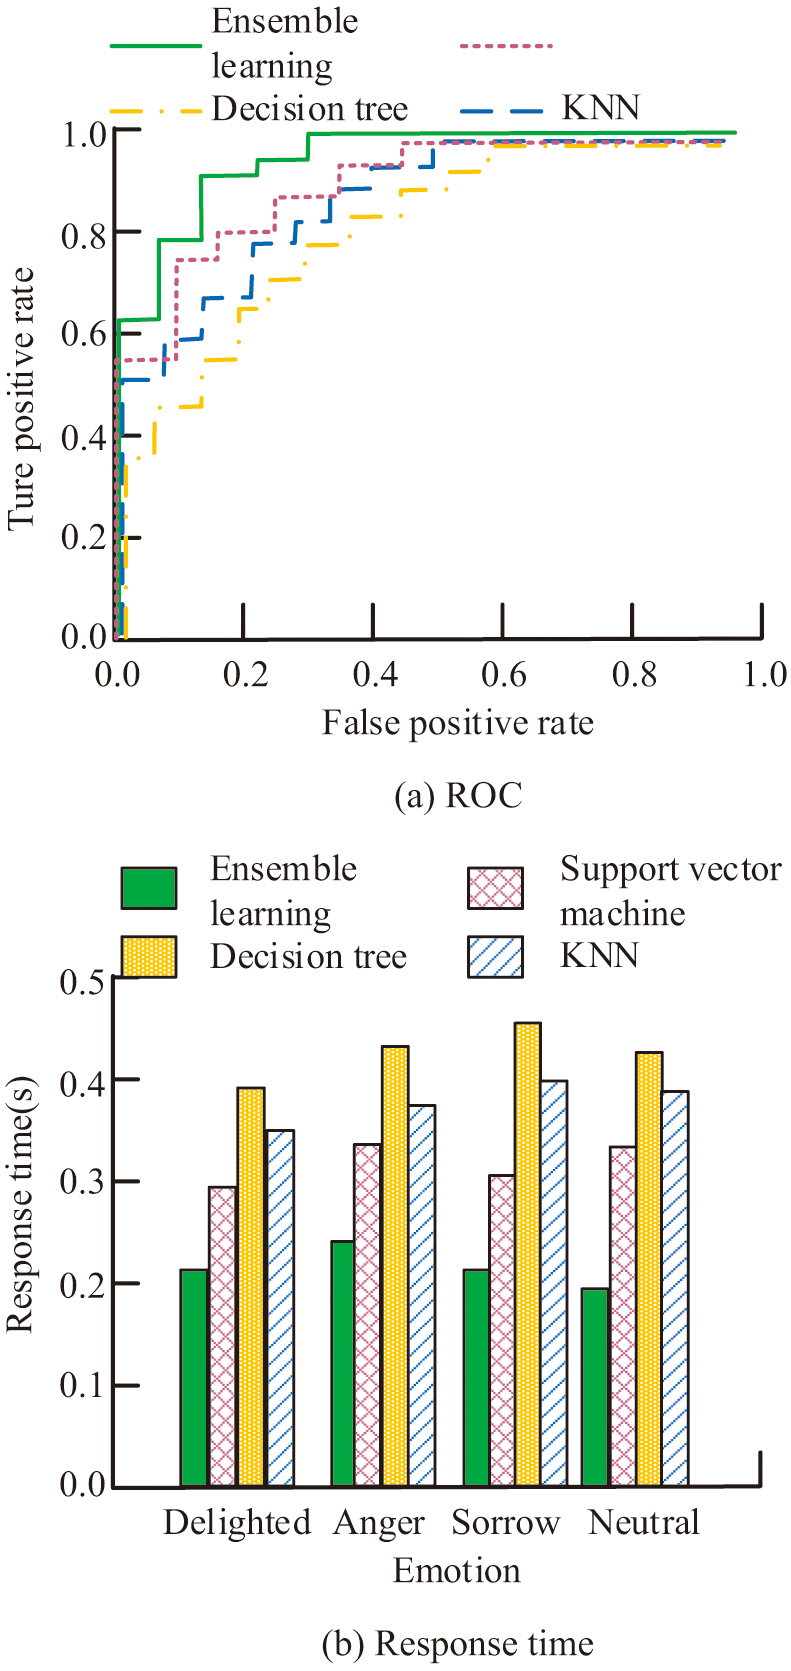 Fig. 10. Comparison of AUC values and response time of four classification methods.
In Fig. 10(a), the AUC value of the integrated learning method is 0.95. The AUC values of KNN, decision tree algorithm, and support vector machine are 0.89, 0.90, and 0.87, respectively, which are all smaller than that of the integrated learning method. In Fig. 10(b), the response time of the integrated learning method is only slightly higher than that of the weak classifier in the four emotional state data, and the average value is only 0.25 s. It proves that the integrated learning method has good real-time performance while maintaining high recognition accuracy.
To test the effectiveness of the mental state recognition method based on integrated learning and walking pattern analysis (Method 1) proposed in the study, the study compared it with the mental state recognition method (Method 2) in literature [22], the mental state recognition method (Method 3) in literature [23], the mental state recognition method (Method 4) in literature [24], and the mental state recognition method (Method 5) in literature [25]. The changes in recognition accuracy of the five methods for the four emotions under different data sizes are compared. The specific results are shown in Fig. 11.
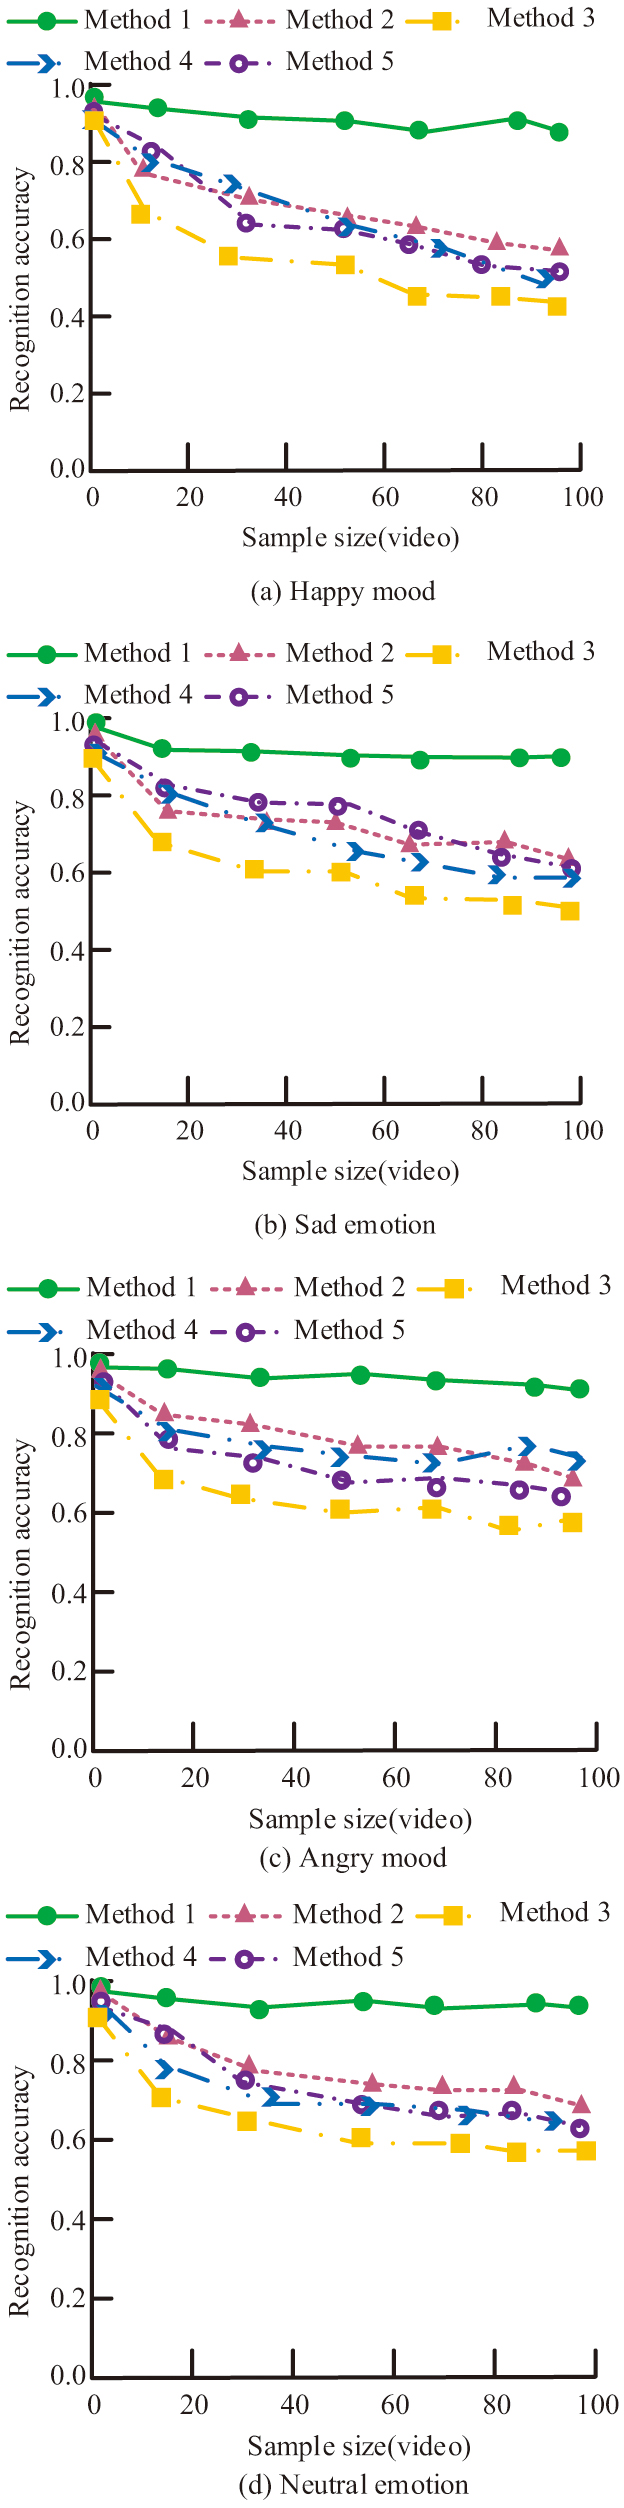 Fig. 11. Comparison of emotion recognition effect of five methods.
In Fig. 11, the recognition accuracy of all four emotions decreases with the increase in the number of samples, and the decrease of Method 1 is the smallest. In Fig. 11(a), the average recognition accuracy of Method 1 reaches 90.25% for the happy mood, while the average accuracy of the other four methods is lower than 90%. In Fig. 10(b), the recognition accuracy curves of Method 1 are higher than the other methods. In Fig. 10(c), the average recognition accuracy of Method 1 reaches 91.03% under the anger mood. In Fig. 11(d), the recognition accuracy of Method 1 remains higher than the other methods.
To further verify the effectiveness of the proposed mental state recognition method, the study introduces non-machine learning methods for comparison. The study selects the traditional psychological questionnaire assessment (Traditional 1) and the psychological assessment based on expert experience (Traditional 2) for comparison. The accuracy rate of emotion recognition, response time, recall value, and root mean squared error (RMSE) of several methods are studied and compared. The values of the metrics are compared for two emotion states, positive and negative emotions. Positive emotions include neutral and happy emotions, and negative emotions include sad and angry emotions. The results are shown in Table I.
Table I. Comparison of psychological recognition effect of each method
| Project | Positive emotion | Negative emotion | ||||||
|---|---|---|---|---|---|---|---|---|
| Accuracy rate (%) | Response time (s) | Recall | RMSE | Accuracy rate (%) | Response time (s) | Recall | RMSE | |
| Method 1 | 95.84#*&^@$ | 0.25#*&^@$ | 0.96#*&^@$ | 0.03#*&^@$ | 95.43#*&^@$ | 0.22#*&^@$ | 0.95#*&^@$ | 0.04#*&^@$ |
| Method 2 | 91.06 | 0.31 | 0.91 | 0.09 | 91.00 | 0.30 | 0.92 | 0.08 |
| Method 3 | 85.46 | 0.40 | 0.84 | 0.16 | 85.67 | 0.41 | 0.81 | 0.15 |
| Method 4 | 89.15 | 0.36 | 0.87 | 0.12 | 89.23 | 0.37 | 0.86 | 0.11 |
| Method 5 | 87.06 | 0.38 | 0.85 | 0.14 | 87.46 | 0.39 | 0.84 | 0.13 |
| Tradition 1 | 90.58 | 120.43 | 0.90 | 0.08 | 90.47 | 122.33 | 0.89 | 0.09 |
| Tradition 2 | 90.36 | 45.33 | 0.91 | 0.09 | 90.12 | 46.47 | 0.90 | 0.08 |
Note: In Table
As shown in Table I, Method 1 has the highest average accuracy rate, reaching 95.63%. Meanwhile, it has the shortest response time at 0.23 s. The recall value is 0.96 and the RMSE is only 0.03. Compared with traditional methods, it has shown significant improvement in the accuracy and efficiency of recognizing emotions, especially positive ones. Although traditional methods such as Tradition 1 and Tradition 2 are similar in some respects, their overall performance is inferior and they take longer.
C.EFFECT OF PSYCHOLOGICAL STATE IDENTIFICATION METHOD ON THE PREVENTION OF PSYCHOLOGICAL CRISIS AMONG MEDICAL STUDENTS
To test the effectiveness of the study’s proposed methods for identifying psychological states in the prevention of psychological crises among medical students, the study applies five methods to classes of medical majors at Medical University A for a semester-long follow-up experiment. Each method is applied to two classes, and the study installs video surveillance in each class. The five methods are also used to identify the emotional state of the students in the surveillance video and provide early warning of psychological crisis. The experiment lasts for 6 months, and the number of warnings, warning accuracy, and warning response time of each method are recorded during the experiment. In addition, self-assessment and doctor’s assessment of the psychological state of the students with crisis warning are conducted 6 months after the experiment, and the improvement rate of the students after the intervention is recorded. The results are shown in Table II.
Table II. Comparison of the application effects of the five methods in the prevention of psychological crisis of medical students
| Project | Class 1 | Class 2 | ||||||
|---|---|---|---|---|---|---|---|---|
| Warning frequency | Warning accuracy (%) | Warning response time (h) | Recovery rate (%) | Warning frequency | Warning accuracy (%) | Warning response time (h) | Recovery rate (%) | |
| Method 1 | 95 | 91.47 | 9.04 | 78.23 | 94 | 91.49 | 9.06 | 78.23 |
| Method 2 | 92 | 82.46 | 10.28 | 70.11 | 92 | 82.35 | 10.26 | 70.08 |
| Method 3 | 78 | 75.14 | 14.13 | 60.20 | 77 | 75.26 | 14.37 | 60.39 |
| Method 4 | 88 | 80.00 | 11.85 | 68.15 | 89 | 80.11 | 11.90 | 67.94 |
| Method 5 | 85 | 78.34 | 12.29 | 65.82 | 84 | 78.45 | 12.33 | 95.78 |
Note: The accuracy of early warning refers to the proportion of real psychological crisis in early warning. Early warning response time refers to the time from the early warning to the intervention of professionals. Post-intervention recovery rate refers to the proportion of students’ mental state improved after intervention measures.
In Table II, the method has the highest frequency of warnings at 95 times and the highest accuracy of warnings at 91.48%. The warning response time is relatively short at 9.05 hours. The improvement rate after intervention is also the highest at 78.23%. Compared with other methods, it has a better psychological crisis prevention effect and can help teachers find students’ psychological state abnormalities in time.
To further verify the practical application effect of the methods proposed in the research, the number of missed early warnings, the misclassification rate, and the delay rate of early warning intervention of each method are recorded in the research. The early warning delay rate is the proportion of cases in which more than 24 hours elapse between the occurrence of a psychological crisis and the issuance of an early warning. The results are shown in Table III.
Table III. The error analysis results during the practical application of each method
| Project | Class 1 | Class 2 | ||||
|---|---|---|---|---|---|---|
| Number of missed warnings | Misclassification rate (%) | Early warning intervention delay rate (%) | Number of missed warnings | Misclassification rate (%) | Early warning intervention delay rate (%) | |
| Method 1 | 0 | 0.35 | 0.04 | 1 | 0.28 | 0.05 |
| Method 2 | 2 | 0.58 | 0.11 | 3 | 0.62 | 0.10 |
| Method 3 | 6 | 1.23 | 0.20 | 7 | 1.22 | 0.19 |
| Method 4 | 4 | 0.77 | 0.13 | 5 | 0.80 | 0.14 |
| Method 5 | 6 | 1.02 | 0.16 | 6 | 0.99 | 0.17 |
As shown in Table III, Method 1 performs the best in terms of the number of missed warnings, the misclassification rate, and the delay rate of early warning intervention. On average, Method 1 only missed early warnings 0.5 times. The misclassification rate is as low as 0.32%, and the delay rate of early warning intervention is only 0.05%. Its superiority over other methods is further verified, confirming its efficiency and reliability in preventing psychological crises.
To further verify the effectiveness of the research using walking patterns as features for emotion recognition, the study compares it with recognition methods based on other signal features. The comparison methods include recognition based on facial expressions, recognition based on speech, and recognition based on physiological signals. The comparison results are shown in Table IV as follows.
Table IV. Comparison of recognition accuracy based on different signal features
| Project | Recognition accuracy rate (%) | Identify time (s) | Root mean square error | F1 score |
|---|---|---|---|---|
| Walking mode | 98.54 | 0.36 | 0.03 | 0.98 |
| Facial expression | 90.77 | 0.63 | 0.11 | 90.15 |
| Voice | 94.14 | 0.45 | 0.05 | 0.93 |
| Physiological signal | 92.63 | 0.57 | 0.08 | 0.92 |
In Table IV, the recognition method based on walking patterns outperforms other methods in terms of accuracy, recognition time, RMSE, and F1 score. The values of each index are 98.54%, 0.36 s, 0.03, and 0.98, respectively. This significantly improves the efficiency and accuracy of emotion recognition and verifies the effectiveness and superiority of the walking pattern as an emotion recognition feature.
IVCONCLUSION
To assist schools to pay real-time attention to the psychological state of medical students and carry out psychological crisis prevention in a timely manner, the study proposed a method for recognizing the psychological state of medical students and preventing psychological crises based on walking pattern analysis and integrated learning. The method took the walking pattern of students as the emotion recognition feature and combined integrated learning to realize the psychological state recognition. Moreover, it provided timely crisis warning according to the recognition results. The experimental results indicated that the average spatial error convergence value of the proposed walking pattern feature extraction method during training was only 21.02 mm. Compared to other methods, the error value was significantly lower and the convergence speed was faster. The integrated learning method was compared to a single weak classifier. Its AUC value reached 0.95, and the response time was only 0.25 s, which was able to maintain high classification performance with high computational efficiency. The recognition accuracy of Method 1 reached 95.63%, which was significantly higher than other mental state recognition methods. Moreover, its response time was only 0.23s, which was lower than other methods. In practical application, the accuracy rate of psychological crisis warning of the proposed method reached 91.48%. Furthermore, after the experiment, the psychological intervention effect of the warned students was the best, and the improvement rate of the psychological state reached 78.23% after the intervention. In summary, the method proposed in the study was effective in helping teachers to understand the psychological state of their students and intervening in a timely manner. The current study only categorized the psychological state into four types of emotions. There are still challenges in the real-world implementation, such as data privacy and model bias. In future research efforts, it is necessary to strengthen data encryption and privacy protection measures to reduce model bias and improve the generalization ability of the model. This can adapt to more complex and changing realities and ensure the safety and effectiveness of psychological crisis prevention systems. In current research, only four emotions are classified into psychological states. However, in real life, students’ psychological states are more complex. Subsequent research could consider broadening the categories of emotions to include anxiety, stress, and fear.
Through systematic training, educators and mental health professionals can master the model operation process and data analysis methods. It regularly collects students’ walking data and uses models to analyze their psychological state in order to identify potential crises in a timely manner. Based on the early warning results, workers or professionals can formulate personalized psychological intervention plans. Additionally, it is recommended that an interdisciplinary cooperation mechanism be established to incorporate the insights of experts from various fields, including psychology, education, and computer science.
This method aligns with mental health strategies in higher education and the global framework. It emphasizes prevention and early intervention and is consistent with the concept of proactive care advocated by international mental health organizations. Through real-time monitoring and precise early warnings, it effectively supplements the existing mental health service system. It enhances the overall efficiency of the campus psychological support system and provides strong technical support for implementing the global mental health strategy.