I.INTRODUCTION
Battlefield information superiority is the focus of both sides in information warfare. In the electromagnetic environment of the modern battlefield, the signals are increasingly dense and complex, so the electronic reconnaissance system faces great difficulties in sorting and identifying the signals. The sorting and recognition of complex signals is an important function of electronic support measures (ESMs). It is a process of comparing the measured signal parameters with those accumulated in advance to confirm the original properties of the radiation source. The ultimate goal is to locate and analyze the observed and intercepted radar signals and to provide battlefield situation information for commanders to assist in decision-making.
The existing radar countermeasure and reconnaissance equipment mainly carry out radiation source sorting and identification based on pulse description word (PDW) of detected signals. PDW refers to the time of arrival (TOA), direction of arrival (DOA), radio frequency (RF), pulse width (PW), pulse amplitude (PA), etc., extracted by the radar reconnaissance receiver from a single radar pulse. Wherein, pulse repetition interval (PRI) can be calculated according to the TOA parameter.
Early studies mostly adopted PRI-based single-parameter signal sorting algorithms, and the classical algorithms include extended association algorithm, histogram algorithm, and PRI transform algorithm [1]. Among them, the PRI transform algorithm has a good sorting effect on complex modulation signals. However, because the type and number of intercepted signals cannot be determined directly in the high-density noncooperative radar signal environment, the single-parameter signal sorting algorithm cannot directly complete the noncooperative radar signal sorting [2–4].
With the widespread use of machine learning methods, artificial intelligence techniques, and their applications in different areas [5], researchers found that the unsupervised clustering analysis in data mining is very suitable for solving the problem of radar signal sorting without prior information and proposed the radar signal sorting algorithm based on the clustering algorithm [6]. Typical representatives of clustering methods are distance-based clustering algorithms, hierarchical clustering algorithms, density-based clustering algorithms [7], etc, such as k-means clustering algorithm [8,9] and BIRCH (Balanced Iterative Reducing and Clustering using Hierarchies) [10]. However, its clustering number must be determined in advance, and the noise data have a great impact on it. The algorithm DBSCAN (Density-Based Spatial Clustering of Applications with Noise) was proposed by Ester M. [11], which is a typical density-based spatial clustering algorithm [12], and can find clusters of arbitrary shapes by clustering according to the tightness between data points.
At present, radar signal sorting and recognition generally follow the normal process of “signal sorting parameter extraction data comparison.” However, in practical applications, more attention is often paid to whether the current pulse contains known key targets. At this time, it is not necessary to identify all radiation source signals and requires higher efficiency in identifying key targets [13]. Sorting and identifying by the conventional process will cause a waste of computing time and data resources and seriously affect the timeliness of finding key targets.
Based on the above problems, this paper proposes a key radar signal sorting and identification method using DBSCAN clustering algorithm combined with PRI transform. Firstly, PDW presorting is carried out based on the DBSCAN clustering algorithm. Then, various PRI estimates are obtained by the PRI transform algorithm. Finally, the matching between various PRI estimates and key targets is judged to determine whether the current signal contains key target signals. This method can be used to process PDW data of pulse signals in real time, which is highly targeted and improves the recognition time of key signals.
II.PDW PRESORTING BASED ON DBSCAN
DBSCAN algorithm has three input parameters, including data set to be clustered D, neighborhood radius Eps (ɛ), and density threshold min Pts [14]. DBSCAN classifies data points by expanding and aggregating adjacent areas with similar density efficiently handles irregular and abnormal data. But its performance highly depends on the manual selection of two input parameters Epsand min Pts.
Set
is the Eps-neighborhood of x, and the density is defined as:In density-based clustering algorithms, a cluster is considered as a dense region of objects and an object of one cluster must be surrounded by objects of the same cluster. The main idea of DBSCAN is to partition density-connected objects into the same cluster [15]. Some basic concepts of the algorithm DBSCAN are listed as follows.
Eps-neighborhood: a d dimensional hypersphere region with a given object p as its core and Eps as its radius.
Core point: If the density of point xi, the point is called the Core point. Not a Core point, but a point within the epsilon and loss region of a Core point is called a boundary point. Otherwise, it is called a non-Core point or noise.
Directly density-reachable: Set Dc as the set of all Core points. If , it is called that y is directly density-reachable for x. Suppose , where m>2, if Pi+1 meets the requirement directly density-reachable from Pi, then it is called that Pm density-reachable from P1. Let , if y and z are both density-reachable to x, then it is called that y and z are density-connected.
DBSCAN checks the Eps-neighborhood of each data point in D to search the centroids (core points) of clusters, iteratively aggregates objects that are directly reachable from these core objects, and finally outputs the collection of clusters when no new points are added to any cluster.
In general, the parameters of RF, PW, and DOA of a single radar have a limited range of variation, and the characteristics of data clustering are relatively obvious. Therefore, RF, PW, and DOA parameters in PDW are selected in this paper for sorting. However, RF, PW, and DOA parameters are not in the same dimension. To ensure the scientific nature of the algorithm, the normalized transformation of parameters is required (i.e., all radar characteristic parameter data are converted into data between [0,1]). The range normalization formula is as follows:
, n is the PDW sample number of radar signals used for clustering.
is the normalized PDW data sample.
The distance formula from data point pdwi to point pdwj is
It is not economical to use all the detection parameters for clustering sorting when the key detection target parameters are known and the detection target is clear. However, the variation range of carrier frequency (RF) and PW of the same radiation source signal must be limited. Therefore, screening conditions can be set according to the known key target parameters, and only the detected signal parameters satisfying can be used for clustering sorting. Where and are the setting reference parameters, and and are the parameter screening ranges.
III.PRI ESTIMATION AND SIGNAL RECOGNITION
After the PDW presorting is completed for a certain key target signal, it is necessary to further determine whether the PRI parameter characteristics contained in the selected data points are consistent (or partially consistent) with the PRI parameter characteristics of the targeted signal.
Among the various parameters of radar signals, PRI has the largest variation type and range, but the PRI of the same radar radiation source signal has a strict time correlation, so PRI is the most important parameter in signal identification.
Common PRI sorting algorithms are mainly divided into the histogram method [16] and the PRI transformation method. The histogram method includes the cumulative difference histogram (CDIF) method and sequence difference histogram method (SDIF). Among them, the SDIF is an improvement of the CDIF, which has a fast computing speed, but cannot suppress the second and higher harmonics, and PRI misjudgment is easy to occur when the pulse loss rate is high.
Therefore, this paper chooses the PRI transformation method to estimate the PRI value contained in the radar pulse flow and judge whether it contains pulse sequences consistent with PRI parameters of key targets.
A.BASIC PRINCIPLES OF PRI TRANSFORM ALGORITHM
The principle of the PRI transform algorithm is to set the arrival time of each radar pulse signal as tn, n = 0,1,2,……N-1, where N is the number of sampling impulses, and the sampling impulse can be expressed as the sum of unit impulse function, namely
Phase factor is introduced into the integral transformation formula of , and PRI transform formula of a pulse is defined as:
In the above equation, , |D(τ)| is the PRI transform spectrum.
Substitute equation into the equation, and get
The analysis of the equation shows that there will be a peak value of the PRI transform spectrum at the potential PRI parameters.
To facilitate analysis and calculation, PRI transformation needs to be discretized. is set as the PRI change range, which is divided into K intercells. The width of each intercell is , and the center of the K thintercell is set as:
After determining the value range of PRI and the center value of each PRI small box, can be expressed as:
When the , the n PRI values whose |Dk| exceeds the detection threshold are taken as the estimated PRI values and expressed, where n is the estimated number of PRI values.
B.IMPROVEMENT OF PRI TRANSFORM ALGORITHM
The study [17] proposed an improved PRI variation algorithm. Firstly, the phase error caused by the PRI jitter was reduced by dynamically changing the starting point of time. The second is to make PRI small box range overlap to avoid the corresponding error caused by PRI jitter small box. Space is too limited to elaborate.
C.TARGET IDENTIFICATION BASED ON PRI ESTIMATES
The advantage of the PRI transform algorithm lies in its ability to accurately judge the PRI characteristic parameter value, while the disadvantage is that it is not suitable for real-time processing of large amounts of data due to its complex calculation and a large amount of computation.
DBSCAN-based presorting in the previous paper has completed the directional screening of PDW data. Based on the TOA value corresponding to the screened PDW data points, more accurate PRI values can be obtained, which eliminates a lot of interference and greatly simplifies the PRI data volume, making the included PRI features more prominent and significantly reducing the calculation amount. The problem of low efficiency of the PRI transformation method is solved.
IV.THE PROCESS OF SORTING AND IDENTIFICATION
Combining the DBSCAN-based clustering signal presorting and PRI-based key signal recognition, the key radar signal sorting and recognition method is formed. The specific process is as follows:
Suppose there are N types of key target signals, and they are numbered class j = 1,2,... N separately. In the following steps, the key target of class j is taken as an example to illustrate that all the other types of key target signals are processed in parallel according to the same steps.
- Step 1: According to the RF and PW parameter characteristics of the key targets in category j, set the reference parameters and and the parameter screening range, and set DBSCAN cluster neighborhood radius Epsand density threshold min Pts.
- Step 2: Input pulse parameter PDW and put the pulse parameter satisfying and into cluster C1.
- Step 3: DBSCAN clustering was performed on the data in cluster C1. Suppose the clustering results divided C1 into k classes and put the pulse parameters corresponding to each core point and boundary point into the corresponding category cluster C2k.
- Step 4: Arrange the TOA corresponding to C2k data points from small to large, identify PRI characteristic parameters according to the PRI transformation method, and discuss in three cases:
- (1) The identified PRI feature parameter values are partially the same as the PRI parameters of key target signals, but they do not completely include the PRI parameters of the target. At this time, it can be considered that the j-class target is suspected to be discovered, PDW parameters within C2k are saved, and the next batch of PDW data is processed, focusing on the j-class target.
- (2) The identified PRI feature parameter values fully include PRI parameters of key target signals. At this time, it can be considered that the jth target is successfully discovered, PDW parameters within C2k are saved, and timely reported;
- (3) The identified PRI feature parameter values are completely different from the PRI parameters of key target signals, and it is considered that the jth class target has not yet appeared, so the next batch of PDW data will be processed.
- Step 5: According to the identification results, save PDW data corresponding to the jth signal and complete the accurate sorting of detected PDW parameters.
V.SIMULATION ANALYSIS
A.SIMULATION SETTING
According to the actual radar signals received, pulse flow containing multiple radar signals is simulated. Pulse simulation data are shown in Table I, and its PDW 3D schematic diagram is shown in Fig. 1. The starting time is 100 us in sequential order, and pulse loss caused by pulse overlap is not considered. Among them, RF, PRI, PW, and DOA add 10% gaussian noise, respectively. Five hundred interference pulses are added to the PDW data stream, and the added noise parameters are uniform random numbers within the value range of mixed radiation source signals (using rand function to generate evenly distributed pseudo-random numbers). The 3D schematic diagram of simulation PDW data obtained after adding interference is shown in Fig. 2.
Table I. Radar pulse simulation parameters
| Serial number | 1 | 2 | 3 | 4 | 5 | 6 | Interference |
|---|---|---|---|---|---|---|---|
| 36∼39 | 33∼35 | 40∼43 | 43∼44 | 42∼45 | 43∼45 | ||
| 6 450∼6 650 agility | 6 600 Fixing | 6 200∼6 500 Agility | 6 400,6 500, 6 450,6 300 Hopping | 6 600∼6 800 Agility | 6 600 Fixing | ||
| 5.10∼11.40 | 9.65 | 14.5 | 15. 0∼20.0 | 10.5∼15.5 | 9.65 | ||
| 800 * 5/830 * 5/900 * 5/780 * 5/820 * 5/930 * 5 Irregular | 400//440 jitter | 670 Fixing | 1 500 Fixing | 1 200//1 250 Jitter | 400//440 Jitter | ||
| 600 | 400 | 500 | 500 | 200 | 300 | 500 |
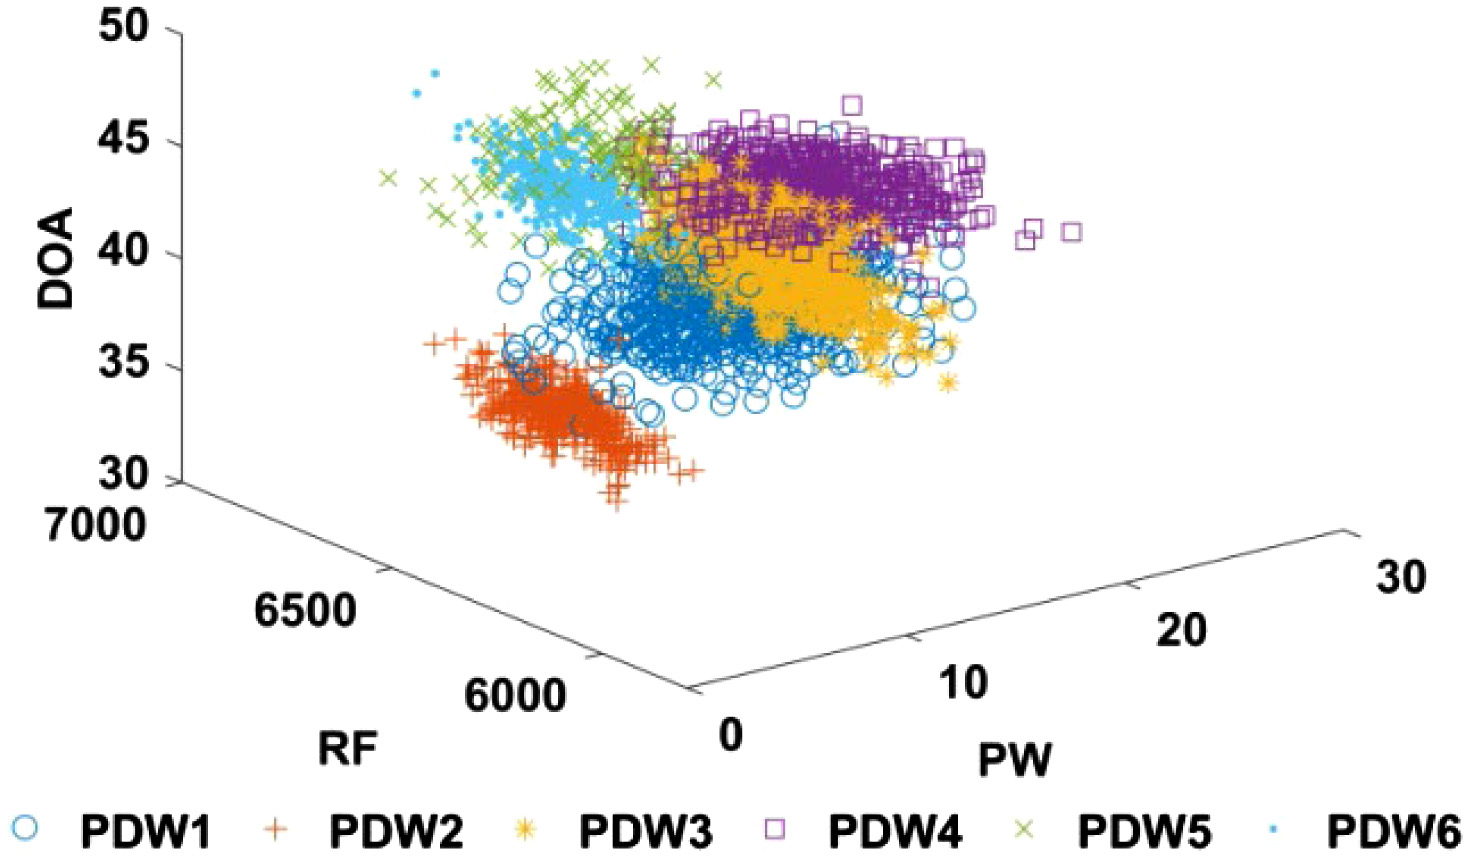 Fig. 1. Diagram of the original PDW data set.
 Fig. 2. Diagram of the simulated PDW data set.
The pulse signals generated by the simulation include complex signals such as frequency agility, frequency jump, frequency fluctuation, frequency jitter, etc. PDW data of each radar are seriously overlapped and contain similar signals with the same parameters and different directions.
Key signal parameters are shown in Table II. There are five radars in total. Radar1 has the largest parameter range and overlaps with Radar2 and Radar4. Radar2 signals appear from two different directions in the simulation pulse signal, but Radar5 signals do not appear.
Table II. Key target signal parameters
| Serial number | Radar1 | Radar 2 | Radar 3 | Radar 4 | Radar 5 |
|---|---|---|---|---|---|
| 6 450∼6 650 Agility | 6 600 Fixing | 6 200∼6 500 Agility | 6 600∼6 800 Agility | 6 300 Fixing | |
| 5.10∼11.40 | 9.65 | 14.5 | 10.5∼15.5 | 12 | |
| 800 * 5/830 * 5/900 * 5/780 * 5/820 * 5/930 * 5 Irregular | 400//440 Jitter | 670 Fixing | 1 200//1 250 Jitter | 1 850//1 900 Jitter |
B.SIMULATION OF PRESORTING BASED ON DBSCAN
Set , density threshold min Pts = 10, and parameter screening range . The signals of the five key radars are sorted according to the process, and the sorting effect is shown in Fig. 3.
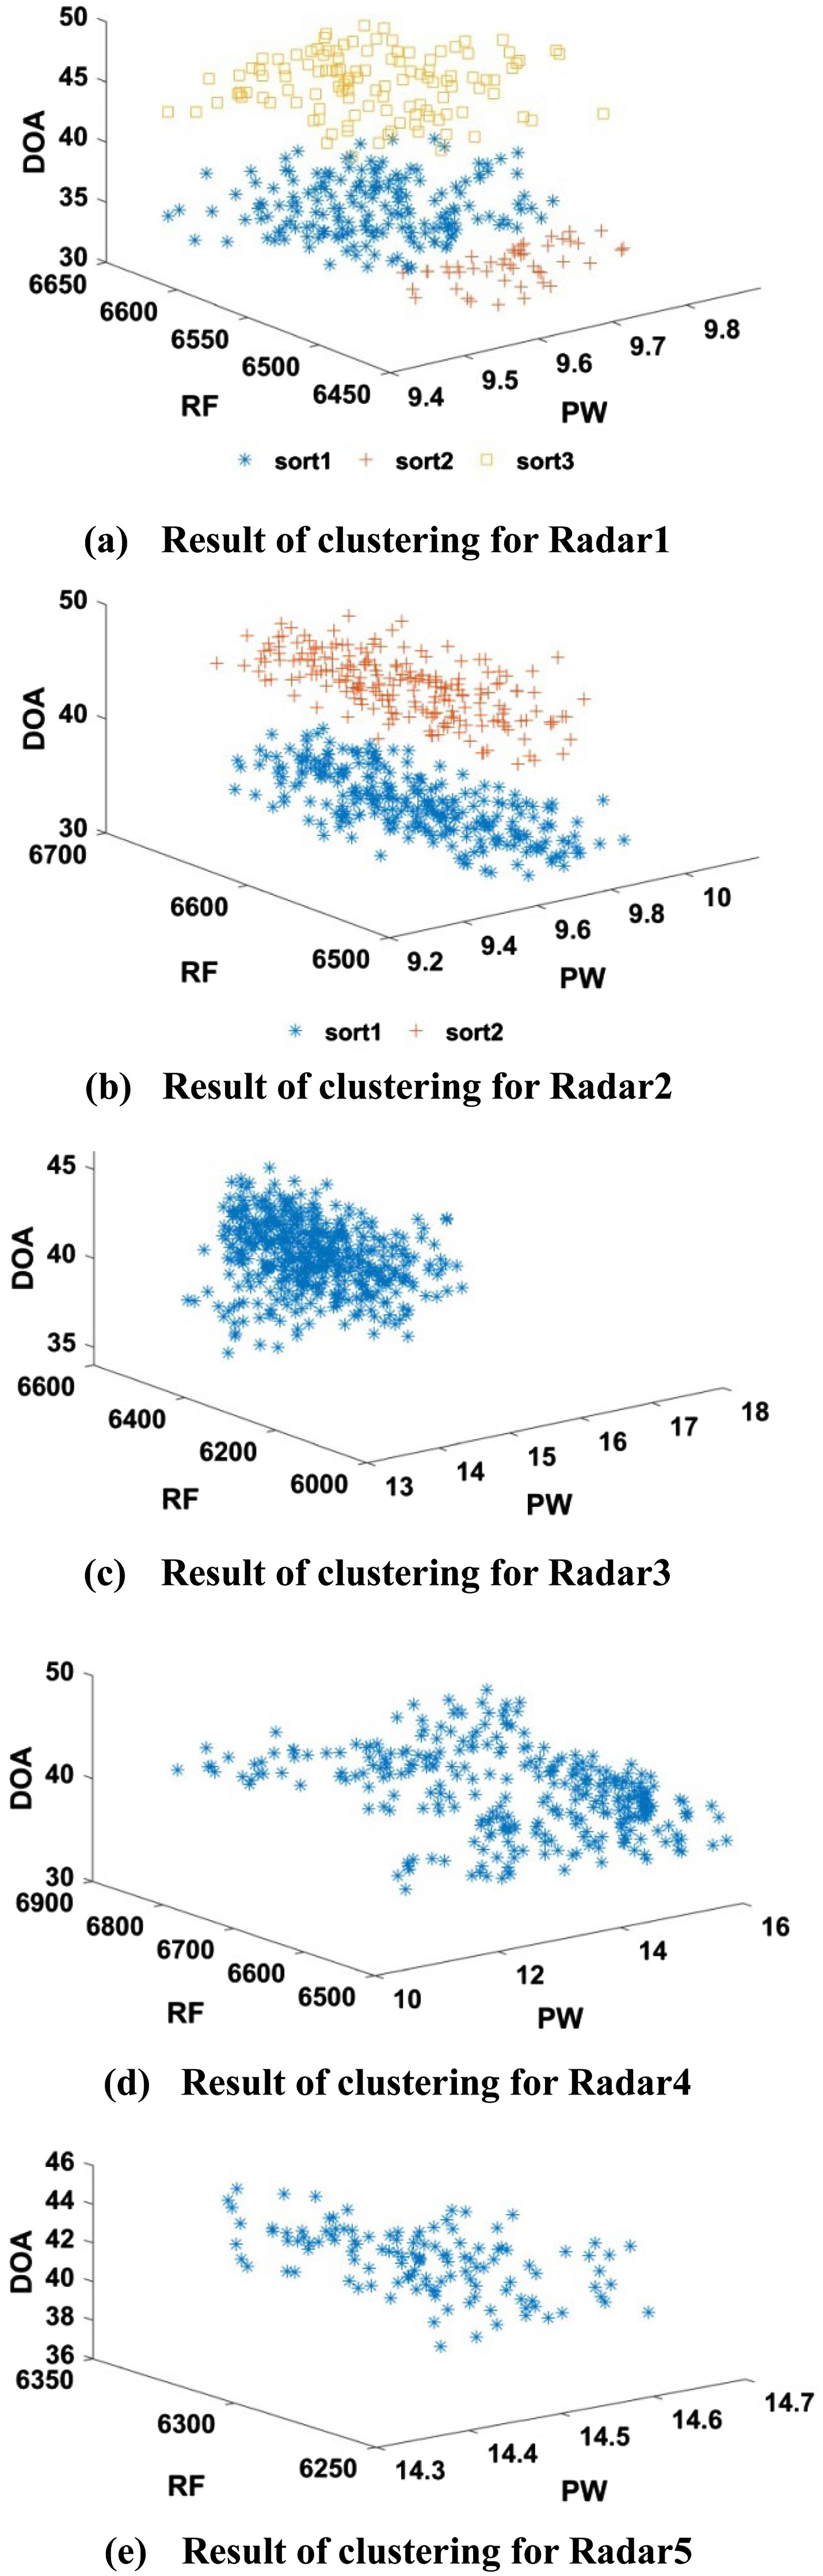 Fig. 3. PDW presorting: (a) result of clustering for Radar1; (b) result of clustering for Radar2; (c) result of clustering for Radar3; (d) result of clustering for Radar4; and (e) result of clustering for Radar5.
The analysis of clustering results shows that because Radar1 has a wide range of parameters, its RF and PW parameters completely cover Radar2 and partially cover Radar4, so it is divided into three categories in different DOA ranges for Radar1 clustering. Radar2 itself appeared twice, and RF and PW parameters overlapped partially with Radar1, so it was also divided into three categories for Radar2 clustering. Although Radar5 does not appear, its RF and PW parameters ranges are included in the Radar1 parameter range, so there are corresponding clustering results.
C.SIMULATIONS OF PRI ESTIMATES
Based on the sorting results, PRI estimation is carried out by the PRI transform algorithm, and the obtained PRI spectrum is shown in Fig. 4.
 Fig. 4. PRI spectrogram: (a) PRI spectrogram of clustering for Radar1; (b) PRI spectrogram of clustering for Radar2; (c) PRI spectrogram of clustering for Radar3; (d) PRI spectrogram of clustering for Radar4; and (e) PRI spectrogram of clustering for Radar5.
PRI identification results of each key radar target are shown in Table III.
Table III. The result of identification of PRI
| Key radar target | PRI estimation | |Dk| peak | PRI of key radar | Conclusion |
|---|---|---|---|---|
| 423 | 108 | 800,830,900,780,820,930 | Suspected identify | |
| 772,852,944 | 124 | |||
| 1170∼1253 | 110 | |||
| 418 | 155 | 400∼440 | Successful identify | |
| 852,946 | 57 | |||
| 670 | 261 | 670 | Successful identify | |
| 1196∼1268 | 212 | 1200∼1250 | Successful identify | |
| 850 | 45 | |||
| 670 | 16 | 1850∼1900 | Not found | |
| 1306 | 9 |
Analysis of the identification results shows that the method can accurately identify PRI parameter value, and even in the case of multiple signal parameters and the existence of |Dk|, the main signal and mixed signal can be distinguished by the size of |Dk|, so the identification accuracy is very high. However, it is also found that, for the PRI irregular signals such as Radar1, this method cannot guarantee to find all PRI values and identify their arrangement.
D.PDW RE-SORTING ACCORDING TO THE ESTIMATED PRI
After the PRI identification of each key target is completed, PDW data measured can be accurately sorted based on the identification results, and PDW data from the same radar radiation source can be classified into one category. It is important to note that multiple radiation sources of the same type of radar can exist simultaneously in multiple directions. Therefore, when combining PDW data of the same type of radar, it should be prevented to combine PDW data that is manifested as two types (or more) in the prescoring selection into one.
The final 3D schematic diagram of PDW sorting results is shown in Fig. 5.
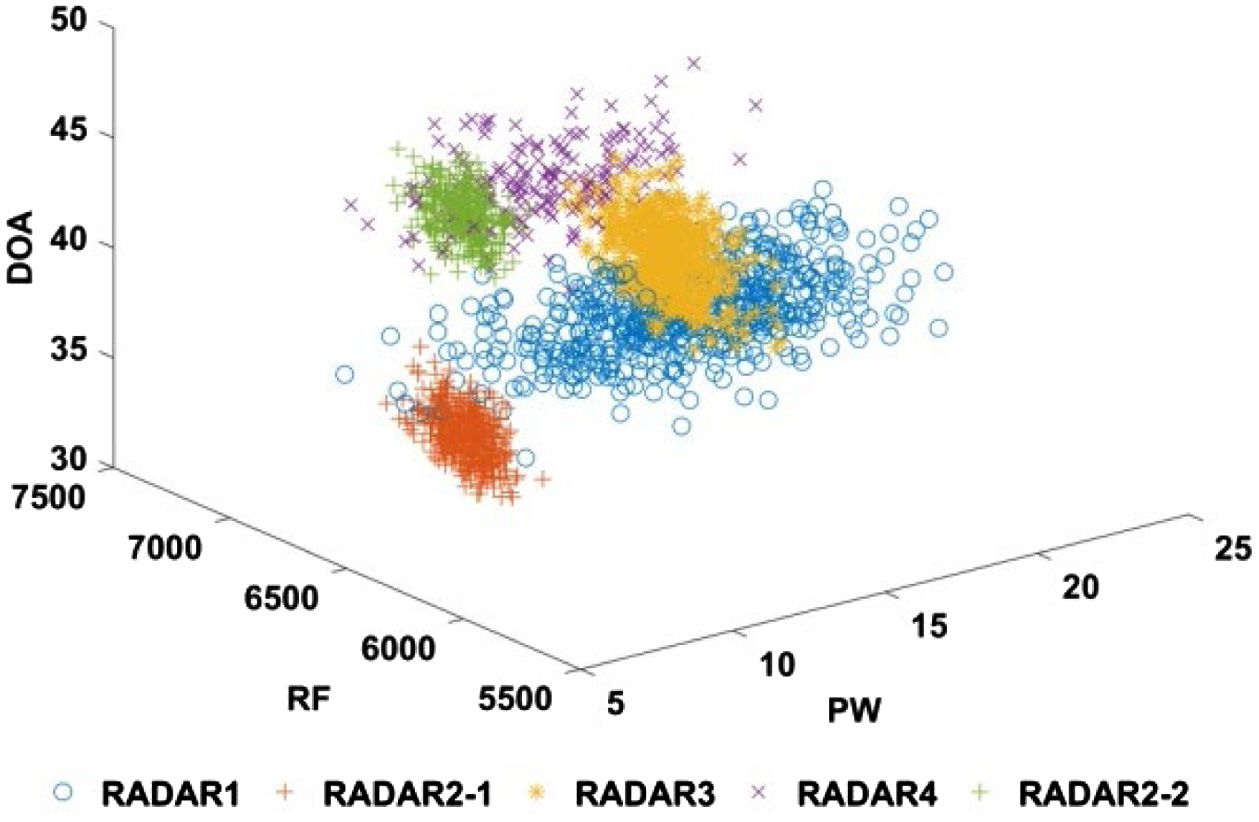 Fig. 5. Diagram of final PDW sorting results.
E.COMPARATIVE ANALYSIS OF ALGORITHM
To verify the improvement effect of the algorithm proposed in this paper, the sorting accuracy formula is defined as:
The sorting accuracy of the proposed sorting recognition algorithm in this paper is compared with the signal sorting method based on pulse train samples and the classical k-means clustering sorting method to verify the improvement effect. Simulation parameters are set as shown in Table I, but interference pulses are removed. The k-means clustering algorithm, the signal sorting method based on pulse train samples, and the improved algorithm in this paper were used 50 times, respectively, to calculate the statistical average of sorting accuracy.
To achieve the comparison effect, the number of known clusters is set as 5 in this paper, and the initial clustering center of the k-means algorithm is randomly generated.
Under the above conditions, the k-means algorithm, the signal sorting method based on pulse train samples, and the algorithm in this paper have their respective sorting accuracy as shown in Table IV.
Table IV. Contrast of sorting effect
| Algorithm | Sorting accuracy |
|---|---|
| k-Means | 77.2% |
| Pulse train samples | 84.3% |
| The algorithm in this paper | 94.7% |
It can be seen from Table IV that, compared with the k-means algorithm and signal sorting method based on pulse train samples, the sorting accuracy of the method proposed in this paper is significantly improved.
VI.CONCLUSION
In this paper, we studied the separation and recognition of key target signals based on PDW and proposed a new separation and recognition method based on clustering and PRI transform algorithm. Simulation experiments showed that the algorithm had the following advantages: firstly, it is insensitive to the influence of noise and parameter overlap and could be applied to the complex electromagnetic environment composed of noncooperative radar signals. Secondly, it has reduced the calculation overhead because of avoiding all data sorting operation, then significantly improved the efficiency of radar signal recognition. However, this method could not effectively judge PRI arrangements. If the radar parameter range and PRI center value were similar or the same as the key radar target, but the arrangement mode was different, the error identification result would be produced, and further research is needed to solve this problem.