I.INTRODUCTION
With the rapid development of the global economy and the increasingly fierce competition in the market, entrepreneurship has become an important force to promote social and economic progress. In recent years, entrepreneurship education (EE) has been widely emphasized and promoted in colleges and universities, and it has an important influence on college students’ social entrepreneurial intentions [1]. EE helps students to master the information and willingness of entrepreneurship through a systematic curriculum. It focuses on the shaping of students’ psychological characteristics and helps students establish a positive entrepreneurial mindset through entrepreneurship lectures and practical activities [2]. However, how to accurately assess students’ entrepreneurial intentions in order to provide scientific basis and personalized guidance for EE is the current challenge [3]. However, traditional methods of entrepreneurial intention assessment mostly rely on questionnaires and statistical analysis. The method has problems such as strong subjectivity, single data dimension, and difficulty in capturing complex relationships, which makes the accuracy (Acc) of students’ entrepreneurial intention assessment lower [4]. Therefore, exploring an efficient and highly accurate method for assessing students’ entrepreneurial intention has become the key to current research [5]. The quick advancement of artificial intelligence technology in recent years has given rise to fresh concepts and instruments for evaluating entrepreneurial purpose [6]. As advanced deep learning technologies, residual networks (ResNet) and attention mechanism (AM) have produced impressive outcomes [7].
The incorporation of a residual learning module within ResNet has been demonstrated to effectively mitigate the challenges posed by gradient vanishing and gradient explosion in the context of deep neural network training. It can also manage intricate nonlinear interactions [8]. Hua X et al. suggested a deep ResNet based on squeezing and incentive AM. The study improved the convolutional layer (CL), adjusted batch normalization (BN) layer, and activation function (AF) layer in the deep ResNet model in order to improve the Acc of the model. The results indicated that the F1 score of this method was up to more than 90%, and its performance was better than the existing model [9]. To accurately record student behavior in the classroom, Xuan Z presented a deep ResNet based on long- and short-term memory (LSTM) networks. According to the findings, the suggested method’s Acc in the validation set was 96.56% [10]. Liu et al. proposed a spatio-temporal ResNet-based method for identifying anomalous operations. This method uses operating point templates to segment subsamples, thereby improving the stability and utility of sequence operation evaluations. The method was found to have significant advantages over other anomalous operation identification methods [11]. A deep ResNet-based approach for automatically assessing the efficacy of instruction was presented by Sun M et al. The method constructed a backbone network through deep ResNet to extract visual features for the evaluation of teaching effectiveness. The results indicated that the method could better perceive the visual features of course video frames [12].
The AM has drawn a lot of interest since it may automatically highlight the most instructive portion of the input data, enhancing the model’s Acc and interpretability. Zhai X et al. suggested a method for calculating online learning effect under convolutional neural network based on the AM. The findings indicated that the method’s Acc was noticeably higher than that of alternative approaches [13]. Shobana J et al. proposed a prediction model based on an enhanced AM. The model used an adaptive particle swarm optimization (PSO) approach to best determine the weight parameters of the bidirectional LSTM network in an attempt to optimize the performance of the model. In all four datasets, the model performed better, according to the results [14]. Lasri I. et al. presented a self-attentive bidirectional LSTM network-based model for evaluating remote learning in higher education. The model used a self-attentive bidirectional LSTM network to accomplish affective categorization. It was discovered that this approach performed better on assessments than other widely used approaches [15]. A contextual feature-based attention multi-scale network medical image fusion model was presented by Guo K et al. The outcomes demonstrated the model’s superiority using a thorough quality evaluation technique [16].
In summary, numerous academics have studied evaluation techniques based on ResNet and AM extensively, with great success. However, the existing ResNet and AM have defects such as incomplete feature expression and high computational complexity [17]. In view of this, the study proposes an assessment method for students’ entrepreneurial intention based on improved ResNet and AM. The method works by combining ResNet with the AM in order to capture the multidimensional features of students’ entrepreneurial intention more comprehensively. To increase the effectiveness of EE and give a more precise and customized assessment tool for EE in colleges and universities, it also emphasizes the significance of important aspects. The innovations of this study include: (1) local features of student data are effectively captured through multi-scale convolution (MSC), and global dependencies are captured using Transformer for feature complementation and fusion. (2) Features are weighed from the channel dimension and the spatial dimension by the channel AM and spatial AM, respectively, to further define the relevance differences of features. The multi-AM is used to dynamically give weights to various characteristics. The contribution of the study is to introduce deep learning techniques into the field of student entrepreneurial intention assessment. By precisely determining students’ entrepreneurial intentions, it provides colleges and universities with data to assist them in streamlining their curricula, allocating resources, and modifying their teaching methods.
The rest of the paper is structured as follows. Section II describes the methods and materials employed in this study. These include a multidimensional feature extraction (FE) approach combining MSC and Transformer models, as well as an evaluation method based on an improved ResNet and a multi-AM. Section III presents and discusses the complete set of experimental results, including advanced model comparison experiments and key component ablation studies. Finally, Section IV summarizes the research and explores possible future research directions.
II.METHODS AND MATERIALS
This section first proposes a multidimensional FE method for students that combines MSC with Transformer. Then it proposes a method for assessing students’ entrepreneurial intention based on improved ResNet with multi-AM, aiming to improve the assessment Acc.
A.MULTIDIMENSIONAL FE COMBINING MSC WITH TRANSFORMER
In EE in higher education, accurately assessing students’ entrepreneurial intentions is the key to optimizing educational strategies and providing personalized guidance [18]. Through multi-scale FE, artificial intelligence technology may improve the expressiveness of the model and automatically identify intricate patterns in data. However, the existing ResNet can only acquire a limited sensory field, which makes it difficult to fully capture students’ multi-scale feature information [19]. Therefore, the study improves ResNet and proposes a multidimensional FE method for students that combines MSC with Transformer. The method extracts local features of students’ multidimensional data through MSC and captures global dependencies using Transformer to achieve feature complementation and fusion. The core of ResNet is the residual block, whose main purpose is to solve the gradient vanishing problem in deep network training through residual learning. A standard residual block includes two CLs, BN, and ReLU AF [20]. Equation (1) illustrates how the residual block is calculated:
In equation (1), and are the input and output features. ReLU denotes the modified linear unit AF. is the residual function. is the BN. and denote the first and second CLs, respectively. Since this residual block is not effective for multi-scale FE, it reduces the Acc of students’ entrepreneurial intention assessment. Accordingly, the present study utilizes the MSC method to derive local features from the multidimensional data of students. Equation (2) expresses its convolution:
In equation (2), is the convolution kernel (CK). is the data feature tensor. is the quantity of elements in the CK. is the position of different values in the data feature. denotes the position of elements in the CK. The study evaluates each particle’s fitness using the PSO approach to determine the global ideal position in order to further optimize the ResNet architecture. Moreover, its velocity and position are updated using the velocity and position update formula, and the fitness of each particle after the update is evaluated [21]. Finally, the global optimal position (OP) is updated. The expression of velocity update and position update is shown in equation (3):
In equation (3), and denote the updated speed and position, respectively. denotes the inertia weights. and denote learning factors. and denote random constants which range between [0, 1]. denotes the OP found by the particle. denotes the global OP found by all the particles. denotes the position of the particle at the moment. To improve the Acc of FE, the study uses the squeeze-and-excitation (SE) module to adaptively calibrate the feature channel responses. This module models the interdependence between channels in a convolutional neural network through global average pooling (GAP) and fully connected layers (FCLs) to enhance the representation and generalization of the network while maintaining computational efficiency [22]. The computation of the SE module is shown in equation (4):
In equation (4), denotes the output features processed by the SE module. denotes the Sigmoid AF. and denote the weight matrix of the FCL. and are the height and width of the feature map, respectively. is the value of the output feature in the channel, row, and column. Figure 1 displays the schematic diagram of the upgraded ResNet.
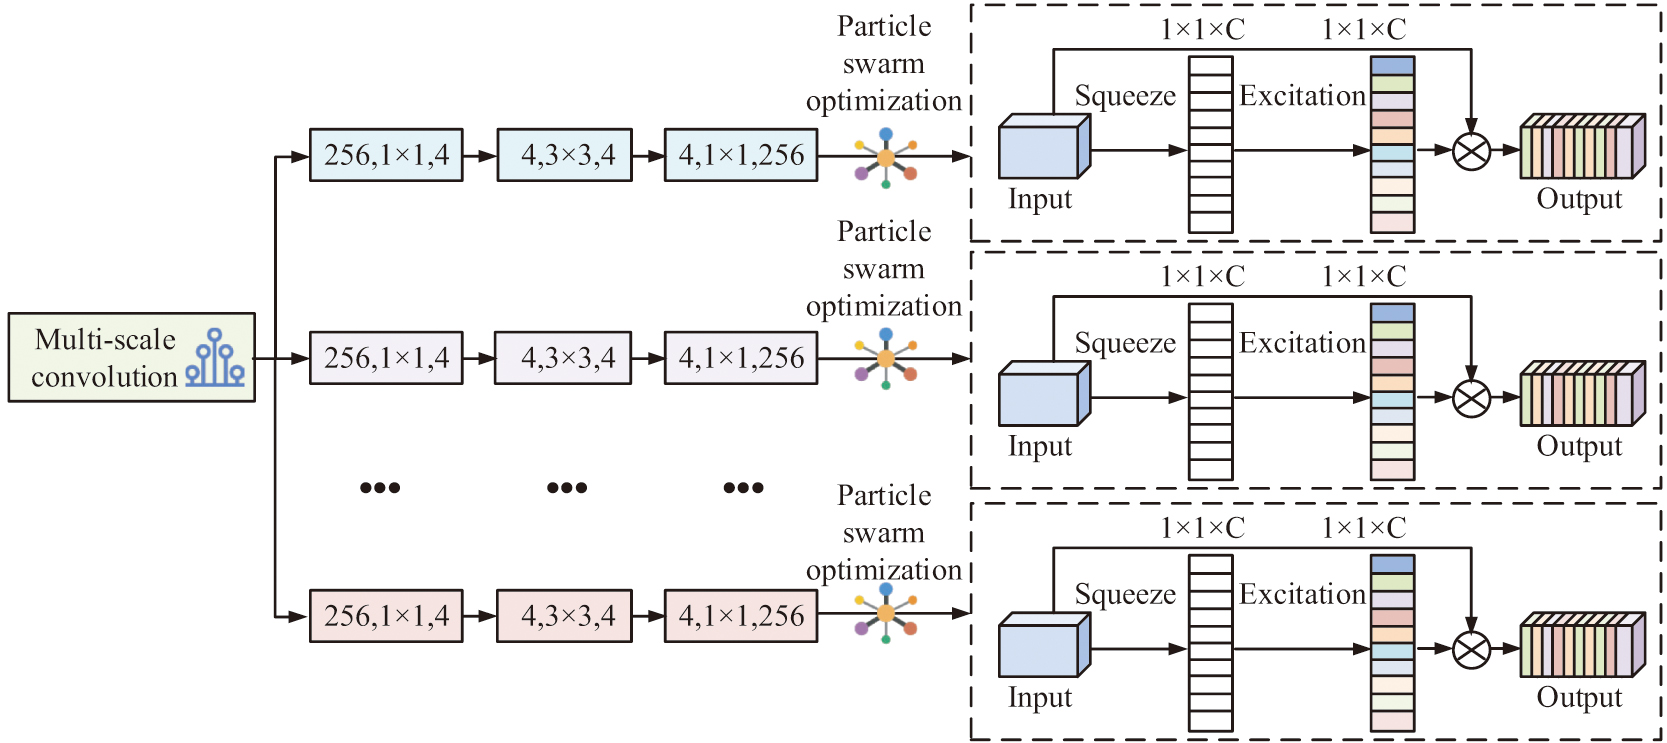 Fig. 1. Schematic diagram of improved residual network.
Figure 1 shows the MSC process on the left. The study uses the PSO algorithm to optimize network parameters after each convolution module. Then, the channel weights of the features are adaptively adjusted by the SE module to improve the representation ability of the network. To optimize the improved ResNet, the study uses the multilayer structure of the Transformer model to transform the input data into embedding vectors. Position information is added to the embedding vectors using positional coding to preserve the sequence order, and the stability of the model is enhanced using residual join and layer normalization [23]. The calculation of its layer normalization is shown in equation (5):
In equation (5), denotes the output value of the feature of the th sample after normalization. denotes the input feature value. denotes the variance. and denote the learnable scaling and offset parameters, respectively. denotes the constant that prevents division by 0. The schematic of the multidimensional FE method for students based on MSC with Transformer is shown in Fig. 2.
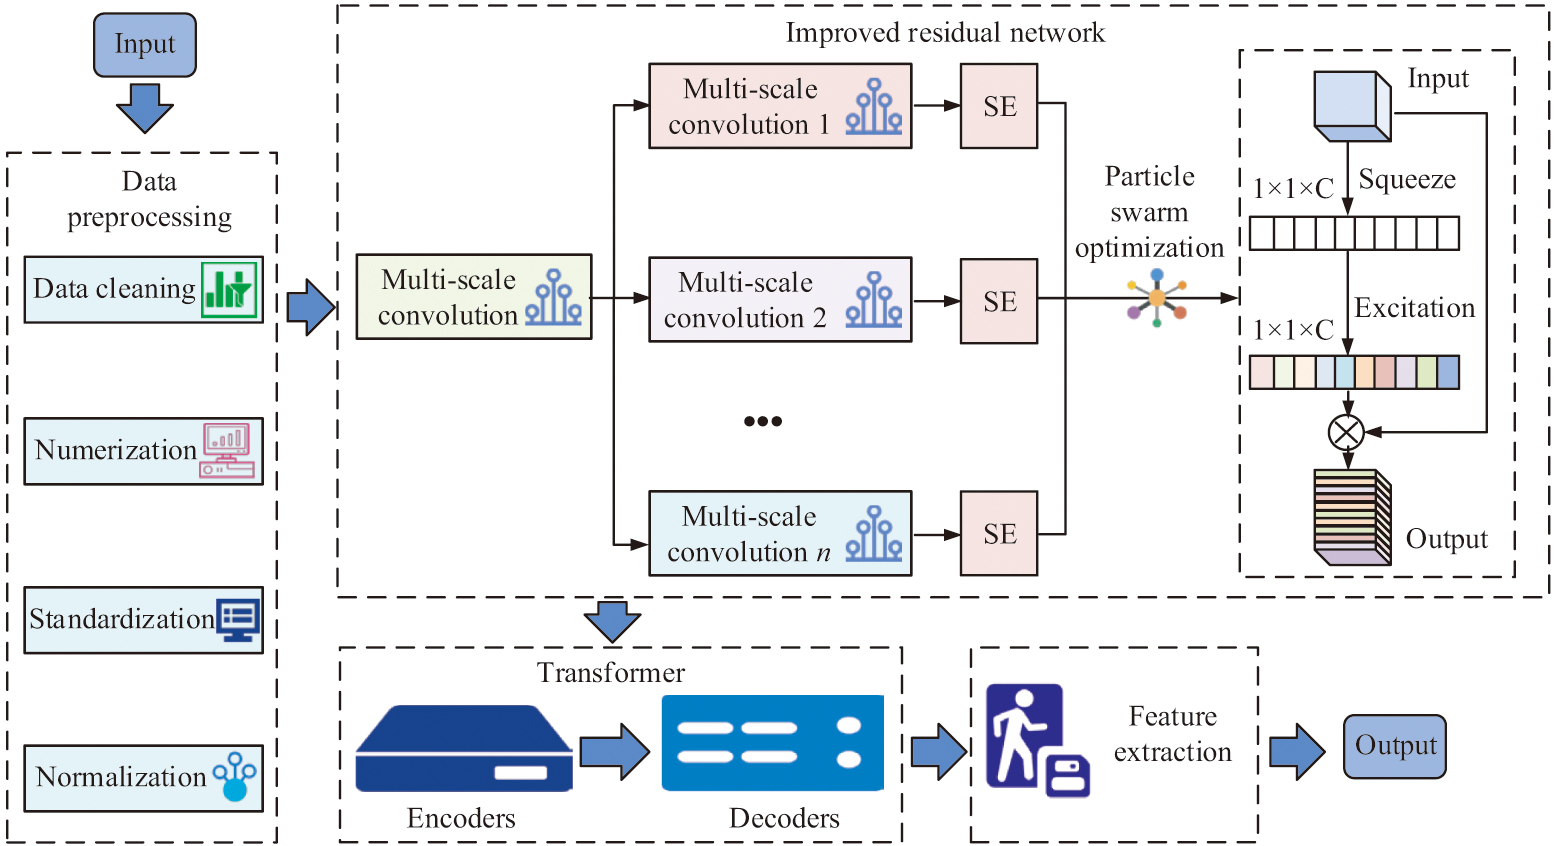 Fig. 2. Schematic diagram of student multidimensional FE method based on MSC and Transformer.
The extraction of multidimensional features of students is demonstrated in Fig. 2. The data preprocessed is subjected to multiple MSC modules for different levels of FE, and important features are highlighted by the SE module. Then Transformer is utilized to capture the global dependencies of the input data and output the final features.
B.ENTREPRENEURIAL INTENTION BASED ON IMPROVED RESNET WITH MULTI-AM
After the study extracts students’ multidimensional features through MSC and Transformer methods, further assessment of students’ entrepreneurial intentions is needed. Nonetheless, conventional assessment methodologies frequently depend on questionnaires or rudimentary statistical analysis, which are cumbersome in capturing the intricate patterns and profound relationships inherent in students’ multidimensional data. In recent years, significant advancements have been witnessed in the field of artificial intelligence technology across multiple domains [24]. Therefore, the study proposes a method for assessing students’ entrepreneurial intentions based on improved ResNet with multi-AM, aiming to improve the Acc of the assessment model and optimize EE. The method captures the relationship between features more comprehensively by introducing a multi-head AM that weighs features from multiple perspectives [25]. The structure of the multi-head AM is schematically shown in Fig. 3.
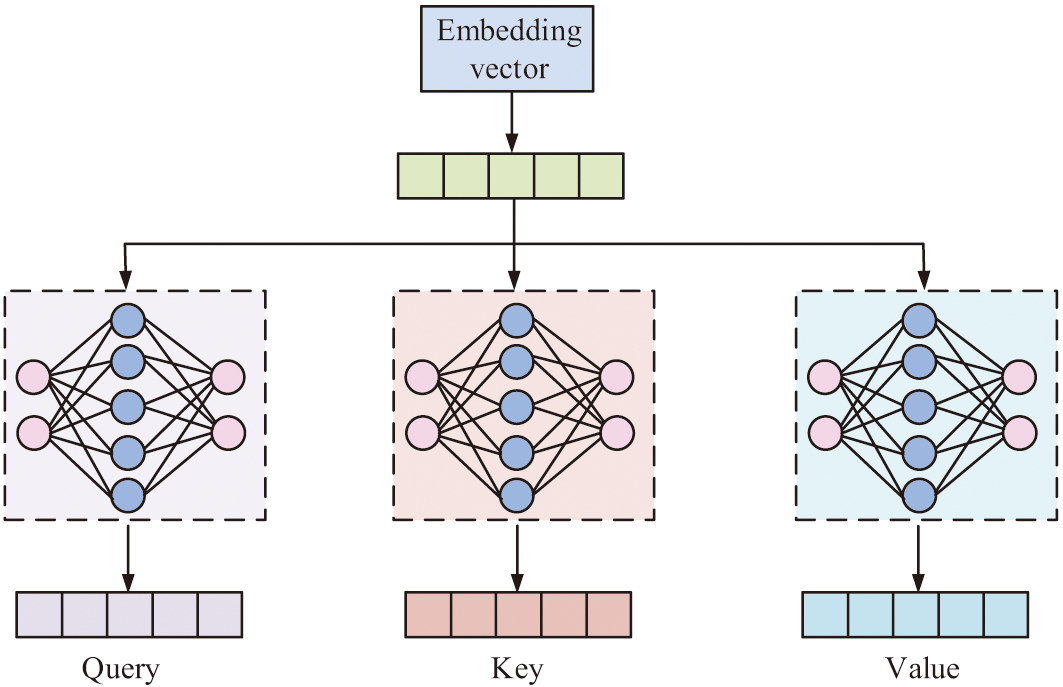 Fig. 3. Schematic diagram of the structure of multi-head AM.
In the assessment of students’ entrepreneurial intention, different features affect entrepreneurial intention to different degrees. This study captures the different features of the input sequence through the mechanism of multiple attention to assess students’ entrepreneurial intention more accurately. Its calculation is shown in equation (6):
In equation (6), is the output of the AM. is the query, key, and value matrix. is the dimension of the key matrix. To enhance the model’s capacity to discern features, the study incorporated the channel AM and the spatial AM [26]. The channel AM compiles the global information of features through the implementation of GAP and global maximum pooling (GMP) operations, and it utilizes a multilayer perceptron to weigh the channels, as expressed in equation (7) [27]:
In equation (7), denotes the final weight representation. denotes the multilayer perceptron. and are the maximum and average values in the input features, respectively. The spatial AM captures the spatial information of the features through GAP and GMP operations and weights the spatial locations using convolution operations. Its expression is shown in equation (8):
In equation (8), denotes the features obtained by splicing operation. and denote the maximum and average values of the input features, respectively. denotes the feature after convolution operation. denotes one-dimensional convolution operation. denotes spatial attention weight. denotes the original input features. The structural organization of the channel attention (CA) and spatial AM is illustrated schematically in Fig. 4.
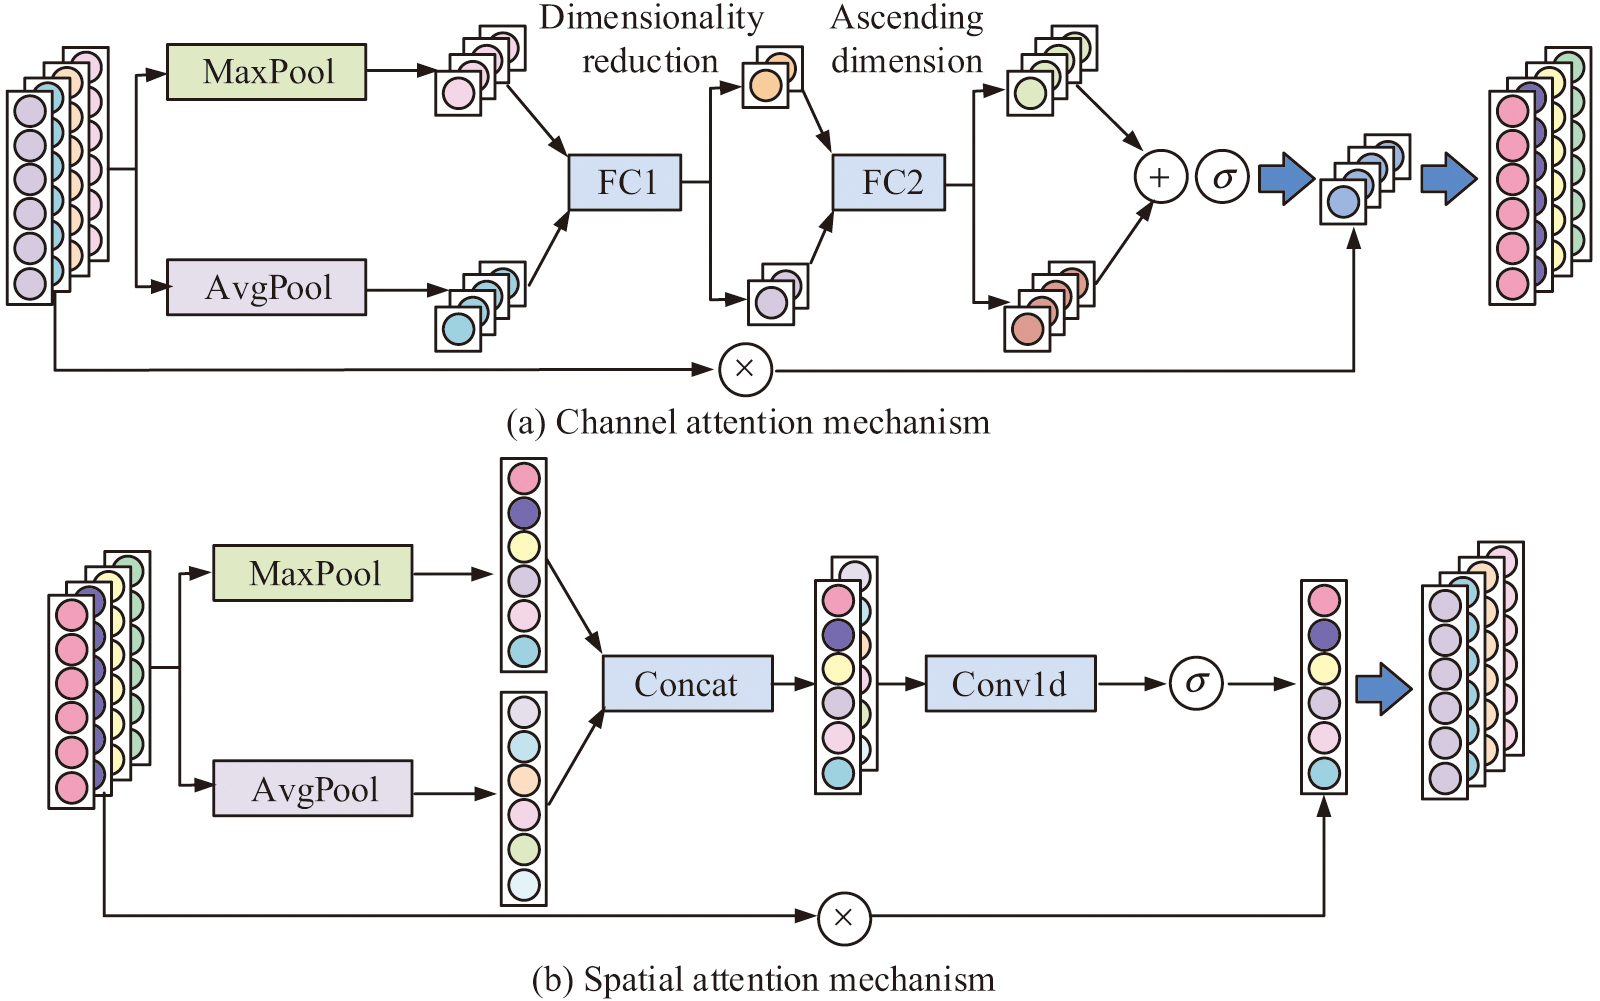 Fig. 4. Schematic diagram of the structure of CA and spatial AM.
In Fig. 4, the channel AM obtains different feature representations through maximum pooling and average pooling operations, respectively, and then performs downscaling and upscaling on the FCL to obtain weighted features. The spatial AM first captures the maximum and average value information in the space through maximum pooling and average pooling operations. Then, pooling is performed on the channel dimensions and processed through the CL to generate the spatial attention weights [28]. After capturing the global and spatial information of the features, the study combines the improved ResNet with the multi-AM and constructs an efficient model for assessing students’ entrepreneurial intentions. The method first takes the multidimensional data of college students in the process of EE as input and performs data cleaning, feature standardization, and normalization. Then, local and global feature keys are extracted from the students’ multidimensional data using the improved ResNet. In the proposed FE, the study introduces channel AM and spatial AM to further refine the weights of features to identify and emphasize important features. After that, the study employs a binary cross-entropy loss function to measure the difference between the model output and the real label. Finally, the output of student entrepreneurial intention assessment results. The schematic diagram of student entrepreneurial intention assessment is shown in Fig. 5.
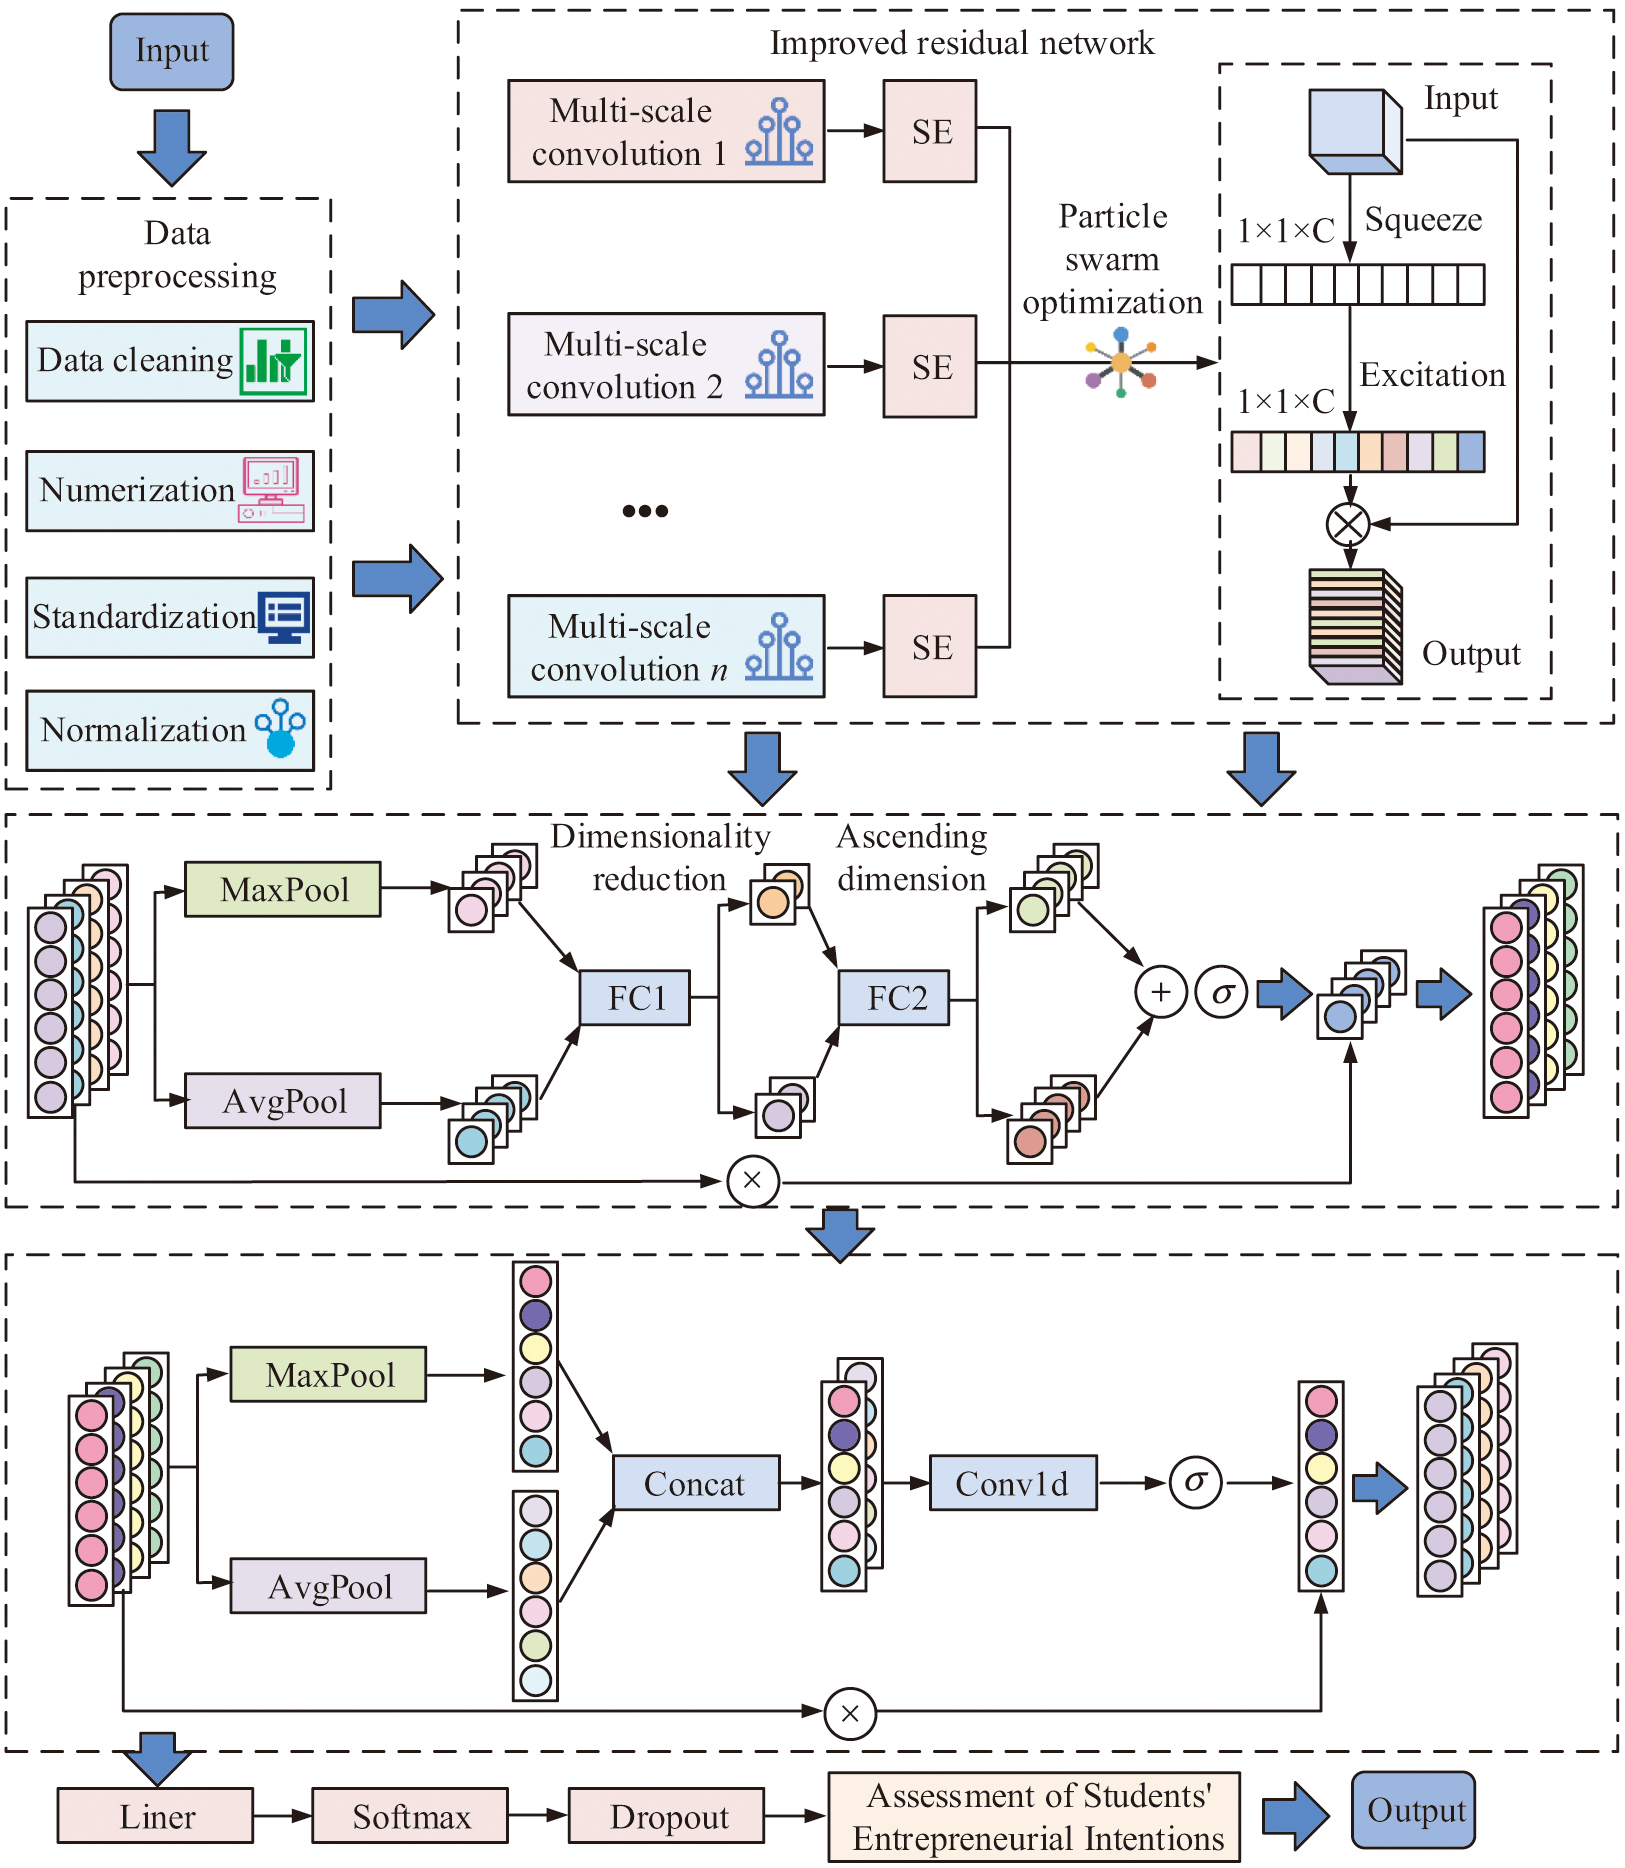 Fig. 5. Schematic diagram of student entrepreneurial intention evaluation based on improved residual network and multi-AM.
III.RESULTS AND DISCUSSIONS
This part examines the effects of entrepreneurship practice and course instruction on students’ entrepreneurial intention and evaluates the effectiveness of the suggested FE approach and the assessment model of students’ entrepreneurial intention.
A.PERFORMANCE VALIDATION OF MULTIDIMENSIONAL FE METHODS FOR STUDENTS
The study carries out experiments using datasets based on the theory of planned behavior (TPB) and datasets analyzed by the structural equation model (SEM) in an attempt to verify the effectiveness of the suggested multidimensional FE technique for students. The SEM dataset is obtained by analyzing students’ performance and participation in entrepreneurship courses and activities. The data covers students’ participation in lectures, assignments, group projects, and practical activities collected over the course of two academic years. This dataset contains over 1500 student samples and 20 comprehensive features of educational psychology. The TPB dataset is collected through a survey questionnaire distributed to students at the end of entrepreneurship courses. The questionnaire is designed based on the planned behavior theory framework and includes questions related to students’ attitudes, subjective norms, perceived behavioral control, and entrepreneurial intentions. This dataset contains over 1200 student samples and 15 entrepreneurial intention-related features. The study processes missing values through interpolation methods and identifies and removed outliers using statistical methods to ensure data integrity and consistency. Relevant features are selected based on their relevance to entrepreneurial intentions. Features including students’ grades, participation rates, and survey responses are included in the analysis. Then the data is normalized to ensure that all features are within a similar dimensional range. Thirty percent of the experiment’s data is used as the test set, while 70 percent is used as the training set. The experimental environment is set as follows: the operating system is Windows 10, the processor is Intel Core i7-11700, the RAM is 16GB, and the programming environment is Python 3.8. The learning rate, batch size, dropout, and model training period are set at 0.0001, 64, 0.5, and 100, respectively.
Initially, the experiments are analyzed in the SEM analysis dataset and TPB dataset to assess the Acc of the proposed method and to compare it with existing models. Comparison models include improved ResNet, deep belief network (DBN), convolutional neural network and LSTM (CNN-LSTM), and recurrent neural network and LSTM (RNN-LSTM). When there are 20 training rounds in the SEM dataset, as shown in Fig. 6(a), the Acc of the ResNet and DBN models is 69.89% and 73.64%, respectively. The Acc of CNN-LSTM, RNN-LSTM, and the proposed model are 78.12%, 80.05, and 84.77%, respectively. When the training rounds reach 80, the Acc of the five models is 82.82%, 85.68%, 88.96%, 90.08%, and 93.69%, respectively. In Fig. 6(b), the Acc of ResNet, DBN, CNN-LSTM, and RNN-LSTM models in the TPB dataset with 80 training rounds is 83.66%, 86.96%, 92.15%, and 94.13%, respectively. The suggested model’s Acc is 97.62%, which is greater than the Acc of the other four models by 13.96%, 10.66%, 5.47%, and 3.49%, respectively. The outcomes demonstrate that the suggested approach is feasible.
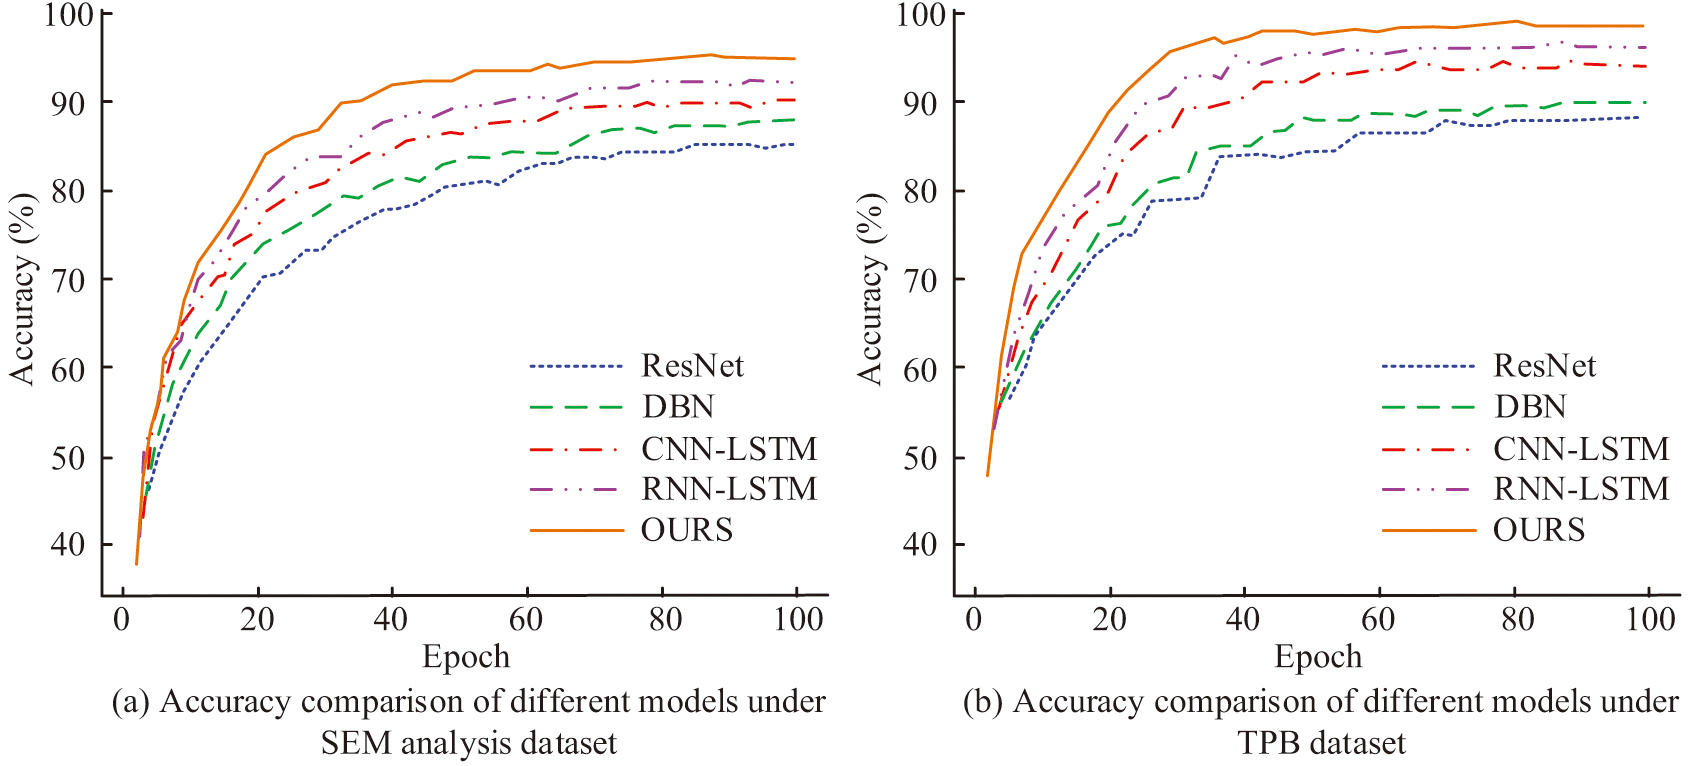 Fig. 6. Results of comparing the accuracy of various models over two datasets.
To verify the effectiveness and convergence performance of the proposed method, the study analyzes the loss of the proposed model in two datasets and compares it with existing algorithms. The results are shown in Fig. 7. In Fig. 7(a), when the number of training rounds in the SEM dataset is 20, the losses of the ResNet, DBN, CNN-LSTM, and RNN-LSTM models are 0.326, 0.289, 0.267, and 0.258, respectively, and the loss of the proposed model is 0.228. When the number of training rounds reaches 80, the losses of the five models are 0.241, 0.212, 0.195, 0.173, and 0.148. In Fig. 7(b), in the TPB dataset, the losses of the five models are 0.326, 0.287, 0.268, 0.234, and 0.195 when the number of training rounds is 20. When the number of training rounds reaches 80, the losses of ResNet and DBN models are 0.208 and 0.172, respectively. The losses of CNN-LSTM and RNN-LSTM models are 0.165 and 0.148, respectively, and that of the research-proposed model is 0.126. The findings indicate that the proposed model exhibits superior loss and convergence performance when studied.
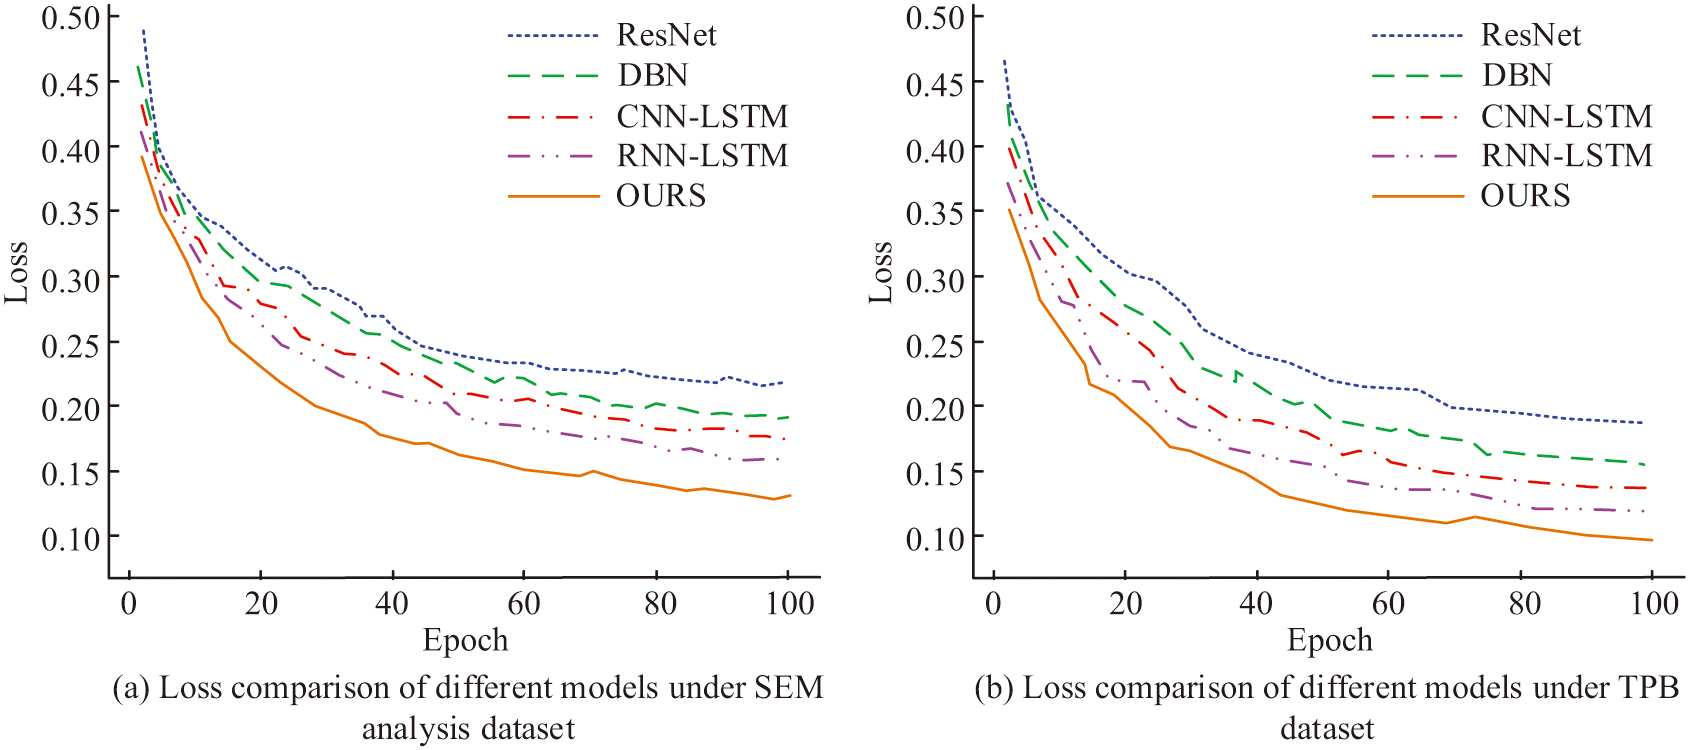 Fig. 7. Loss comparison results of different models under two datasets.
The experiments are further conducted to compare and analyze the precision, recall, and F1 of different models under the two datasets as a way to verify the reliability of the proposed method. Figure 8 presents the findings. In Fig. 8(a), the precision of ResNet, DBN, CNN-LSTM, and RNN-LSTM models in the SEM dataset are 0.892, 0.858, 0.908, and 0.887, respectively. The recall rates are 81.85%, 80.03%, 84.12%, and 84.66%, respectively. The F1 score is 0.858, 0.841, 0.902, and 0.867, respectively. Compared with it, the proposed model has a precision of 0.928, which is an improvement of 3.88%, 7.54%, 2.165%, and 4.42%. Its recall and F1 score are 86.27% and 0.889, respectively. In Fig. 8(b), the precision of the five models in the TPB dataset is 0.908, 0.882, 0.901, 0.915, and 0.956, respectively. The recall rates are 83.39%, 81.47%, 84.92%, 85.09%, and 89.13%, respectively. The F1 scores are 0.864, 0.841, 0.892, 0.905, and 0.912, respectively. The findings demonstrate that the suggested model outperforms the other examined models in terms of precision, recall, and F1 scores.
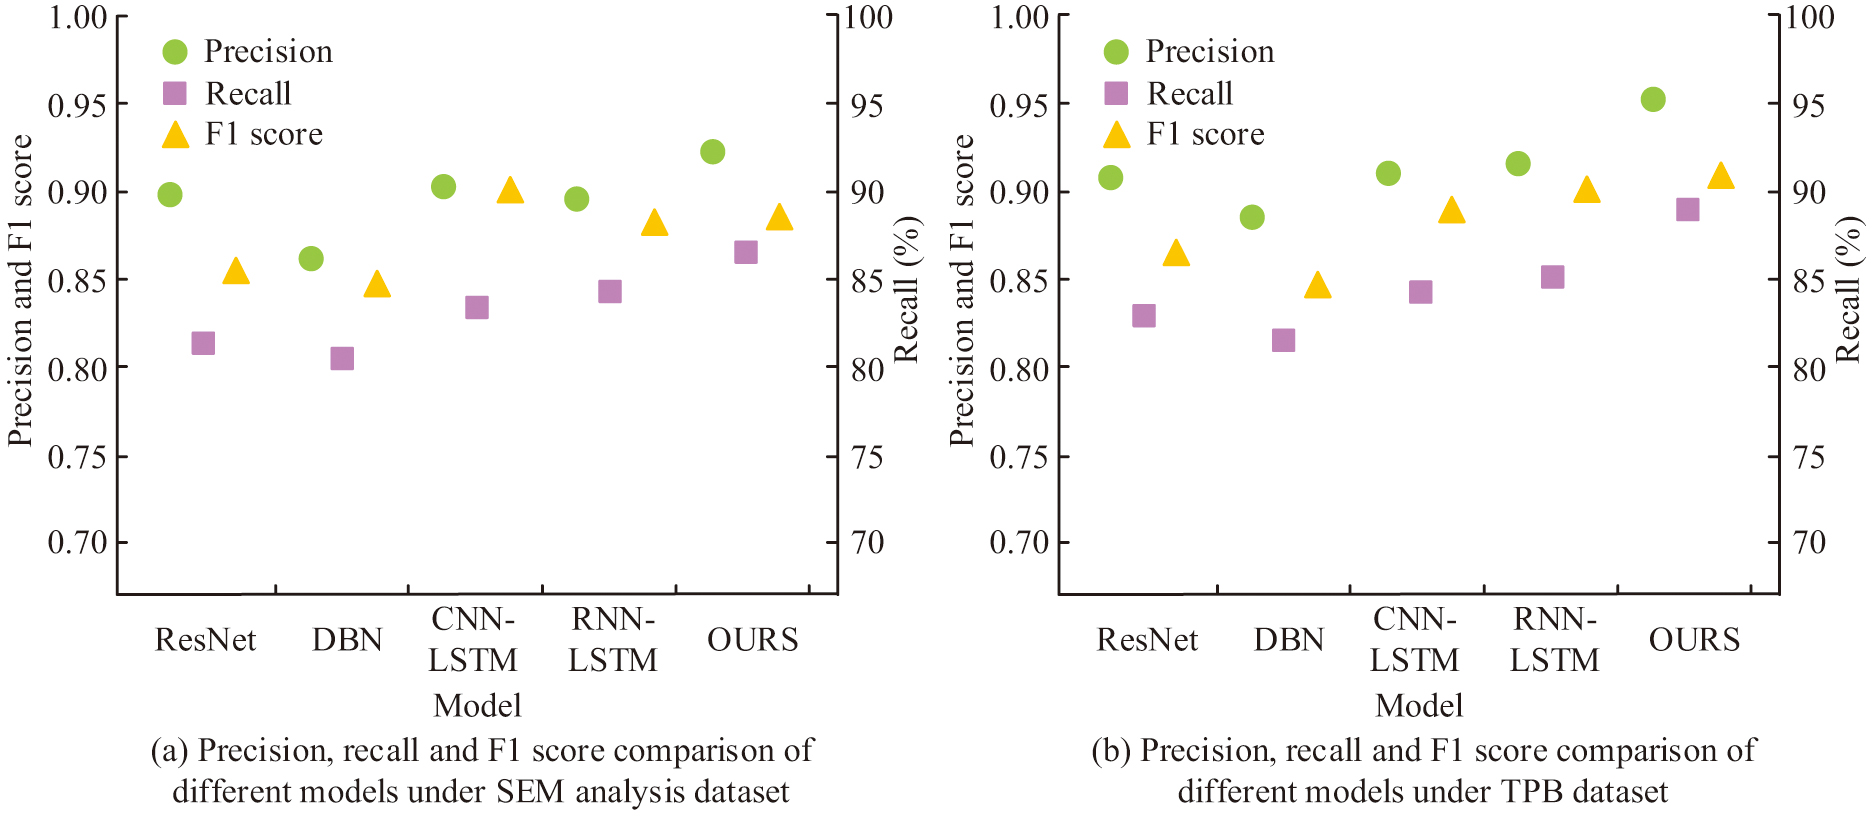 Fig. 8. Precision, recall, and F1 score of different models on two datasets.
B.PERFORMANCE ANALYSIS AND PRACTICAL APPLICATION OF STUDENT ENTREPRENEURIAL INTENTION ASSESSMENT METHODS
The experiment compares the Acc and loss of the proposed entrepreneurial intention assessment model in the SEM analysis dataset and the TPB dataset. The study analyzes the model in comparison with existing models. The comparison models include PSO and grey wolf optimizer (PSO-GWO) model, deep neural network-enhanced feature selection (DNN-EFS) model. The results are shown in Fig. 9. In Fig. 9(a), when the quantity of training rounds is 80, the Acc of PSO-GWO and DNN-EFS models in the SEM dataset are 91.26% and 93.64%, respectively. The Acc in the TPB dataset are 91.82% and 95.58%, respectively. The Acc of the proposed model in these two datasets is 95.89% and 97.65%, respectively. In Fig. 9(b), the losses of the three models in the SEM dataset are 0.048, 0.042, and 0.038, respectively, when the quantity of training rounds is 80. The losses in the TPB dataset are 0.046, 0.037, and 0.031, respectively. The outcomes illustrate that the proposed model has a significant performance advantage over different datasets. Moreover, it can assess the entrepreneurial intention of students more accurately.
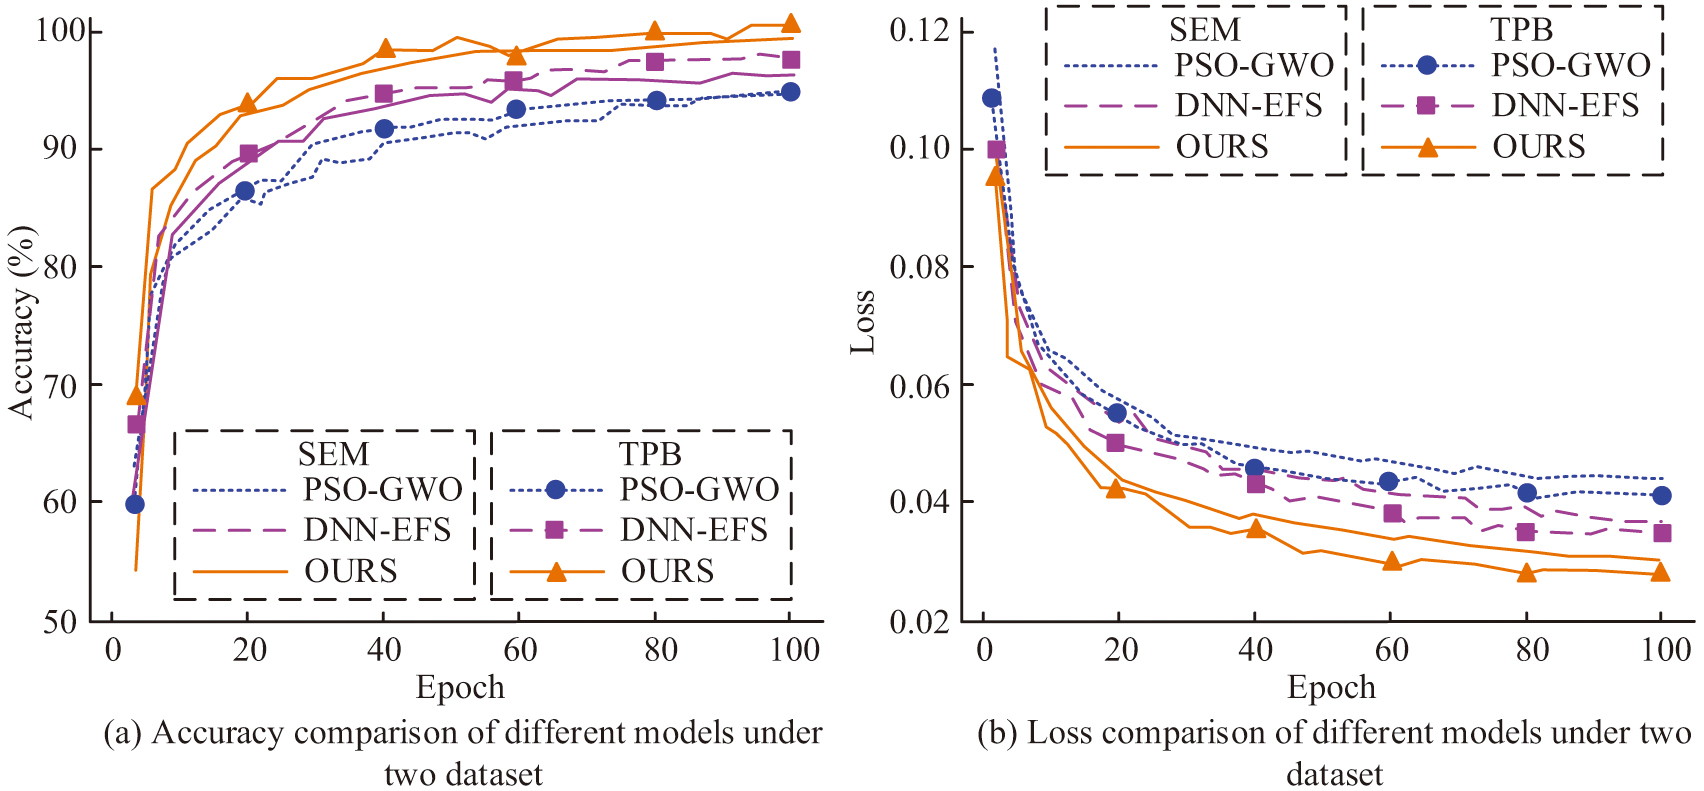 Fig. 9. Precision, recall, and F1 score of different models on two datasets.
The study compares and analyzes the model’s mean squared error (MSE), root mean squared error (RMSE), and mean absolute error (MAE) across several datasets in order to confirm the superiority of the suggested model. It is also compared with PSO-GWO and DNN-EFS models. The results are shown in Fig. 10. In Fig. 10(a), in the SEM dataset, the MSE, RMSE, and MAE of the PSO-GWO model are 0.265, 0.513, and 0.248, respectively. The MSE of the DNN-EFS model and the proposed model are 0.215 and 0.082, the RMSE is 0.447 and 0.360, and the MAE is 0.228 and 0.073, respectively. In Fig. 10(b), the MSE of the three models in the TPB dataset is 0.030, 0.191, and 0.163, respectively. The RMSE is 0.538, 0.456, and 0.403, respectively. The MAE is 0.319, 0.178, and 0.102, respectively. The results show that the proposed method of assessing students’ entrepreneurial intentions in the study has a high level of predictive precision and robustness.
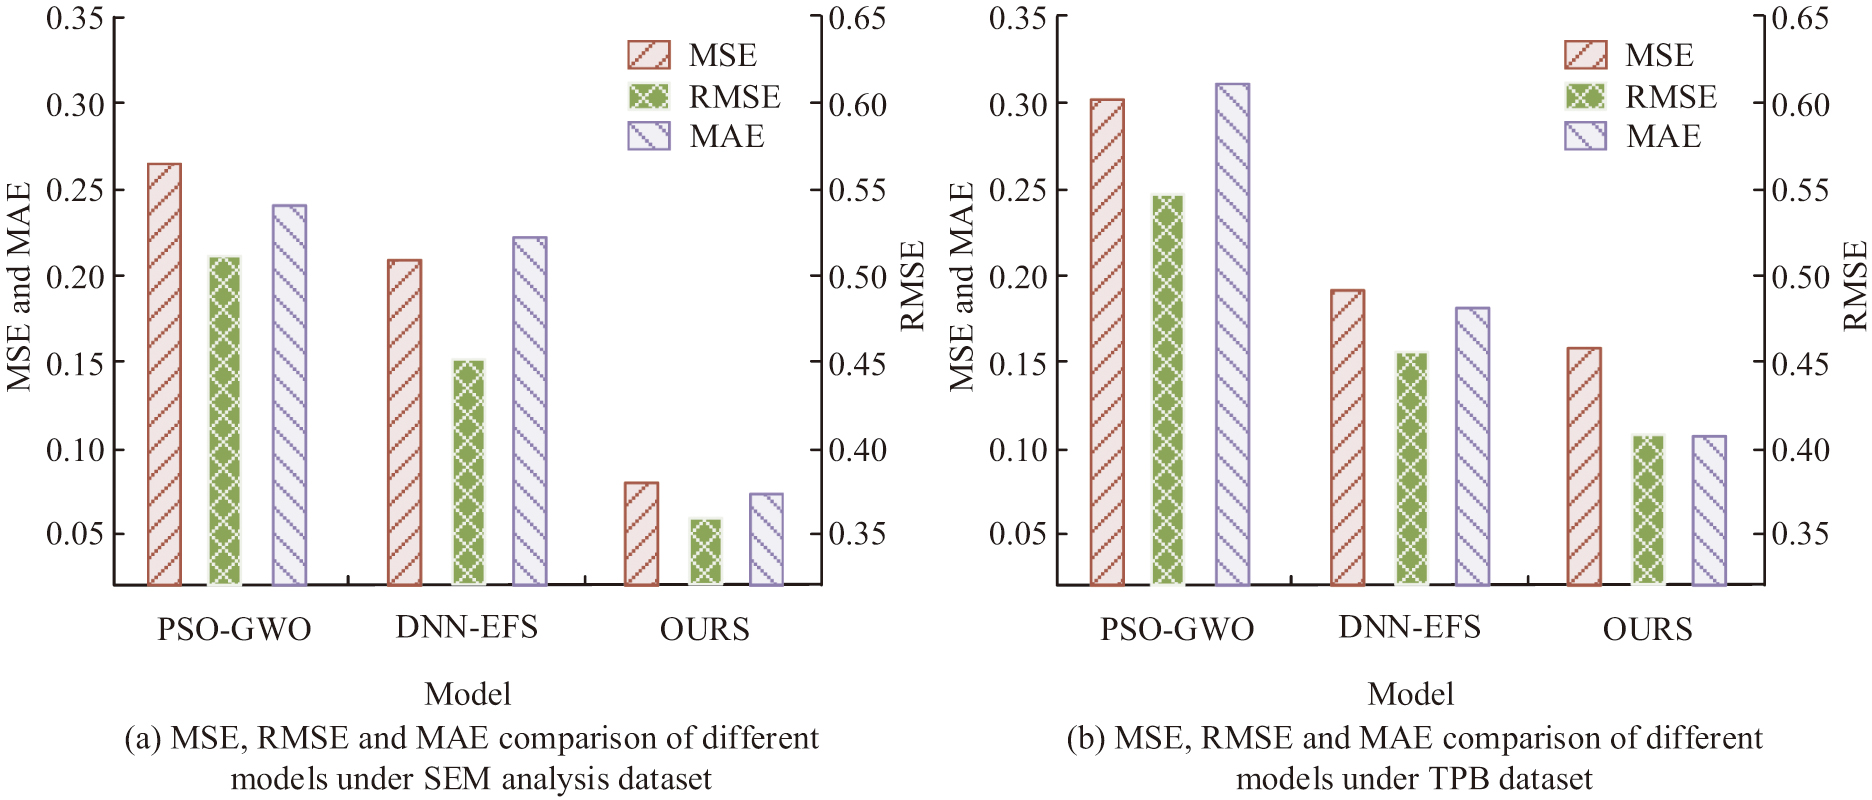 Fig. 10. MSE, RMSE, and MAE of different models on two datasets.
To assess the impact of key components such as ResNet and AM on the performance of students’ entrepreneurial intention assessment before and after improvement, the study conducted ablation experiments. The structure is shown in Table I. Compared with the baseline model, the Acc and precision of the proposed model of the study are improved by 16.7% and 17.4%, respectively, recall is increased by 17.2%, and F1 score and area under the curve (AUC) are improved by 15.4% and 13.0%, respectively. The outcomes indicate that the suggested model can accurately gauge students’ entrepreneurial intention and consistently performs better than the baseline model.
Table I. Results of ablation experiment
| Model | Accuracy | Precision | Recall | F1 score | AUC |
|---|---|---|---|---|---|
| Baseline model | 0.756 | 0.724 | 0.736 | 0.725 | 0.781 |
| ResNet with multi-scale convolution | 0.805 | 0.780 | 0.798 | 0.786 | 0.822 |
| ResNet with multi-scale convolution + SE module | 0.836 | 0.812 | 0.823 | 0.812 | 0.850 |
| ResNet with multi-scale convolution + SE module + Transformer | 0.865 | 0.844 | 0.856 | 0.846 | 0.886 |
| ResNet with multi-scale convolution + SE module + Transformer + multi-AM | 0.923 | 0.898 | 0.908 | 0.879 | 0.911 |
The experiment further explores the influence of EE on students’ entrepreneurial intention by taking the EE program of a university as an example. Its influence weight is also evaluated, aiming to accurately assess students’ entrepreneurial intention through deep learning techniques. EE mainly includes entrepreneurship course education and practical education. Entrepreneurship curriculum education covers entrepreneurship courses, entrepreneurship lectures, and entrepreneurship books. Entrepreneurship practice education includes entrepreneurship competitions, entrepreneurship activities, and entrepreneurship clubs. In Fig. 11(a), in entrepreneurship curriculum education, entrepreneurship courses and entrepreneurship lectures have impact weights of 0.31 and 0.22, respectively. Entrepreneurship books have a lower impact weight of 0.12. In Fig. 11(b), in entrepreneurship practice education, entrepreneurship competition has a greater impact on students’ entrepreneurial intention, with an impact weight of 0.32. The impact weights of entrepreneurship activities and entrepreneurship clubs are 0.23 and 0.18, respectively. The results show that education in both entrepreneurship courses and entrepreneurial practice play a significant role in students’ entrepreneurial intentions. They are more effective in enhancing students’ entrepreneurial intentions.
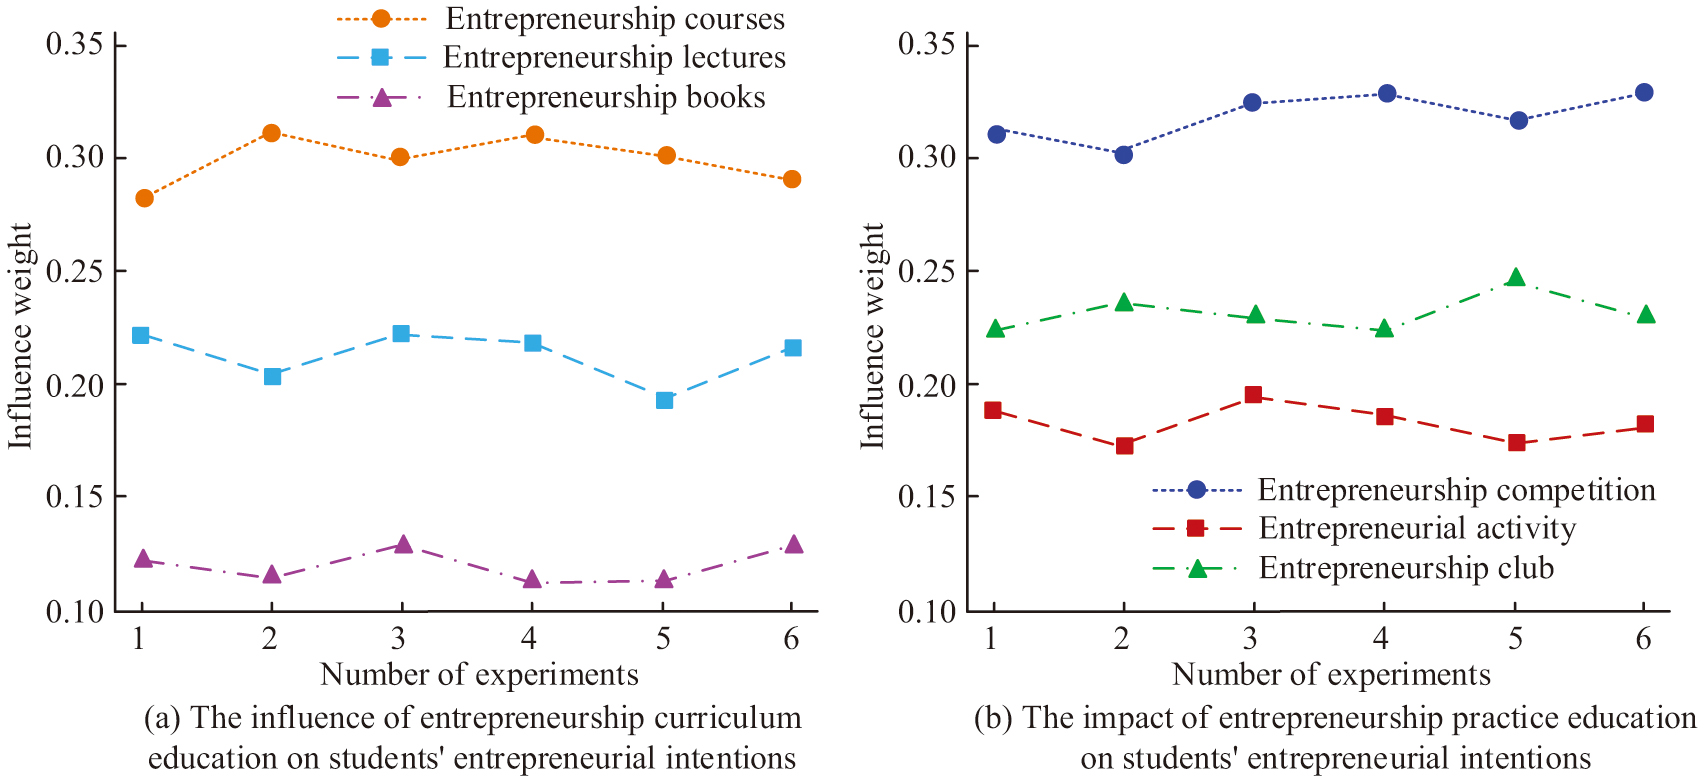 Fig. 11. The impact of practical and curriculum-based EE on students’ aspirations to start their own business.
IV.CONCLUSION
The study proposed a method for assessing students’ entrepreneurial intention in EE based on improved ResNet and multi-AM, aiming to enhance the precision and reliability of the assessment by introducing artificial intelligence technology. The experimental results indicated that the Acc of the proposed model reached 93.69% after 80 rounds of training in the SEM dataset. For the TPB dataset, the Acc of the model was as high as 97.62%, which was significantly higher than 83.66% for ResNet and 94.13% for RNN-LSTM. The findings indicated that the multidimensional aspects in student data may be successfully captured by the suggested model. The results of the ablation experiments revealed that the Acc of the proposed model reached 92.3%, the precision was 89.8%, the recall was 90.8%, and the F1 score was 87.9%, which was significantly higher than that of the baseline model. In the analysis of the effect of EE on students’ entrepreneurial intentions, entrepreneurship courses and entrepreneurship lectures had the highest impact weights of 0.31 and 0.22, respectively. Entrepreneurship competitions had the highest impact weight of 0.32 in practical EE. The aforementioned findings suggested that, in comparison to conventional techniques, the proposed model could yield more accurate and trustworthy results when evaluating entrepreneurial ambitions. This study had one shortcoming: the dataset was limited to a specific context. This may not fully capture the diversity of entrepreneurial intentions among students from different regions and cultures. More varied datasets should be introduced in future studies to improve the model’s capacity for generalization.