I.INTRODUCTION
The urgency of sustainable development has been acknowledged since the Brundtland Report (1987), which highlighted the need to integrate environmental, economic, and social considerations into development strategies [1]. In response to escalating ecological degradation, social inequality, and economic disparities, organizations across sectors have aligned their operations with the Sustainable Development Goals (SDGs) [2]. Although many firms have adopted responsible practices, others continue to generate substantial environmental and social externalities, underscoring the need for transparent and standardized sustainability assessment frameworks [3,4].
Among these frameworks, the Global Reporting Initiative (GRI) has emerged as the leading global standard for sustainability disclosure [5]. Introduced in the late 1990s, the GRI provides structured guidelines enabling organizations to report performance across economic, environmental, and social dimensions. Its widespread adoption reflects its institutional role in strengthening transparency, comparability, and accountability in sustainability reporting [6,7].
In Indonesia, GRI adoption has grown among large enterprises, although implementation among small- and medium-sized firms remains limited due to regulatory and resource constraints [8,9]. Despite these challenges, GRI-based reporting has been shown to enhance governance, strengthen corporate reputation, and attract socially responsible investment [10].
However, the assurance and audit of sustainability reports still face challenges related to data quality, consistency, and heavy reliance on manual review. Auditor fatigue, subjective interpretation, and data omissions can compromise report credibility, heighten the risk of greenwashing, and weaken stakeholder trust [11,12].
This study proposes SmartGRI, an innovative Group Decision Support System (GDSS) designed to enhance the sustainability audit process through automated data extraction, validation, and multicriteria analysis. By integrating digital tools with collaborative decision-making features, SmartGRI improves audit efficiency, accuracy, and objectivity while enabling real-time interaction among auditors, sustainability teams, and stakeholders [13,14]. Conceptually, SmartGRI contributes to sustainability reporting and audit theory by operationalizing data-driven and participatory governance principles within a unified technological framework [15].
The remainder of this paper is organized as follows: Section II presents the methodology and GDSS architecture; Section III explains the experimental setup and evaluation metrics; Section IV reports and discusses the findings; and Section V concludes the study and outlines directions for future research.
II.LITERATURE REVIEW
The GRI remains the dominant framework for sustainability reporting, offering standardized guidelines for disclosing environmental, social, and economic impacts [15,16]. Prior studies show that GRI enhances reporting comparability and transparency [17], though concerns persist regarding superficial disclosures, selective reporting, and limited stakeholder engagement [18–20]. Variations in reporting quality across sectors further undermine the consistency and credibility of sustainability communication [21]. Recent scholarship therefore calls for the use of digital and intelligent systems to improve report verifiability, accessibility, and analytical depth [22].
Decision support systems (DSSs) have gained prominence for managing complex sustainability evaluations by integrating data analytics with structured decision logic [23,24]. GDSSs extend this capability by facilitating collective assessments, reducing bias, and supporting consensus—critical features in sustainability audits that require multi-stakeholder participation [24,25]. GDSS is therefore increasingly viewed as a suitable mechanism for auditing GRI-based reports, supporting transparency, and strengthening the rigor of sustainability evaluations [21,26].
Multi-attribute decision-making (MADM) methods also play a key role in structuring and analyzing conflicting sustainability criteria under uncertainty [27,28]. Classical approaches such as Analytic Hierarchy Process assist in indicator prioritization but are limited by their reliance on precise expert judgments [29,30]. Enhanced methods like Fuzzy TOPSIS introduce greater flexibility through fuzzy logic to better accommodate ambiguity in sustainability assessments [31,32]. Despite their strengths, most MADM methods still require intensive expert input, highlighting the need for integrated, technology-driven approaches that can support more consistent and scalable sustainability decision-making [33,34].
III.RESEARCH METHODOLOGY
A.OVERVIEW AND FLOWCHART DESIGN
This study applies a design-and-validation approach to develop SmartGRI, a GDSS designed to evaluate sustainability reports in accordance with the GRI framework. The methodology integrates system development principles, MADM techniques, and simulation-based validation, aiming to produce a collaborative audit model that is transparent, data-driven, and scalable [29]. As shown in Fig. 1, the workflow consists of five phases: (1) problem definition, (2) system design, (3) decision logic development, (4) evaluation matrix construction, and (5) simulation-based validation. These stages guide the systematic development of SmartGRI as an evidence-based decision-support tool.
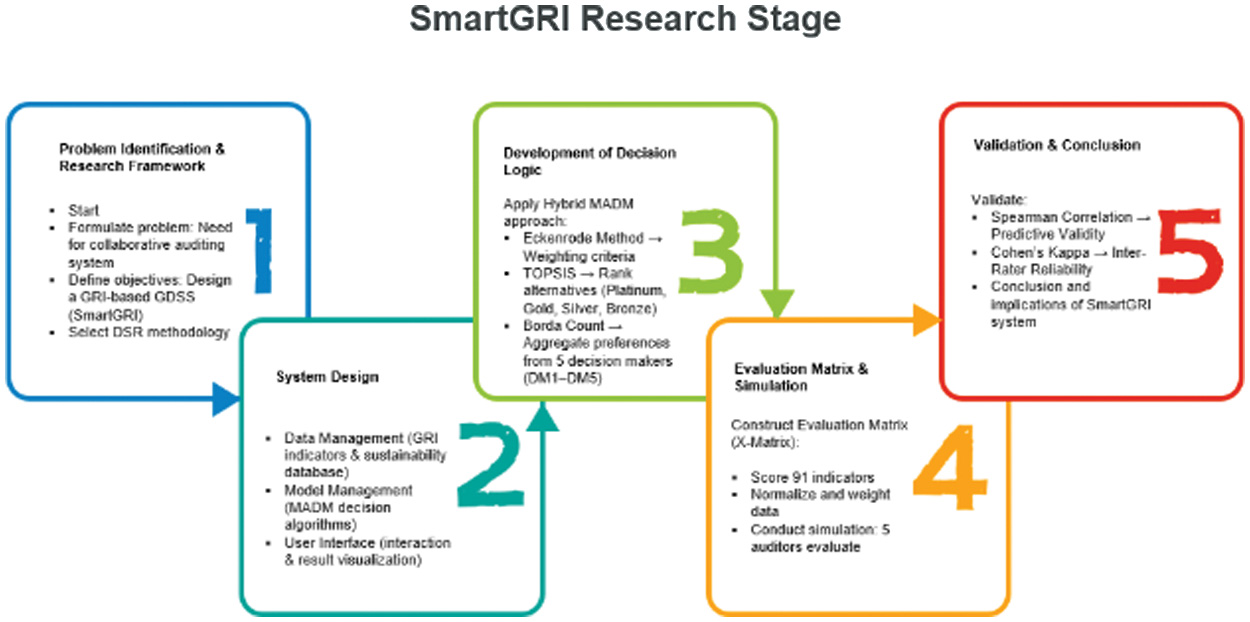 Fig. 1. Stages of SmartGRI research methodology based on design science research and hybrid MADM approach.
B.SYSTEM ARCHITECTURE DESIGN
Using a Design Science Research (DSR) framework, SmartGRI is developed to support institutional auditors in collaboratively assessing sustainability disclosures. Its architecture comprises three integrated components:
- 1.Data Management, which ensures the integrity and accessibility of sustainability indicators;
- 2.Model Management, which embeds MADM algorithms—Eckenrode, TOPSIS, and Borda—to generate analytical outputs; and
- 3.User Interface, which facilitates interactive data entry, result review, and visualization.
C.DEVELOPING DECISION LOGIC
SmartGRI employs a hybrid MADM framework combining the Eckenrode method for weighting, TOPSIS for alternative ranking, and Borda Count for integrating group preferences. Five decision-makers (DM1–DM5) evaluate 91 GRI indicators using a three-level ordinal scale [35]. Eckenrode-derived weights feed into TOPSIS, and individual rankings are consolidated using Borda to achieve a consensus-based decision. This integration provides a balanced approach suitable for complex sustainability assessments.
D.EVALUATION MATRIX CONSTRUCTION
The system’s analytical core is the X-matrix, which maps four sustainability alternatives—platinum, gold, silver, and bronze—against 91 GRI indicators. Auditor scores are normalized and combined with Eckenrode weights to produce a fair and transparent comparison of alternatives. The X-matrix ensures consistent interpretation and supports objective, evidence-based decision-making.
E.VALIDATION THROUGH SIMULATION
SmartGRI is validated through simulations involving five auditors evaluating four corporate sustainability reports. System outputs are compared with official audit results using two metrics: Spearman’s rank correlation for predictive validity and Cohen’s Kappa for inter-rater reliability. The results confirm SmartGRI’s technical robustness and practical relevance for real-world sustainability audits, where accuracy and transparency are essential.
IV.RESULTS AND DISCUSSION
A.SMARTGRI FRAMEWORK
SmartGRI is a systematically designed GDSS architecture that supports collaborative decision-making for assessing sustainability reports aligned with the GRI framework. As shown in Fig. 1, the system integrates functional modules that enhance the accuracy, transparency, and objectivity of sustainability audits by combining data-driven logic, analytical models, and an interactive interface. The Data Management Module serves as a centralized repository for sustainability indicators, audit standards, organizational performance data, and external references such as the NCCR, ensuring consistency, traceability, and data integrity. The Model Management Module implements a hybrid MADM framework—Eckenrode for weighting, TOPSIS for ranking, and Borda for group aggregation—enabling adaptive and comprehensive evaluation while addressing common limitations of manual audit practices. The User Interface Module provides an interactive environment for data input, review of analytical outputs, and collaborative assessment, supported by intuitive visualizations. Finally, the Decision Ranking Module generates ranked sustainability report outcomes along with justifications derived from individual and aggregated scores, reinforcing the credibility and accountability of the overall audit process.
B.GDSS-BASED MODEL DESIGN FOR GRI EVALUATION
The primary outcome of this study is the development of a GDSS model aligned with GRI standards, designed to support systematic and participatory assessment of corporate sustainability performance. The model operates through a multi-phase procedure that includes defining decision alternatives, constructing an evaluation matrix, determining indicator weights, ranking alternatives using multicriteria decision-making techniques, and integrating stakeholder preferences into a collaborative group decision-making framework.
The system evaluates four sustainability rating alternatives—Platinum (A1), Gold (A2), Silver (A3), and Bronze (A4)—based on 91 performance indicators derived from the GRI reporting guidelines [28]. These indicators are organized into six thematic dimensions: economic, environmental, social, human rights, community responsibility, and product responsibility. Each indicator carries a unique identification code and is grouped according to its thematic category to ensure structured analysis, traceability, and alignment with GRI compliance requirements.
The classification scheme and indicator taxonomy used in this study are summarized in Table I, which form the core reference for constructing the evaluation matrix and conducting performance assessments within the SmartGRI framework [29].
Table I. Sustainability dimensions based on GRI indicators
| Dimension | Key aspects | Indicator codes | Main assessment focus |
|---|---|---|---|
| 1. Economic | Economic performance, market presence, indirect economic impact, procurement practices | ECO1–ECO9 | Economic value creation, wage and local hiring, indirect economic impacts, local supplier engagement |
| 2. Environmental | Materials, energy, water, biodiversity, emissions, effluent and waste, environmental compliance | ENV1–ENV33 | Material use, energy and water consumption, biodiversity impacts, GHG emissions, waste management, environmental compliance |
| 3. Social (Labor & Employment) | Employment, labor relations, occupational health and safety, training and education, diversity and equality | SOC1–SOC16 | Recruitment and turnover, occupational safety, employee development, gender/equality metrics, supplier labor practices |
| 4. Human rights | Non-discrimination, freedom of association, child and forced labor, security practices, human rights assessment | HUM1–HUM12 | Anti-discrimination, prevention of forced/child labor, human rights due diligence, supplier human rights impacts |
| 5. Community and public responsibility | Local community, anti-corruption, public policy, anti-competitive behavior, compliance | PUB1–PUB11 | Community engagement, corruption risk, political involvement, competitive behavior, community-related supplier impacts |
| 6. Product responsibility | Customer health and safety, product labeling, marketing communications, customer privacy, product compliance | PRD1–PRD10 | Product/service safety, labeling accuracy, marketing ethics, consumer privacy protection, regulatory compliance |
C.GDSS COMPLETION STAGES
The GDSS operates in three steps: weighting, ranking, and aggregation.
1).ECKENRODE WEIGHTING
Five auditors assign each indicator an importance score (Major = 4, Minor = 3, Observed = 1). Total scores are normalized to generate criterion weights:
D.DISCUSSION OF IMPLICATIONS
The SmartGRI model was validated through real-case simulations involving five independent auditors (DM1–DM5) (Fig. 2). Each auditor assessed four corporate sustainability reports and ranked the alternatives—Platinum, Gold, Silver, and Bronze—using the SmartGRI system. The system outputs were then compared with the official rankings issued by accredited audit institutions.
The findings show that SmartGRI demonstrates strong predictive validity, with a Spearman correlation coefficient of 0.92 between system-generated rankings and manual audit results. This high correlation confirms that the model produces decisions consistent with established professional standards. In addition, SmartGRI significantly improves audit efficiency: the average completion time decreased by 35% compared to conventional manual audits.
Inter-rater reliability testing yielded a Cohen’s Kappa value of 0.84, indicating a high level of agreement among auditors in interpreting and applying the system. This reinforces SmartGRI’s capability to support coherent and collective decision-making across different evaluators.
Figure 3 presents the comparative audit durations, showing a consistent reduction in time when using SmartGRI. Overall, these results confirm that SmartGRI is both technically robust and practically advantageous, offering enhanced transparency, reliability, and operational efficiency in GRI-based sustainability assessment.
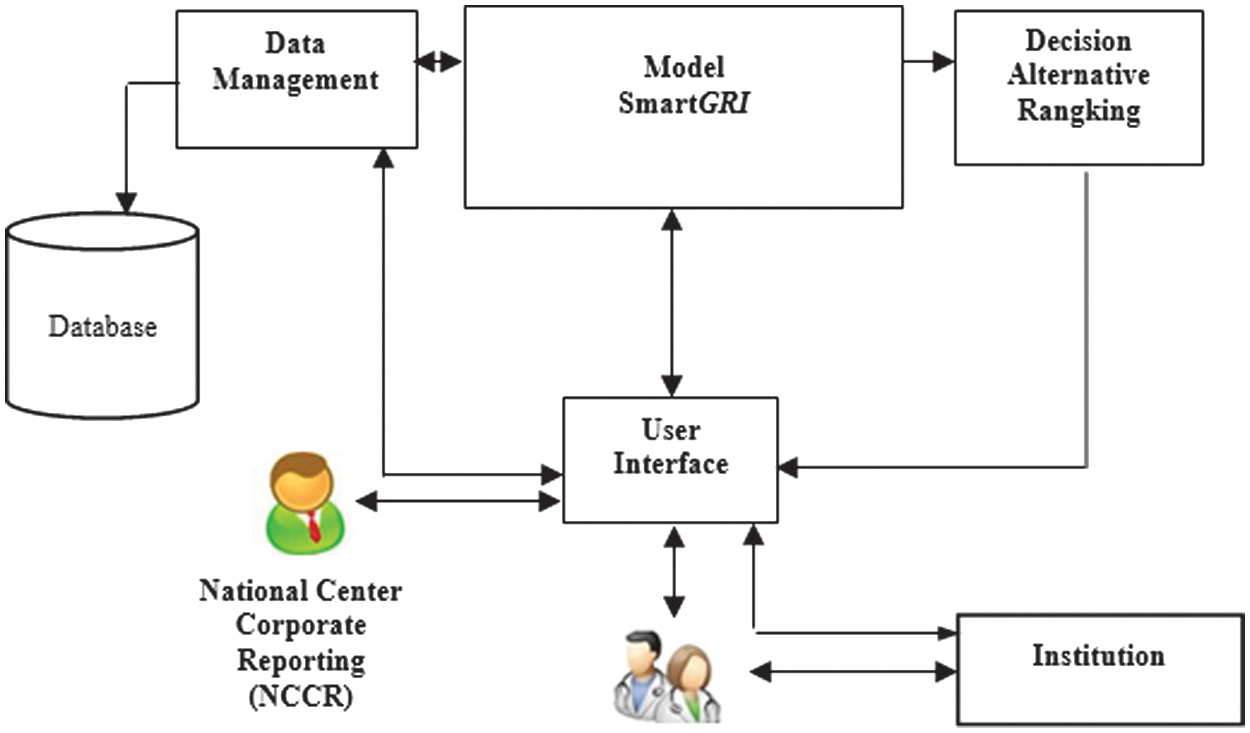 Fig. 2. SmartGRI system architecture diagram.
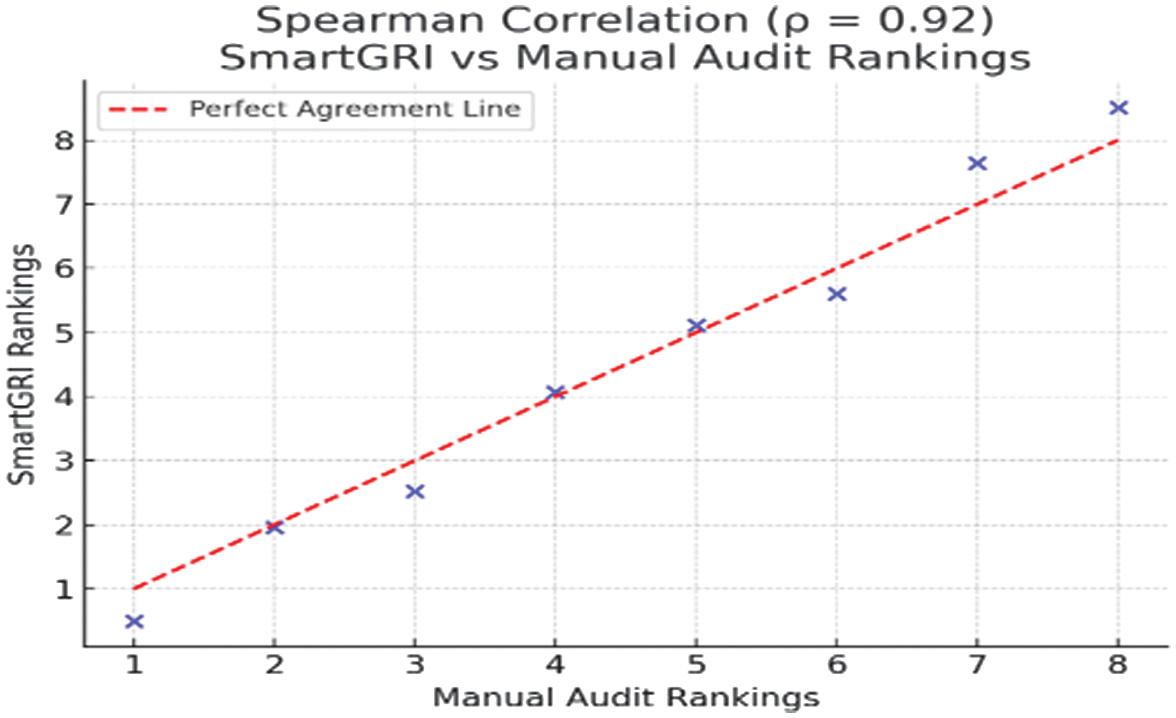 Fig. 3. Spearman’s rank correlation between manual audit and SmartGRI assessments (ρ = 0.92).
E.MODEL VALIDATION
The SmartGRI model advances sustainability decision-making theory by integrating three MADM techniques—Eckenrode for weighting, TOPSIS for ranking, and Borda for group aggregation—into a unified GDSS framework, offering a methodological improvement over their traditional separate use. By operationalizing these techniques in a collaborative audit environment, SmartGRI enables structured, evidence-based, and adaptive Environmental, Social, and Governance (ESG) evaluation, addressing the literature’s call for systematic and participatory assessment approaches [36,37]. Empirical validation further supports its robustness, with a Spearman correlation of 0.92 between SmartGRI outputs and manual auditor rankings (Fig. 3), demonstrating that the system can automate complex evaluations while accurately reflecting human judgment—an essential capability in the multidimensional sustainability domain [38]. Practically, SmartGRI improves audit efficiency by reducing evaluation time by 35% (Fig. 4), a significant advantage amid growing reporting complexity and limited assurance resources. These gains strengthen auditor productivity, support more frequent assessments, and enhance governance processes, positioning SmartGRI as a scalable solution aligned with GRI reporting requirements [39].
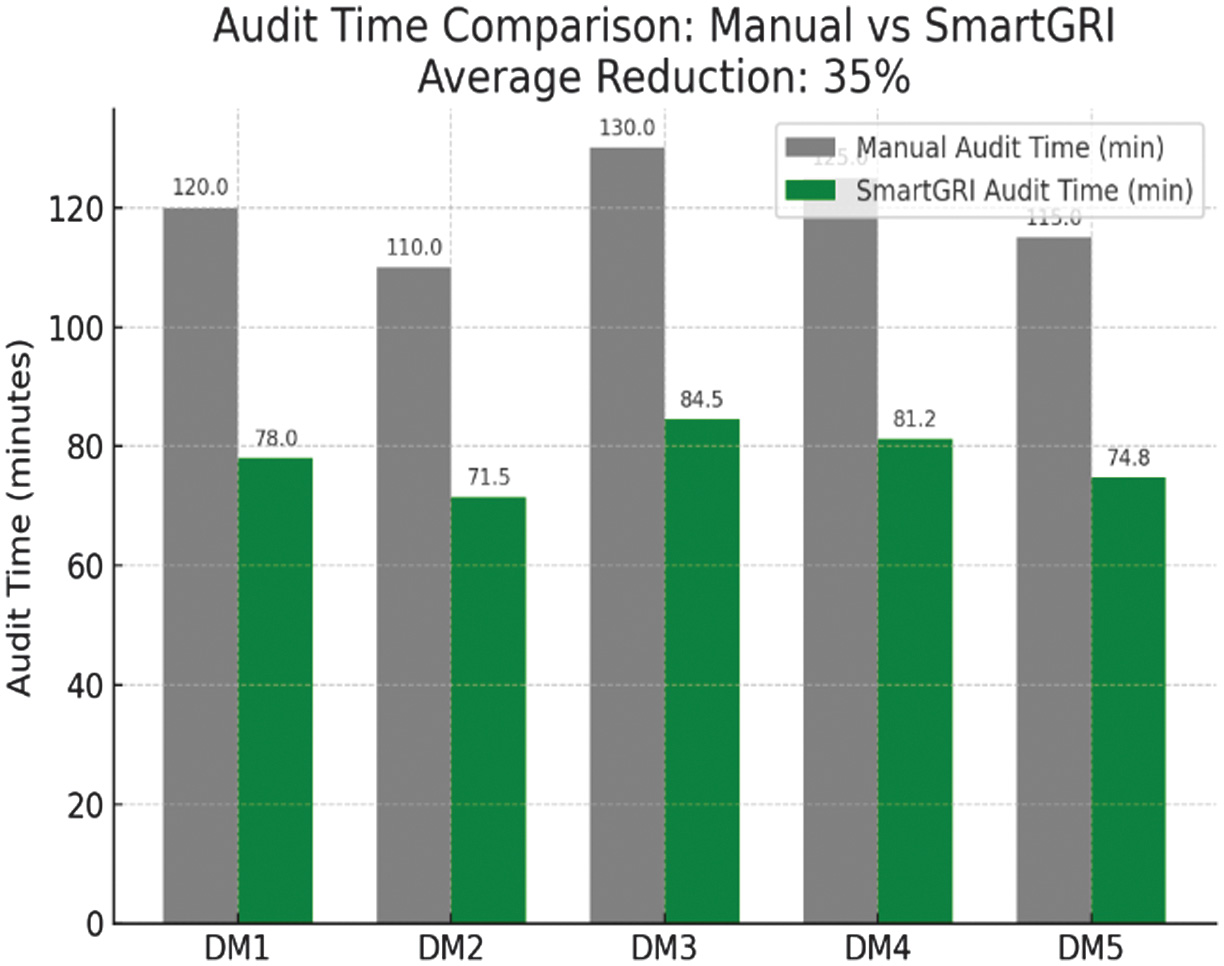 Fig. 4. Comparison of audit duration: manual method vs. SmartGRI (average reduction: 35%).
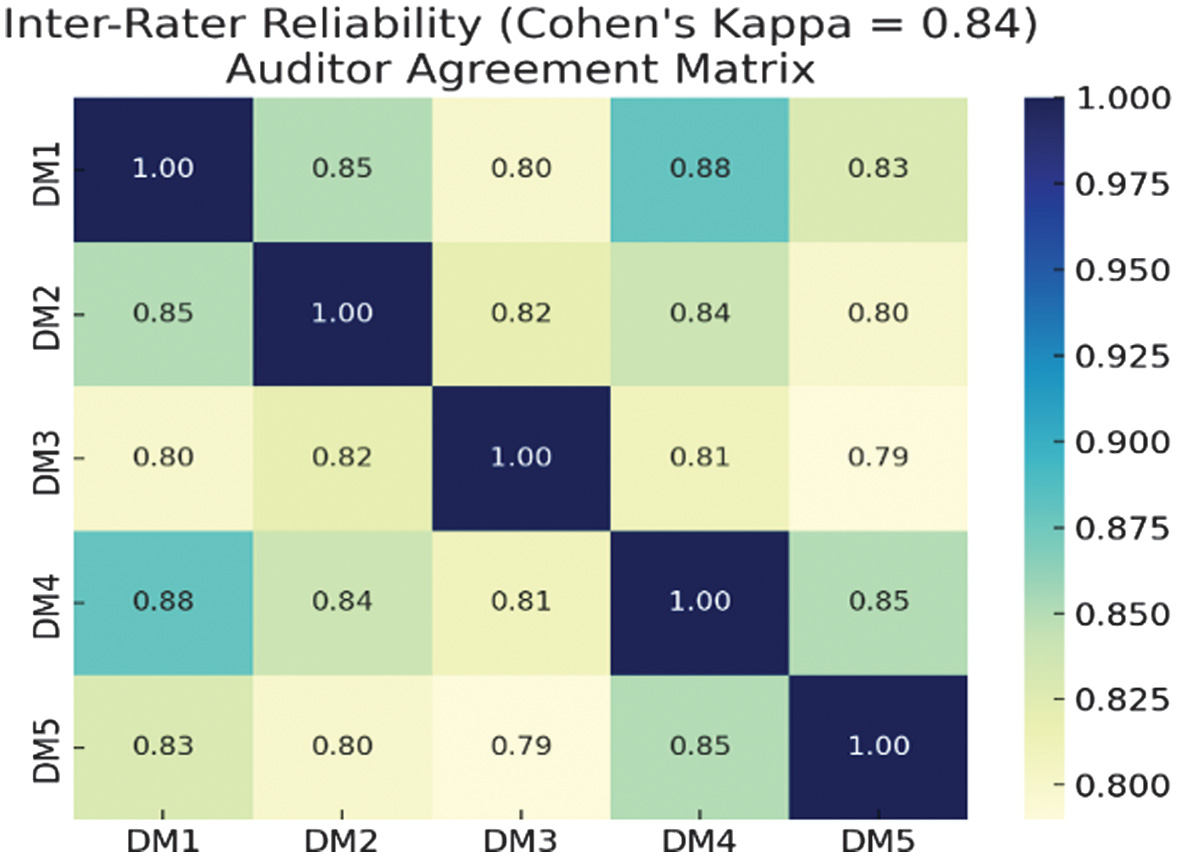 Fig. 5. Inter-rater reliability heatmap showing auditor agreement (Cohen’s Kappa = 0.84).
SmartGRI effectively reduces subjective bias in sustainability assessments, as evidenced by its high inter-rater reliability (Cohen’s Kappa = 0.84), achieved through transparent decision logic, standardized scoring, and a fair Borda-based aggregation mechanism, enabling more consistent multi-stakeholder deliberation [7]. Aligned with the GRI framework, the system enhances assessment quality, transparency, and accountability by providing traceable decision pathways and intuitive visual outputs. Its adaptability across diverse sustainability indicators and industry contexts—including regions with limited audit capacity—demonstrates that SmartGRI is not only a methodological innovation but also a practical tool that supports organizational alignment with global sustainability goals (Fig. 5).
F.STUDY LIMITATIONS
Despite its promising results, this study has several limitations. The validation involved only five auditors and four report cases, which, although yielding significant inter-rater correlations, limits the generalizability of findings across diverse audit practices and industries. SmartGRI was tested solely using GRI indicators, which may restrict its applicability in contexts where other frameworks such as Sustainability Accounting Standards Board (SASB), Task Force on Climate-related Financial Disclosures (TCFD), or Integrated Reporting (<IR>) are more prevalent, raising interoperability concerns [40]. The system also depends heavily on complete and high-quality sustainability data, yet many organizations—particularly Small and Medium-sized Enterprises—provide inconsistent disclosures, and SmartGRI’s performance under such uncertainty remains untested. In addition, the model assumes rational, consensus-driven decision-making, whereas real audit environments may involve organizational politics and cognitive biases that the Borda method cannot fully capture. Finally, this study focused on internal validation without addressing practical implementation issues such as integration, training, data security, and regulatory acceptance, indicating the need for future cross-sector pilot testing to assess SmartGRI’s scalability and real-world usability.
G.IMPLICATIONS
The SmartGRI model offers strong theoretical and practical implications by integrating three MADM techniques—Eckenrode, TOPSIS, and Borda—into a unified GDSS platform, addressing the need for systematic, participatory, and adaptive ESG assessment approaches [36,41]. Empirical validation showing a Spearman correlation of 0.92 demonstrates the system’s ability to replicate expert judgment reliably, reinforcing the theoretical soundness of the integrated MADM approach and positioning SmartGRI as an objective representation of professional evaluation [38,42]. Practically, SmartGRI enhances audit efficiency by reducing assessment time by about 35%, an important advantage amid increasing reporting demands and limited audit capacity, while supporting stronger governance and alignment with global sustainability standards such as the GRI [19,20]. The system also minimizes subjective bias, as evidenced by high inter-rater reliability (Cohen’s Kappa = 0.84), achieved through transparent scoring logic and Borda-based aggregation—an essential feature for multi-stakeholder sustainability audits [15,43]. Furthermore, SmartGRI’s compatibility with the GRI framework and its adaptability across sectors enhance its relevance as a scalable tool that strengthens transparency, accountability, and organizational alignment with global sustainability objectives [44,45].
V.CONCLUSION AND FUTURE WORK
This study developed and validated SmartGRI, an integrated GDSS that enhances sustainability report assessment using GRI standards. By combining Eckenrode, TOPSIS, and Borda methods, the system improves transparency, audit efficiency, and alignment with expert judgment while reducing subjective bias. SmartGRI demonstrates both methodological and practical value by providing a replicable, data-driven tool for sustainability assurance.
Despite its strengths, the system remains limited by sample size, GRI-focused indicators, and consensus-based assumptions, which may constrain broader applicability. Future research should include wider validation across diverse audit contexts and real-time reporting environments and extend SmartGRI to incorporate other global sustainability frameworks such as SASB, TCFD, and Integrated Reporting to improve interoperability and cross-sector relevance.