I.INTRODUCTION
Fintech is the best example of how different kinds of shocks can influence technology adoption in unexpected ways in the post-COVID world [1,2]. It is defined as financial services innovation that is made possible and that results in new business models, applications, procedures, or goods that have a significant effect on financial markets, financial institutions, and financial services. In addition, these structural shocks can potentially alter communities and economies in the long run, as proven by numerous authors [3,4]. Recently, the devastating impact of COVID and its rapid transmission rate have forced communities to enact lockdown procedures and/or self-imposed behavioral adjustments [5–14]. Despite the high monetary and human costs, there have been some winners and potential benefits of these measures. There is a growing anecdotal evidence that the adoption and utilization of technology, particularly that enables businesses to communicate and exchange goods and services over distance, have significantly increased due to COVID [15–20]. In fact, it is suggested that the use of digital banking has assisted many people and businesses in reducing some of the health risks and unfavorable socioeconomic repercussions of the epidemic. This rapid adoption will probably have a significant impact on the market equilibrium between established incumbents and emerging tech-based firms in financial intermediation risk, which can be calculated by the Chicago Board Options Exchange’s CBOE Volatility Index, or the VIX.
This study’s main aim is to determine whether either the VIX in COVID-19 or the WAR (a reference to the Russian Invasion) had a more significant (negative) impact on Fintech firms’ returns. To answer this question, this research paper uses two different research methods. The primary research method is the DCC-GARCH model, which is used to determine the conditional correlation between Fintech firms’ returns and the VIX/OVX (the daily log-returns) to determine whether the VIX/OVX returns Granger-Causes firms’ stock returns. We also use positive and negative changes in these volatility indices, where a positive difference in the VIX/OVX index is VIX/OVX_U, and an adverse change in the VIX/OVX index is VIX/OVX_D. We used nine Fintech firms from four different countries (one from Australia, one from Hong Kong, one from the Netherlands, and six from the US) from December 13, 2019, to October 06, 2022. The nine Fintech firms are: (1) Visa Inc., (2) Tencent Holdings Ltd., (3) Mastercard Inc., (4) Intuit Inc., (5) PayPal Holdings Inc., (6) Fiserv Inc., (7) Adyen NV, (8) Bill.com Holdings Inc., and (9) Xero Ltd.
This work makes several contributions to the literature. First, this is the first time anyone has answered the question of whether the VIX in COVID-19 and WAR had any impact on Fintech firms’ returns. Second, this is the first time anyone has used the DCC-GARCH model. Third, we use a more extensive data set than studies in this area.
Our findings show that the VIX had an inverse impact on the returns of the Fintech sample in our study. For COVID, the war correlation remains above throughout the first half, while the situation changes during the second. We can also observe a drop in the correlation for COVID around day 30. We can conclude that the impact pattern is unchanged during the crisis for the Fintech firms from VIX. The stock market and other markets crashed due to COVID-19 and the WAR in a short amount of time. As a result, the level of panic during COVID-19 and the WAR was significantly higher both in the real world and in the capital markets, which could account for the stronger correlation between increases in the VIX and Fintech firms.
The remainder of the paper is structured as follows. Section II discusses methodology. Our sample details and preliminary analysis are discussed in Section III. We report our results in Section IV, and in Section V, we conclude our paper.
II.LITERATURE REVIEW
The convergence of war and a global pandemic, such as the COVID-19 crisis, has presented an unprecedented challenge for various industries worldwide. Among these industries, financial technology (Fintech) firms, which have been rapidly evolving in recent years, are particularly sensitive to the disruptions caused by geopolitical conflicts and health crises. Ling and Pei [21] studied the impact of COVID-19 and its association with Fintech. The study adopted the quarterly data from Chinese publicly listed companies spanning from 2011 to 2020. Our findings indicate that the pandemic has amplified financial constraints for enterprises; however, the advancement of Fintech can alleviate its adverse impact. Moreover, Tripalupi and Anggahegari [22] studied the challenges and prospects of Shariah-based Fintech in Indonesia in light of the COVID-19 pandemic. Tripalupi and Anggahegari [22] studied primary focus on Shariah Fintech, the pandemic’s influence on Fintech, and the opportunities and obstacles for Shariah Fintech. The study adopted a qualitative and descriptive approach for analysis. The findings highlight that by the close of 2019, Syariah Fintech assets had surged by 2074.81% compared to the preceding year. Despite pandemic repercussions, Fintech growth demonstrated relative stability during the COVID-19 crisis.
In the face of unparalleled challenges prompted by the advent of the COVID-19 pandemic, the embrace of Fintech solutions emerged as a pivotal strategy in addressing the evolving needs of individuals, businesses, and institutions [23–26]. The global lockdown due to the COVID-19 outbreak, plays a significant role in the adoption of Fintech due to its potential such as digital payments, remote account management, and contactless transactions. Fu and Mishra [27] examined the adoption of Fintech and digital finance by businesses due to the COVID-19 pandemic. The results revealed a significant increase in the rate of finance app downloads due to the spread of COVID-19 and government-imposed lockdowns. Moreover, the landscape of financial transactions has undergone a significant transformation in the wake of the COVID-19 pandemic. This global crisis has propelled a notable shift in behavior, with individuals and businesses alike increasingly embracing Fintech solutions as a preferred avenue for their financial needs and services. The inherent advantages of Fintech, such as contactless transactions, remote account management, and digital payment options, have not only provided convenience but also aligned well with the health and safety concerns posed by the pandemic.
As another example of a shock, most financial market participants and Ukrainian citizens were caught off guard by Russia’s invasion of their country, which was an exogenous shock for foreign companies with Russian operations in the financial market [28]. After military bases were built close to the border, Russia officially attacked Ukraine on February 24, 2022, converting the world’s financial markets into a risk magnet. The ongoing Russia-Ukraine conflict has been shown to exert notable influences on various industries, and the Fintech sector is no exception. The evidence shows that the impacts of conflicts on Fintech firms shed light on the intricate interplay between global geopolitical dynamics and the rapidly evolving Fintech landscape. Allinger and Barisitz [29] studied the Russian Fintech system in terms of sanctions and war. The study revealed that the landscape is shaped by international sanctions. The challenges posed by sanctions affect major Fintech entities, influencing their advancement in the realm of digital ecosystems.
Various studies have adopted machine learning methods to study volatility behavior [30–35]. Furthermore, Michańków, Kwiatkowski [36] develops a hybrid approach to forecasting the volatility and risk of financial instruments by combining GARCH and neural network models. Four GARCH specifications are used: standard GARCH, EGARCH, GJR-GARCH, and APARCH in the research study. The models are tested using daily logarithmic returns on the S&P 500 index, gold prices, and Bitcoin prices, which represent distinct volatility dynamics. The results show that hybrid solutions give more accurate point volatility forecasts, but not necessarily better VaR and ES forecasts.
Wang and Liu [37] presents a multivariate volatility modeling framework called long short-term memory-enhanced BEKK (LSTM-BEKK), which addresses the limits of traditional multivariate GARCH models in dealing with persistent volatility clustering and asymmetric co-movements across assets. The empirical results from equity markets show that LSTM-BEKK provides better out-of-sample portfolio risk forecasts while keeping the interpretability of BEKK models.
Manogna and Dharmaji [38] examined the agricultural price volatility forecasting using a hybrid long short-term memory (LSTM)–GARCH model by adopting the historical data for 23 commodities across 165 markets in India from February 2010 to June 2024. The results indicate that the hybrid approach effectively addresses price instability and improves predictive performance.
Abakah and Adeabah [39] adopted an innovative methodology to study the public sentiments in time of the Russia-Ukraine conflict outbreak, investigating their implications for the global Fintech sector and blockchain markets. Abakah and Adeabah [39] constructed an index for analysis known as the Russia-Ukraine War Economic Sanctions News Sentiment Index (RUWESsent), incorporating media coverage, panic, sentiment, and media hype from sources such as Twitter sentiments, Google Trend, Wikipedia Trend, and News Sentiments. The finding of the study shows that the positive RUWESsent values have positively influenced the returns of Fintech and blockchain market stocks in bullish market conditions, while exerting a negative influence during bearish market periods. Notably, a heightened negative correlation is observed immediately following the invasion, revealing that adverse sentiments adversely impact Fintech and blockchain market stocks.
III.METHODOLOGY
In this research paper, we use the DCC-GARCH model to determine the conditional correlation between the firm’s returns and the VIX/OVX (the daily log-returns) and to determine whether VIX/OVX returns Granger-Causes firms’ stock returns. To conduct this research, we developed a bivariate (2 × 1) vector of conditional stock returns of Fintech firm s, , and VIX/OVX returns, , using a DCC-AR(n)-GARCH (p,q) model following Engle [40]:
where is a two-by-one vector of independent and identically distributed innovations, and it is assumed that it has a bivariate normal distribution (that is, has the form . The conditional covariance matrix, denoted by “,” is capable of being decomposed into the diagonal matrix , which has dimensions of two by two and is made of conditional standard deviations with , and a conditional correlation matrix :Based on our assumption, we determine our conditional mean – – is stated as a four-order autoregressive process, and the equation for our univariate conditional mean is as follows:
where shows the innovations that were not standardized and had a mean of zero and a conditional variance of . We used an AR term up to the order of n to consider the possibility of serial correlation in the returns of Fintech firms. Using the coefficient, we examine the Granger causation between the t-1lag in VIX/OVX returns and the t-1lag in the stock returns of Fintech businesses.We followed Bollerslev [41] and measured the univariate conditional variances of stocks and VIX/OVX returns using the GARCH approach using :
It is expected that every value of will be greater than zero. Our conditional correlation matrix can be represented by equation (5), using (2 × 2) covariance matrix:
According to Batten and Kinateder [42], if we specify as (2 × 1) vector of standardized innovations with unconditional correlation matrix , and , we can derive the matrix as
Positive scalers a and b’s values are limited to . We can achieve conditional correlations from the components of the matrix using Eq. (7), where is the conditional covariance between Fintech firm s and the VIX/OVX and and represent the conditional variances of Fintech firm s, and VIX/OVX returns, respectively.
We may use these estimates to compute the DCC-AR (n)-GARCH (p,q) model for our baseline result.
A.DATA AND PRELIMINARY ANALYSIS
Daily closing price date, , were collected from DataStream, consisting of nine Fintech firms from four different countries (one from Australia, one from Hong Kong, one from the Netherlands, and six from the US) for the period from December 13, 2019, to October 06, 2022. We chose this data frequency because it enabled us to simulate conditional correlations during a crisis. The nine Fintech firms are: (1) Visa Inc., (2) Tencent Holdings Ltd., (3) Mastercard Inc., (4) Intuit Inc., (5) PayPal Holdings Inc., (6) Fiserv Inc., (7) Adyen NV, (8) Bill.com Holdings Inc., and (9) Xero Ltd. Table I reports on the sample information.
| Identifier (RIC) | Name | Market Cap (USD) | Return on equity (%) | Total Debt to Total Equity | Price To Book Value Per Share | Income Aft Tax Margin | ISIN | Country of Exchange | GICS Sector Name | WACC Equity Risk Premium (%) |
|---|---|---|---|---|---|---|---|---|---|---|
| V | Visa Inc | 377,809,871,017 | 42.4% | 55.8% | 10.7 | 51.1% | US92826C8394 | United States of America | Information Technology | 4.9% |
| 0700.HK | Tencent Holdings Ltd | 302,596,822,743 | 22.3% | 40.1% | 2.9 | 40.7% | KYG875721634 | Hong Kong | Communication Services | 6.1% |
| MA.N | Mastercard Inc | 278,983,108,803 | 153.8% | 190.1% | 45.3 | 46.0% | US57636Q1040 | United States of America | Information Technology | 4.9% |
| INTU.O | Intuit Inc | 107,141,559,707 | 15.7% | 42.1% | 6.5 | 16.2% | US4612021034 | United States of America | Information Technology | 4.9% |
| PYPL.OQ | PayPal Holdings Inc | 93,061,613,581 | 10.1% | 41.6% | 4.7 | 16.4% | US70450Y1038 | United States of America | Information Technology | 4.9% |
| FISV.OQ | Fiserv Inc | 60,210,470,521 | 6.4% | 68.6% | 1.9 | 8.0% | US3377381088 | United States of America | Information Technology | 4.9% |
| ADYEN.AS | Adyen NV | 38,871,586,535 | 30.9% | 7.9% | 18.9 | 7.8% | NL0012969182 | Netherlands | Information Technology | 7.3% |
| BILL.K | Bill.com Holdings Inc | 12,409,951,993 | –9.9% | 43.8% | 3.1 | –50.8% | US0900431000 | United States of America | Information Technology | 4.9% |
| XRO.AX | Xero Ltd | 6,742,568,639 | −1.0% | 98.8% | 11.7 | −0.8% | NZXROE0001S2 | Australia | Information Technology | 2.5% |
The descriptive statistics are shown in Table II. From there, we can see that the mean value for both VIX and OVX is 0.001, and for both VIX and OVX, the skewness and kurtosis values are positive.
Table II. Descriptive statistics
| VIX | OVX | XERO | ||
|---|---|---|---|---|
| Mean | 0.001 | 0.001 | 0.000 | |
| Variance | 0.007 | 0.007 | 0.001 | |
| Kurtosis | 7.803 | 28.040 | 6.550 | |
| Skewness | 1.283 | 1.943 | −0.799 | |
| Jarque-Bera | 908.157 | 19664.686 | 464.279 | |
| p-value | 0.000 | 0.000 | 0.000 | |
| Augmented Dickey-Fuller (ADF) | −30.199 | −27.844 | −29.830 | |
| p-value | 0.000 | 0.000 | 0.000 | |
| Count | 735.000 | 735.000 | 735.000 | |
| INTUIT | VISA | MASTERCARD | TENCENT | |
| Mean | 0.001 | 0.000 | 0.000 | 0.000 |
| Variance | 0.001 | 0.000 | 0.001 | 0.001 |
| Kurtosis | 9.019 | 11.164 | 9.927 | 10.138 |
| Skewness | 0.047 | −0.014 | 0.131 | 0.644 |
| Jarque-Bera | 1109.666 | 2041.196 | 1471.668 | 1611.183 |
| p-value | 0.000 | 0.000 | 0.000 | 0.000 |
| Augmented Dickey-Fuller (ADF) | −31.585 | −31.873 | −29.647 | −26.910 |
| p-value | 0.000 | 0.000 | 0.000 | 0.000 |
| Count | 735.000 | 735.000 | 735.000 | 735.000 |
| PAYPAL | FISERV | ADYEN | BILL | |
| Mean | 0.000 | 0.000 | 0.001 | 0.002 |
| Variance | 0.001 | 0.000 | 0.001 | 0.003 |
| Kurtosis | 14.276 | 12.894 | 4.640 | 8.069 |
| Skewness | −0.922 | −0.769 | −0.067 | 0.780 |
| Jarque-Bera | 3998.250 | 3070.374 | 82.871 | 861.562 |
| p-value | 0.000 | 0.000 | 0.000 | 0.000 |
| Augmented Dickey-Fuller (ADF) | −29.559 | −32.264 | −26.289 | −26.035 |
| p-value | 0.000 | 0.000 | 0.000 | 0.000 |
| Count | 735.000 | 735.000 | 735.000 | 735.000 |
The descriptive statistics for the study’s whole sample are shown in this table, encompassing both COVID-19 and WAR. The variables are (with RIC code in parentheses) the daily log-returns of CBOE Volatility Index-VIX, CBOE Crude Oil Volatility Index-OVX, VISA (V), MASTERCARD (MA.N), TENCENT (0700.HK), INTUIT (INTU.O), PAYPAL (PYPL.OQ), FISERV (FISV.OQ), ADYEN (ADYEN.AS), BILL (BILL.K), and XERO (XRO.AX). The sample period for all the variables is from December 13, 2019, to October 06, 2022.
For each pair of variables utilized in the study, the pairwise correlation and corresponding p-values are shown in Table III. Table III shows that VIX and the OVX are negatively correlated with all Fintech firms. On the other hand, we can see that all Fintech firms are positively correlated with each other.
Table III. Pearson correlation
| VIX | OVX | VISA | MASTERCARD | TENCENT | INTUIT | PAYPAL | FISERV | ADYEN | BILL | XERO | |
|---|---|---|---|---|---|---|---|---|---|---|---|
| 1.000 | |||||||||||
| 0.381 | 1.000 | ||||||||||
| −0.586 | −0.305 | 1.000 | |||||||||
| −0.600 | −0.339 | 0.923 | 1.000 | ||||||||
| −0.106 | −0.130 | 0.154 | 0.165 | 1.000 | |||||||
| −0.577 | −0.258 | 0.673 | 0.684 | 0.189 | 1.000 | ||||||
| −0.504 | −0.224 | 0.565 | 0.566 | 0.119 | 0.680 | 1.000 | |||||
| −0.513 | −0.297 | 0.794 | 0.779 | 0.161 | 0.625 | 0.539 | 1.000 | ||||
| −0.335 | −0.123 | 0.346 | 0.327 | 0.171 | 0.422 | 0.420 | 0.281 | 1.000 | |||
| −0.401 | −0.146 | 0.394 | 0.402 | 0.173 | 0.537 | 0.537 | 0.347 | 0.383 | 1.000 | ||
| –0.128 | –0.139 | 0.249 | 0.231 | 0.311 | 0.260 | 0.201 | 0.275 | 0.306 | 0.169 | 1.000 |
The sample period for all the variables is from December 13, 2019, to October 06, 2022. All the correlations are significant at a 5% significance level, but we are not reporting the significance level for brevity.
IV.RESULTS
A.DCC-AR(n)-GARCH (p,q) RESULTS – VIX
The results from the base DCC model are shown in Table IV. Based on the DCC-AR (n)-GARCH (p,q) model, Table IV shows the bivariate association between the variables in our sample. The estimated coefficients are reproduced in four (4) different panels. The results of the mean equation are shown in Panel A, along with the corresponding p-values. The outcomes according to the variance equation are shown in Panel B. The DCC equation is the base for Panel C’s results. Finally, the results in Panel D are based on different diagnostics tests. In addition, Table IV reports highly significant results in parameters a and b in the DCC equation. The significance level is mostly 1% and 5%. The results reinforce the fact that the association between the VIX and the Fintech firms of our sample is highly time-varying, as proven by a and b coefficients of the DCC equation of panel c. Similarly, the w1 and w2 parameters are also highly significant at a 1% significance level. This overall significance confirms that the Granger causality exists. This guarantees that the jump in the CBOE Volatility Index-VIX has an inverse impact on the returns of the Fintech sample in our study. Finally, Panel D reports the results of the diagnostic tests. The results based on the (AIC), (BIC), (d-statistic), and Log-likelihood confirm the model fitness.
Table IV. Baseline DCC-AR (n)-GARCH (p,q) Model Results between VIX and Fintech firms
| VISA | MASTERCARD | TENCENT | INTUIT | PAYPAL | FISERV | ADYEN | BILL | XERO | |
|---|---|---|---|---|---|---|---|---|---|
| Panel A: Mean Equation | |||||||||
| μ | 0.001 | 0.001 | 0.000 | 0.002*** | 0.001 | 0.000 | 0.002* | 0.003** | 0.001* |
| p-value | 0.316 | 0.140 | 0.840 | 0.000 | 0.166 | 0.951 | 0.056 | 0.048 | 0.083 |
| −0.108** | −0.063 | −0.040 | −0.050 | −0.111** | −0.095** | −0.017 | 0.073** | −0.107*** | |
| p-value | 0.026** | 0.189** | 0.285** | 0.228*** | 0.012*** | 0.033*** | 0.683** | 0.050 | 0.003 |
| −0.022 | −0.018 | −0.046 | 0.001 | 0.002 | −0.007 | −0.042 | 0.055*** | −0.096*** | |
| p-value | 0.025 | 0.103 | 0.000 | 0.936 | 0.902 | 0.448 | 0.001 | 0.006 | 0.000 |
| Panel B: Variance Equation | |||||||||
| 0.000*** | 0.000*** | 0.000** | 0.000** | 0.000*** | 0.000*** | 0.000** | 0.000 | 0.000** | |
| p-value | 0.000 | 0.000 | 0.030 | 0.039 | 0.009 | 0.001 | 0.036 | 0.126 | 0.044 |
| 0.119*** | 0.149*** | 0.124*** | 0.100** | 0.204*** | 0.099*** | 0.068*** | 0.055*** | 0.114*** | |
| p-value | 0.000 | 0.000 | 0.003 | 0.018 | 0.000 | 0.000 | 0.000 | 0.002 | 0.001 |
| 0.829*** | 0.797*** | 0.754*** | 0.833*** | 0.795*** | 0.840*** | 0.917*** | 0.938*** | 0.836*** | |
| p-value | 0.000 | 0.000 | 0.000 | 0.000 | 0.000 | 0.000 | 0.000 | 0.000 | 0.000 |
| Panel C: DCC Equation | |||||||||
| a | 0.031*** | 0.035*** | 0.014 | 0.039 | 0.001 | 0.080* | 0.100** | 0.003 | 0.022 |
| p-value | 0.004 | 0.003 | 0.272 | 0.121 | 0.782 | 0.056 | 0.038 | 0.525 | 0.584 |
| b | 0.941*** | 0.945*** | 0.961*** | 0.809*** | 0.987*** | 0.396 | 0.137 | 0.991*** | 0.000 |
| p-value | 0.000 | 0.000 | 0.000 | 0.000 | 0.000 | 0.107 | 0.557 | 0.000 | 1.000 |
| Panel D: Diagnostics Tests | |||||||||
| Log-likelihood | 2912.862 | 2827.951 | 2610.078 | 2767.187 | 2488.749 | 2802.968 | 2476.529 | 2206.035 | 2546.63 |
| AIC | −5771.723 | −5601.902 | −5164.156 | −5472.375 | −4923.498 | −5551.936 | −4899.058 | −4356.07 | −5061.26 |
| BIC | −5647.674 | −5477.853 | −5035.512 | −5329.948 | −4799.449 | −5427.886 | −4775.009 | −4227.427 | −4987.684 |
| d-Stat | 1.99493 | 1.987158 | 1.942384 | 1.991951 | 1.983993 | 2.006851 | 1.967216 | 1.960112 | 2.001641 |
Figure 1 plots the time-varying pairwise conditional correlations between the next-trading-day log returns of the CBOE Volatility Index-VIX and the Fintech firms in our sample, that is, VISA (V), MASTERCARD (MA.N), TENCENT (0700. HK), INTUIT (INTU.O), PAYPAL (PYPL.OQ), FISERV (FISV.OQ), ADYEN (ADYEN.AS), BILL (BILL.K), and XERO (XRO.AX). The green line in all the plots represents the DCC-GARCH correlations during COVID-19, whereas the correlations during the WAR are illustrated with green lines. Altogether, we can observe a similar picture across the firms for both crises. This affirms a strong similarity in the impact of the risk for the sector. For COVID, the war correlation remains above throughout the first half, and the situation changes during the second. We can also observe a drop in the correlation for COVID at around day 30. We can conclude that the impact pattern is unchanged during the crisis for Fintech firms from the VIX.
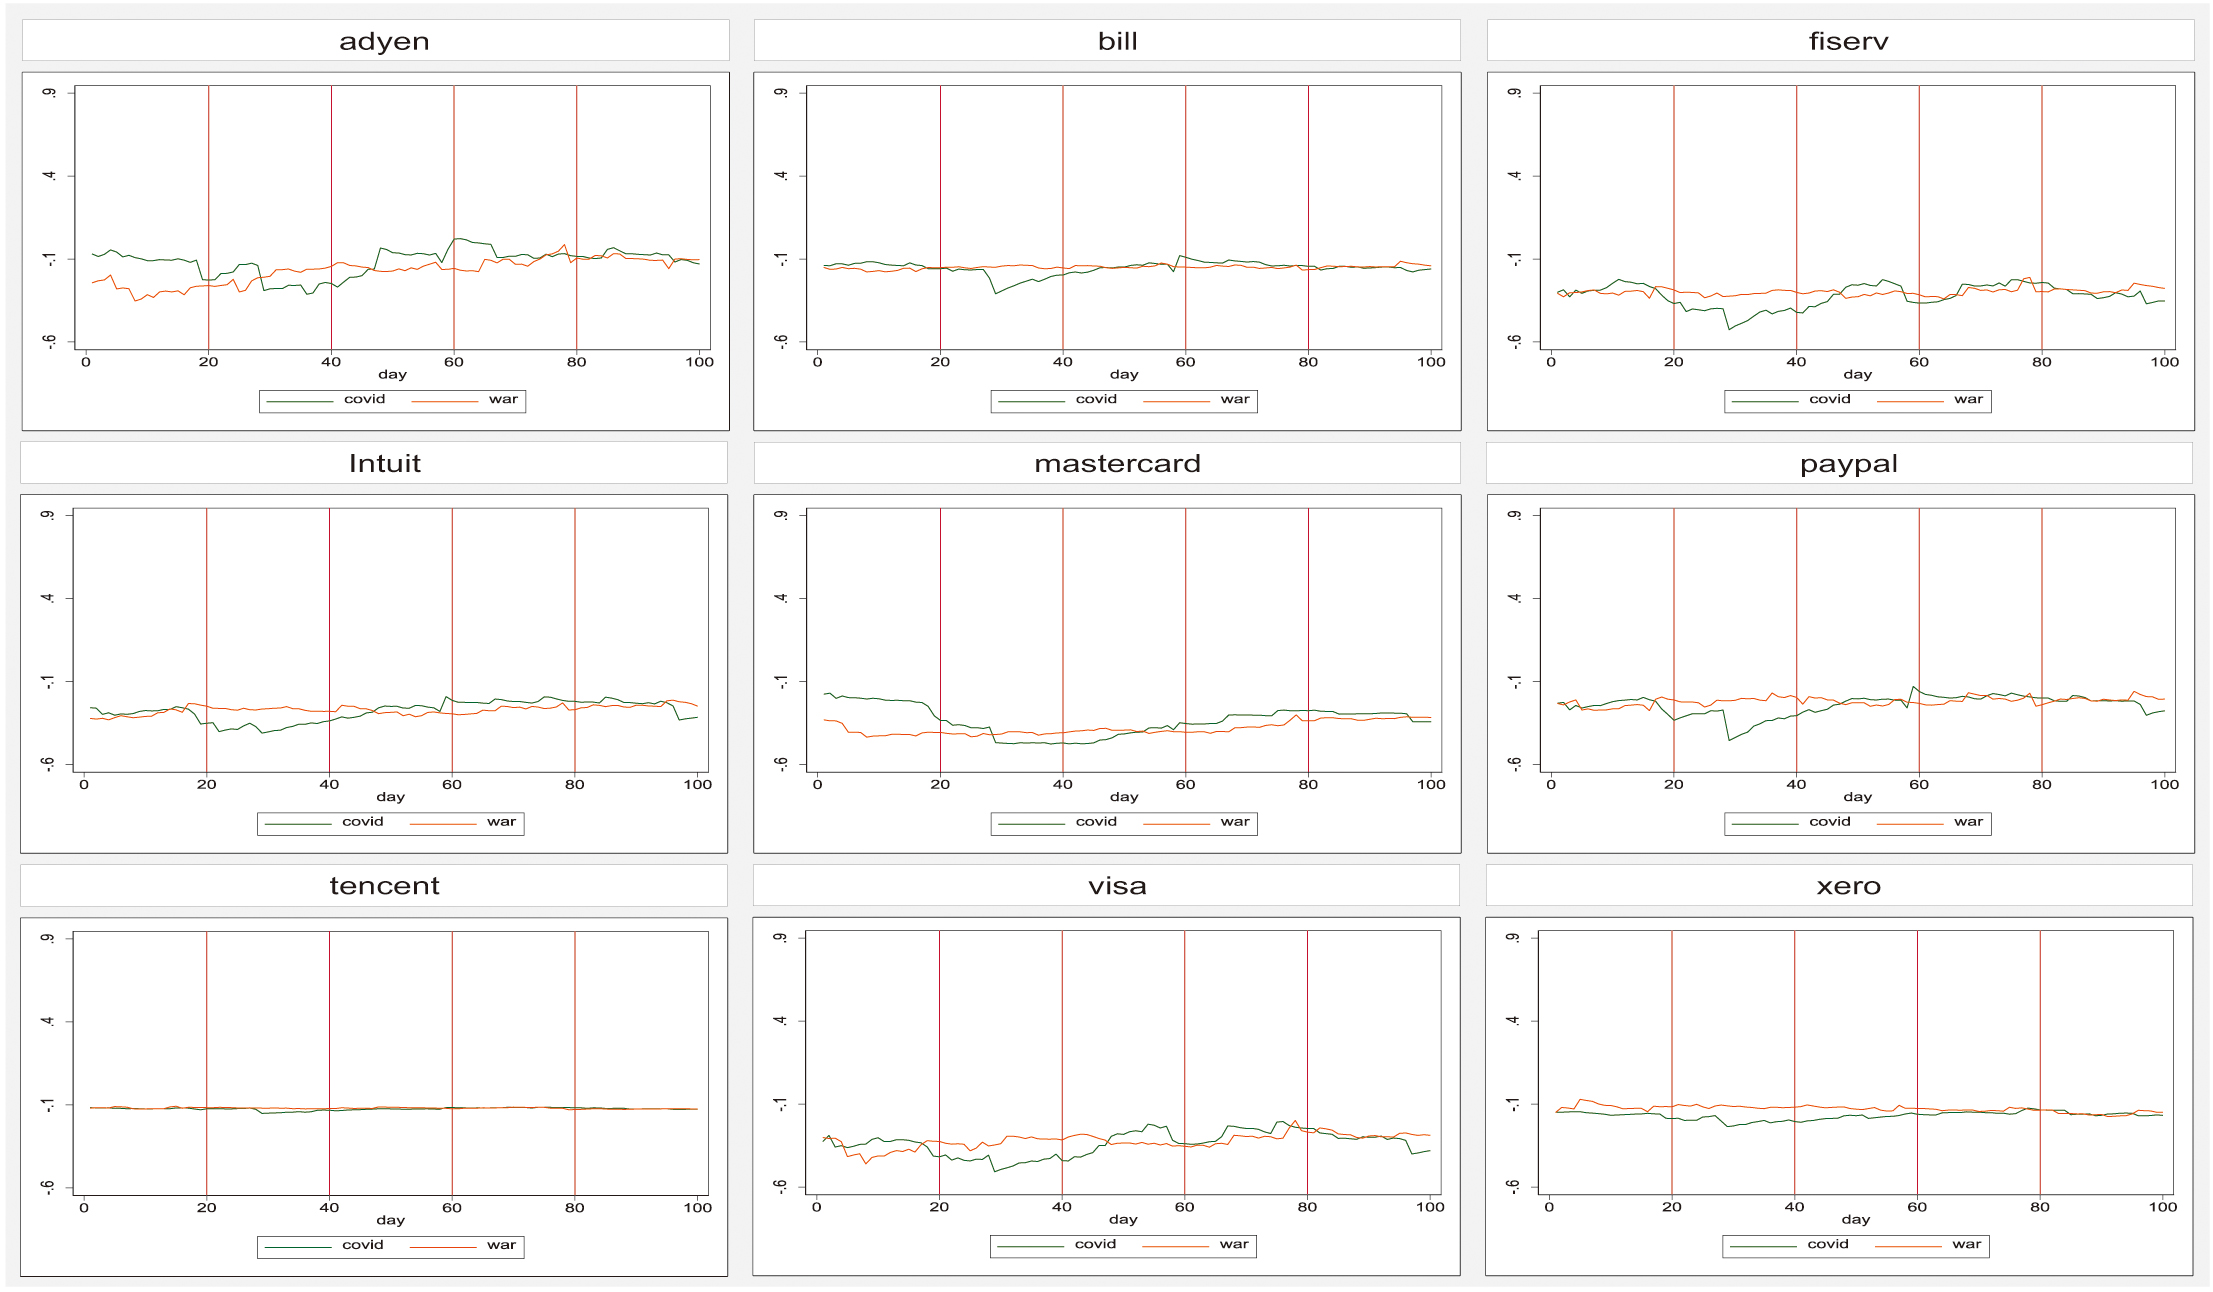 Fig. 1. COVID-19 vs. WAR Sample Correlation between VIX and Fintech firms during 100 significant days.
B.DCC-AR(n)-GARCH (p,q) RESULTS – OVX
The daily log-returns of the OVX and the Fintech firms in our sample are reported in Table V. The results in Table V confirm the time-varying correlations in our study following the previous sections. Similarly, the Granger Casualty is also established in our relationship based on the results of of the mean equation in panel a of Table V. Furthermore, the results of the variance equation based on w1 and w2 are also highly significant. The results in Table V overall confirm a negative relationship between the OVX and the sample of Fintech firms. This shows that an increase in the OVX will have an inverse effect on Fintech firms. Finally, diagnostics tests were carried out to test the authenticity of the GARCH model and our results. The results confirm the fitness of the model used in this study.
Table V. Baseline DCC-AR (n)-GARCH (p,q) Model Results between OVX and Fintech firms
| VISA | MASTERCARD | TENCENT | INTUIT | PAYPAL | FISERV | ADYEN | BILL | XERO | |
|---|---|---|---|---|---|---|---|---|---|
| Panel A: Mean Equation | |||||||||
| μ | 0.003 | −0.004 | −0.003 | −0.004 | −0.004 | 0.002 | 0.004 | 0.005 | 0.002 |
| p-value | 0.230 | 0.059 | 0.144 | 0.045 | 0.040 | 0.369 | 0.118 | 0.049 | 0.418 |
| −0.086* | −0.078** | −0.042 | −0.060 | −0.058 | −0.084* | −0.115** | −0.090* | −0.091* | |
| p-value | 0.066 | 0.041 | 0.260 | 0.107 | 0.112 | 0.080 | 0.016 | 0.059 | 0.056 |
| −0.544*** | −0.277*** | −0.114 | −0.151* | −0.114* | −0.401*** | −0.249*** | −0.078 | −0.122 | |
| p-value | 0.000 | 0.005 | 0.156 | 0.059 | 0.062 | 0.004 | 0.003 | 0.105 | 0.155 |
| Panel B: Variance Equation | |||||||||
| 0.001*** | 0.001*** | 0.001*** | 0.001*** | 0.001*** | 0.001*** | 0.001*** | 0.001*** | 0.001*** | |
| p-value | 0.000 | 0.007 | 0.008 | 0.003 | 0.005 | 0.000 | 0.000 | 0.000 | 0.000 |
| 0.258*** | 0.131*** | 0.132*** | 0.119*** | 0.122*** | 0.271*** | 0.269*** | 0.260*** | 0.366*** | |
| p-value | 0.000 | 0.001 | 0.001 | 0.000 | 0.001 | 0.000 | 0.000 | 0.000 | 0.000 |
| 0.668*** | 0.785*** | 0.794*** | 0.797*** | 0.806*** | 0.665*** | 0.671*** | 0.672*** | 0.770*** | |
| p-value | 0.000 | 0.000 | 0.000 | 0.000 | 0.000 | 0.000 | 0.000 | 0.000 | 0.000 |
| Panel C: DCC Equation | |||||||||
| a | 0.028 | 0.015 | 0.003 | 0.020 | 0.025 | 0.027 | 0.031 | 0.010 | 0.012 |
| p-value | 0.150 | 0.202 | 0.859 | 0.417 | 0.418 | 0.183 | 0.122 | 0.606 | 0.547 |
| b | 0.871*** | 0.969*** | 0.878*** | 0.867*** | 0.820*** | 0.846*** | 0.929*** | 0.838*** | 0.889*** |
| p-value | 0.000 | 0.000 | 0.000 | 0.000 | 0.000 | 0.000 | 0.000 | 0.000 | 0.000 |
| Panel D: Diagnostics Tests | |||||||||
| Log-likelihood | 2837.644 | 2889.72 | 2708.852 | 2799.745 | 2622.07 | 2775.771 | 2486.364 | 2084.349 | 2484.695 |
| AIC | −5621.287 | −5723.44 | −5361.704 | −5543.49 | −5188.139 | −5497.542 | −4918.729 | −4114.698 | −4907.39 |
| BIC | −5497.238 | −5594.796 | −5233.061 | −5414.846 | −5059.495 | −5373.493 | −4794.68 | −3990.649 | −4764.963 |
| d-Stat | 2.023 | 2.006 | 2.018 | 2.011 | 2.008 | 2.005 | 1.939 | 1.970 | 1.960 |
Figure 2 plots the time-varying pairwise conditional correlations between the next-trading-day log returns, that is, of OVX, and the Fintech firms in our sample, that is, VISA (V), MASTERCARD (MA.N), TENCENT (0700. HK), INTUIT (INTU.O), PAYPAL (PYPL.OQ), FISERV (FISV.OQ), ADYEN (ADYEN.AS), BILL (BILL.K), and XERO (XRO.AX). For both crises, the overall picture across the firms is mostly consistent, aside from some periodic spikes within the acceptable range. This proves that the impact of the oil risk on the sector is very similar to the VIX results. We can observe a slight fluctuation for prominent US players in the market, like Bill and PayPal. All correlations stay well below zero at all times.
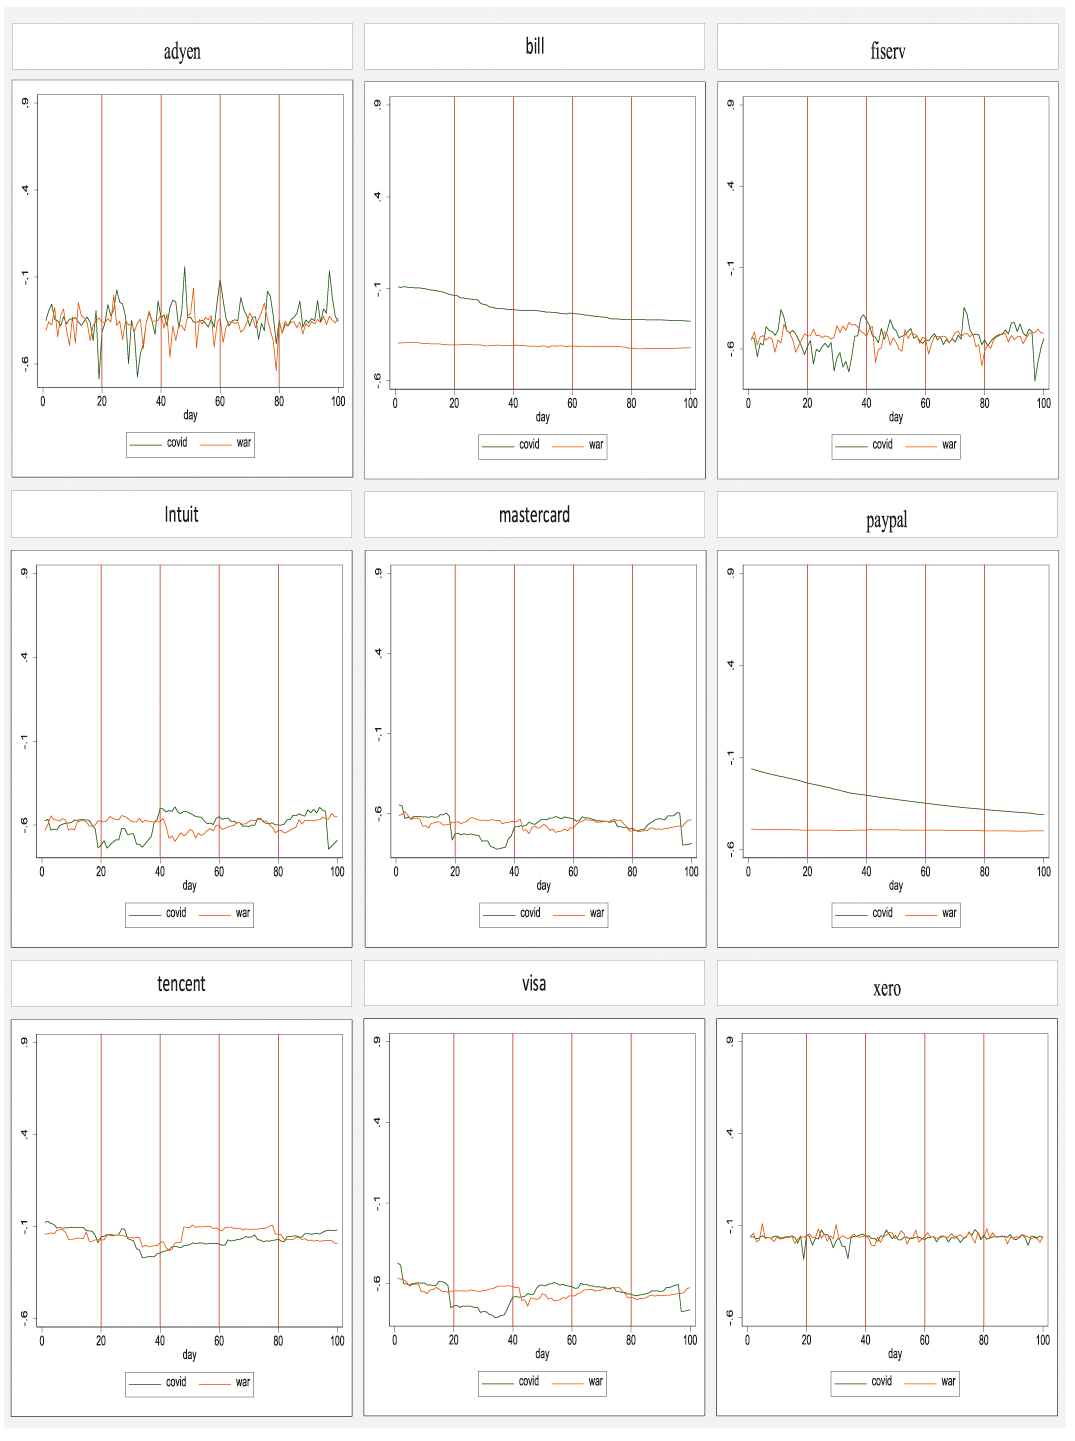 Fig. 2. COVID-19 vs. WAR Sample Correlation between OVX and Fintech firms over 100 significant days.
Figure 3 plotted the time-varying pairwise conditional correlations between the next-trading-day log returns, that is, VIX-OVX, and the Fintech firms in our sample, that is, VISA (V), MASTERCARD (MA.N), TENCENT (0700.HK), INTUIT (INTU.O), PAYPAL (PYPL.OQ), FISERV (FISV.OQ), ADYEN (ADYEN.AS), BILL (BILL.K), and XERO (XRO.AX). The selected period for COVID-19 was January 30, 2020, to June 17, 2020.
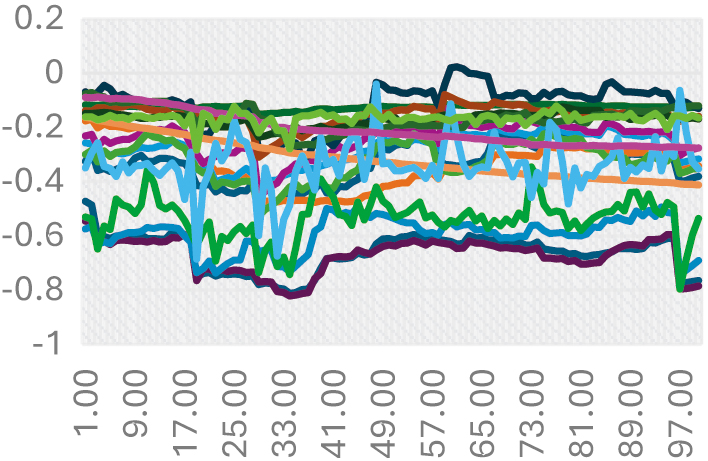 Fig. 3. DCC correlations between VIX and OVX with Fintech firms during 100 significant days of COVID-19.
Next, Figure 4 plots the time-varying pairwise conditional correlations between the next-trading-day log returns, that is, of the VIX/OVX, and the Fintech firms in our sample, that is, VISA (V), MASTERCARD (MA.N), TENCENT (0700.HK), INTUIT (INTU.O), PAYPAL (PYPL.OQ), FISERV (FISV.OQ), ADYEN (ADYEN.AS), BILL (BILL.K), and XERO (XRO.AX). The selected period for WAR was February 24, 2022, to July 13, 2022. They cemented our previous findings for this purpose.
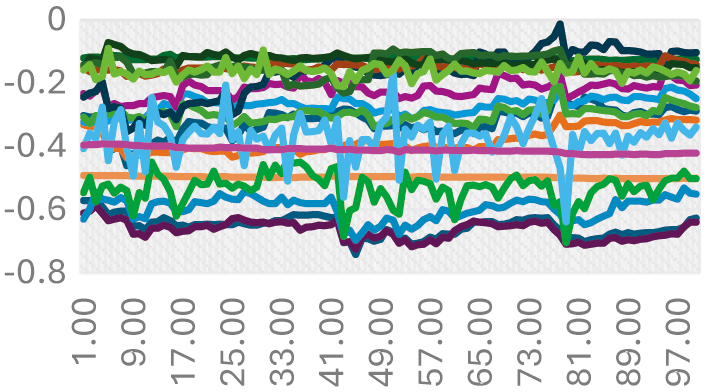 Fig. 4. DCC correlations between VIX and OVX with Fintech firms during 100 significant days of WAR.
V.CONCLUSION
This paper explored how risk affected Fintech firms in the COVID-19 and the Russia-Ukraine war periods using nine Fintech firms from four different countries covering December 13, 2019, to October 06, 2022. Our main goal was to document whether the VIX in either COVID-19 or WAR had a more significant (negative) impact on Fintech firms’ returns or not. In this regard, we could divide our findings into two subsections focusing on COVID-19 and WAR.
Our findings showed that the CBOE Volatility Index-VIX had an inverse impact on the returns of the Fintech sample in our study. We could also observe a drop in the correlation for COVID from around day 30.
Overall, these findings significantly impact the current literature on Fintech as they open the door for safe haven properties for Fintech stocks in the crisis period. However, as Fintech stocks are not traditional assets due to their connection to innovative design, we may need to look further into their capacity in the future.