I.INTRODUCTION
The thermal strength and reliability in extreme high-temperature environments are directly related to the safe service performance of components, and the most direct indicator to describe the thermal strength of components is the strain state of components [1]. Contact strain measurement has always been the main way of high-temperature strain measurement due to its simple measurement principle and high reliability [2,3]. Strain gages with a temperature range greater than 300°C are usually called high-temperature strain gages. Accurate measurement of high-temperature strain gauges has become an important prerequisite for studying the influence of high temperature on the mechanical properties of structures.
The characteristic parameters of high-temperature strain gages change with temperature. The error introduced by the lack of characteristic parameters of strain gages often reaches or even exceeds the measured strain itself, and it is not accurate to use it directly for high-temperature measurement results [4]. Therefore, a method suitable for the calibration of key parameters for high-temperature strain gauges is of great significance for the accuracy of strain measurement. In order to deform the calibration beam, most of the existing high-temperature strain parameter calibration devices use force or displacement loading with a specified weight and handwheel [5–8]. These calibration methods are inefficient and will generate large uncertainties. At the same time, the influence of the coefficient of thermal expansion (CTE) on the deformation measurement results at high temperature is not considered in the calculation, resulting in the inability to guarantee the accuracy of the measurement results, which further affects the accuracy compensation of the key parameters of the high-temperature strain gauge.
In this paper, according to the structure and working characteristics of high-temperature strain gauges, an automatic calibration device for high-temperature strain gauges is established, which consists of three parts: temperature control, loading, and measuring devices. Under the premise of ensuring the accuracy and stability of the temperature in the furnace, the servo motor drives the electric cylinder to apply the load. The measurement result of the calibration beam deformation is controlled by the temperature correction feedback to control the loading action to realize automatic loading. The sensor is connected to the computer, the input standard mechanical strain can be displayed and recorded in real time, and the automatic calibration of the strain gauge parameters can be realized. Based on the above calibration device, high temperature strain measurement accuracy correction software is developed. This paper carried out multi-parameter calibration method research to form calibration specifications for multiparameters such as sensitivity coefficient, heat output, zero drift, creep, etc. The precision compensation model for strain measurement is established to improve the strain measurement accuracy, which provide necessary experiments means for the study of thermal strength and reliability.
II.AUTOMATIC CALIBRATION DEVICE FOR HIGH-TEMPERATURE STRAIN GAUGES
A.MECHANICAL MODEL OF FOUR-POINT BENDING ISO-STRAIN BEAM
Automated calibration and automated control are critical concepts and components in artificial intelligence system and robotics. The calibration beam used in the automatic calibration device of high-temperature strain gauge is loaded in the form of four-point bending iso-strain, and the left–right symmetrical and equal loads are applied to it as shown in Fig. 1.
 Fig. 1. Mechanical model of four-point bending iso-strain beam with rectangular section.
The strain of the iso-strain section of the calibration beam has the relationship with the relative deformation of its midpoint and its size parameters as shown in Eqn. (1):
Where is the strain of the iso-strain section of calibration beam, in μɛ, Δω is the relative deformation of calibration beam midpoint, in mm, l is the fulcrum distance of calibration beam, in mm, a is the distance from the loading point of the force to the support point on the same side, in mm, h is the thickness of calibration beam, in mm, and b is the width of calibration beam, in mm.The strain of the iso-strain section of calibration beam is related to the l, a, h, and Δω. Among them, l, a, and h are guaranteed by machining accuracy, which is mainly affected by temperature changes during the working process. Δω needs to be measured in real time, and the mechanical strain of the calibrated beam can be obtained in real time as shown in Eqn. (1).
B.AUTOMATIC CALIBRATION DEVICE STRUCTURE AND CORRECTION SOFTWARE
The overall structure of the high-temperature strain gauge automatic calibration device is shown in Fig. 2. The physical picture of high-temperature strain gauge automatic calibration device is shown in Fig. 3. The high-temperature furnace is located on the upper bench, and the furnace includes calibration beams, supports, and loading connecting rods. A loading connecting rod and a displacement measuring mechanism are arranged in the middle of the device, and the relative deformation of the midpoint of the calibration beam is measured through an extension rod and a grating ruler. The lower part of the device is an electric loading mechanism, the electric cylinder and the servo motor are fixed on the table, and the load is applied to the calibration beam through the loading connecting rods.
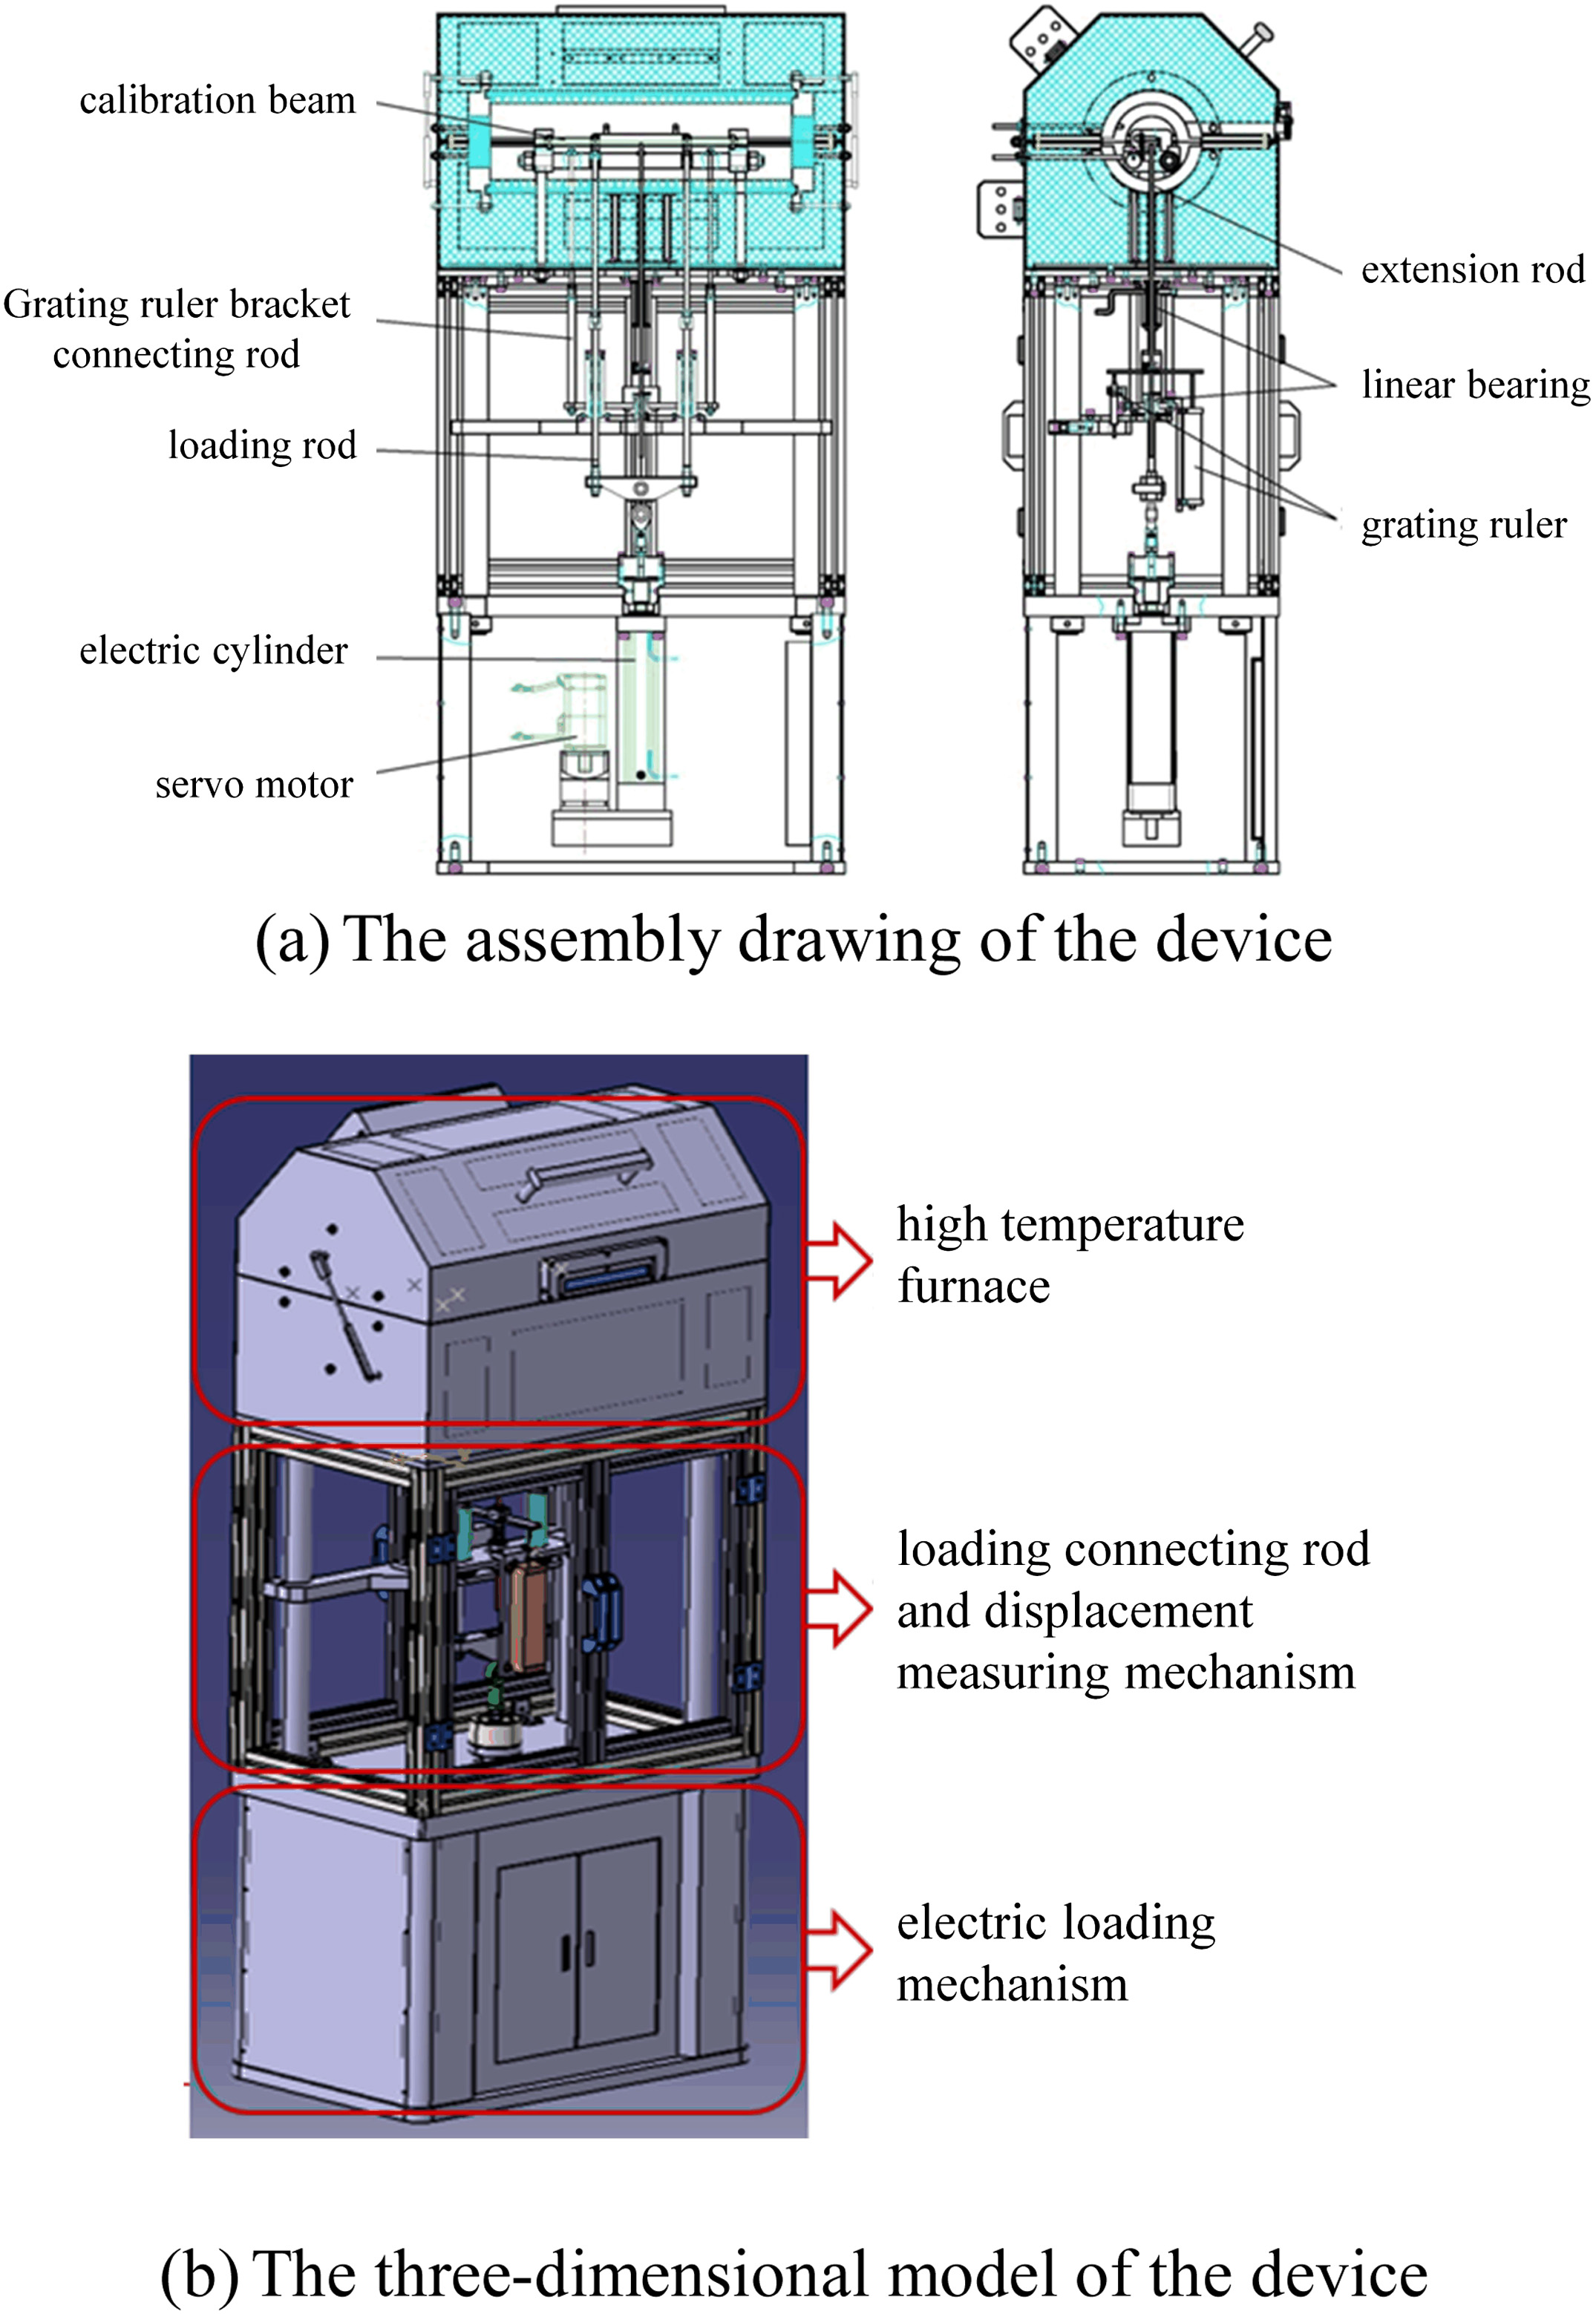 Fig. 2. The overall structure of high-temperature strain gauge automatic calibration device. (a) The assembly drawing of the device and (b) the three-dimensional model of the device.
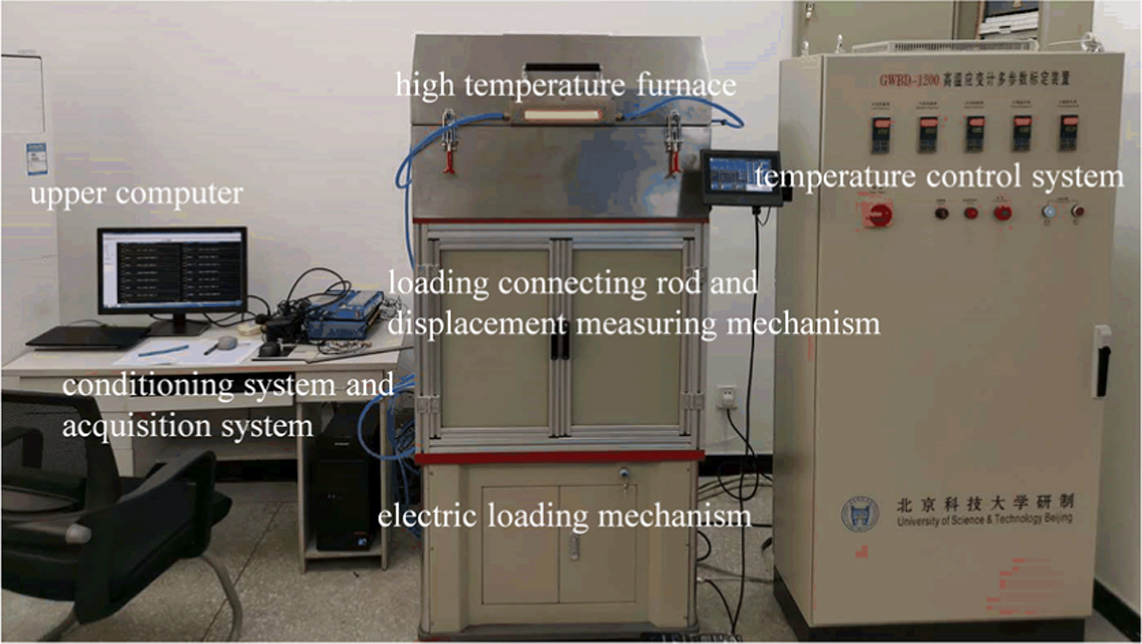 Fig. 3. The physical picture of high-temperature strain gauge automatic calibration device.
Five K-thermocouples are arranged in the high-temperature furnace, two of which measure the temperature of the calibration beam, and the other three are evenly arranged in the left, middle, and right sections of the furnace to measure the temperature in furnace. The resistance wire in the furnace is independently controlled for heating in the left, middle, and right sections. The heating power of each section can be adjusted between 0 and 100%, which can realize long-term stable operation from room temperature to 1100 °C, forming a uniform, stable, and controllable time/temperature thermal environment in the furnace.
The supporting structure is arranged in the high-temperature furnace, and the two sections are each fixed on the upper platen by two connecting columns. The two cylindrical bearing beams are arranged horizontally in the same direction as the furnace body. The two ends of the bearing beam are installed with the calibration beam support seat, and its position determines the distance from the calibration beam fulcrum. The connecting piece of the loading arm of the calibration beam connects with the side loading roller and the upper end of the support seat to ensure that the load is accurately and stably loaded on the calibration beam.
The servo motor and electric cylinder drive the loading connecting rod to realize precise and stable loading control, which can complete the automatic loading. The device is connected to the computer, and the loading program can be set according to the standard mechanical strain. During the loading process, the standard mechanical strain can be displayed and recorded in real time. It can realize the closed remote automatic test of strain gauge parameters, and the loading structure can realize the automatic loading and unloading and zero return.
The principle of the measuring mechanism of the device is shown in Fig. 4. The extension rod stands up against the midpoint of the calibration beam and extends downward through the furnace wall, cooling jacket, and linear bearing. The linear bearing constrains the linear movement direction of the extension rod to ensure that it follows moving in the vertical direction. The deformation of the midpoint of the calibration beam is transmitted to the pressure plate, and the pressure plate presses the contact of the grating ruler to measure the deformation.
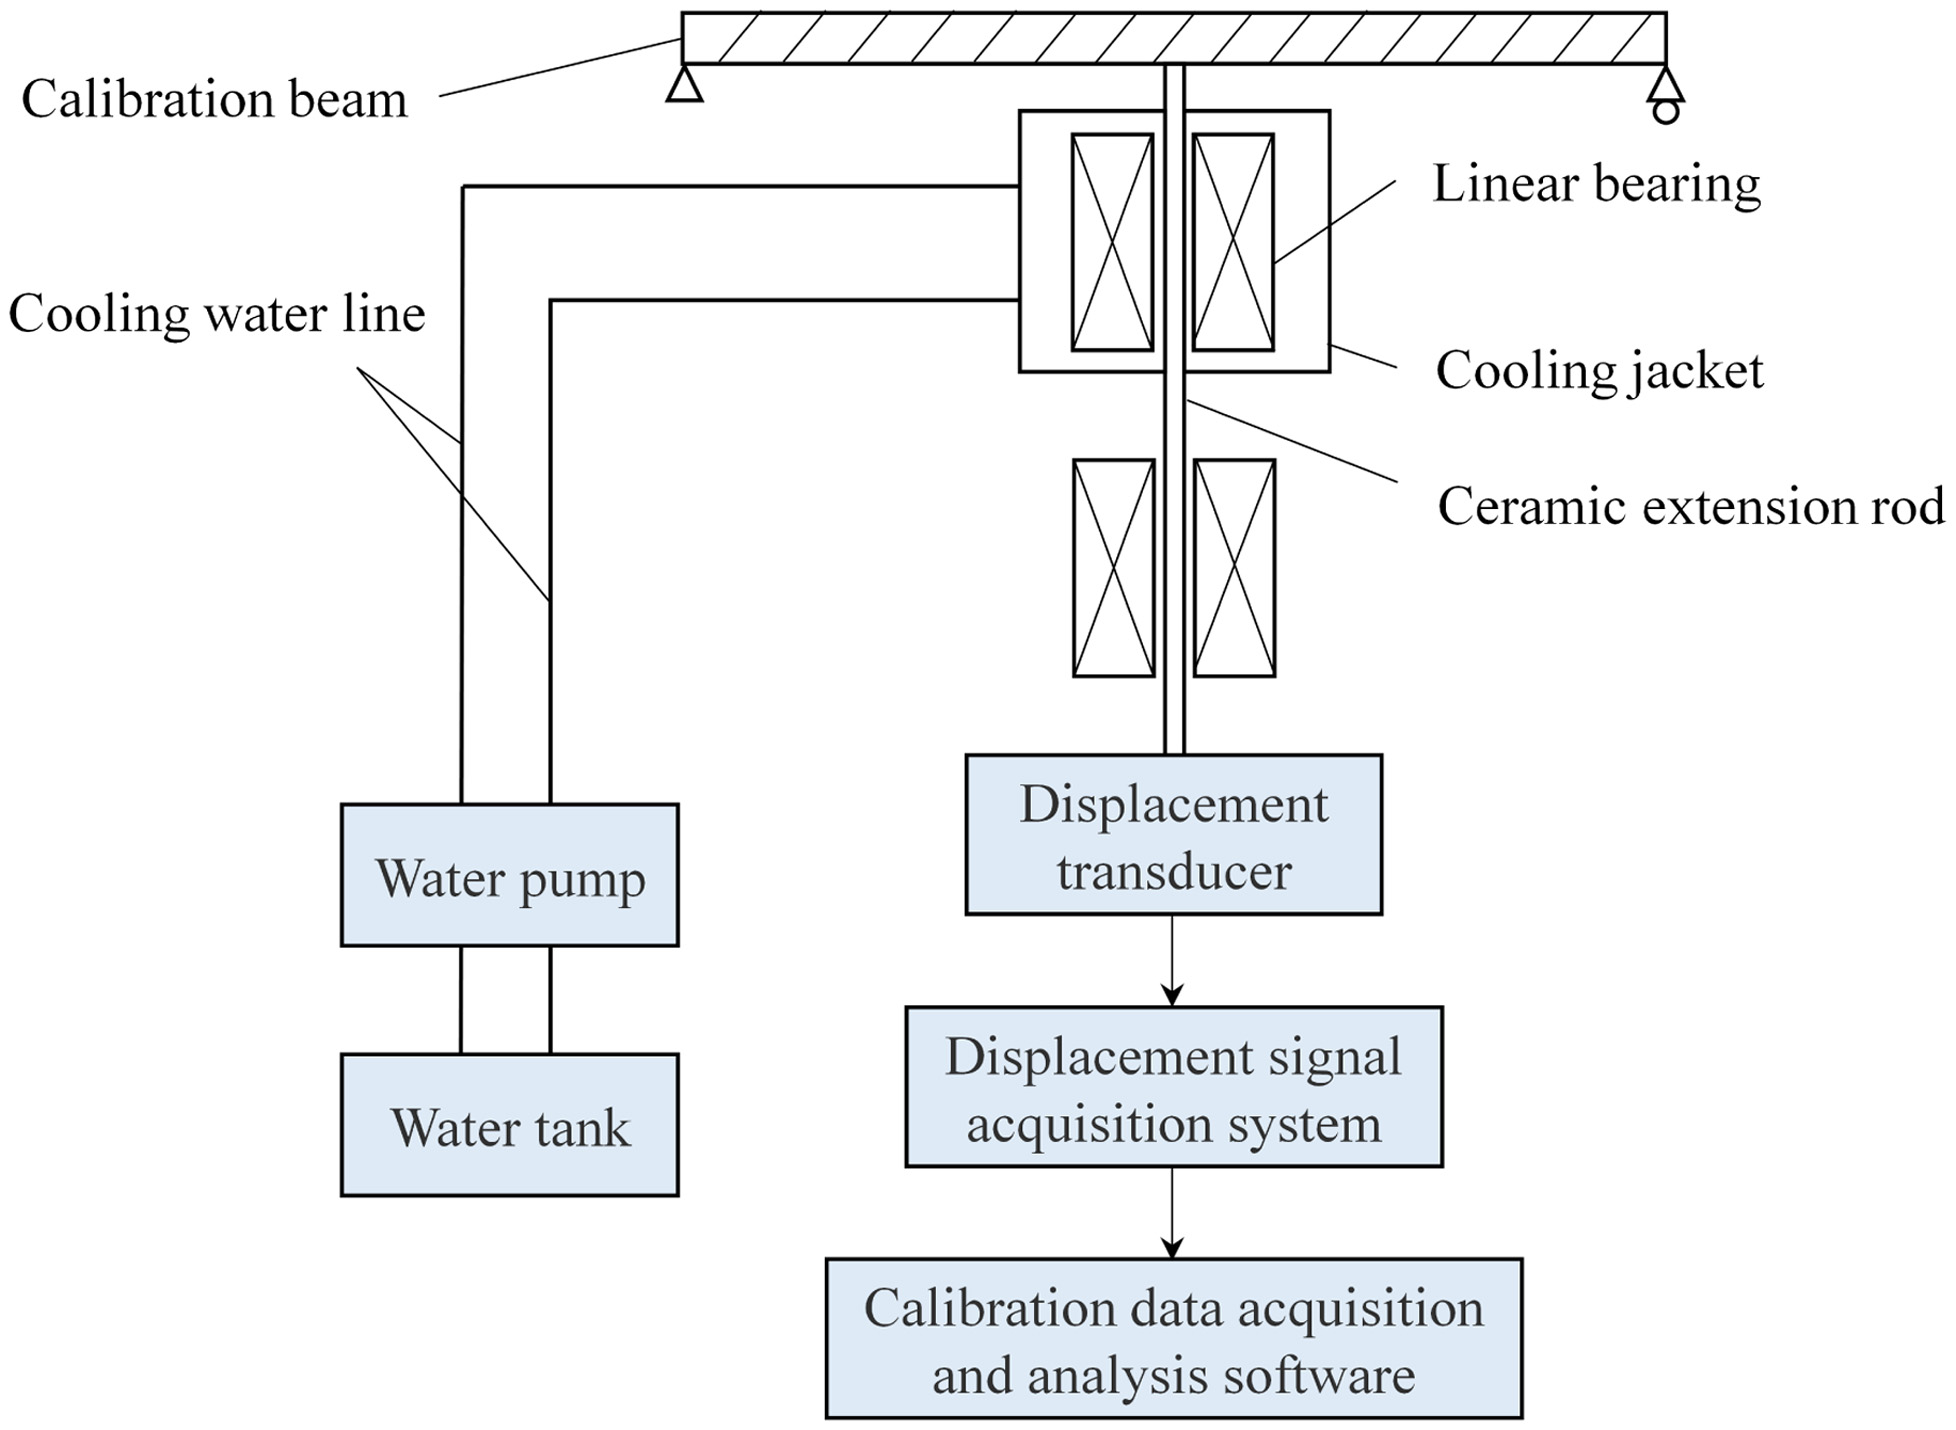 Fig. 4. The schematic diagram of the measuring mechanism.
According to the above calibration device, the high-temperature strain measurement accuracy correction software is developed. As shown in Fig. 5, the software integrates the temperature signal of the furnace and the deformation and temperature signals of the calibration beam. The theoretical strain ofthe calibration beam and the CTE corresponding to the current temperature can be calculated according to the size and material information input by the user. The theoretical strain is corrected according to the collected temperature signal. The software calculates the corresponding target correction deformation by Eqn. (2), which is used as a feedback signal to control the loading action and calibrate the strain signal:
Where is the target correction strain set in the loading program, , , and are calibration beam size parameters corrected according to the temperature and the CTE, is the CTE of the high-temperature fixture, is the CTE of the calibration beam, and is the constraint coefficient of the fulcrum distance, and the default is 1.Where is the length of loading arm corrected, is the height of loading arm corrected, is the deformation of the loading point, k is the coefficient relationship of the deformation between the loading point and the midpoint of the calibration beam, which is calculated from the position of the loading point and the corresponding deflection curve equation, as shown in Fig. 6, and is the target deformation for precalculated.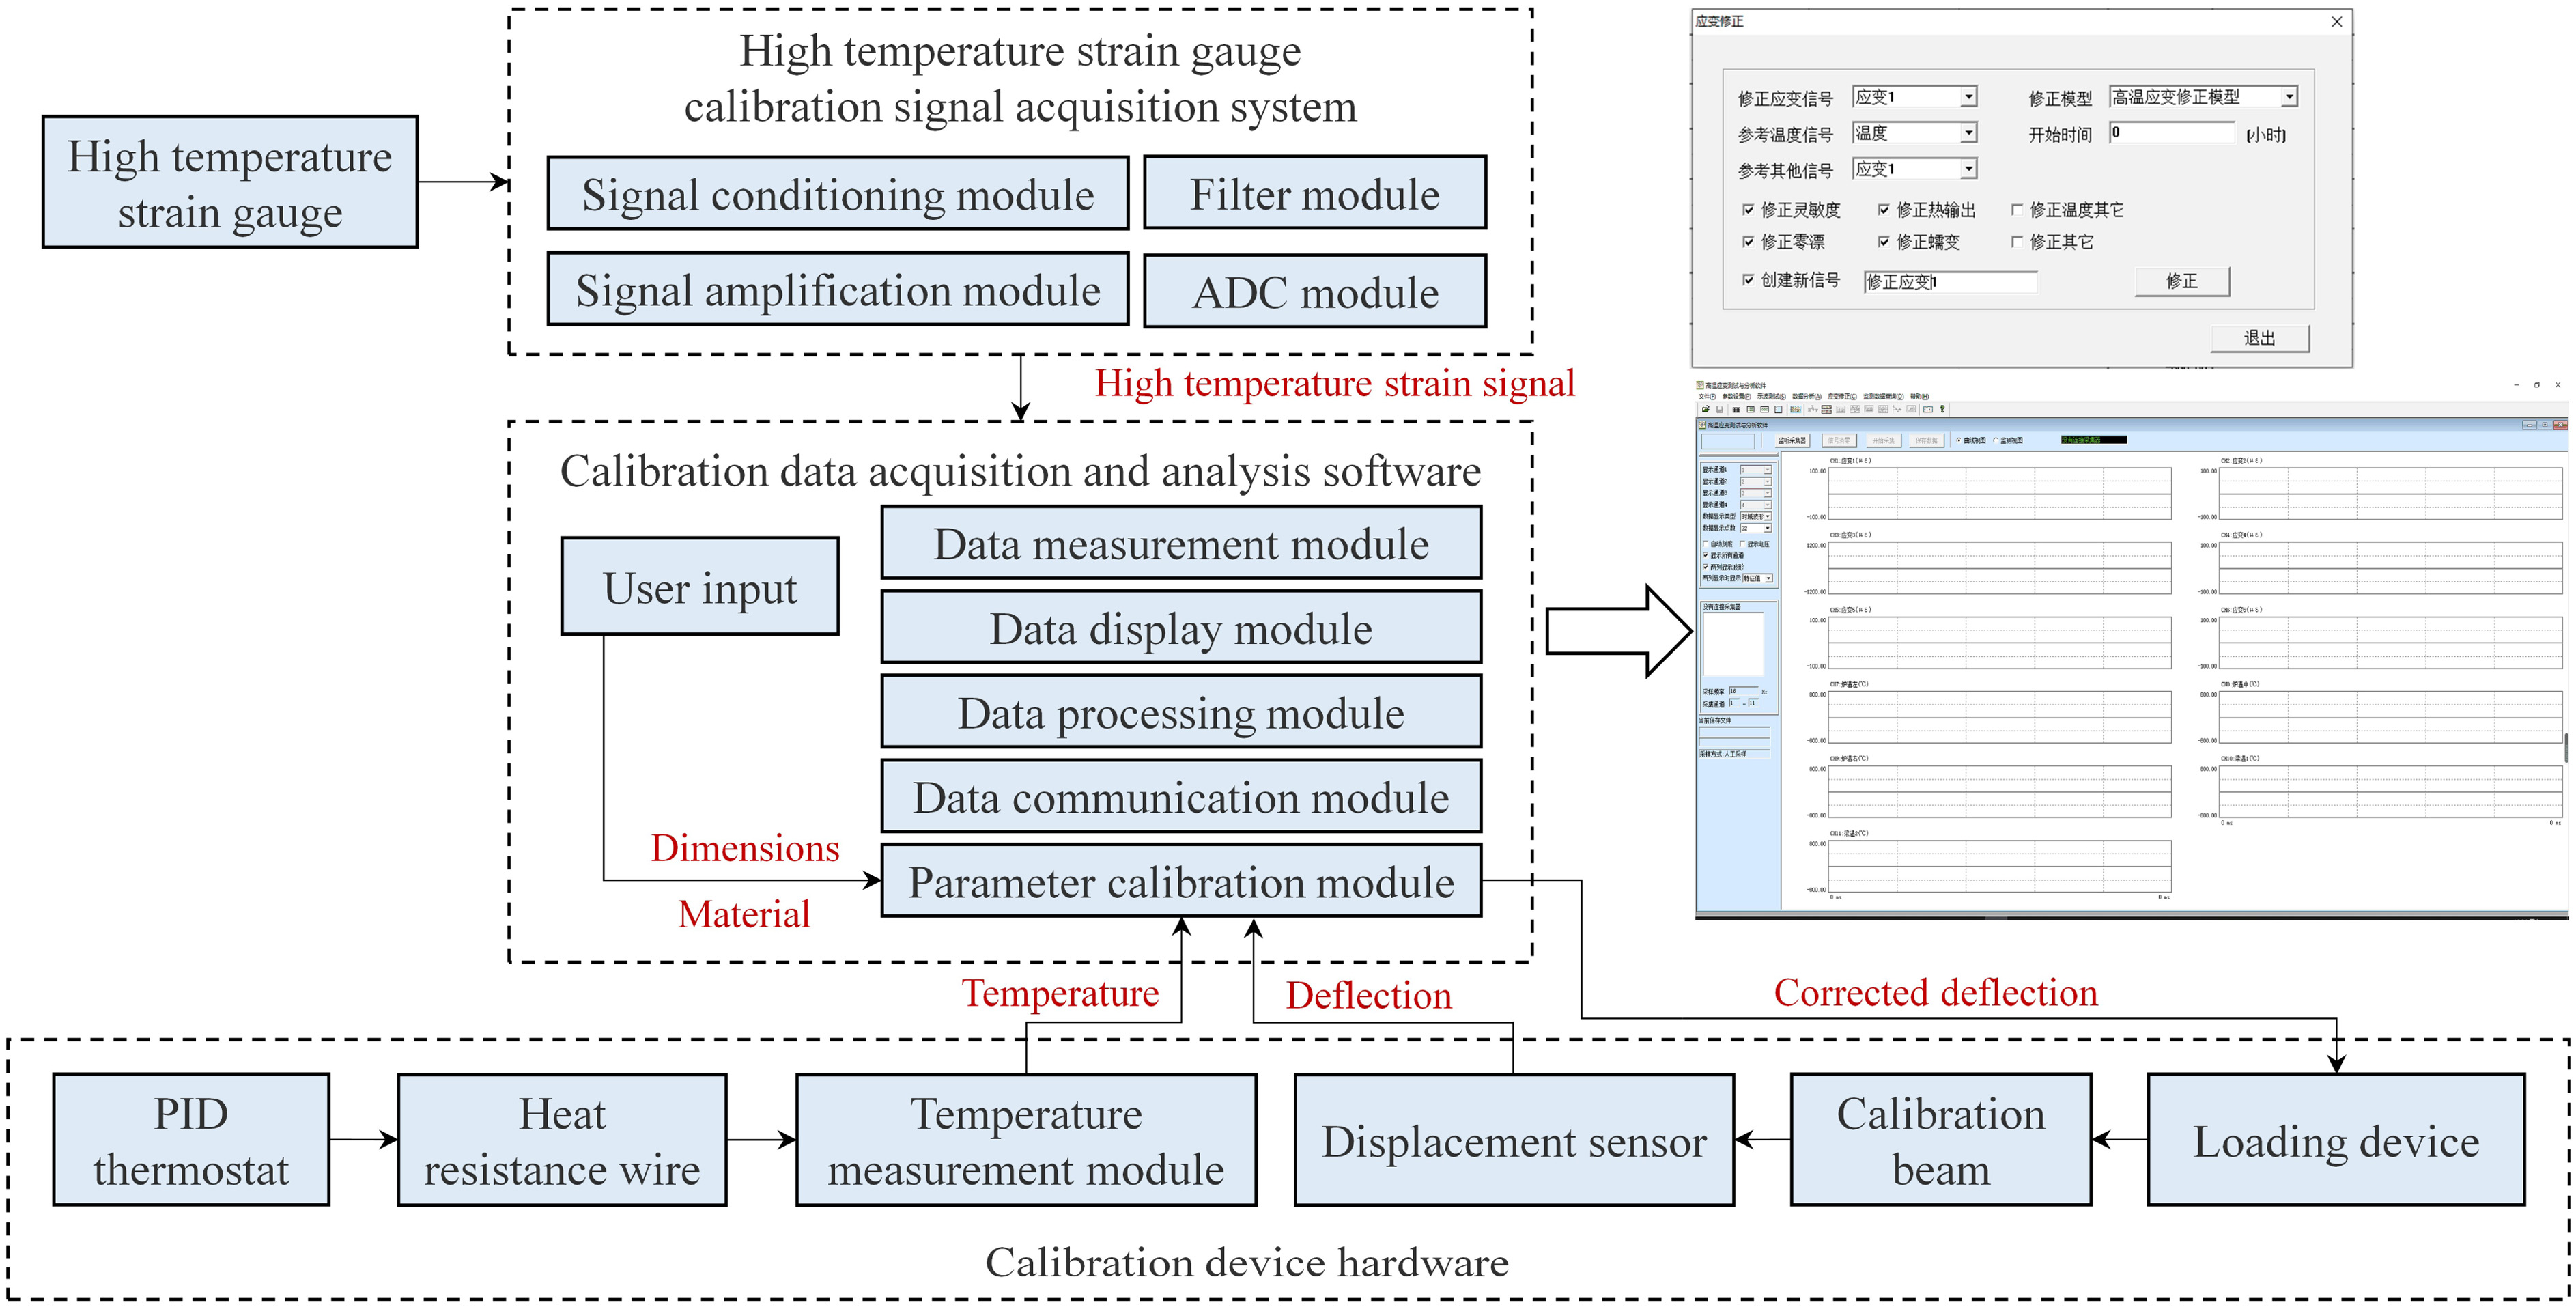 Fig. 5. The schematic diagram of high-temperature strain automatic calibration.
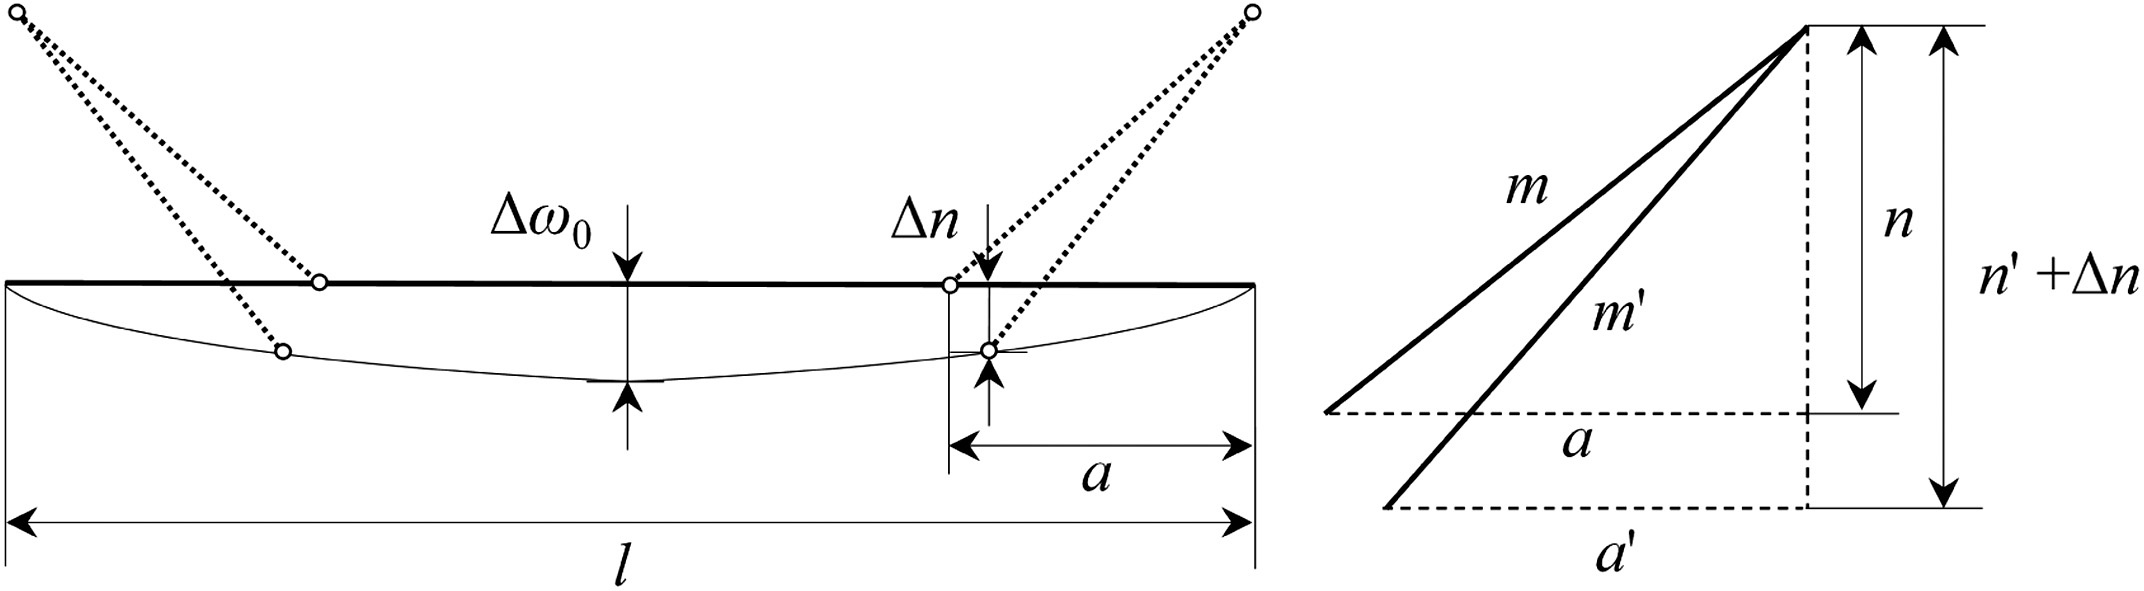 Fig. 6. The schematic diagram of deformation correction of calibration beam and loading arm.
C.MEASUREMENT UNCERTAINTY OF CALIBRATION DEVICE
Measurement uncertainty is caused by random errors in the measurement process. In the calibration device developed in this paper, all uncertainty sources are derived from the error range and probability distribution. First, according to the experience, the possible value interval of the measured value and the error half-width of the interval a are determined, and then that the probability distribution of the measured value is assumed, and the k is determined according to the probability distribution type of the measured value in the interval, then the uncertainty can be calculated by Eqn. (10):
where a is the half-width of the interval of possible values of the measurand and k is the multiplier for expanded uncertainty, inclusion factor.The standard uncertainty of different components is calculated separately and synthesized to obtain the total uncertainty by Eqn. (11):
According to the measurement principle of the mechanical strain of the calibration beam in the calibration device, the uncertainty of the measurement result is mainly related to the relative deformation measurement error of the calibration beam , the error of the thickness of the calibration beam h, the error of the fulcrum distance l, and the error of the length of the loading arm a. Considering the uniformity error of mechanical strain on the surface of the calibration beam and the additional load, the uncertainty analysis process is shown in Fig. 7.
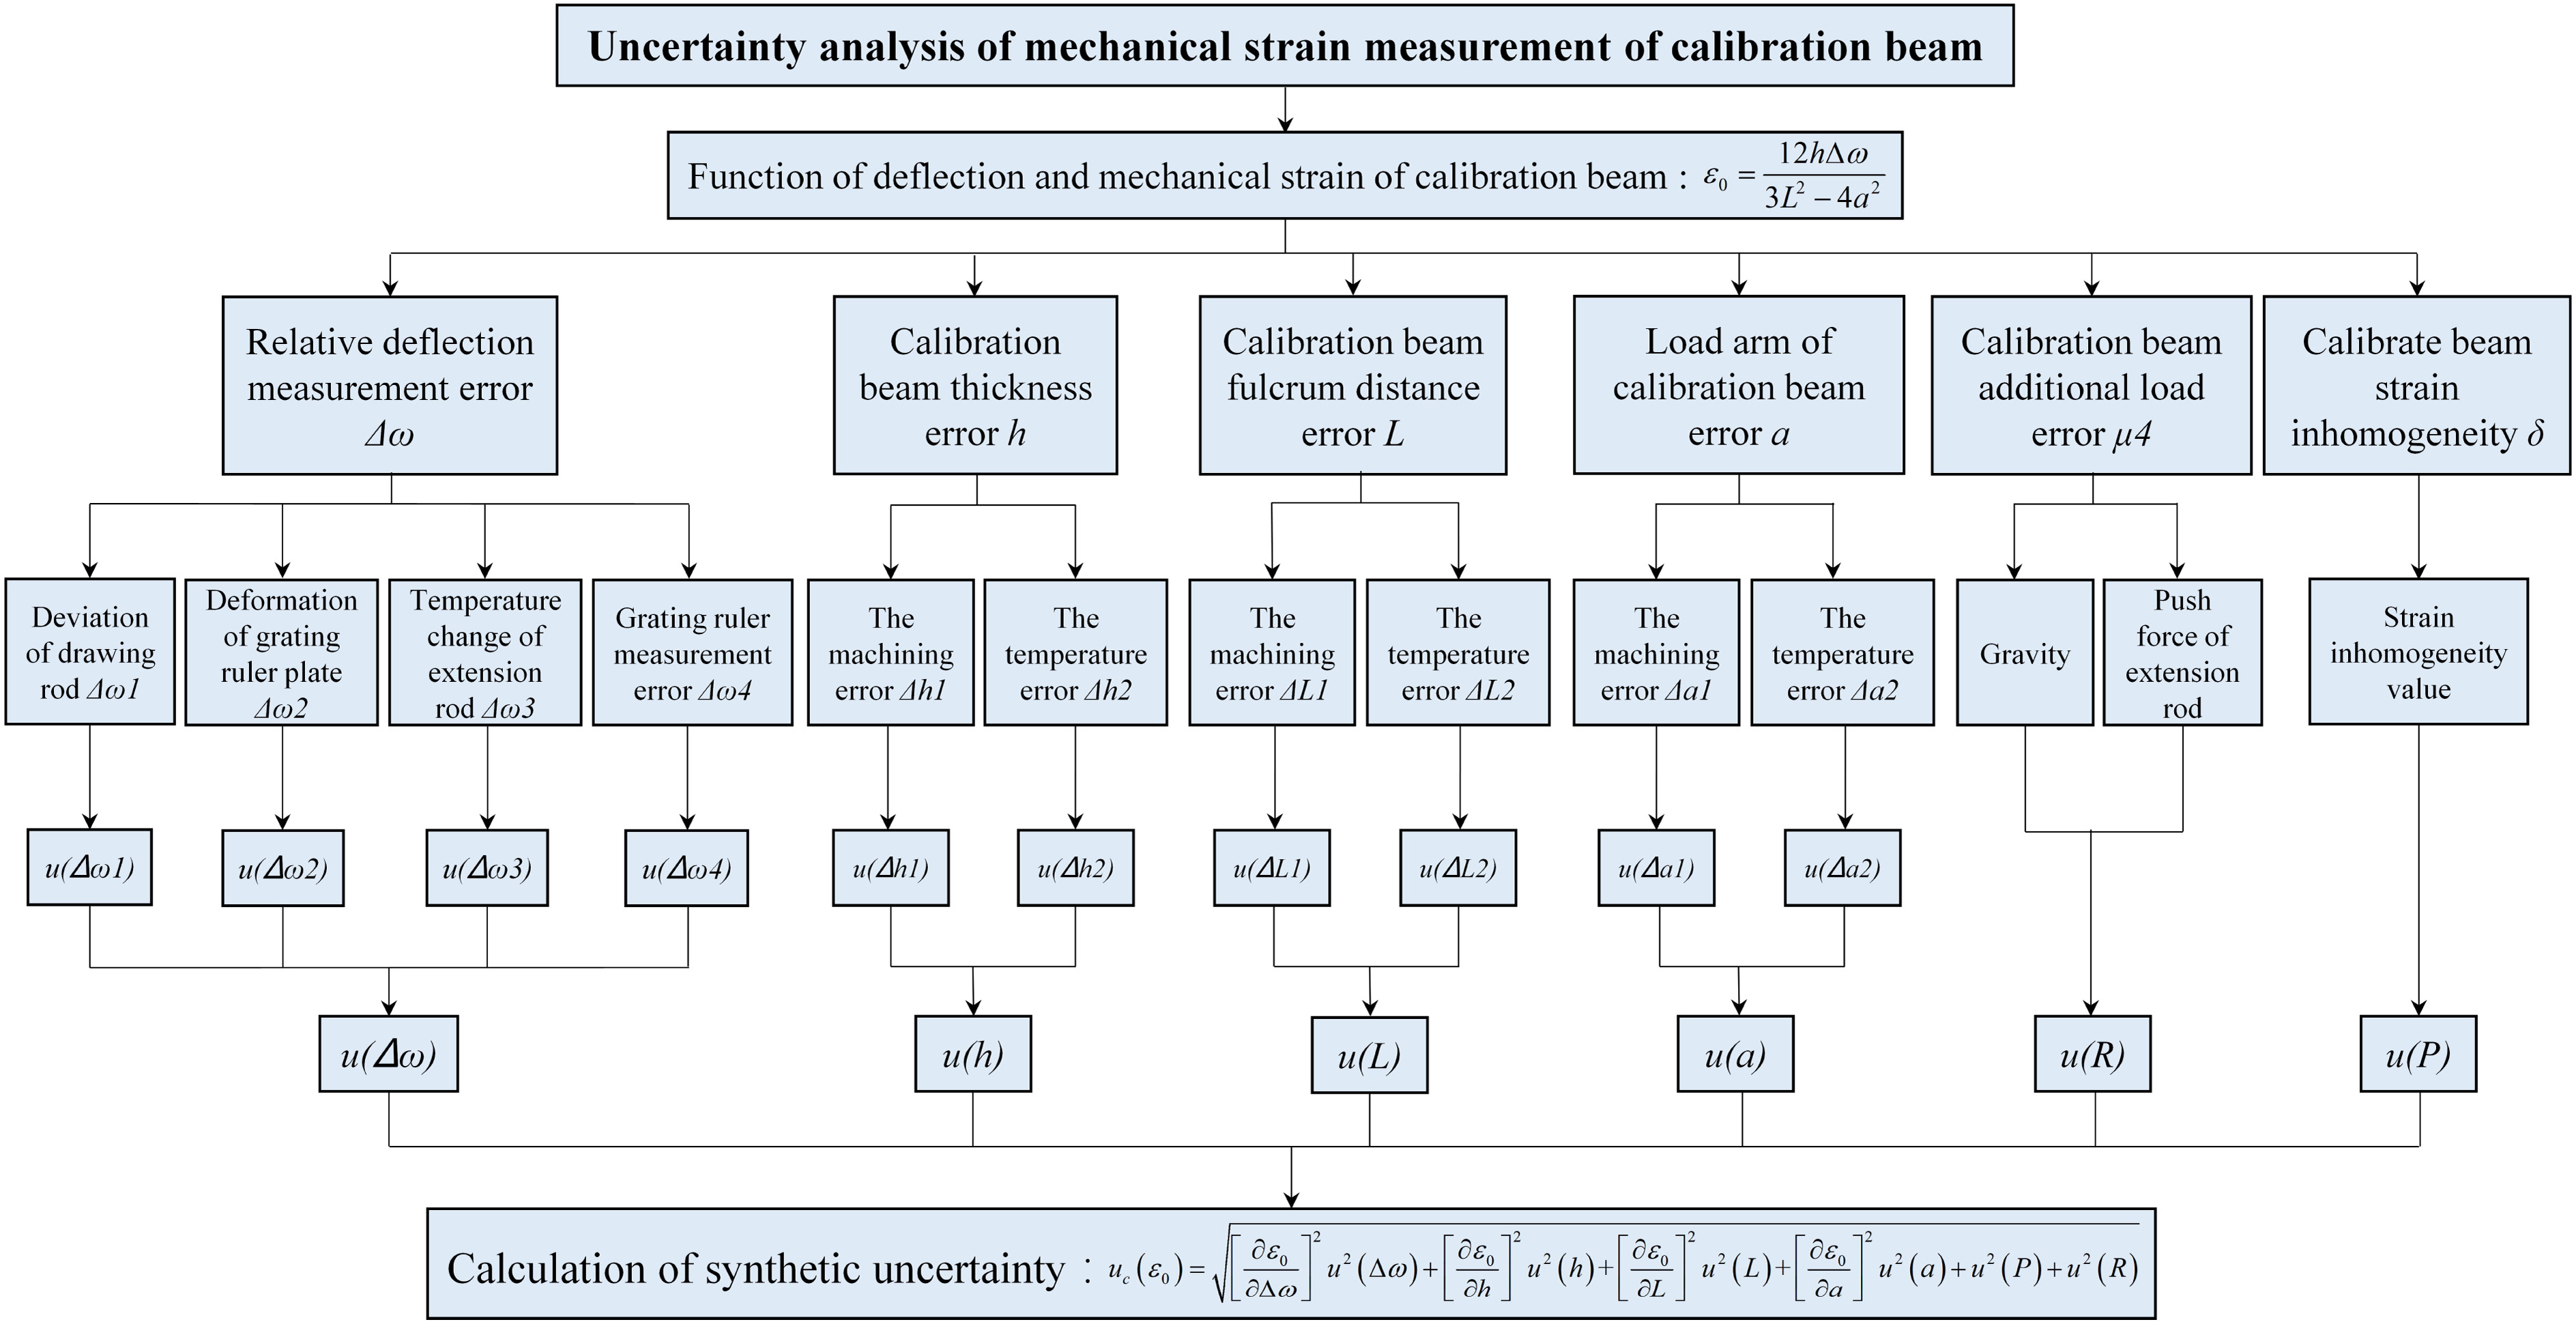 Fig. 7. The uncertainty analysis of the mechanical strain measurement of the calibration beam of calibration device.
The above error factors are analyzed, and the error values of each factor are obtained, and according to the probability distribution type, the uncertainty of the relative deflection measurement at the midpoint of the calibration beam , the uncertainty of the thickness u(h), the uncertainty of fulcrum distance u(l), the uncertainty of the loading arm distance u(a), the uncertainty u(P) caused by the uneven strain distribution, and the uncertainty u(R) caused by the additional load are obtained. The final combined uncertainty can be calculated by Eqn. (12):
The measurement uncertainty of the mechanical strain on the surface of the calibrated beam by this device is 0.191%.
D.CALIBRATION OF TEMPERATURE AND DEFORMATION MEASUREMENT ACCURACY
To calibrate the temperature measurement accuracy of the calibration device, two S-type standard platinum–rhodium thermocouples are placed arbitrarily in the furnace for temperature measurement and the temperature of the furnace is adjusted to 300 °C, 500 °C, 800 °C, and 1100 °C, respectively. Comparing the temperature measurement results of the device and the calibration system, the results of temperature measurement error and temperature fluctuation are shown in Table I. The average relative error of temperature measurement is about 0.605%, and the temperature fluctuation is about ±0.2 °C.
Table I. Temperature measurement accuracy test experimental data
| Nominal temperature/°C | Display temperature/°C | Measured temperature/°C | Relative error/% | Temperature fluctuation/°C |
|---|---|---|---|---|
| 300 | 300.0 | 297.4 | 0.87 | ±0.2 |
| 500 | 500.0 | 495.3 | 0.94 | ±0.3 |
| 800 | 800.0 | 802.5 | 0.31 | ±0.2 |
| 1100 | 1100 | 1103.3 | 0.30 | ±0.3 |
To calibrate the deformation measurement accuracy of the calibration device, the upper end of the high-temperature extension rod is located at the midpoint of the lower surface of the calibration beam, and the lower end passes through the high-temperature furnace and linear bearing and transmits the deformation to the grating ruler to measure the calibration beam deformation. The calibration system is located on the furnace body and directly measures the midpoint deformation of the upper surface of the calibration beam, as shown in Fig. 8.
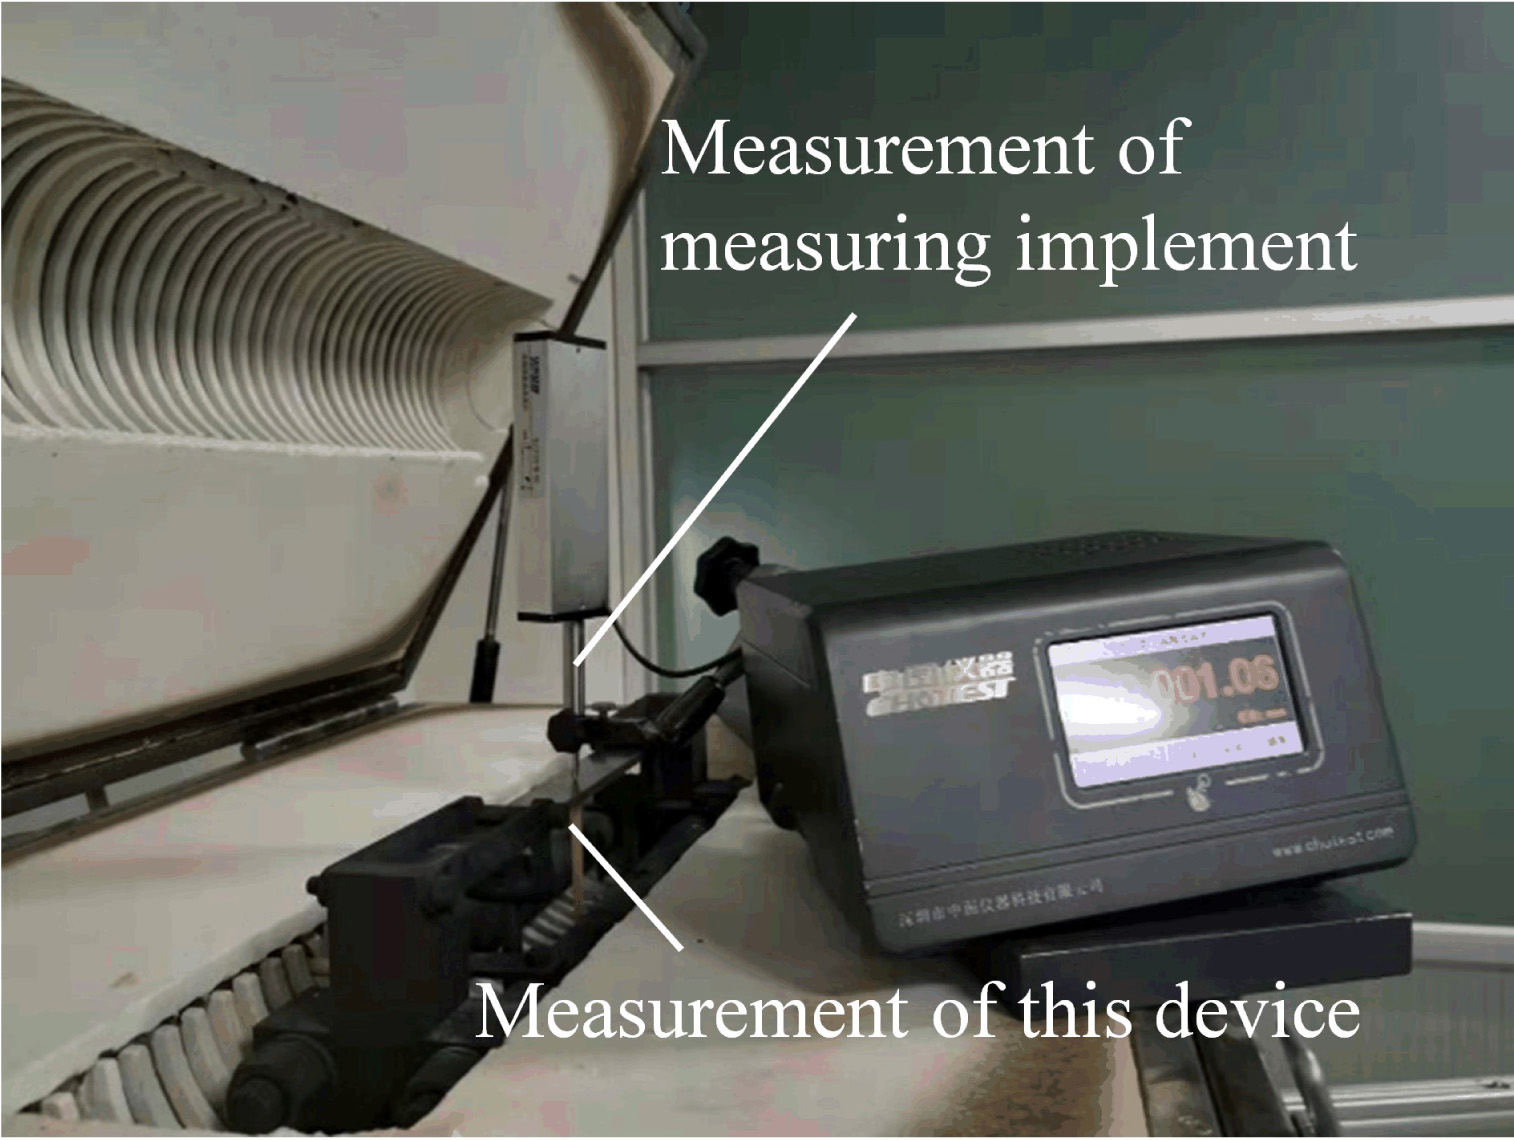 Fig. 8. Deformation measurement accuracy test experiment.
The mechanical strain loading range of the device is 1000 μɛ∼5000 μɛ. After the calculation by Eqn. (1), deformation of 5.0 mm∼25.0 mm is applied to the calibration beam with reference to the calibration system. Comparing the measurement results, the measurement error of the deformation is shown in Table II, and the average relative error is about 0.206%, which meets the requirements of deformation measurement accuracy.
Table II. Deformation measurement accuracy test experimental data
| Measured deformation/mm | Indication error/μm | Relative error/% |
|---|---|---|
| 0.0 | 0.0 | – |
| 5.0 | +1.5 | 0.030 |
| 10.0 | −71.8 | 0.718 |
| 15.0 | −34.7 | 0.231 |
| 20.0 | +40.1 | 0.201 |
| 25.0 | −41.4 | 0.166 |
III.HIGH-TEMPERATURE STRAIN MEASUREMENT ACCURACY CORRECTION MODEL
A.CHARACTERISTIC PARAMETER CALIBRATION AND ACCURACY COMPENSATION MODEL
The output signal of the high-temperature strain gauge is composed of the mechanical strain, thermal strain, and the output caused by the temperature load of the strain gauge. The key parameters affecting the strain measurement result are sensitivity coefficient, thermal output, zero drift, and creep. The above characteristic parameters will change with temperature, which will bring errors to the high-temperature strain measurement and seriously affect the accuracy of the measurement signal. This paper carried out a calibration experiment of the characteristic parameters of the high-temperature strain gauge, as shown in Fig. 9, established a high-temperature strain measurement accuracy compensation model, and explored the method of contact high-temperature strain accurate measurement.
 Fig. 9. High-temperature strain gauge characteristic parameter calibration experiment.
For most materials, when the ambient temperature increases, the sensitivity coefficient decreases; when the temperature decreases, the sensitivity coefficient increases [9,10]. In the high-temperature measurement, the calibration and correction of the sensitivity coefficient of the strain gauge become an effective solution [11]:
where K0 is the sensitivity coefficient of strain gauge at normal temperature, Ks is the sensitivity coefficient for strain gauge settings (Ks = 2), is theoretical strain of the calibration beam, and is strain measured by the strain gauge while loading.The calibration beam is slowly and uniformly loaded to 1000 μɛ, and the displacement of the calibration beam and the indicated strain of the strain gauge are measured at this time. By calibrating multiple sets of strain gauges, the sensitivity coefficient variation data of the strain gauges at different temperatures are obtained, and the sensitivity coefficient data of multiple sets of strain gauges are fitted to obtain the sensitivity coefficient variation curve with temperature, as shown in Fig. 10.
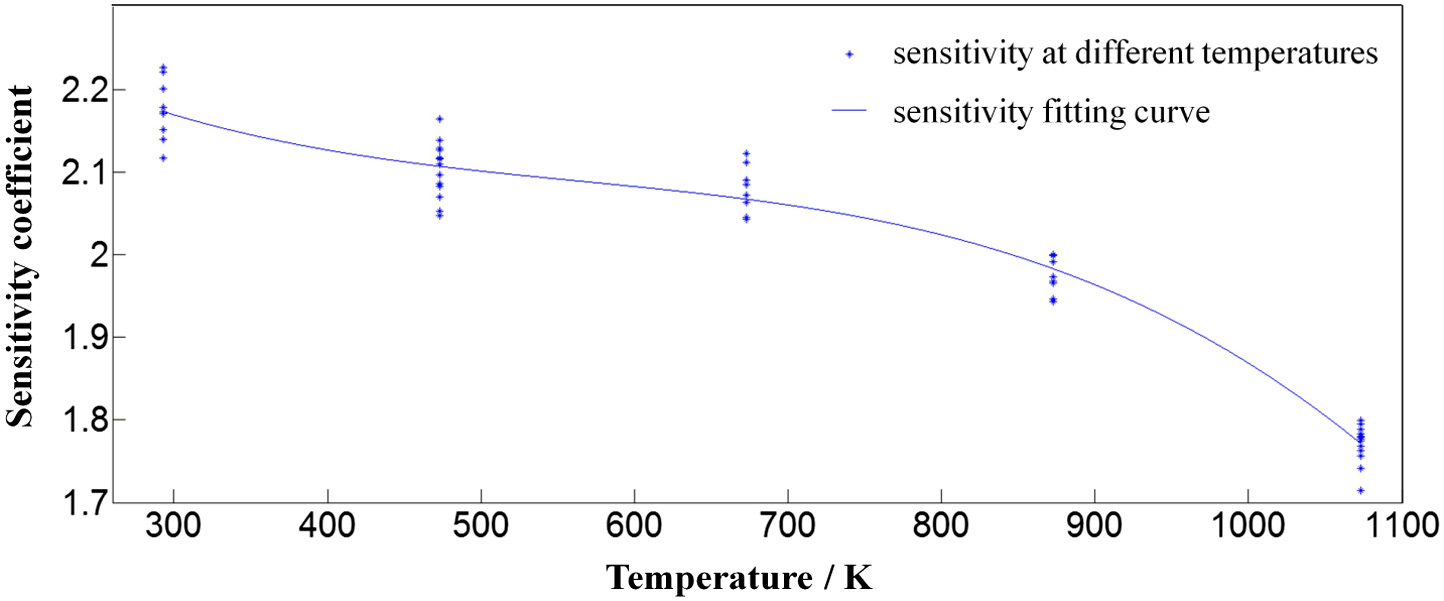 Fig. 10. Sensitivity coefficients and their fitting curves at different temperatures.
The corrected measurement strain can be obtained as shown in Eqn. (14):
Where is the measured strain before correction and K is the sensitivity coefficients at different temperatures.For high-temperature strain gauges, the thermal output performance is the most important indicator to determine the accuracy of high-temperature strain measurement. In static measurement, the strain caused by the change of ambient temperature is very large, often reaching or even exceeding the measured strain, so effective compensation measures must be adopted to eliminate its influence [12].
The strain gauge is pasted on the surface of the calibration beam, the same heating program is set as the actual measurement, and the thermal output curve of the strain gauge is measured. While measuring the indicated strain, real-time measurement is performed on the change of the temperature T of the measuring point, and a curve of thermal output with temperature is established, as shown in Fig. 11. In the actual measurement, the indicated strain is corrected according to the thermal output curve.
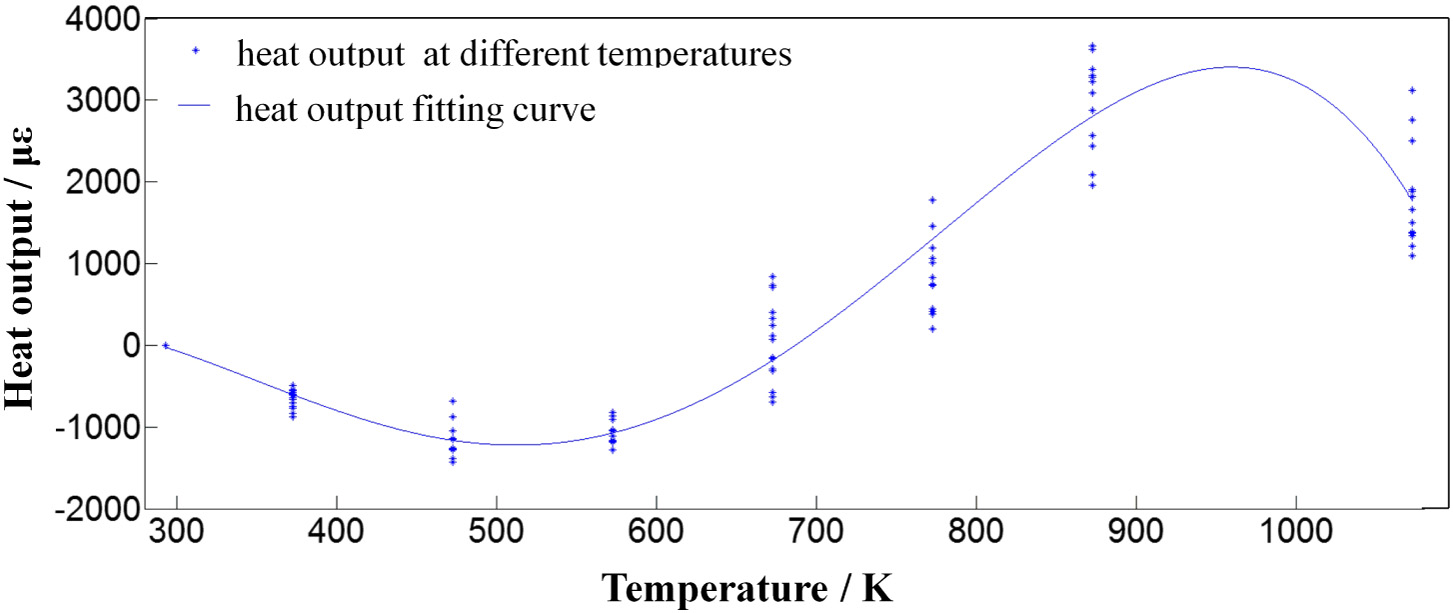 Fig. 11. Thermal output and their fitting curves at different temperatures.
The true strain correction model of the component can be obtained as shown in Eqn. (15):
Where is the measured strain before correction and is the strain due to thermal output at different temperatures.Zero drift refers to the characteristic parameter that the resistance value measured at constant temperature changes with time on the surface of the unloaded specimen.
The strain gauge is fixed on the surface of the calibration beam and heated to the specified temperature. After the temperature is stabilized, strain is collected directly without applying mechanical load. The strain is recorded for every 10 minutes for a total of 1 hour and the recorded value of each strain is compared with the first strain. The maximum difference is the zero drift of the strain gauge at this temperature. The zero drift characteristics of multiple sets of strain gauges are calibrated to obtain the zero drift at different temperatures and times, as shown in Fig. 12.
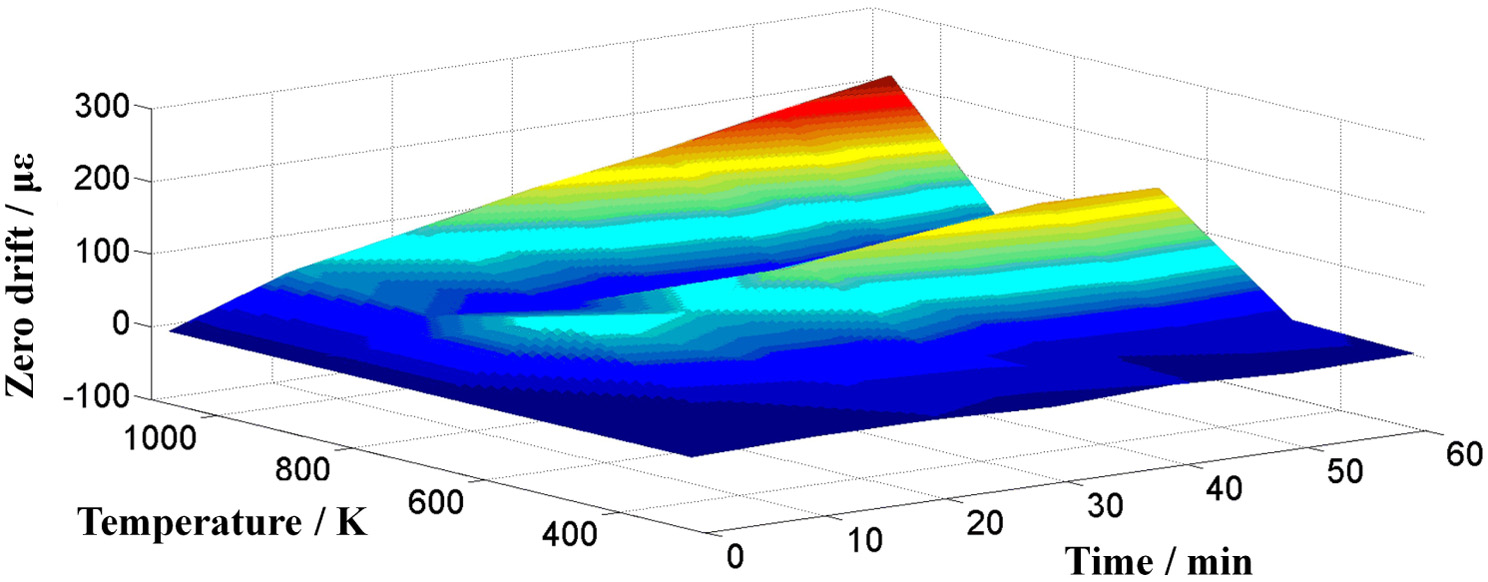 Fig. 12. Zero drift and their fitting surfaces at different temperatures and times.
During the calibration experiment of zero drift, it is found that although the fluctuation of zero drift is large, the overall value is very small. It is compensated according to the temperature and measurement time, as shown in Eqn. (16):
Where is measured strain before correction and is zero drift of strain gauges at different temperatures.The change of indicated strain with time under constant mechanical strain and constant temperature is called strain gauge creep. And creep is the function of temperature. The higher the temperature, the greater the creep.
The strain gauge is fixed on the surface of the calibration beam and heated to the specified temperature, and after the temperature is stable, the calibration beam is loaded to a constant 1000 μɛ within 15 s and measured within 1 min, and then the strain every is recorded for 10 min for a total of 1 h [13,14]. The difference between the recorded value of each strain and the first strain is made, and the maximum difference is the creep at this temperature. The creep of multiple groups of strain gauges is calibrated to obtain the creep of the strain gauges at different temperatures and times, as shown in Fig. 13.
 Fig. 13. Creep and their fitting surfaces at different temperatures and times.
It is found that the creep is basically constant at the specified temperature and changes linearly with time, and it is compensated according to the temperature and measurement time, as shown in Eqn. (17):
Where is the measured strain before correction and is the creep of strain gauges at different temperatures.In the above, the influence of the characteristic parameters of the strain gauge on the high-temperature strain measurement was obtained through the dynamic calibration experiment, and the overall error correction model was established, and the thermal output, zero drift, and creep values were subtracted from the measured value, and then the sensitivity coefficient was corrected. Minimize the influence of temperature on the strain measurement and obtain the corrected strain measurement value, as shown in Eqn. (18):
Where is the measured strain before correction and is the strain after overall error correction.B.HIGH-TEMPERATURE STRAIN MEASUREMENT VERIFICATION EXPERIMENT
The temperature of the high-temperature furnace is controlled at 293 K, 573 K, 873 K, 1073 K, and 1373 K, respectively, and a high-temperature strain measurement experiment is conducted to verify the compensation accuracy of the error correction model. The high-temperature strain gauge is installed on the surface of the calibration beam, the calibration beam is loaded, and the maximum deformation and the indicated strain of the calibration beam are recorded. The indicated strain signal is shown in Fig. 14.
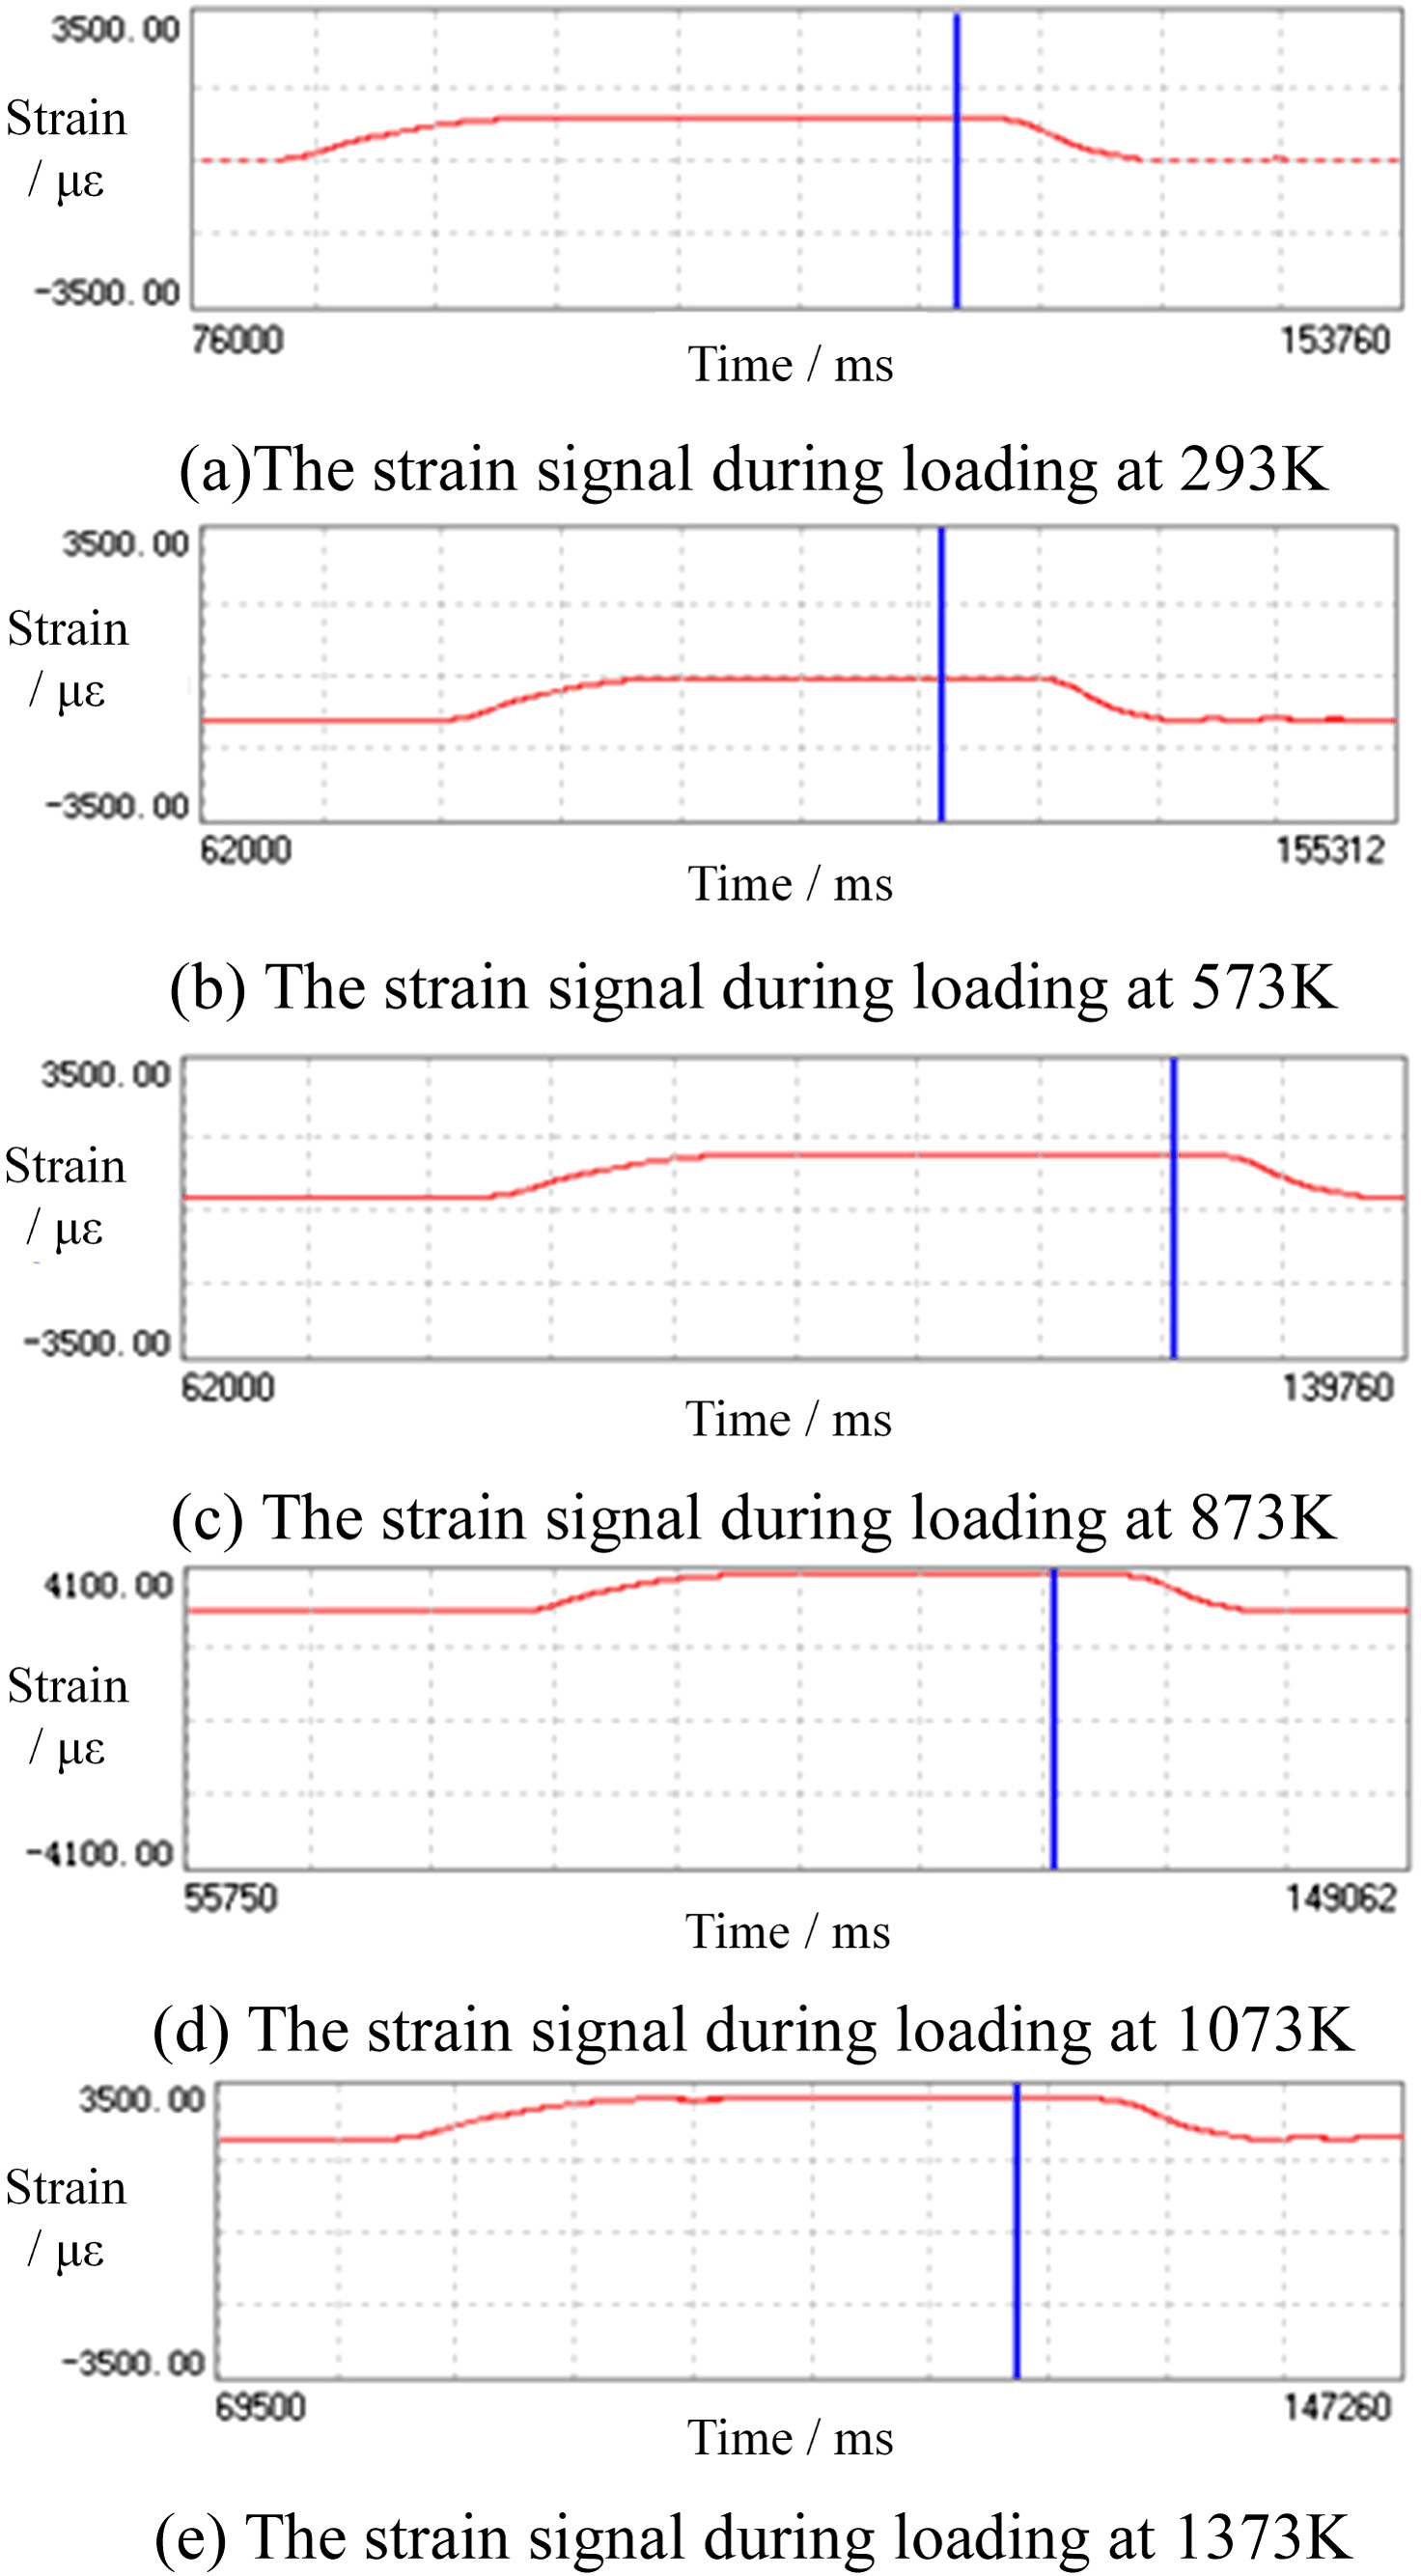 Fig. 14. Strain signals for verification experiments at different temperatures: (a) the strain signal during loading at 293 K; (b) the strain signal during loading at 573 K; (c) the strain signal during loading at 873 K; (d) the strain signal during loading at 1073 K; and (e) the strain signal during loading at 1373 K.
The strain measurement results are corrected through the error correction model established above, and the corrected data are obtained and compared with the theoretical strain to calculate the strain measurement error at each temperature, to evaluate the correction effect of the high-temperature strain accuracy compensation model. Measurement and verification experimental comparison results are shown in Fig. 15.
 Fig. 15. Comparative results of high-temperature strain measurement verification experiments.
The comparative results show that the correction model can meet the high-temperature strain measurement accuracy requirements in each temperature range. The measurement accuracy correction error is 0.91% at normal temperature and increases with the increase in temperature. When the temperature is 1373 K, the maximum measurement error is 17.22%.
IV.CONCLUSION
According to the structure and working characteristics of the high-temperature strain gauge, an automatic calibration device for the high-temperature strain gauge was established. Temperature of the high-temperature furnace was automatically controlled by the temperature control device. The electric cylinder was driven by the servo motor to apply the load to the calibration beam. The output signal of the high-temperature strain gauge, the thermocouple signal, and the displacement signal of the grating ruler were collected at the same time. The deformation measurement results obtained after temperature correction were used to calculate the theoretical mechanical strain, which were fed back to control the loading action to complete the automatic calibration process. After the calculation, the measurement uncertainty of the device is 0.191%, the relative error of temperature measurement is about 0.605%, the fluctuation degree is about ±0.2 °C, and the relative error of deformation measurement is about 0.206%, which meets the measurement requirements, and the measurement results are true and reliable.
Based on the above calibration device, the high-temperature strain measurement accuracy correction software was developed, and the multiparameter calibration of the high-temperature strain gauge was carried out to obtain the curves of sensitivity coefficient, thermal output, zero drift, and creep characteristics with temperature, and the accuracy compensation model of strain measurement was established. The measurement experiment of high-temperature strain was verified. The experimental data show that the correction model can meet the requirements in each temperature range. The error is 0.91% at normal temperature, and the maximum measurement error is 17.22% when the temperature is 1373 K.