I.INTRODUCTION
Currently, the rapid growth of digital technology not only has changed teaching methods but also has a profound impact on teachers’ teaching philosophy, teaching methods, and teaching tools [1,2]. The high-quality promotion of vocational education has put forward high requirements for teachers’ digital abilities. As a key force in cultivating high-quality technical and skilled talents, vocational education teachers (VETs) have significant importance in enhancing their digital abilities to promote the modernization of vocational education and improve teaching quality. However, many VETs still face many challenges in the real application of digital technology, which affects teaching effectiveness and also restricts the further development of vocational education [3,4]. Therefore, how to effectively enhance the digital capabilities of VETs and dynamically track their development has important theoretical and practical significance. Currently, VETs face many challenges in developing their digital capabilities. First, limited digital resources and training programs restrict teachers’ ability to effectively integrate technology into teaching practice. Second, the rapid development of technology means that teachers must constantly update their skills to maintain relevance [5,6].
This study develops an improved BP for evaluating VET digital competence enhancement strategies and introduces a Keyword Knowledge Tracing (KKT) model to track and analyze the effectiveness of teachers’ digital teaching competence enhancement through keyword structure. The study aims to develop a comprehensive strategy to enhance the digital capabilities of VETs by improving the back propagation (BP) neural network and the KKT model and to dynamically track their development. Specifically, the improved BP neural network is used to enhance teachers’ digital teaching capabilities, while the KKT model is employed to monitor the development trajectory of teachers’ digital abilities in real time, providing support for personalized training. The innovation lies in the comprehensive use of BP and KKT models, while improving BP through optimizing initial weights, introducing momentum factors, and adaptive learning rate adjustment methods. Traditional BP neural networks have limitations when dealing with complex educational data, such as being prone to getting stuck in local minima and having a slow convergence speed. The study significantly improves the training efficiency and prediction accuracy of the model by introducing genetic algorithms (GAs) to optimize the initial weights, introducing momentum factors, and adaptive learning rate adjustment methods. In addition, the KKT model builds a knowledge graph through keywords and their relationships and uses graph neural networks (GNNS) to model and track the development of teachers’ digital capabilities. It can dynamically adapt to the development and changes of teachers’ digital abilities, with high tracking accuracy and stability.
The organization of the remaining part is shown in Fig. 1.
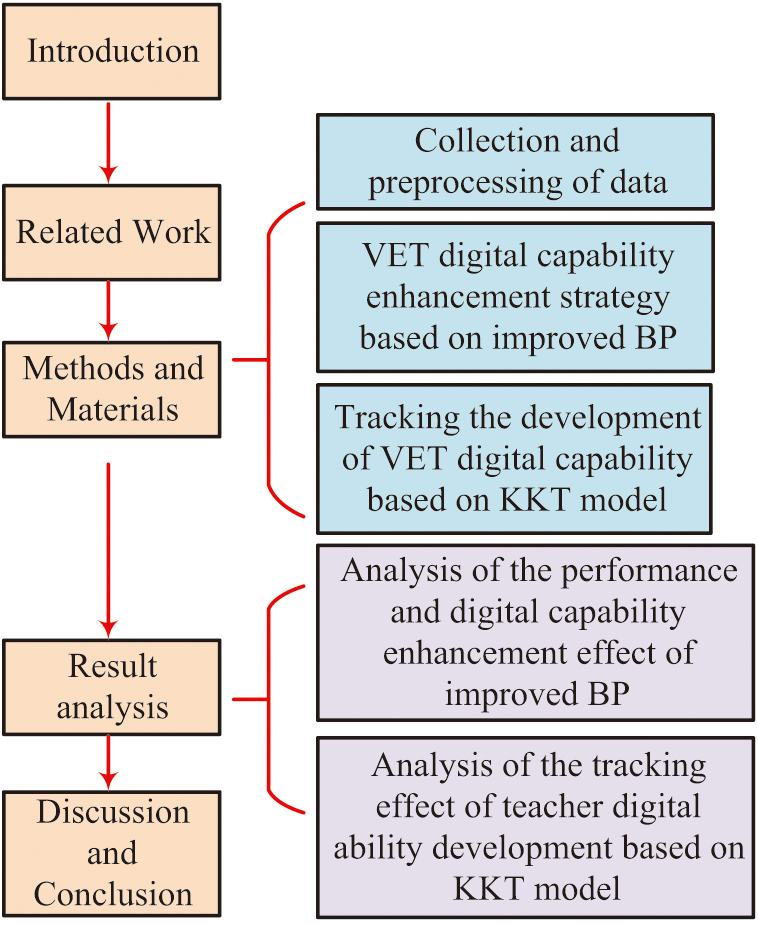
The organizational structure of the remaining part of the study is as follows. Section II presents a literature review. Section III presents the data collection and preprocessing process. Section IV verifies the performance of the improved BP model and the KKT model. Section V discusses the significance and limitations of the research results, summarizes the main findings and contributions of the study, and proposes future research directions.
II.RELATED WORK
Currently, scholars have conducted research on improving teachers’ teaching abilities. Sailer M et al. proposed an adaptive feedback model built on artificial neural networks (ANNs) from the perspective of teacher trainees to improve the teaching ability of teachers. This model provided automated adaptive feedback through an ANN to help teacher trainees improve their level of complex skills in simulated environments. Adaptive feedback could significantly improve the quality of justification provided by teacher trainees in written assignments, but it had no impact on diagnostic accuracy. In addition, static feedback has even had a negative impact on the learning process in paired learning [7]. Zhang et al. put forward a soft hybrid knowledge distillation model to address the current status of knowledge distillation methods in deep neural networks (DNNs). This model was suitable for distinctive teacher and student network frameworks by generating representative features at input and output positions, rather than relying on instant layer features. This scheme was more efficient than existing advanced knowledge distillation methods and could narrow the performance gap while maintaining high performance, making the construction of DNNs more adaptable to undiscovered scenarios. This had significant implications for improving teachers’ digital capabilities [8]. Zhao proposed a BP model based on the current situation of online courses in English intelligent tutoring systems to enhance the teaching ability of English teachers. This model analyzed and processes data during the English learning process through a BP network to improve learning effectiveness and personalized teaching experience. This model could significantly improve the efficiency and effectiveness of English learning, providing new technological means for online education [9]. Yang et al. put forth an evaluation method grounded on a deep learning (DL) algorithm to handle the current situation of digital teaching ability assessment for international Chinese teachers. This method analyzed the behavior data and teaching effectiveness of international Chinese teachers in the teaching process, and it used DL models for ability assessment and feedback. This method could effectively evaluate teachers’ digital teaching abilities and provide targeted improvement suggestions for teachers [10].
Although the above research has achieved good results, these methods often lead to a lack of systematic evaluation and dynamic tracking of teachers’ digital ability development in the teaching process. This makes it difficult for teachers to adjust their teaching strategies promptly to better satisfy the requirements of digital teaching.
III.METHODS AND MATERIALS
A.COLLECTION AND PREPROCESSING OF DATA
In the study of VET digital capability enhancement strategies, data quality directly affects the precision of subsequent analysis and the effectiveness of the strategy. Therefore, this study first comprehensively collects data related to VET digital abilities and ensures the usability of the data through scientific preprocessing methods. The data collected in the study mainly cover dimensions such as basic information of VET, self-assessment of digital abilities, use of digital tools in teaching tasks, and students’ feedback on teachers’ teaching effectiveness [11,12]. The specific data collection method is shown in Fig. 2.
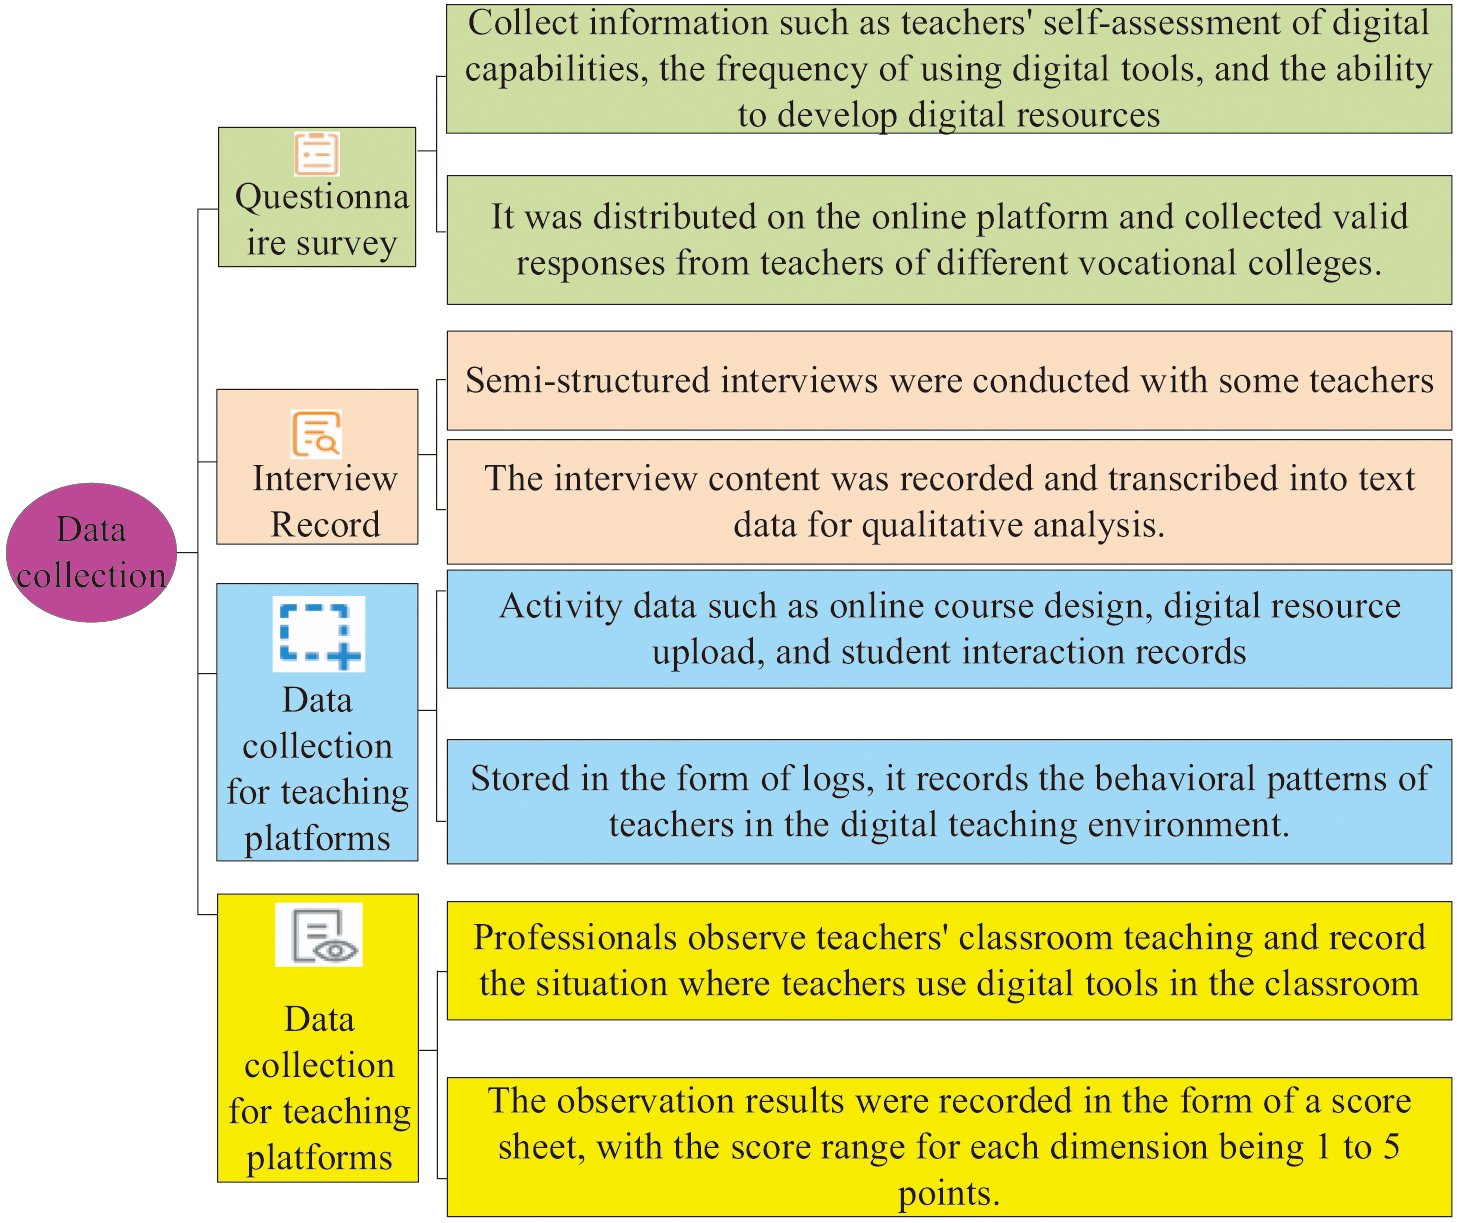 Fig. 2. Data collection method.
In Fig. 2, the data collection methods mainly include questionnaire surveys, interview records, data collection from teaching platforms, and classroom observations. Questionnaire surveys are mainly used to collect information on teachers’ self-assessment of digital abilities, frequency of use of digital tools, and digital resource development capabilities. They are mainly distributed through online platforms [13,14]. The interview records are mainly in a semi-structured form to gain a deeper understanding of the specific practical experience and challenges encountered by teachers in digital teaching. Data capture mainly includes online course design, student interaction records, etc., usually stored in the form of logs. Finally, professional personnel are arranged to observe classroom teaching and record the use of digital tools by teachers in the classroom. The results are recorded in the form of a scoring table [15,16].
In response to the problems of noise, missing values, and inconsistent formats in the collected raw data, this study preprocesses the raw data. In the data preprocessing stage, this study adopts the mean imputation method. Specifically, for each feature, the missing values are filled with the average value of that feature. During the filling process, the study strictly controls the amount of filled data to no more than 10% of the original data volume. In the questionnaire survey dataset, the proportion of missing values is approximately 5%, and the proportion of filled data volume is 5.26%. In the interview record dataset, the proportion of missing values is approximately 8%, and the proportion of filled data volume is 8.70%. In the data capture dataset of the teaching platform, the proportion of missing values is approximately 6%, and the proportion of filled data volume is 6.38%. In the classroom observation dataset, the proportion of missing values is approximately 7%, and the proportion of filled data is 7.50%. The basic process of preprocessing is shown in Fig. 3.
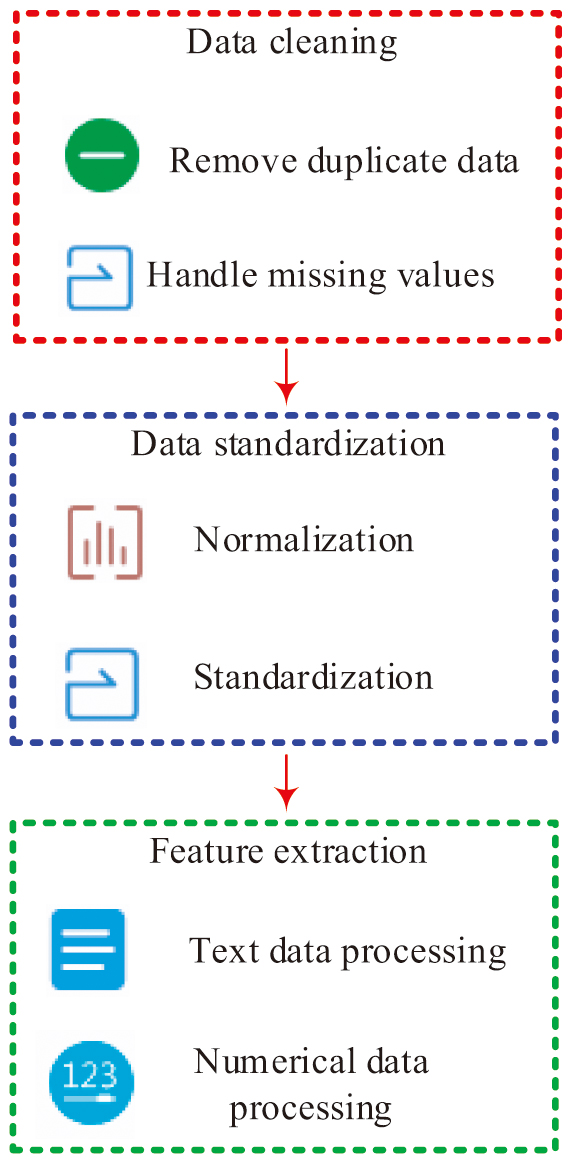 Fig. 3. The basic process of pretreatment.
In Fig. 3, first, during the data cleaning process, it is necessary to check duplicate records and delete them if they are duplicated. For missing data, an appropriate filling method is selected based on the nature of the data. In this study, the mean filling method is used, which means filling the missing values with the mean of the data in the same column. The relevant mathematical expression is shown in formula (1):
In formula (1), is the data point with non-missing values in the column, and is the amount of non-missing values. For outliers, this study uses a box plot method to detect and remove them. Outliers are defined as data points within a 1.5-fold quartile range, expressed as formula (2):
In formula (2), and are upper and lower bounds, respectively. and are the first quartile and third quartile, respectively. After data cleaning is completed, the data are converted to the [0,1] interval to make data from different dimensions comparable. The calculation is given by formula (3):
In formula (3), means the original data point. and correspond to the minimum and maximum of the data in that column, respectively. For certain special data, it is converted into a standard normal distribution with a mean of 0 and a standard deviation of 1 to complete standardization processing. Finally, in the feature extraction stage, this study introduces the term frequency-inverse document frequency (TF-IDF) method to extract the features of keywords, as given by formula (4):
In formula (4), means the word frequency (WF) of word in document , while the denotes the inverse document WF of . At the same time, for numerical data in questionnaire surveys and teaching platform data, this study directly adopts the standardized mean processing method and extracts key statistical features.
B.VET DIGITAL CAPABILITY ENHANCEMENT STRATEGY BASED ON IMPROVED BP
After completing data collection and preprocessing, this study proposes an effective enhancement strategy built on an improved BP to further improve the digital capabilities of VETs. BP is a multi-layer feedforward network consisting of the layer of input, hidden, and output, as shown in Fig. 4.
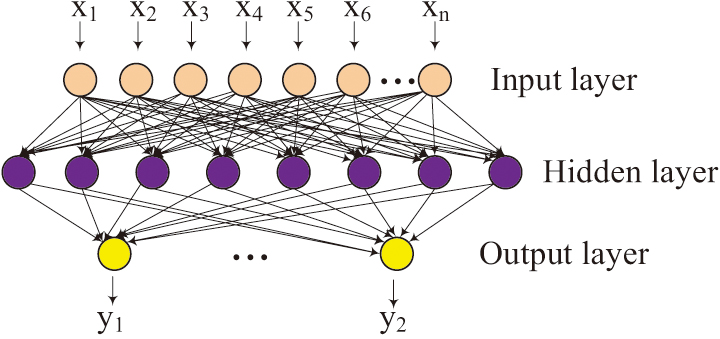 Fig. 4. Schematic diagram of BP structure.
In Fig. 4, the study selects the BP neural network structure of a single hidden layer mainly based on the following points. First, in the preliminary research, it is found that a single hidden layer is already capable of capturing complex patterns in the data while avoiding the risk of overfitting. Meanwhile, networks with a single hidden layer have higher computational efficiency during training and prediction, which is particularly important in educational environments with limited resources. In addition, networks with a single hidden layer are easier to explain and understand, which is particularly important for applications in education, as teachers and researchers may need to understand the decision-making process of the model. Although BP neural network can predict complex data relationships. However, there are problems such as easily dropping into local minima and slow convergence speed. Compared with the traditional BP neural network, the improved BP neural network has made innovations in many aspects. First, by introducing the GA to optimize the initial weights, the training efficiency and prediction accuracy of the network have been significantly improved. Second, the momentum factor is introduced to make the update of weights dependent on the current gradient and changes in previous weights, effectively reducing oscillations during the training process. Finally, an adaptive learning rate adjustment method is adopted to dynamically adjust the learning rate according to the error changes during the training process, further enhancing the convergence speed and stability of the model. First, regarding the initial weights, this paper introduces GA to enhance the initial weights of BP. The initial weights of the traditional BP neural network are randomly initialized, which is prone to causing local optimal solutions during the training process. By taking advantage of the global search capability of GA, local optimal solutions can be effectively avoided, and the training efficiency and prediction accuracy of the model can be improved. The process based on GA-BP is shown in Fig. 5.
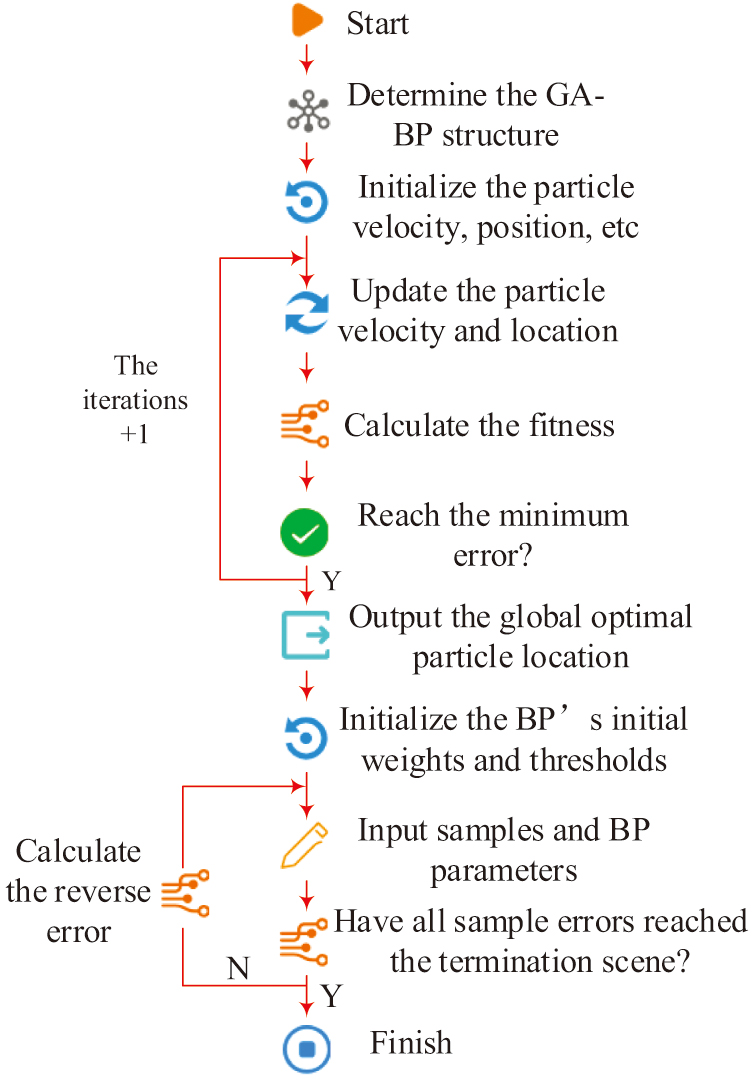 Fig. 5. Schematic diagram of the GA-BP process.
In Fig. 5, after optimizing the initial weights through GA, the training efficiency and prediction accuracy of BP are effectively improved. After optimizing the weights, this study further improves the momentum factor of BP. In traditional BP, simple gradient descent methods can easily lead to oscillations during the training process, especially when the error surface is complex. This study introduces momentum factor based on this so that the update of weights depends not only on the current gradient but also on the previous weight change [17,18]. The relevant expression is given by formula (5):
In formula (5), and are the weight change of current time and at the previous moment, respectively. is the learning rate. is the gradient of the error function with respect to the weight . By introducing a momentum factor, it is possible to add the previous weight change to the current weight update, allowing the network to continue moving in a certain direction and gradually accumulate momentum, thereby accelerating the network’s movement in that direction [19,20]. Finally, considering that traditional BP usually adopts a fixed learning rate, which makes the convergence speed too slow or unstable during the training process, an adaptive learning rate adjustment method is proposed. In accordance with the error changes when training, the learning rate is dynamically adjusted, which can effectively enhance the convergence speed and stability of the model. The relevant mathematical expressions are shown in formula (6):
In formula (6), and are the learning rates at times and , respectively, and is the error. The core idea of adaptive adjustment of learning rate is that if the error significantly decreases compared to the previous time , it means that the present learning rate is large, and the rate can be properly lowered to avoid overfitting. If the decreases slowly or does not decrease compared to the , it proves that the current rate is small, and the rate can be appropriately lifted to speed up the convergence speed.
C.TRACKING THE DEVELOPMENT OF VET DIGITAL CAPABILITY BASED ON KKT MODEL
After proposing the strategies for enhancing VET digital abilities based on improved BP, this study further introduces the KKT model to dynamically monitor the development trajectory of teachers’ digital abilities to track and evaluate the implementation effects of these strategies. The core of the KKT model lies in constructing a knowledge graph through keywords and their relationships, and it uses GNN to model and track the development of teachers’ digital abilities [21,22]. The relevant diagram of the KKT model is exhibited in Fig. 6.
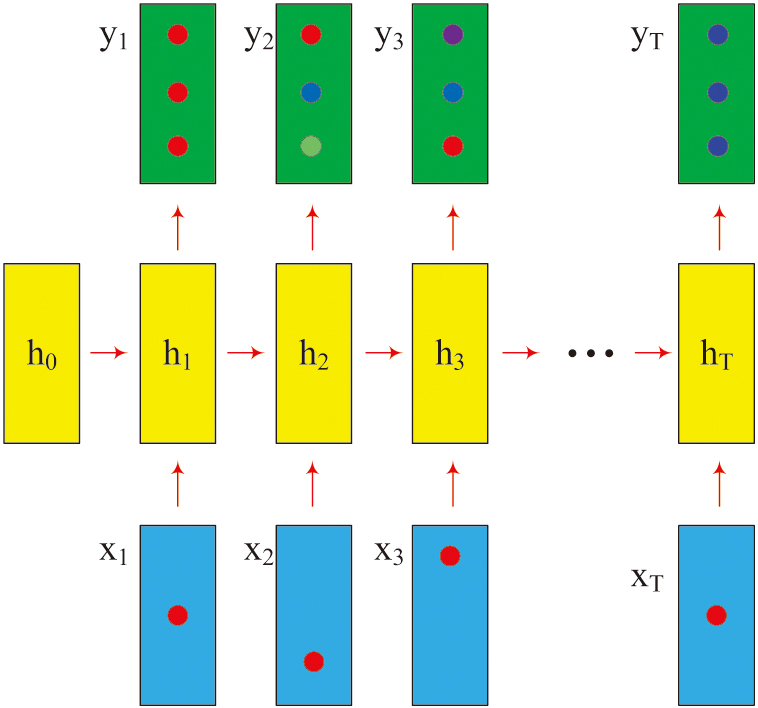 Fig. 6. Schematic diagram of the KKT model structure.
In the KKT model in Fig. 6, it mainly relies on the architecture of GNN for implementation. The KKT model builds a knowledge graph through keywords and their relationships and uses GNN to model and track the development of teachers’ digital capabilities. Compared with traditional knowledge tracking models, the KKT model can dynamically adapt to the development and changes of teachers’ digital capabilities and has higher tracking accuracy and stability. Specifically, the KKT model updates the node feature vectors by aggregating the information of neighboring nodes, which can more accurately capture the development trajectories of teachers in different digital ability dimensions. First, the construction of the graph includes information about nodes and edges. Second, the characteristics of each node are represented, including the frequency of keyword usage, importance rating, etc. The weight of edges is calculated by calculating the similarity between keywords, as shown in formula (7):
In formula (7), is the weight of the edge. Finally, the graph is trained to update the feature vectors of nodes by aggregating information from neighboring nodes [23], as shown in formula (8):
In formula (8), is the eigenvector, denotes the set of neighboring nodes, and means the degree of node . is the weight matrix of the -th layer, and is the nonlinear activation function. Finally, the specific process of the VET digital capability enhancement strategy is shown in Fig. 7.
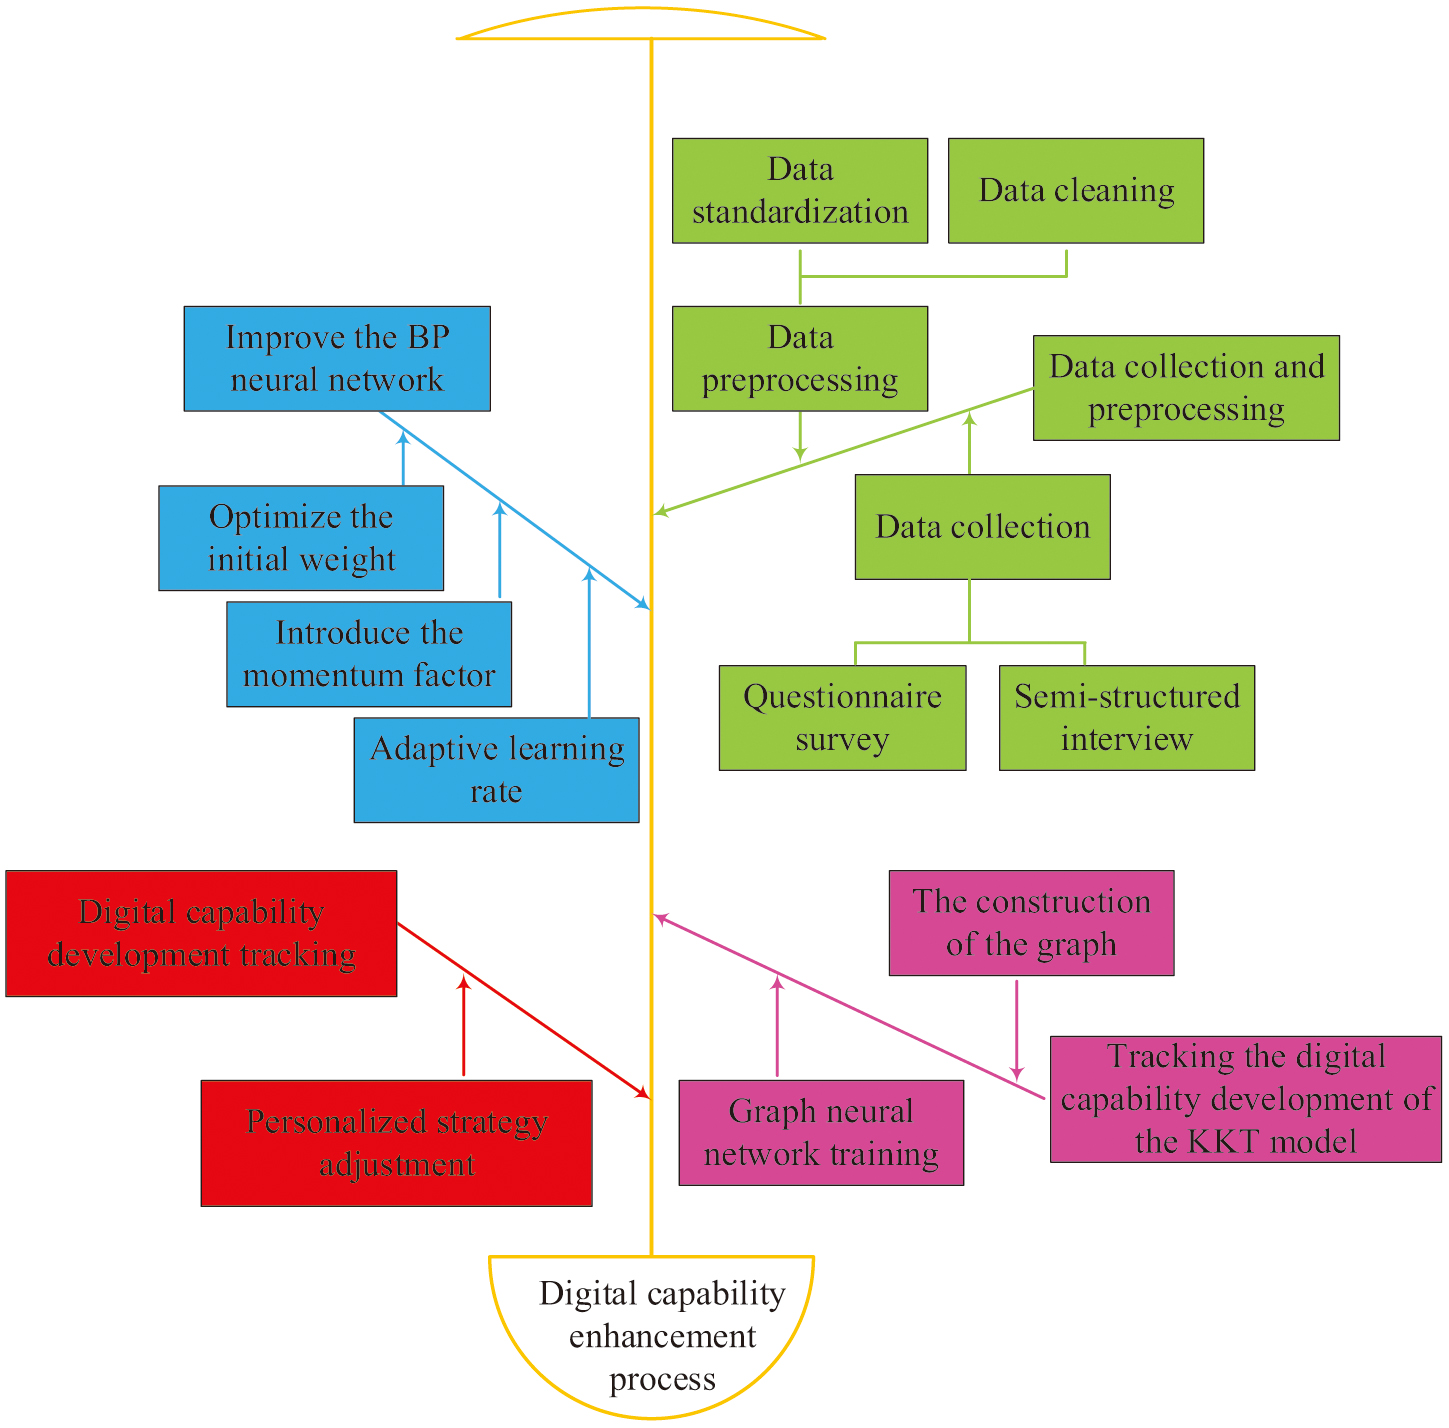 Fig. 7. The specific process of strategies for enhancing the digital capabilities of VETs.
In the VET digital capability enhancement strategy, the first step is the data collection and preprocessing process. The data collection process mainly involves methods such as questionnaire surveys and semi-structured interviews. Data preprocessing includes data cleaning, data standardization, and feature extraction processes. In the VET digital capability enhancement strategy of improved BP, BP is optimized by optimizing initialization weights, introducing momentum factors, and adaptive learning rates. In the VET digital ability development tracking of the KKT model, by constructing graphs and training GNN, analyzing the changes in node features and edge weights, the development of teachers in different dimensions of digital abilities can be dynamically tracked [24,25]. Meanwhile, based on the tracking results of the KKT model, personalized suggestions for improving teachers’ digital abilities have been provided, such as recommending relevant training courses or resources [26].
IV.RESULTS
A.ANALYSIS OF THE PERFORMANCE AND DIGITAL CAPABILITY ENHANCEMENT EFFECT OF IMPROVED BP
Based on the improved BP, an analysis is conducted on its performance and digital capability enhancement effect. Table I shows the experimental environment and BP parameter settings.
Table I. Experimental environment and BP parameter settings
| Component | Specification | Parameter | Value |
|---|---|---|---|
| Operating System | Windows 10 Professional | Network Structure | Input Layer (Feature-dependent), Hidden Layer (2 layers), Output Layer |
| Processor | Intel Core i7-10700K (8 cores, 16 threads, 3.80 GHz base frequency, 5.10 GHz max turbo frequency) | Input Nodes | 20 nodes based on input features |
| Memory | 32 GB DDR4 3200 MHz | Hidden Nodes | Layer 1: 50 nodes, Layer 2: 30 nodes |
| Graphics Card | NVIDIA GeForce RTX 3080 (8 GB GDDR6X) | Output Nodes | 1 node (for regression) or Number of Classes (for classification) |
| Storage | 1 TB NVMe SSD (System Drive) + 4 TB HDD (Data Storage) | Activation Function | Hidden Layers: ReLU, Output Layer: Sigmoid (for binary classification) or Softmax (for multi-class classification) |
| Programming Language | Python 3.8 | Learning Rate | Adaptive (initial value: 0.01) |
| Framework | TensorFlow 2.4.1 | Momentum Factor | 0.9 |
| Development Tool | PyCharm 2021.1 | Training Epochs | 500 epochs |
| / | / | Batch Size | 32 |
| / | / | Loss Function | Mean Squared Error (for regression) or Cross-Entropy Loss (for classification) |
Based on the experimental environment and improved BP in Table I, this study selects the Factors Affecting Digital Technology Access in Vocational Education (FADTAVE) dataset and The Digital Competence of Vocational Education Teachers (DCVET) dataset. Among them, FADTAVE mainly analyzes the current situation, challenges, and influencing factors of vocational school teachers in the use of digital technology. It includes four dimensions: motivation, material, skills, and usage. The predictor variables of the dataset are teachers’ attitudes and motivations toward digital technology. The response variables are the frequency and effectiveness of teachers’ use of digital technology in teaching. At the same time, data are collected through online questionnaires. The survey lasts for three months and covers 1,355 VETs. The sample size is 1,355, covering teachers of different genders, teaching experiences, and residential areas. DCVET is mainly used to evaluate the digital ability level of VET and identify ability gaps. The predictor variable of this dataset is teachers’ access to the Internet and digital devices. The response variable is the teacher’s ability in the use of digital tools, the development of digital resources, the design of digital teaching, etc. Data are collected through focus group discussions, with a total of 10 discussions held, each lasting for 1.5 hours. The sample size is 100 teachers, who represent different teaching experiences and subject specialties. The data types include teachers’ feedback, suggestions, and experience sharing. The dataset is segmented into training and testing sets in 7:3. This study simultaneously selects support vector machines (SVMs), random forest (RF), and traditional BP as control experiments. Figure 8 shows the precision and recall curves based on the four networks.
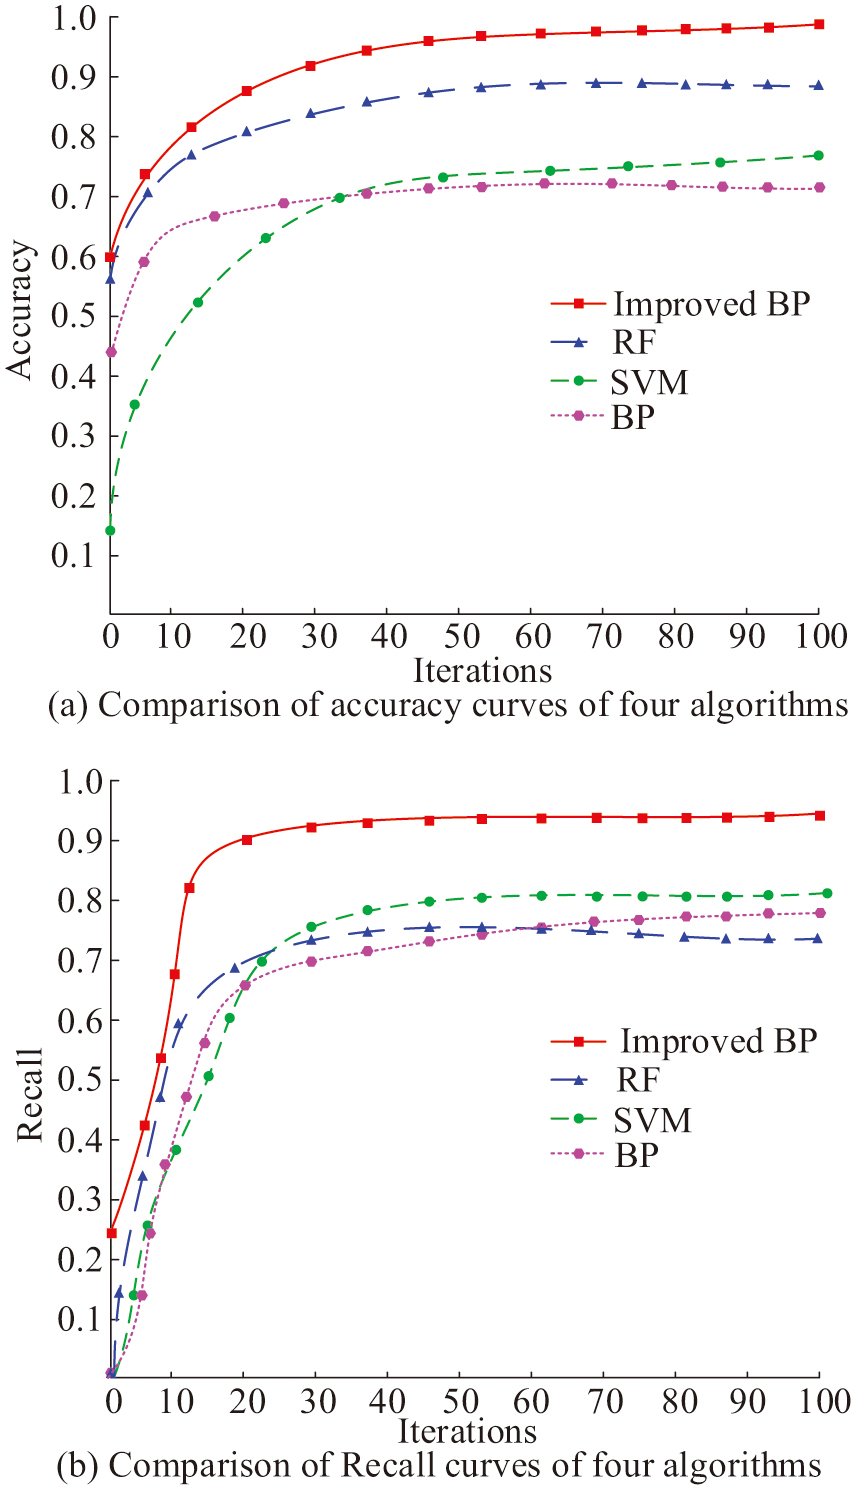 Fig. 8. Comparison of accuracy and recall rate curves.
As displayed in Fig. 8(a), the improved BP has the peak accuracy after convergence, with a value approaching 0.959. Based on this, the study can conduct a detailed analysis of each teacher’s digital capabilities, identifying their specific needs in the use of digital tools, the development of digital resources, and the design of digital teaching. Targeted training courses and practical guidance can be provided for teachers who perform poorly in the use of digital tools. The second highest accuracy is RF and SVM, with their accuracy converging to 0.832 and 0.703. The worst accuracy after convergence is traditional BP, whose accuracy tends to 0.656 after convergence. In the recall curve of Fig. 8(b), the recall rate of the improved BP is also higher than that of the other models after convergence, and its value tends to 0.931. Research can be based on this to optimize the allocation of educational resources. For teachers who already have a relatively high level of digital skills, more advanced training courses are provided, while for those with weaker digital skills, basic training and one-on-one tutoring are offered. The second highest recall rates are SVM and traditional BP, with values tending toward 0.794 and 0.772. The worst recall rate is RF, with a value tending toward 0.698. This study compares the improvement effects of four models on teachers’ digital abilities, as shown in Fig. 9.
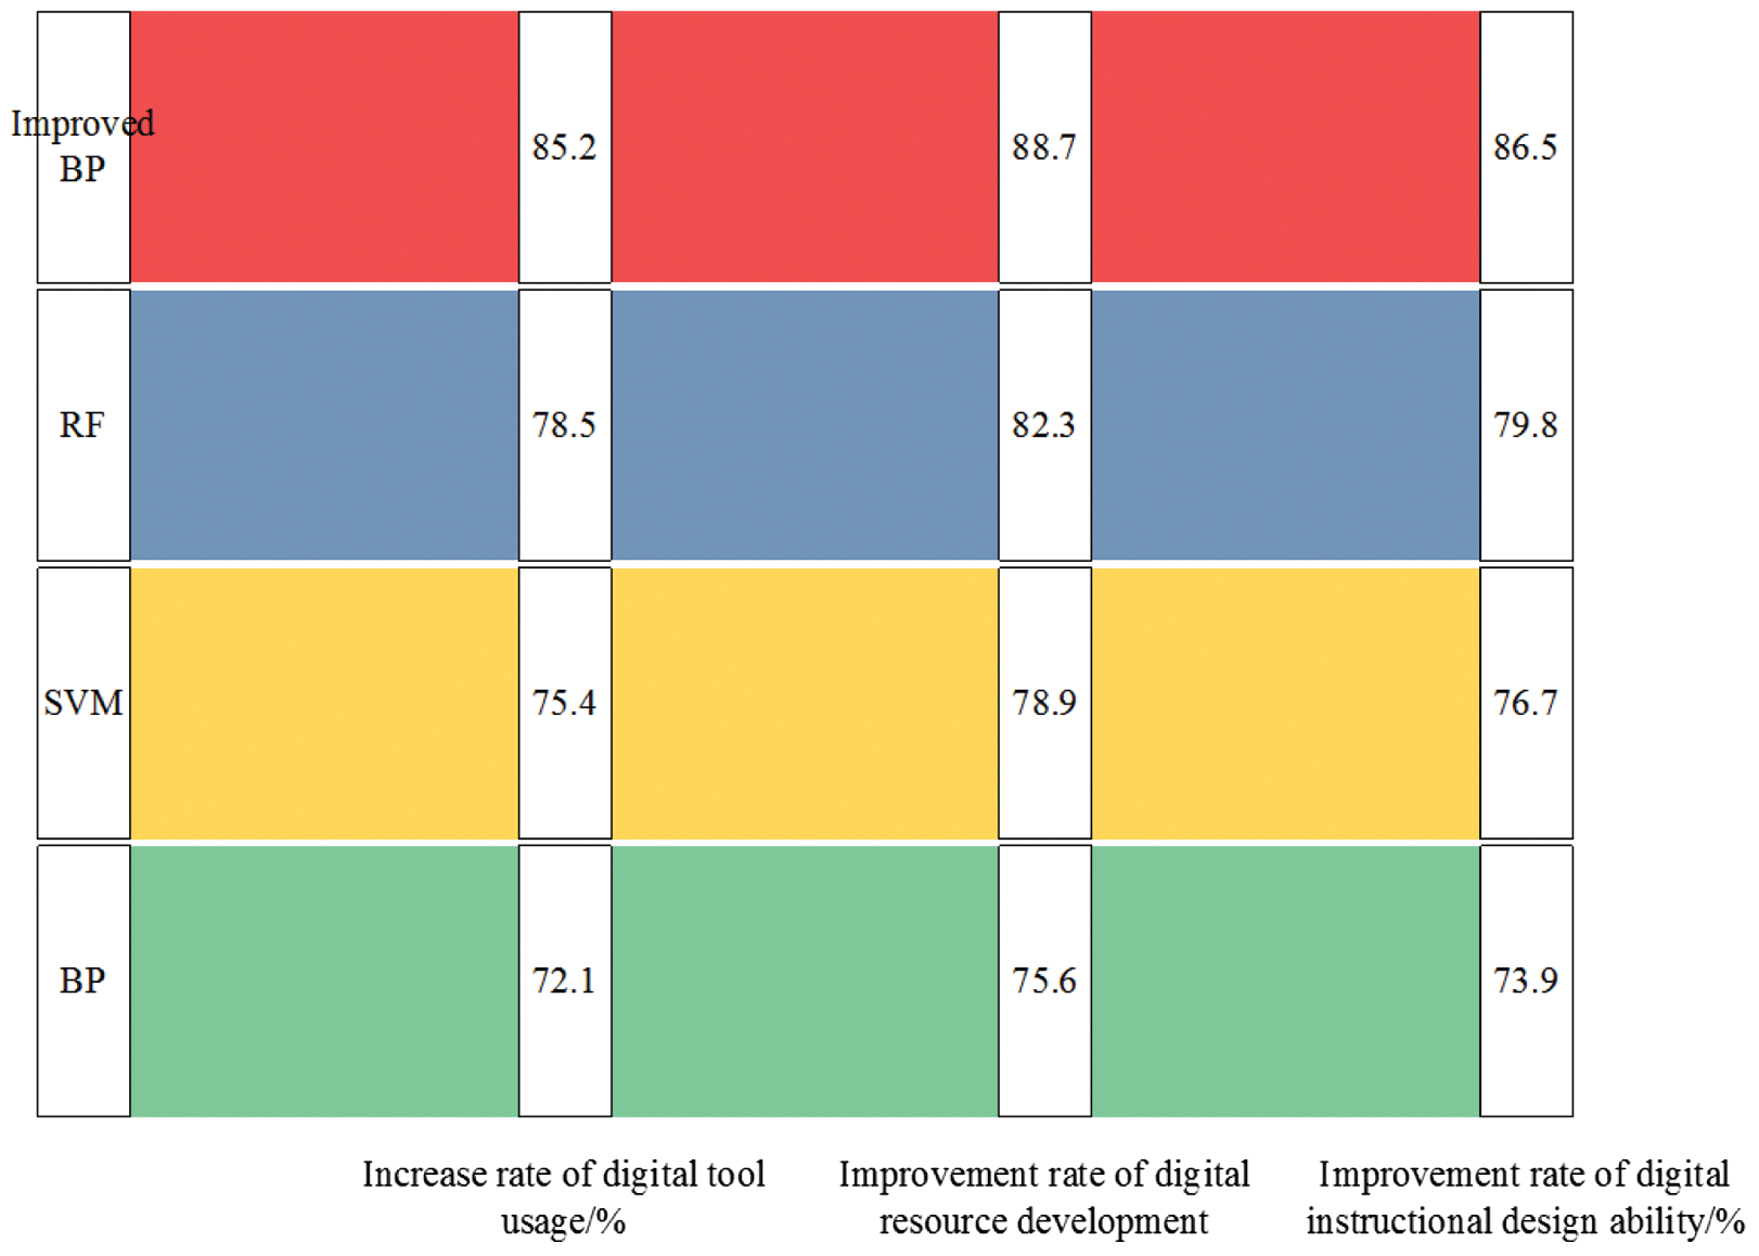 Fig. 9. The improvement effects of the four models on teachers’ digital capabilities.
Figure 9 shows that in terms of the improvement rate of digital tool usage, the improved BP is 85.2%, which performs the best, indicating that it can significantly enhance teachers’ ability to use digital tools and has a higher improvement rate than other models. Specifically, this improvement rate reflects a significant enhancement in teachers’ ability to use digital tools after undergoing model-guided training. For instance, teachers’ capabilities in using digital tools for teaching preparation, classroom interaction, and student assessment have been significantly enhanced. The performance of RF and SVM is good, with values of 78.5% and 75.4%, both lower than the improved BP. Traditional BP performs the worst, with an improvement rate of only 72.1%. In terms of the improvement rate of digital resource development capability, the improved BP is also the best, with a value of 88.7%, indicating that it has a significant effect on enhancing teachers’ ability to develop digital resources, with a higher improvement rate than other models. The worst improvement rate is traditional BP, with a value of 75.6%. In terms of the improvement rate of digital teaching design ability, the improved BP has an improvement rate of 86.5%, which is obviously superior to the other comparative models. Overall, the improved BP performs the best in all three indicators, significantly enhancing teachers’ abilities in using digital tools, developing digital resources, and designing digital teaching. To obtain a more comprehensive benchmark test, the study first introduces Adult Dataset (https://archive.ics.uci.edu/dataset/2/adult) and Student Performance Dataset (https://www.kaggle.com/datasets). Among them, the Adult Dataset contains 14 features, including age, job category, educational level, marital status, occupation, race, gender, etc. The Student Performance Dataset contains performance data of students in mathematics and Portuguese courses, including students’ socioeconomic background, school-related characteristics, family characteristics, personal characteristics, etc. The study simultaneously introduces ADAM, RMSProp, Transformer, and recurrent neural network (RNN) models for control experiments. The comparison results of performance indicators are shown in Table II.
Table II. Comparison of performance indicators
| Model/Optimizer | Dataset | Accuracy (%) | Recall (%) | F1-score (%) | Training time/s | Test time/s |
|---|---|---|---|---|---|---|
| Improved BP | Adult | 95.8 | 93.2 | 94.5 | 120.3 | 0.5 |
| ADAM | Adult | 94.6 | 92.1 | 93.3 | 110.3 | 0.6 |
| RMSProp | Adult | 93.5 | 91.3 | 92.2 | 115.2 | 0.7 |
| Transformer | Adult | 88.3 | 87.3 | 86.3 | 182.3 | 1.2 |
| RNN | Adult | 84.6 | 85.7 | 87.8 | 130.1 | 0.8 |
| Improved BP | Student | 88.5 | 86.7 | 87.6 | 115.8 | 0.4 |
| ADAM | Student | 87.2 | 85.5 | 86.3 | 104.2 | 0.5 |
| RMSProp | Student | 86.3 | 84.2 | 85.2 | 111.3 | 0.6 |
| Transformer | Student | 80.8 | 81.6 | 82.1 | 172.3 | 1.1 |
| RNN | Student | 82.3 | 81.5 | 80.9 | 125.6 | 0.7 |
In Table II, on the Adult dataset, the accuracy rate of the improved BP is as high as 95.8%, the recall rate reaches 93.2%, and the F1-score is 94.5%. All performance indicators are superior to those of other models. For instance, ADAM’s accuracy rate is 94.6%, its recall rate is 92.1%, and its F1-score is 93.3%. The accuracy rate of RMSProp is 93.5%, the recall rate is 91.3%, and the F1-score is 92.2%. Although the training time of the improved BP is slightly longer (120.3 seconds), its test time is only 0.5 seconds, which is comparable to that of ADAM, and the performance improvement is significant. On the Student dataset, the improved BP also performs well, with an accuracy rate of 88.5%, a recall rate of 86.7%, and an F1-score of 87.6%. All performance indicators are higher than those of other models. The accuracy rate of ADAM is 87.2%, the recall rate is 85.5%, and the F1-score is 86.3%. The accuracy rate of RMSProp is 86.3%, the recall rate is 84.2%, and the F1-score is 85.2%. The training time of the improved BP is 115.8 seconds, slightly longer than that of ADAM, but the test time is only 0.4 seconds, which is the shortest among all models. The results show that the improved BP not only has a significant advantage in prediction accuracy but also performs well in test efficiency.
B.ANALYSIS OF THE TRACKING EFFECT OF TEACHER DIGITAL ABILITY DEVELOPMENT BASED ON KKT MODEL
After evaluating the performance of the improved BP, this study further analyzes the KKT model’s performance and the model’s tracking effect on the development of teachers’ digital abilities. This study introduces linear regression (LR), autoregressive integrated moving average (ARIMA), and RNN for comparative experiments. Figure 10 compares the accuracy and recall curves based on four models.
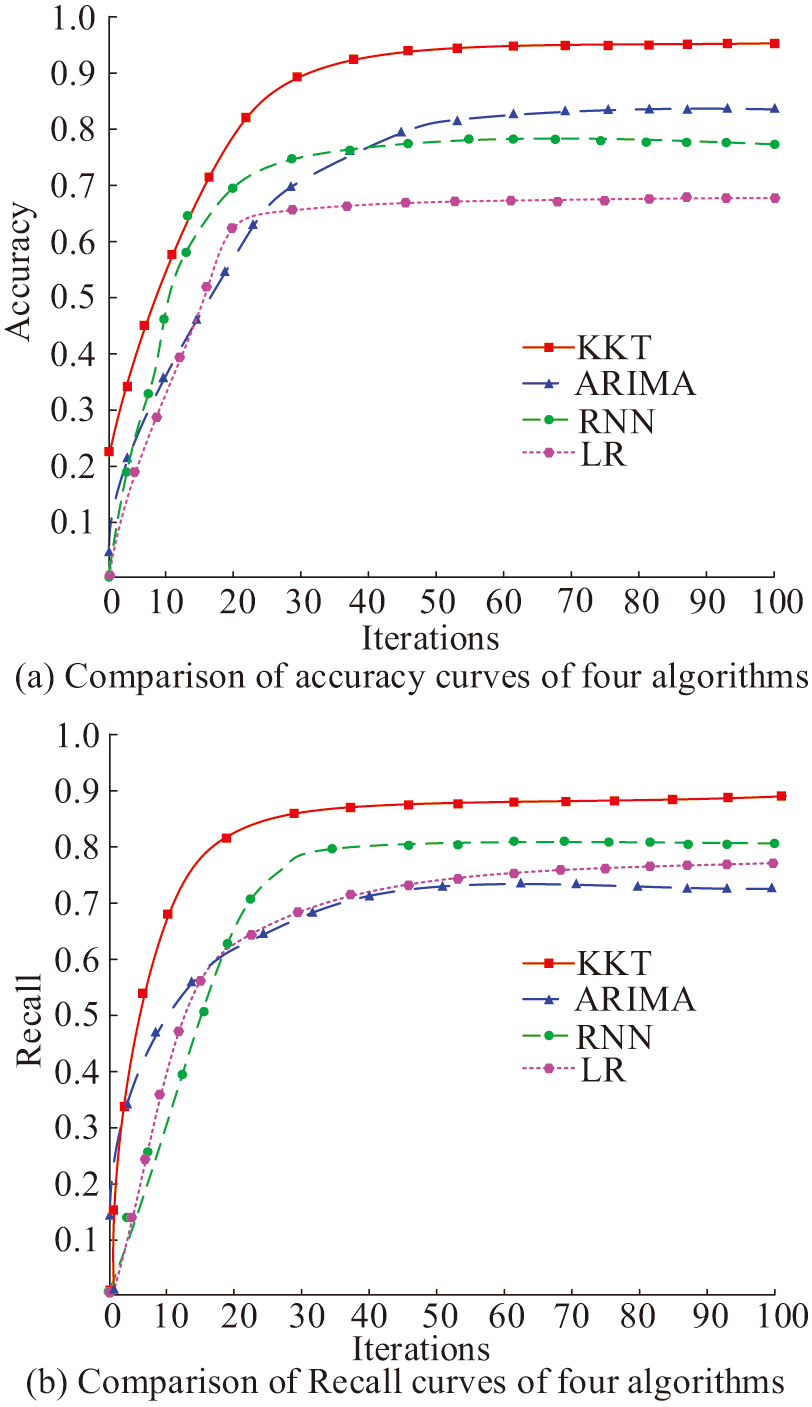 Fig. 10. Comparative results of accuracy and recall rate curves.
In the accuracy comparison of Fig. 10(a), the KKT model is obviously superior to the other three models after convergence, and the value tends to 0.936. The second highest accuracy is ARIMA and RNN, with values tending toward 0.802 and 0.783. The LR model has the worst accuracy after convergence, with a value approaching 0.658. In the comparison of recall rates in Fig. 10(b), the KKT model owns the peak recall rate after convergence, with a value tending toward 0.889. The second highest recall rates are RNN and LR, with values tending toward 0.784 and 0.736. The worst recall rate after convergence is ARIMA, whose value tends toward 0.688. This study further compares the tracking accuracy of four models, as shown in Fig. 11.
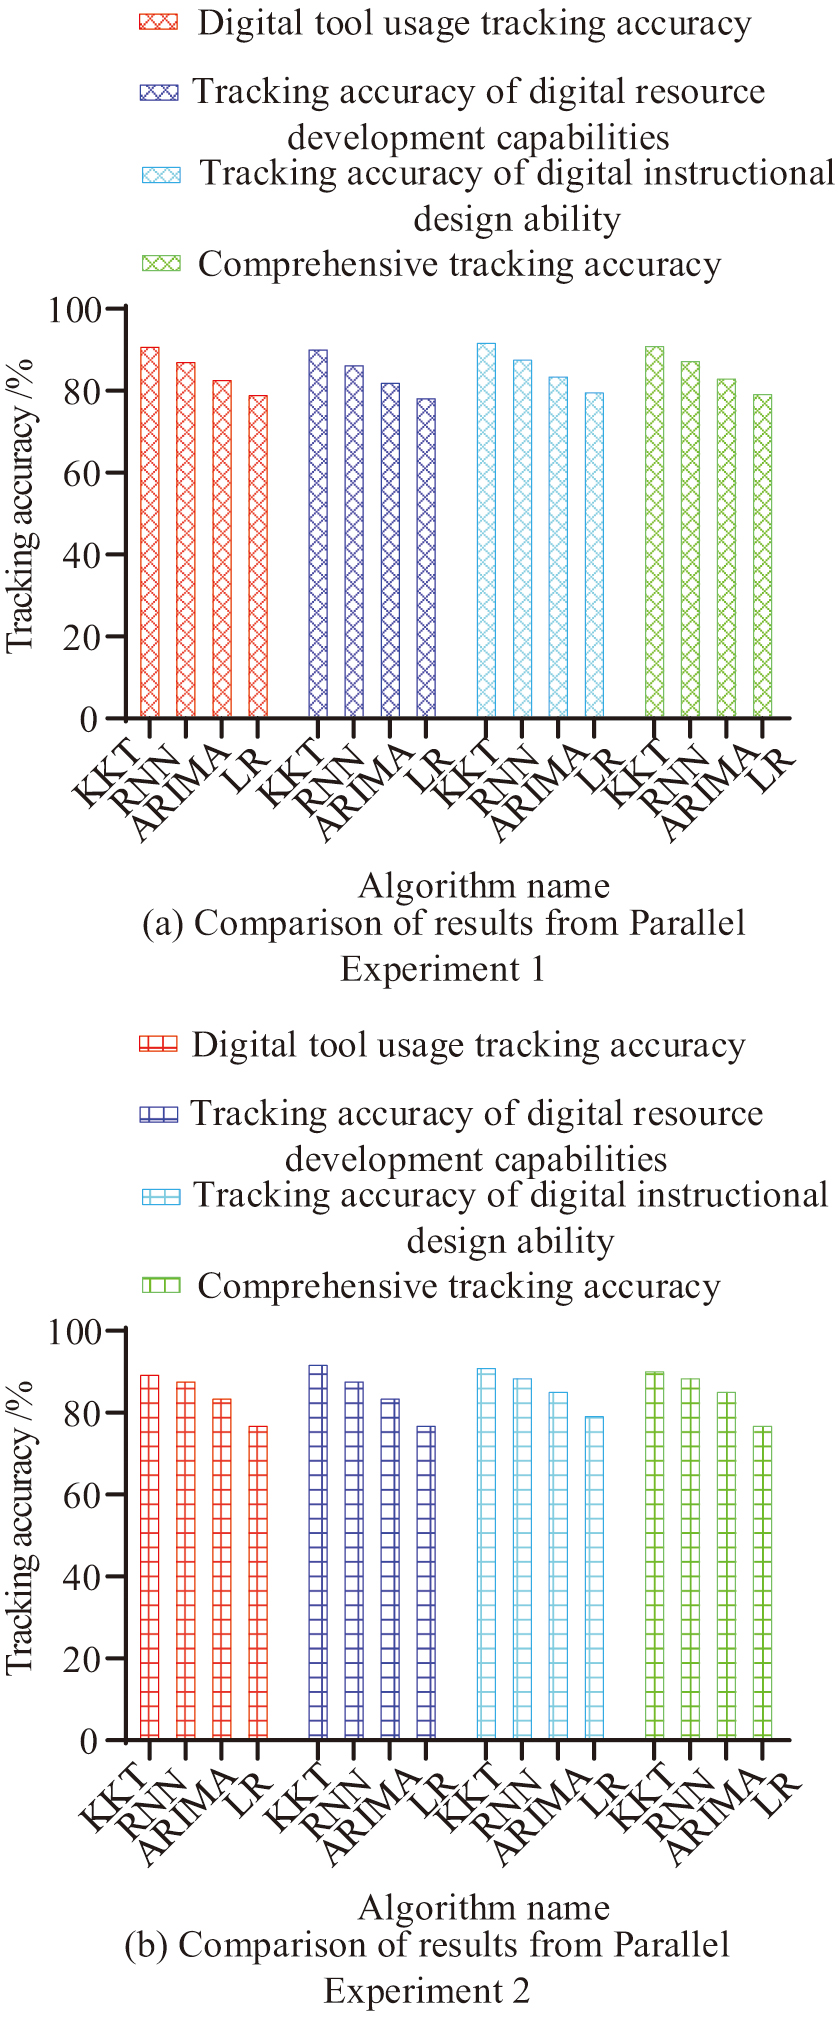 Fig. 11. Comparative graph of tracking accuracy among the four models.
Figure 11(a) and (b) shows the comparison of tracking accuracy between four models in parallel experiments 1 and 2. In terms of tracking accuracy using digital tools, the KKT model has tracking accuracies of 91.4% and 91.6%, with a stable tracking accuracy of over 91%, demonstrating its advantages in capturing complex relationships and dynamic changes. The digital tool of the LR model has the worst tracking accuracy, with values of 79.5% and 79.2%, indicating its low tracking accuracy and small fluctuations, demonstrating its limitations in handling complex relationships and dynamic changes. In terms of tracking accuracy of digital resource development capabilities, KKT is significantly higher than other models, with values of 90.6% and 91.1%, indicating its strong ability in dynamic tracking. In terms of tracking the accuracy of digital teaching design ability, KKT is also superior to other models, with values of 92.3% and 92.5%, indicating its significant advantage in capturing changes in teachers’ digital teaching design ability. Finally, in terms of comprehensive tracking accuracy, KKT’s values are also superior to other models, with values of 91.6% and 92.1%, indicating its comprehensive advantage in multi-dimensional tracking. Finally, this study compares the dynamic adaptability of four models, as shown in Table III.
Table III. A comparison of the dynamic adaptability of the four models
| Number of experiments | Model type | Dynamic adaptability score (1–10) | The stability of tracking ability over time /% |
|---|---|---|---|
| Parallel Experiment 1 | KKT | 9.2 | 94.3 |
| RNN | 8.1 | 88.7 | |
| ARIMA | 6.4 | 82.3 | |
| LR | 5.7 | 78.9 | |
| Parallel Experiment 2 | KKT | 9.6 | 96.6 |
| RNN | 8.0 | 85.6 | |
| ARIMA | 5.9 | 81.2 | |
| LR | 5.1 | 79.6 |
According to Table III, the dynamic adaptability score of KKT performs well in both parallel experiments, with scores ranging from 9.2 to 9.6, indicating its strong ability to dynamically adjust tracking strategies. The RNN scores are 8.1 and 8.0, showing good performance in dynamic adaptability, but slightly lower than KKT. The score slightly decreases in the second experiment, which may be related to the problem of gradient vanishing or exploding. ARIMA has scores of 6.4 and 5.9 and performs moderately in terms of dynamic adaptability, but lower than KKT and RNN. The score slightly decreases in the second experiment, which may be related to the limited ability of the model to handle nonlinear relationships. Finally, the LR model has the lowest scores of 5.7 and 5.1, indicating poor performance in dynamic adaptability. The scores for both experiments are lower than other models. The stability of KKT’s tracking ability over time is 94.3% and 96.6%, showing excellent performance. The stability of both experiments exceeds 94%, demonstrating their high stability during long-term tracking. The stability of RNN is 88.7% and 85.6%, showing good performance, but slightly lower than KKT. The stability of ARIMA is 82.3% and 81.2%, with moderate performance. The stability of the two experiments is relatively close, but lower than that of KKT and RNN. The stability of LR is the worst, at 78.9% and 79.6%, and the stability of both experiments is lower than other models. Overall, KKT’s dynamic adaptability score ranges from 9.2 to 9.6, and its tracking stability exceeds 94%, demonstrating its significant advantages in dynamically adjusting tracking strategies and long-term tracking processes.
V.DISCUSSION AND CONCLUSION
To propose an effective strategy for enhancing VET digital abilities and evaluate its implementation effectiveness, this study collected data related to teachers’ digital abilities and preprocessed it. The tracking effect was analyzed through an improved BP optimization strategy and KKT model. Among the important numerical results, the improved BP showed excellent performance in enhancing digital capability, with accuracy and recall rates reaching 0.959 and 0.931, significantly higher than other models. These results were consistent with the results of Wang et al. [27]. They put forward a machine learning-based algorithm to deal with the current situation of the teaching service support system in open universities. The research model utilized BP to improve the effectiveness of online learning by optimizing the system architecture, including virtual teaching modules, resource management, and user authentication. Similar to the BP studied, this network also introduced momentum factors to improve BP. The accuracy of this model reached 83.4%, which was superior to traditional methods such as SVM and RF.
The KKT model also performed well in tracking the development of teachers’ digital abilities, with dynamic adaptability scores ranging from 9.2 to 9.6 and tracking ability stability exceeding 94%. There was a certain difference between this result and the research results of Huang et al. [28], who proposed a dual GNN for improving teacher abilities. The research model mainly consisted of interactive GNN modules and attribute GNNs. The adaptability of this model was weaker than that of the improved RNN, possibly due to its improved ability to resist gradient vanishing and exploding, making it more stable during training. Meanwhile, in dynamic teaching scenarios, this model could more accurately adjust teaching strategies to improve teachers’ digital abilities. This indicated that the improved BP and KKT models could effectively enhance teachers’ digital abilities and dynamically track their development trajectory, providing strong support for the improvement of VET’s digital abilities.
Although this study has achieved significant results in improving VET digital capabilities, there are still certain shortcomings. First, the dataset used in the study mainly comes from vocational education institutions in specific regions and may not fully represent other regions or different types of educational institutions. Second, although KKT performs well in dynamic tracking, its high computational complexity and hardware resource requirements may limit its widespread adoption in practical applications. Future research can further expand the scope of the dataset to improve the generalizability of research results. Additionally, more efficient calculation methods or optimization algorithms can be explored to reduce the computational cost of KKT and make it easier to apply in practical teaching environments. At the same time, combining more diversified evaluation indicators and longer-term tracking research will further deepen the understanding of the development of teachers’ digital abilities.