I.INTRODUCTION
The use of contemporary information technology in the sphere of education is growing in popularity as education becomes more and more informatized. Classroom as the core place of teaching activities, its management and optimization has been an important topic of educational research. Traditional classroom management often relies on teachers’ subjective observation, making it difficult to realize real-time and comprehensive monitoring of students’ behavior [1,2]. Target detection (TD) technology based on computer vision has advanced significantly in several areas in recent years due to the ongoing development of deep learning (DL) technology, offering fresh approaches to this issue. The student classroom behavior detection (BD) system can monitor students’ classroom performance in real time and help teachers understand students’ concentration, classroom discipline, and potential safety hazards in a timely manner so that they can take appropriate measures to intervene [3,4]. Since it can effectively detect targets in real time, the you only look once (YOLO) family of models is frequently utilized in a variety of visual tasks [5]. YOLOv8, as the latest version of this series, combines more advanced network structure and algorithm optimization with stronger detection accuracy (DA) and speed [6]. However, despite its excellent performance in TD, YOLOv8 still faces some challenges when dealing with complex classroom environments, such as the under-detection problem of small TD and the difficulty of feature extraction (FE) due to target occlusion [7–9]. To overcome these problems, the study enhances the YOLOv8 model by adding the Shape intersection over union (IoU) loss function (LF) and the bidirectional attention refinement (BAR) attention machine mechanism, which improves the capacity to recognize student behavior in the classroom. The model’s focus on important features can be strengthened by the BAR attention mechanism, which can also increase FE accuracy and efficiency. To increase DA and recall, form IoU further optimizes the bounding box’s (BOB) degree of matching by taking into account the BOB’s scale and form. With these improvements, the study expects to build a more efficient and accurate student classroom BD system that can identify and classify multiple behavioral states of students in real time and accurately in a complex classroom environment.
The rest of this study is organized as follows. Section II reviews the relevant literature on YOLO series applications and DL-based classroom behavior recognition. Section III describes the improvements to the YOLOv8 model, which include the BAR attention mechanism, the efficient multi-scale convolution (EMC) module, and the Shape IoU LF. The experimental setup, results, ablation studies, and comparative analysis are presented in Section IV. Finally, Section V concludes the paper and discusses potential future work.
II.RELATED WORK
A.APPLICATIONS OF YOLO SERIES IN TD
YOLOv8, as an advanced DL TD algorithm with wide applicability and high efficiency, provides powerful technical support for various industries. Zhou Q et al. proposed the RCT-YOLOv8 tuna catch detection model for the needs of vessel fishing and catch detection in the pelagic fishery. The network was compressed by the pruning method, and the model accuracy was improved by 9.8% [10]. Based on the YOLOv8 method, Talaat F M et al. developed an intelligent fire detection system that used real-time data processing using fog computing and cloud computing to speed up response times and DL to increase fire DA and speed. The findings revealed that the system’s accuracy and recall were 97.1%, making it appropriate for monitoring forest fires and managing fire safety in public spaces [11]. To address the challenges of detecting railroad turnout defects, Yu et al. improved the YOLOv8 model’s FE and small TD capabilities. They achieved this by enhancing the C2f module and introducing the C2f-VSS, SPDConv, OKM, and SOUP structures. They also improved the DA by using the Inner-CIoU LF. Experimental results indicated that the model exhibited high accuracy, robustness, and good generalization ability (GA) [12]. To automate the detection of real-time faults in printed circuit boards, Khan R U et al. evaluated the applicability of the YOLOv8 architecture to improve fault DA in the printed circuit board manufacturing process. The outcomes revealed that the YOLOv8 model performed well in identifying and classifying printed circuit board faults [13]. The YOLOv8 and Mediapipe frameworks were merged by Boudlal H et al. to use Wi-Fi channel state information for pose estimation and device-less human behavior identification. The system accurately recognized human skeletal structure and posture to overcome the limitations of traditional methods. Indoor experiments revealed that the system exhibited high accuracy, reliability, and robustness [14].
B.DL FOR CLASSROOM BEHAVIOR RECOGNITION
As DL algorithms such as convolutional neural networks have made breakthroughs in several fields, their application in the field of classroom behavior recognition has become a hotspot in computer vision research. Tang G identified students’ learning behavior patterns in a flipped classroom environment through recurrent neural network sequence modeling. Multimodal learning techniques and clustering techniques were employed to gain a comprehensive understanding of student behaviors and predict future learning behaviors. Real data evaluation revealed that the framework could effectively improve the personalized learning experience and support different student needs [15]. Cao Y Q et al. assessed how well the MobileNet architecture and SSD algorithm worked together to monitor student behavior in a dynamic classroom setting. The findings demonstrated that the combined SSD model functioned faster and more accurately than the conventional method, and it was able to evaluate student behavior more quickly and accurately [16]. Xie N et al. proposed a system based on multidimensional feature fusion and multimodal analysis techniques to detect student classroom engagement using online classroom camera images. The system used a deep convolutional neural network model to extract facial expression, head pose, and eye-mouth behavior features, and it fused the features through a BP neural network to output the engagement level. Experiments demonstrated that this method was effective in monitoring student engagement in real time, reducing labor and time costs [17]. To improve students’ language skills, Orosoo M et al. combined federated 3D-CNN and LSTM techniques to predict human emotions from multiple perspectives. By utilizing local and global weight variations, federated learning with 3D-CNN allowed multiple clients to implement it simultaneously. The results indicated that this method outperforms existing methods and can provide comprehensive feedback for teaching strategies [18]. For remote online exams, Potluri T et al. proposed an AI-based automated proctoring system that assessed examinee behavior through real-time video and used CNN live networks and SolvePnp equations to improve recognition accuracy. Experiments showed that the system was highly accurate, reliable, and robust for real-time environments [19].
In summary, previous studies have demonstrated the effectiveness of the YOLO model in various detection tasks and the potential of DL technology in educational scenarios. However, most existing methods for detecting classroom behavior either focus on coarse-grained actions or rely on complex, multimodel systems that may lack real-time performance. Additionally, directly applying standard object detectors, such as YOLOv8, in complex classroom environments is challenging and under-explored. To address these limitations, the researchers introduced the BAR attention mechanism, which filters key-free value pairs at both the coarse- and fine-grained levels. This reduces the YOLOv8 model’s computational load and enhances DA. Then, using the Shape IoU method, the shape and scale of the BOB are adjusted to improve the positioning accuracy of small behavioral targets. This achieves efficient, precise, real-time monitoring of student behavior.
III.STUDY OF STUDENT BD IN THE CLASSROOM BASED ON YOLOv8
The study uses YOLOv8 as a base model and improves it by introducing multi-scale convolution, adding an attention mechanism, and improving the IOU LF for classroom student BD.
A.IMPROVEMENTS BASED ON THE BAR ATTENTION MECHANISM
In a target-intensive and complex classroom environment, image FE faces difficulties such as target occlusion and invalid information interference. To solve these problems, the study introduces the BAR attention mechanism module based on the original YOLOv8 model architecture. The BAR attention mechanism can accurately filter out irrelevant information and guide the model to focus its attention resources on key feature information, thus significantly enhancing the model’s FE performance in complex scenes [20,21]. The specific structure of the BAR module is shown in Fig. 1. To cut down on computation, the majority of unnecessary key–value pairs (KVP) are first filtered out at the coarse-grained area level. Then, among the filtered KVP, fine-grained features are further extracted to ensure that the model can capture more detailed information. Finally, the attention weights are dynamically adjusted according to the query (Q) content to improve the adaptability and flexibility of the model.
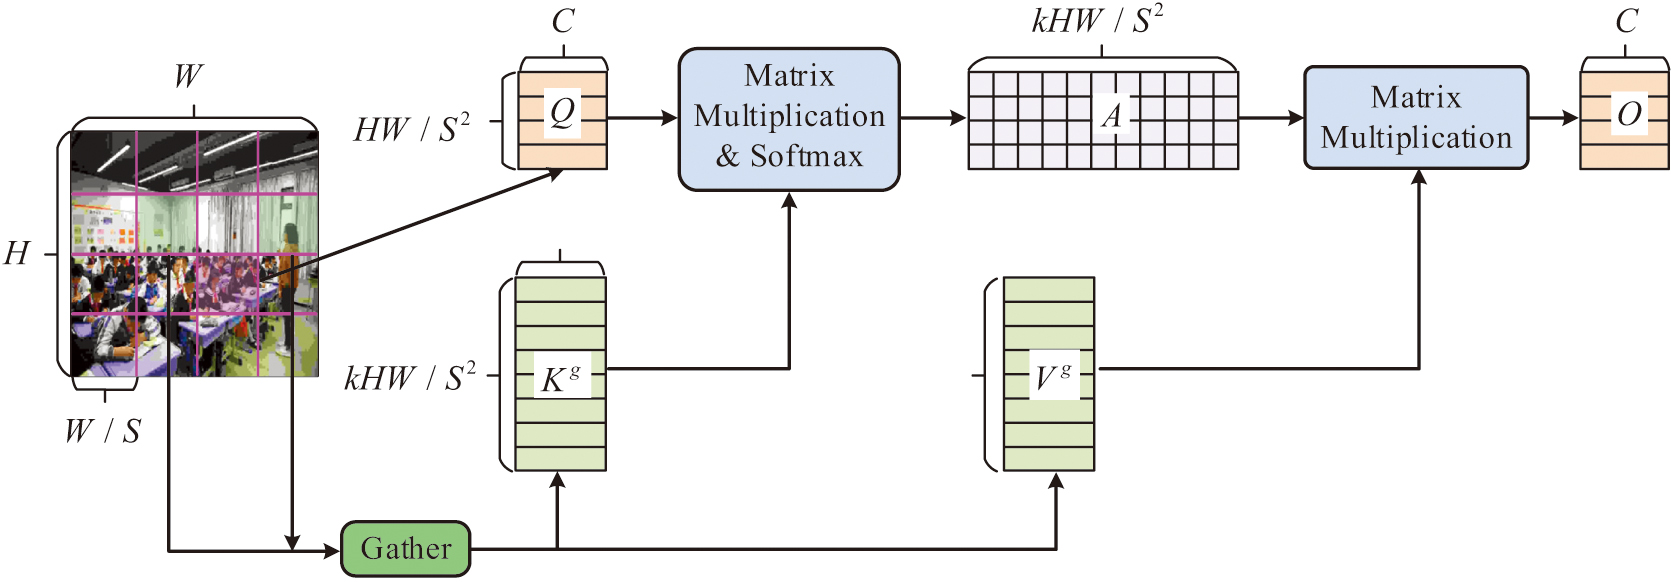 Fig. 1. Specific structure of the BAR module.
In Fig. 1, the input feature graph is divided into several non-overlapping regions (OLRs) using the technique, which keeps only a few pertinent regions after filtering away the majority of the irrelevant KVP at the region level. By building region-level directed graphs and conserving the Top-k most pertinent regions for every area, sparsification is accomplished. Each Q’s attention weight is calculated using a limited number of pertinent KVP and fine-grained token-to-token attention inside the maintained relevant regions. It is assumed that the dimension of the input feature map (FM) is . Among them, and represent the height and width of the FM, respectively, and represents the number of channels. The FM is divided into non-OLRs. Each region contains feature vectors. The FM is converted into a region-level tensor with dimension . Among them, represents the number of regions. Then, the , key , value tensor are obtained by linear projection of each region as displayed in Equation (1):
In Equation (1), , , and are the projection weights of Q, key, and value, respectively. To determine the relationship between different keys and their importance, the study constructs an adjacency matrix. First, the matrices and are regionally averaged to obtain and . Among them, . Then, the constructed region-to-region affinity diagram is obtained by calculating and as illustrated in Equation (2):
In Equation (2), denotes the semantic association between regions. Equation (3) illustrates how the affinity network is pruned to preserve the Top-k connections of each region in an attempt to get the routing index matrix:
The key and value tensor for each region are gathered in accordance with , as displayed in Equation (4):
In Equation (4), specific elements are extracted from the input tensor by the function. specifies that the index is applied along the first dimension of the input tensor. These elements may be from different regions or channels, resulting in a new tensor containing the desired information. By multiplying the attention weights with the values, weighted values are obtained. Equation (5) illustrates how these weighted values are then added together to produce the final output FM :
In Equation (5), is a local context enhancement term, which is usually implemented using depth-separable convolution. The BAR module identifies key information channels by constructing hierarchical channel attention vectors that accurately capture the interrelationships between different channels. Meanwhile, the module efficiently integrates information between FMs of different scales, focusing not only on the internal of individual FMs but also on the interrelationships between FMs, to enhance the model’s understanding of global information. The BAR module concentrates on significant FMs and ignores irrelevant ones by dynamically modifying the FM weights [22]. The resulting multi-scale FM integrates the original information with additional key information. For small-scale, fine-grained classroom behaviors like writing and reading with the head down, it can detect and localize more precisely.
The network structure of the YOLOv8 model makes extensive use of convolutional modules (e.g., standard convolutional layers (ConLs), depth-separable convolution, multi-scale convolution, etc.). While these modules are effective in extracting image features, they also mean that more weight parameters need to be stored and updated. This not only increases the storage requirements of the model but also may lead to memory bottlenecks during training and inference. The EMC module allows for efficient convolution operations and multi-scale feature fusion. To improve FE and model lightweighting, the study incorporates the EMC module into YOLOv8’s backbone section. Fig. 2 depicts the EMC module’s schematic structure.
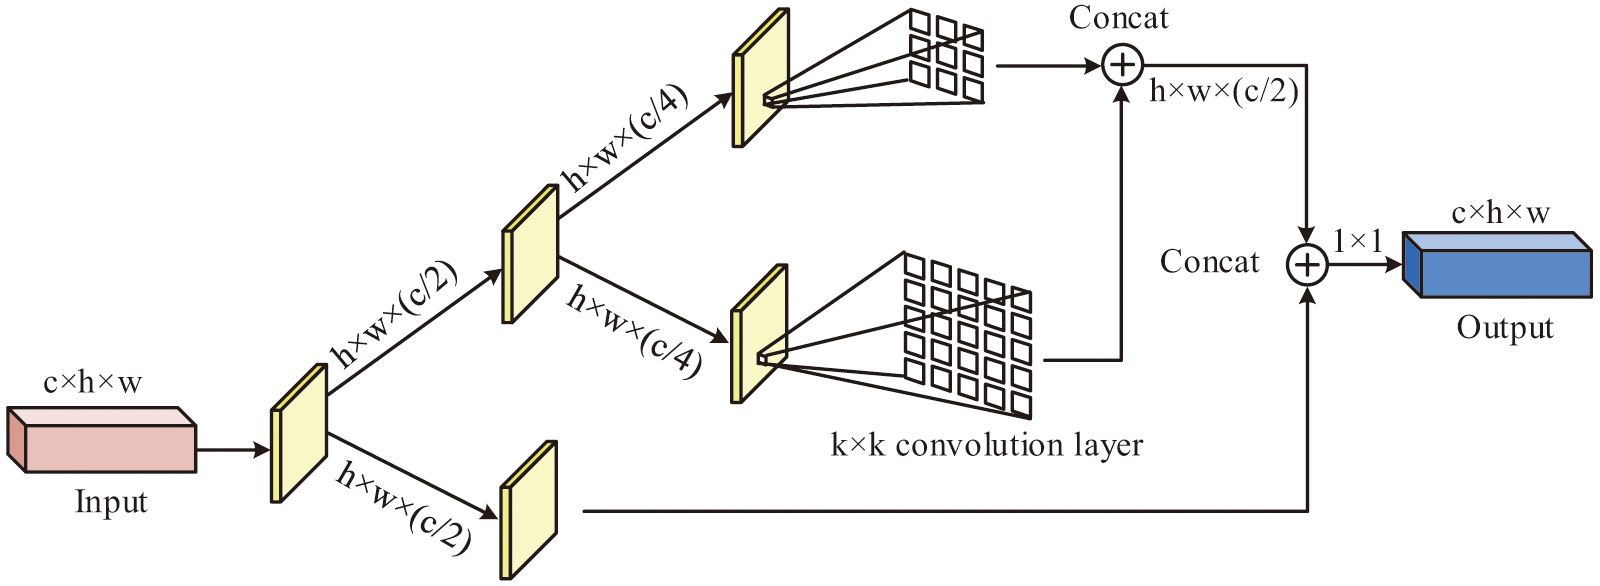
In Fig. 2, by processing FMs of various scales in parallel, the EMC module improves FE performance while lowering the amount of computation and parameters. The input FM of size is first passed through two parallel 1 × 1 ConLs to output two FMs with channel number . These two FMs are then passed through two parallel ConLs, respectively, to generate a multi-scale FM of size . The two FMs are then spliced together by a splicing operation. Subsequently, these two multi-scale FMs are merged into one FM of size by a splicing operation, and the residual joins are realized by element-by-element summation with the original input FMs. Finally, the number of channels is adjusted back to by a 1 × 1 ConL to generate an output FM of dimension .
The study presents a parallel convolutional kernel that may concurrently achieve multi-scale FE in a single forward propagation phase, thereby expanding the receptive field of the YOLOv8 model and extracting multi-scale features. For example, in recognizing the behavior of students raising their hands, the small-scale convolutional kernel extracts subtle movement features such as finger bending. The large-scale convolutional kernel determines the overall position and posture of the arm. When the two are combined, the model is better able to detect the hand-raising activity, which enhances DA. Meanwhile, the parallel convolutional kernel allows for simultaneous FE at different scales, which greatly reduces computation time compared to serial processing. In the scenario of real-time monitoring of classroom behavior, it is possible to quickly analyze and identify each frame of the image. Its ability to provide timely feedback on the behavioral state of students provides teachers with an immediate basis for teaching adjustments.
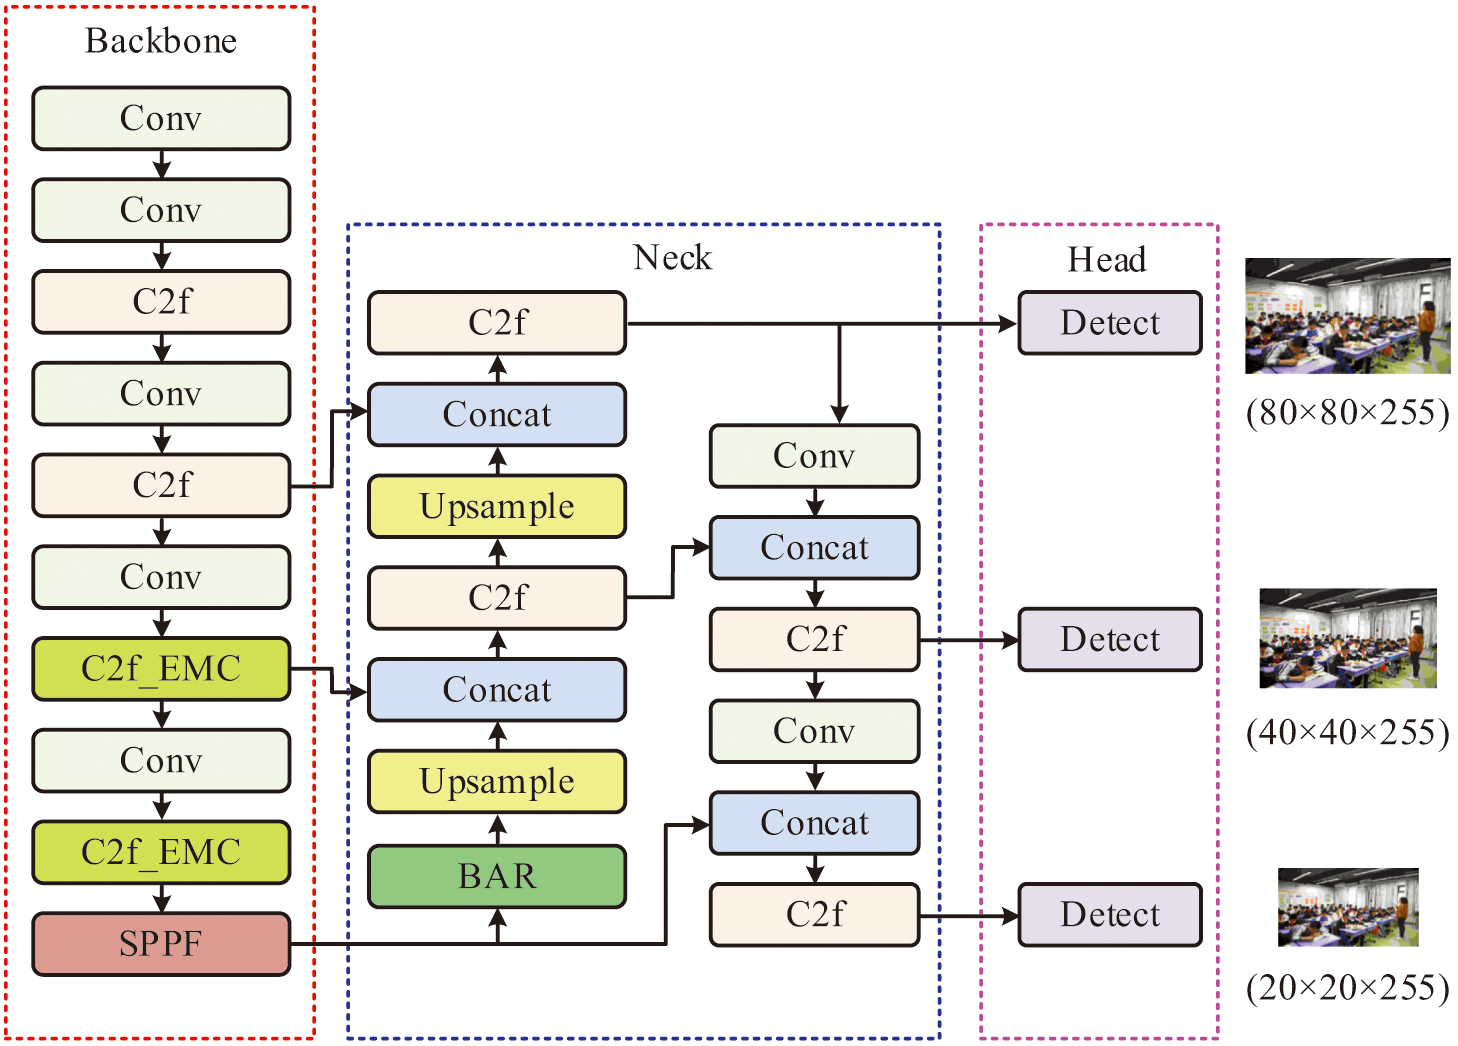
The study substitutes C2f-EMC modules for the final two C2f modules in the model backbone network in an attempt to increase the model’s adaptability in various scales of TD. This structural modification allows the model to enhance the DA of small objects while preserving computational efficiency, in addition to better capturing the image’s subtle details. Fig. 3 demonstrates the improved YOLOv8 model structure.
B.STUDENT BD IN THE CLASSROOM BASED ON SHAPE IoU
Although the study improves the DA of the YOLOv8 model for classroom behavior by introducing the BAR attention mechanism and the EMC module, the detection effect of the YOLOv8 model still needs to be further improved when dealing with complex environments. To maximize the prediction accuracy of the target location, the IoU loss LF is typically utilized in the YOLOv8 model application to assess the degree of overlap between the predicted and actual BOB. However, this LF ignores the geometric properties of the BOB, such as the aspect ratio and the distance from the central point, and only takes into account the overlap area between the predicted frame (PF) and real frame (RF). This can impact the model’s localization accuracy for small targets by preventing it from adequately accounting for the shape and positional variations of the BOB throughout the optimization phase and by failing to give enough gradient information when working with small targets. As shown in Fig. 4, the study uses the Shape IoU LF to solve this issue. This LF not only considers the geometric relationship of the BOB but also pays special attention to the shape and proportion of the BOB itself.
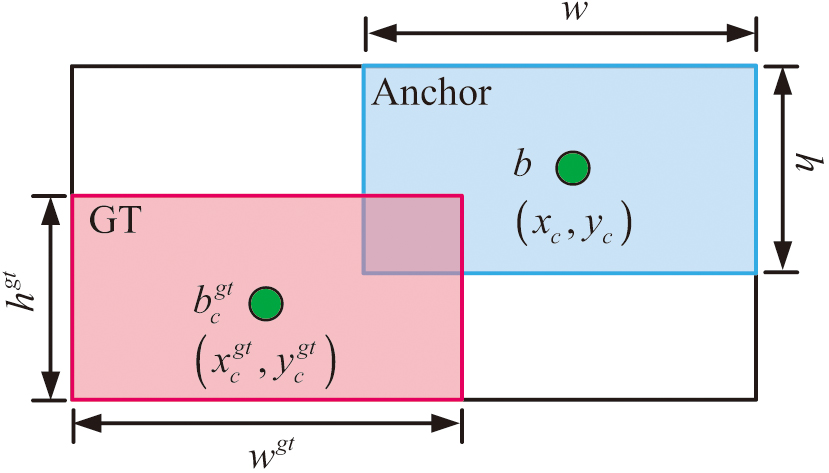 Fig. 4. Schematic diagram of Shape IoU.
In Fig. 4, and are the center points (CPs) of the ground truth (GT) frame and the anchor frame, respectively. , , , and display the width and height of the GT frame and the anchor frame, respectively. The regression LF can be expressed by Equation (6):
In Equation (6), and are the PF and RF, respectively. The weight coefficients of width and height are used to penalize the difference in aspect ratio between the PF and RF, which is calculated as displayed in Equation (7):
In Equation (7), denotes the effect of true BOB width on matching accuracy. denotes the effect of true BOB height on matching accuracy. and are scale factors related to the size of the target object. The distance cost and shape loss term are calculated as shown in Equation (8):
In Equation (8), and are the horizontal and vertical (HAV) coordinates of the CP of the GT box, respectively. and display the HAV coordinates of the CP of the anchor box. is a penalty term that measures the difference between the predicted BOB and the true BOB. is the Euclidean distance between the GT box and the anchor CP. The width and height shape difference between the anticipated and RFs is measured using the shape loss terms and in the HAV axes. The calculation method is shown in Equation (9):
In Equation (9), and are the maximum values of the GT frame or anchor width and height, respectively. The corresponding border regression loss is defined in Equation (10):
The Shape IoU LF has more versatility while handling a variety of targets and intricate sceneries. It can give the model better gradient information by taking scale and shape variations into account. It facilitates quicker model convergence during training and more consistently optimizes the BOB’s regression outcomes.
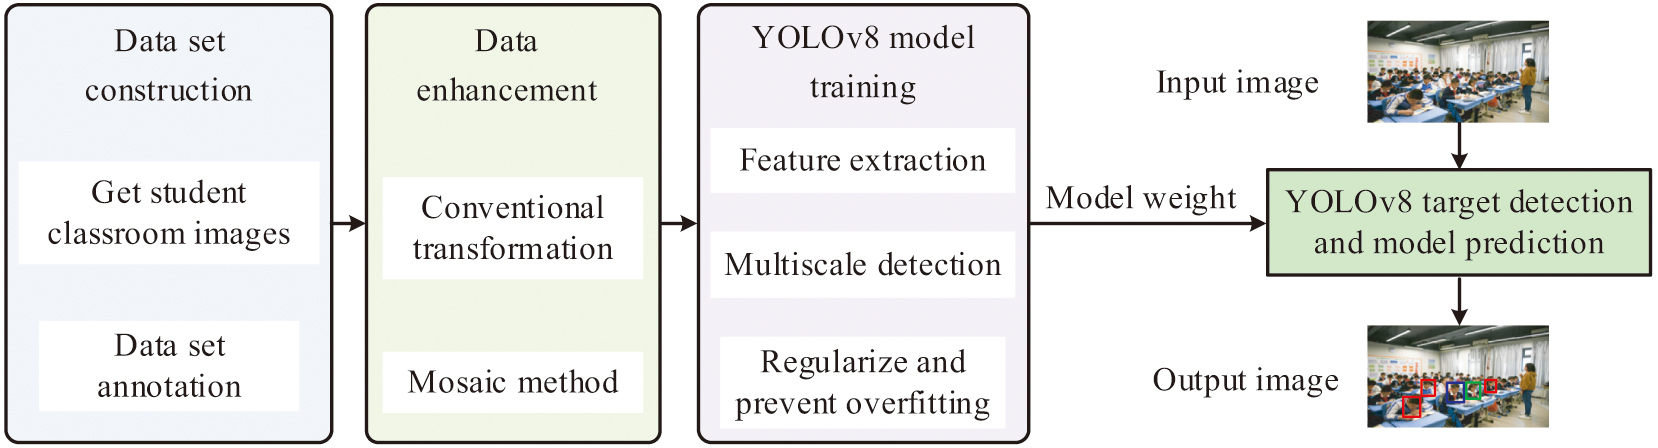
Fig. 5 depicts the student classroom BD flow based on the study’s enhanced YOLOv8 model. First, high-quality and high-resolution images of students’ classroom behaviors are collected and labeled, covering behaviors such as attentive listening and distraction, to provide reliable data support for model training. Next, data enhancement is performed through image conversion techniques and mosaic methods to improve the model’s GA and robustness. Then, the improved YOLOv8 model is trained using the preprocessed dataset.
IV.RESULTS
The study uses a range of metrics, such as precision, recall, average precision (AP), and mean average precision (mAP) metrics, to measure the accuracy of the model and the efficacy of TD in an attempt to thoroughly and impartially assess the performance of the suggested model when analyzing the experimental results.
A.VALIDATION OF THE VALIDITY OF IMPROVED YOLOv8 MODELS
The dataset used in the study is derived from real classroom monitoring scenarios, and the initial data is collected from Mapua University in the Philippines. A total of 35 video files are obtained, from which 4,306 high-quality and high-resolution classroom scene images are extracted. To address the limitations of the initial sample size and improve the model’s robustness and generalizability, the surveillance videos are expanded to include two additional campuses of Xi’an Siyuan University in China. This expansion includes 30 additional video clips covering small (30 students), medium (60 students), and large (over 100 students) classes, generating more than 5,800 additional valid images. The final dataset contains over 10,100 images. To enhance the robustness and GA of the model and reduce the risk of overfitting within a limited dataset size, extensive data augmentation strategies are implemented during the training period in the study. This includes mosaic enhancement and random affine transformations, such as rotation, translation, scaling, and cropping. It also includes adjustments to the HSV color space, including hue, saturation, and value. Additionally, it includes the addition of random noise, which effectively simulates a wider range of lighting conditions, viewpoints, and object scales.
The study defines and annotates five typical types of student behaviors: staring ahead (A), writing with the head down (B), reading (C), using electronic devices (D), and lying on a desk (E). The dataset annotation is carried out using the LabelMe annotation tool, with the annotation standard referring to the 17 human key point models in the COCO2017 dataset. The student targets and corresponding behavior categories in each image are precisely annotated to ensure that the annotation results are consistent with the actual behavior states of the students. Meanwhile, to verify the reliability of the annotations, three professionals with experience in computer vision and educational scene annotation are invited to randomly select 1,000 images (200 for each type of behavior) for independent secondary annotation. Cohen’s Kappa coefficient is used to evaluate the consistency of the annotations, and the final Kappa value is 0.87. It is proved that the annotation results are stable and reliable.
All the baseline models involved in the comparison are retrained on the aforementioned self-made classroom dataset. This includes the classic YOLO family models and the improved algorithms proposed in [23–25]. During the retraining process, all models adopt the same experimental environment configuration and hyperparameter settings, as shown in Table I. This consistent training setup ensures uniform data distribution and optimization conditions for all comparison models, eliminating performance biases caused by differences in training datasets or parameter configurations.
Table I. Experimental environment configuration and parameter settings
| Experimental environment | Hyperparameter | ||
|---|---|---|---|
| Memory capacity | 64 GB | Img size | 640 |
| CPU | Intel Xeon Processor@2.60Ghz | Epoch | 200 |
| GPU | NVIDIA RTX6000 24GB | Batch size | 32 |
| Solid-state drive capacity | 1TB | Momentum | 0.937 |
| Operating kernel | x86_64 GNU/Linux | Learning rate | 0.01 |
| Operating system | Ubuntu 20.04 LTS | Optimizer | SGD |
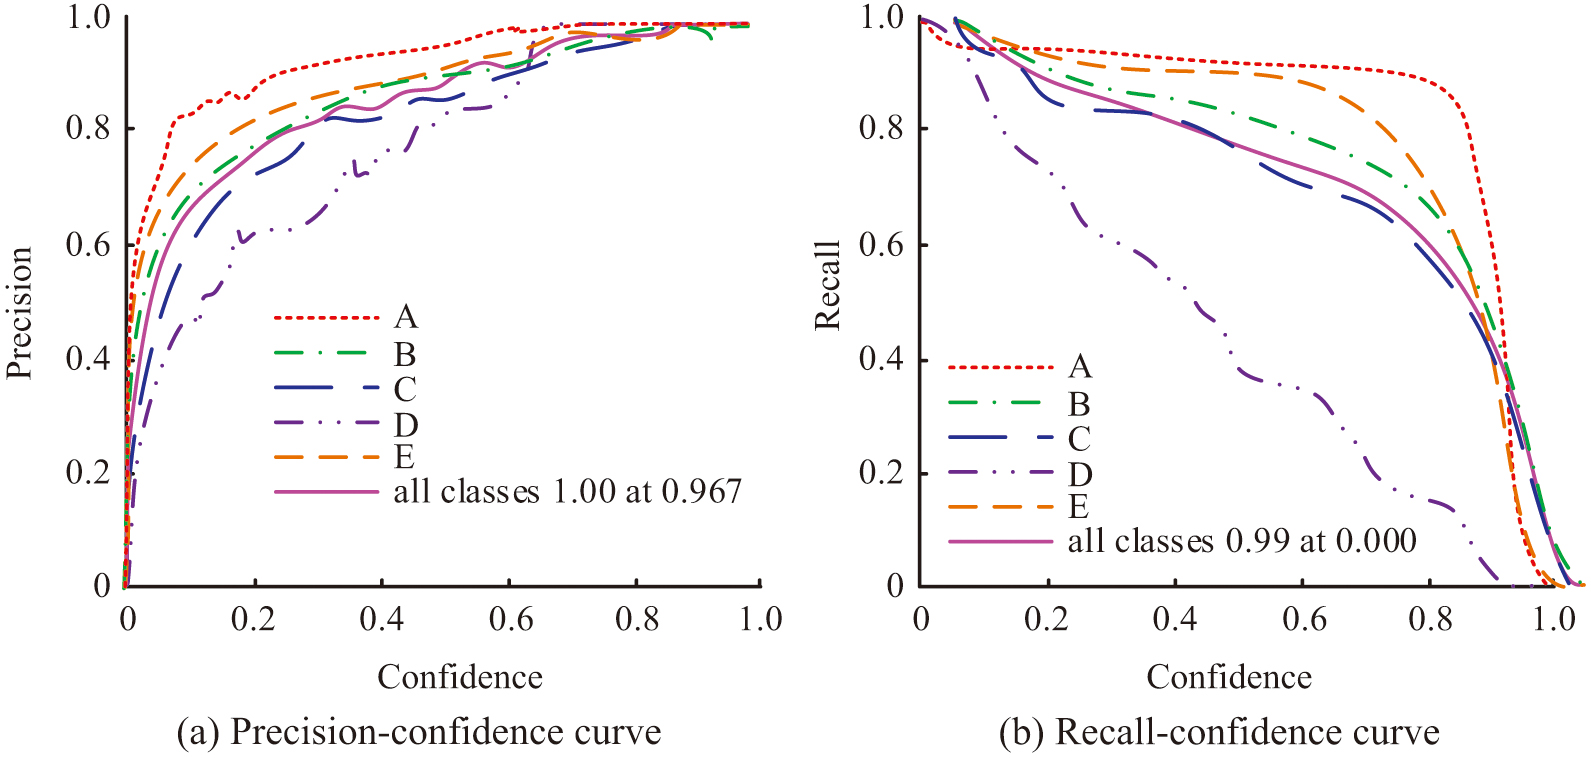
Fig. 6 shows the P and R curves of the model. In Fig. 6(a), the accuracy curves of different categories tend to be close to 1 in the high confidence region. It shows that the model’s prediction is more accurate at high confidence level (CL). At a CL of 0.967, the average accuracy of all categories reaches 1.00. That is, the model’s prediction is completely accurate at this confidence threshold. In Fig. 6(b), the recall curves of different categories are higher in the low confidence region, indicating that the model is able to identify more positive class samples at low confidence. At a CL of 0.000, the average recall of all categories reaches 0.99; that is, the model is able to identify 99% of the actual positive class samples at this confidence threshold. The model has high precision at high CL and high recall at low CL, indicating that the model maintains good performance at different confidence thresholds.
The experimental findings are illustrated in Fig. 7, and the study assesses the effect of various LFs applied to the YOLOv8 model’s performance under this created dataset. On the metric of model convergence rate, the YOLOv8 model incorporating the Shape IoU LF exhibits faster convergence characteristics than the original YOLOv8 model. At the level of DA, the YOLOv8 model incorporating the Shape IoU LF exhibits superior DA. This is because the Shape IoU LF achieves a fine-grained optimization of the match between the PF and the RF by introducing an auxiliary BOB and a scale factor. The improved LF not only considers the OLR but also focuses on the distance of key points between the PF and the RF, thus providing comprehensive spatial localization information. In addition, the Shape IoU LF’s design benefit is its capacity to handle TDs of various scales, which enhances the model’s adaptability to complicated situations and, consequently, the DA.
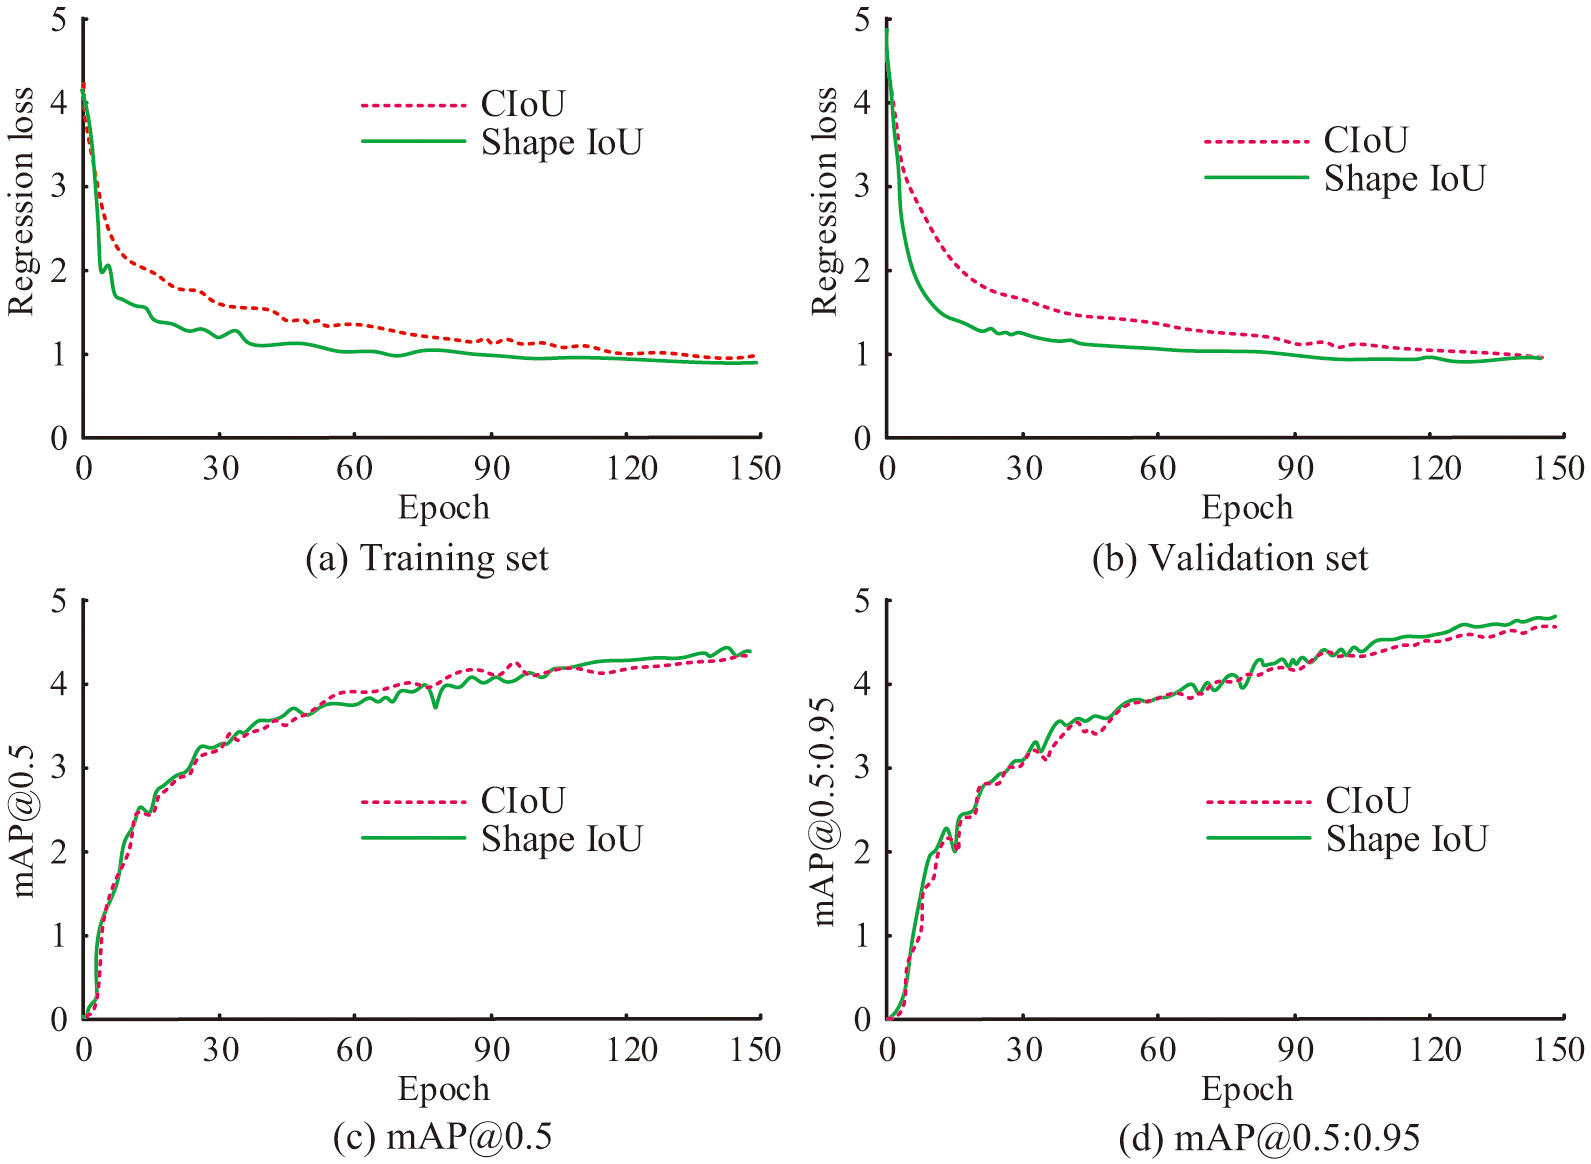 Fig. 7. Effects of different LFs on the performance of the YOLOv8 model.
The study performs ablation tests to assess the efficacy of the improved components. The outcomes are displayed in Table II. The standard YOLOv8 algorithm has a precision of 94.15%, a recall of 91.61%, and an average detection precision of 94.86%. Experiments 1–3 test the effect of single module improvement, respectively. 1: Adding the EMC module increases the average detection precision by 1.08%. 2: Replacing the LF with Shape IoU, the accuracy is increased to 94.67%, and the average DA reaches 95.30%. 3: Introducing the BAR module improves the average DA by 0.52%.
| Method | EMC | Shape IoU | BAR | Precision | Recall | mAP@0.5/% | FLOP (G) | Parameters (M) |
|---|---|---|---|---|---|---|---|---|
| YOLOv8s | 94.15 | 91.61 | 94.86 | 12.64 | 28.46 | |||
| 1 | √ | 93.16* | 93.86*** | 95.74*** | 9.56 | 22.37 | ||
| 2 | √ | 92.23** | 91.52 | 95.30** | 11.34 | 28.68 | ||
| 3 | √ | 94.67*** | 92.63*** | 95.64*** | 11.27 | 28.54 | ||
| 4 | √ | √ | 92.68** | 93.53*** | 95.61*** | 9.60 | 23.02 | |
| 5 | √ | √ | 94.57*** | 92.62*** | 96.07*** | 11.33 | 28.32 | |
| 6 | √ | √ | 93.83*** | 92.83*** | 95.56*** | 9.82 | 22.8 | |
| Our | √ | √ | √ | 94.69*** | 93.31*** | 96.30*** | 9.48 | 23.21 |
Note: An independent sample t-test based on 10 independent repeated experiments (α = 0.05) is conducted, and the control subjects are all YOLOv8s. ***p < 0.001, **p < 0.01, and *p < 0.05.
Experiments 4-6 explore dual-module optimization. 4: The average DA is increased to 95.61% by adding the BAR module to the neck section and replacing the two ConLs after the backbone with an EMC module. 5: Replacing the two ConLs after the backbone with the EMC module and improving the LF to Shape IoU, the average DA is improved to 96.07%. 6: Adding the BAR module in the neck part and improving the LF to Shape IoU, the average DA reaches 95.56%. Experiment 8 fully improves the final precision to 94.69%, recall to 93.31%, and average detection precision to 96.30%.
B.COMPARISON EXPERIMENT
The study reveals the performance of various algorithms after 150 epochs of training and testing on the self-made classroom dataset and presents the test results. In Fig. 8, the proposed algorithm of the study achieves 29.89% on the mAP@0.5 metric, which exceeds the algorithms proposed in [23], [24], and [25]. The algorithm also achieves 18.57% on the more stringent mAP@0.5:0.95 metric, significantly outperforming the other algorithms. This further validates the efficiency of studying the proposed algorithm in terms of precise localization. As far as accuracy is concerned, the study of the proposed algorithm outperforms the other four algorithms, which indicates that the algorithm has a lower false alarm rate in classroom BD.
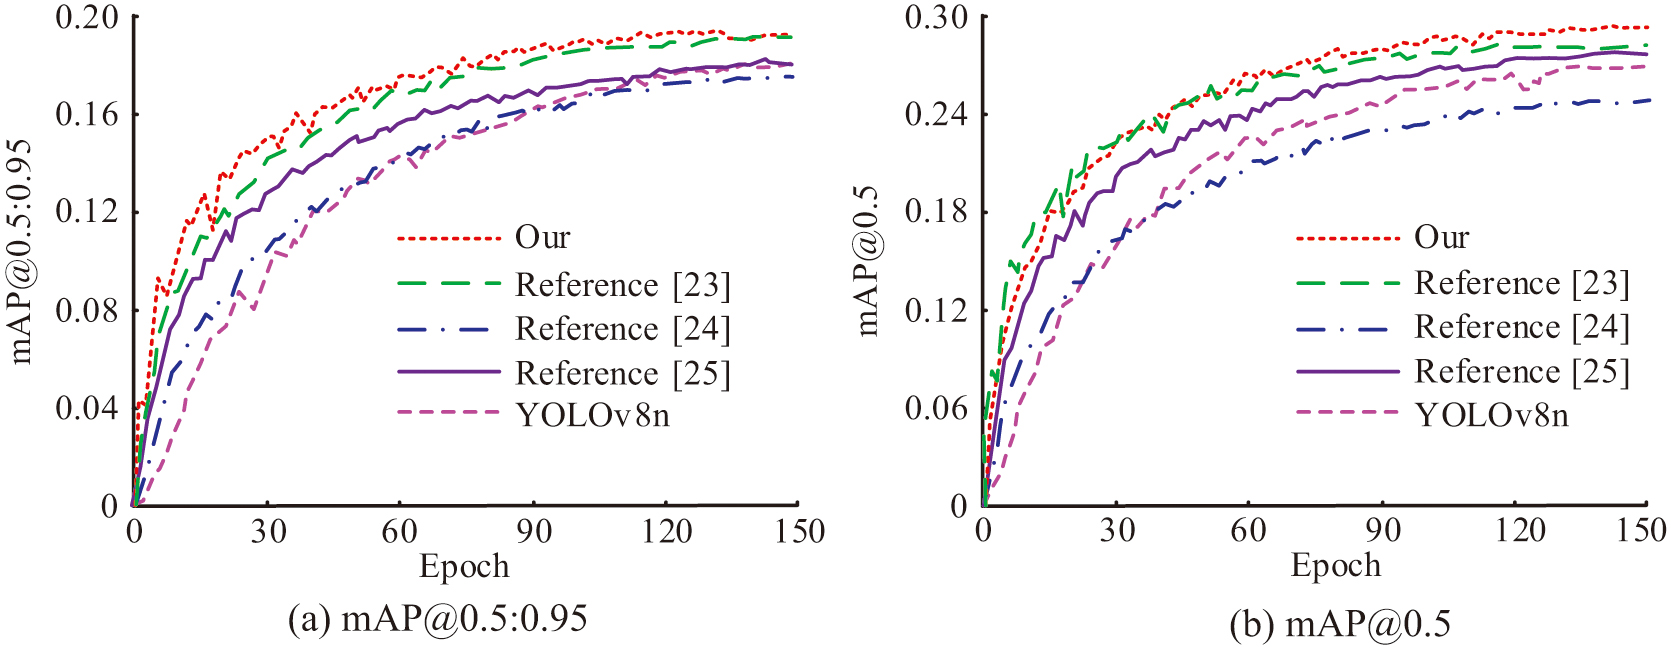 Fig. 8. Comparison maps of the improved YOLOv8 model with those of each baseline model.
Table III displays the findings of the study’s comparison with different YOLO family algorithms using artificial data. The proposed algorithm of the study achieves a significant performance improvement compared to the base model YOLOv8n in the test against the homemade student behavior dataset. Specifically, in the three key metrics of mAP@0.5, precision, and recall, the proposed algorithm of the study achieves an improvement of 4.6%, 1.1%, and 6.2%, respectively. Comparative analysis of the proposed algorithm with the algorithms proposed in [23], [24], and [25] reveals that the proposed algorithm outperforms these algorithms by 2.1%, 4%, and 2.3%, respectively, in the mAP@0.5 metric. In terms of precision metrics, although the performance of GS-YOLOv5n is close to that of the proposed algorithm n, the number of parameters of GS-YOLOv5n is 1.69 times higher than that of the proposed algorithm. The suggested algorithm performs 3.8% better than GS-YOLOv5n, 4.5% better than SNSS-YOLOv7, and 2% better than BCE-YOLOv8 on the recall metric.
Table III. The self-made dataset compares the experimental results
| Method | Precision | Recall | mAP@0.5 | FLOP (G) | Parameters (M) |
|---|---|---|---|---|---|
| YOLOv5s | 0.800 | 0.863 | 0.887 | 16.02 | 7.12 |
| YOLOv6n | 0.848 | 0.823 | 0.848 | 11.87 | 4.22 |
| YOLOv8n | 0.871 | 0.836 | 0.861 | 8.13 | 2.93 |
| Reference [ | 0.882 | 0.860 | 0.886 | 12.74 | 5.88 |
| Reference [ | 0.868 | 0.853 | 0.867 | 86.81 | 27.45 |
| Reference [ | 0.875 | 0.878 | 0.884 | 18.90 | 3.29 |
| Our | 0.882 | 0.898 | 0.907 | 14.32 | 3.50 |
The study tests the suggested algorithm on the COCO2017 and PE_STUD datasets, respectively, to confirm its performance in various settings. The outcomes are displayed in Table IV. In the test on the COCO2017 dataset, the precision of the proposed model is studied to be 0.905, which is slightly lower than the algorithm proposed in [23], but higher than all other models. The recall and mAP@0.5 are 0.840 and 0.908, respectively, higher than all other models. On the PE_STUD dataset, the mAP@0.5 of the proposed algorithm of the study reaches 83.8%, which is 0.70%, 29.70%, and 1.50% better than the algorithms proposed in [23], [24], and [25], respectively. In addition, the precision and recall of the proposed algorithm of the study on the PE_STUD dataset also achieve 83.3% and 79%, respectively. The proposed model of the study performs well on both datasets. Especially on the recall and mAP@0.5 metrics, it shows its superior performance in the TD task. Although precision is slightly lower than some reference models in some cases, the overall superior performance suggests that the model may have higher utility and reliability in practical applications.
Table IV. Comparison experiment results of COCO2017 and PE_STUD
| Method | COCO2017 | PE_Stud | ||||
|---|---|---|---|---|---|---|
| Precision | Recall | mAP@0.5 | Precision | Recall | mAP@0.5 | |
| YOLOv5s | 0.868 | 0.824 | 0.862 | 0.795 | 0.736 | 0.796 |
| YOLOv6n | 0.806 | 0.791 | 0.810 | 0.728 | 0.592 | 0.653 |
| YOLOv8n | 0.875 | 0.736 | 0.857 | 0.746 | 0.584 | 0.651 |
| Reference [ | 0.930 | 0.836 | 0.893 | 0.831 | 0.780 | 0.831 |
| Reference [ | 0.907 | 0.834 | 0.899 | 0.630 | 0.502 | 0.541 |
| Reference [ | 0.900 | 0.837 | 0.947 | 0.740 | 0.781 | 0.823 |
| Our | 0.905 | 0.840 | 0.908 | 0.833 | 0.790 | 0.838 |
To verify the real-time performance of the improved YOLOv8 model, inference speed tests are conducted under the same experimental environment as in Table I. The test uses 1,000 randomly selected images from the PE_Stud dataset (image size: 640 × 640, consistent with training settings). The results are shown in Table V. As shown in Table V, the improved model achieves 52.6 FPS on the NVIDIA RTX6000 GPU. This exceeds the real-time detection threshold and fully meets the requirements for real-time monitoring of students’ classroom behavior. Although the FPS is slightly lower than that of the basic YOLOv8s model, the mAP@0.5 improves by 1.44%, making the trade-off in real-time performance reasonable. On the CPU, the model still maintains 7.6 FPS, ensuring basic real-time capabilities despite limited GPU resources.
Table V. Model inference speed test
| Method | Inference device | FPS (frames per second) | Latency per image (ms) | Throughput (images per second) |
|---|---|---|---|---|
| YOLOv8s | GPU | 58.2 | 17.2 | 57.9 |
| Our | GPU | 52.6 | 19 | 52.3 |
| YOLOv8s | CPU | 8.3 | 120.5 | 8.2 |
| Our | CPU | 7.6 | 131.6 | 7.5 |
To further evaluate the effectiveness of the BAR attention mechanism, a comparative ablation study is conducted on several popular attention modules. The study integrates the convolutional block attention module (CBAM), the squeeze-and-excitation network (SE), and the efficient channel attention (ECA) into the same position in the YOLOv8s baseline model. This ensures that all other structures and training settings remain the same. The results are shown in Table VI. The BAR mechanism in the study reaches the highest mAP@0.5 at 96.30%, which is superior to SE (95.41%), ECA (95.88%), and CBAM (95.95%). Although CBAM and ECA have also brought greater improvements than the baseline (94.86%), BAR’s region-to-region routing and fine-grained token-to-token focus can optimize features more efficiently and effectively, thereby delivering outstanding performance. Furthermore, BAR strikes a good balance between performance, computational cost, and parameter efficiency, confirming its advantages in student BD tasks.
Table VI. Performance comparison of different attention mechanisms integrated into the YOLOv8s architecture
| Model | Precision (%) | Recall (%) | mAP@0.5 (%) | FLOPs (G) | Parameters (M) | FPS |
|---|---|---|---|---|---|---|
| YOLOv8s (Baseline) | 94.15 | 91.61 | 94.86 | 12.64 | 28.46 | 156 |
| + SE | 94.3 | 92.05 | 95.41 | 12.67 | 28.5 | 154 |
| + ECA | 94.52 | 92.33 | 95.88 | 12.64 | 28.46 | 155 |
| + CBAM | 94.78 | 92.6 | 95.95 | 13.1 | 28.92 | 149 |
| + BAR (Our) | 94.69 | 93.31 | 96.3 | 9.48 | 23.21 | 142 |
V.CONCLUSION
To increase the YOLOv8 model’s performance in student classroom BD, the study added Shape IoU LF and the BAR attention mechanism. The outcomes revealed that compared with other improved algorithms proposed in the reference, the improved YOLOv8 model exceeded these algorithms by 2.1%, 4%, and 2.3% in the mAP@0.5 metrics, respectively. The average DA in the ablation tests increased by 1.08% just by adding the EMC module. Replacing the LF with Shape IoU improved the accuracy to 94.67%, and the average DA reached 95.30%. The average DA increased by 0.52% once the BAR module was added. The synergistic effect of each improvement strategy was clearly demonstrated when the three modules were applied concurrently, as the average DA of the model reached its greatest value of 96.30%. In conclusion, the YOLOv8 model’s accuracy, recall, and real-time performance in student classroom BD were all successfully enhanced by the addition of the Shape IoU LF and the BAR attention mechanism. This capability facilitated the identification and classification of multiple behavioral states among students in real time, with a high degree of accuracy, within complex classroom environments. Consequently, it provided substantial technical support for the management and optimization of classroom environments in the context of education informatization.
The improved YOLOv8 model proposed in this study has achieved remarkable results in detecting classroom student behavior. However, there are still some key limitations and potential failure cases worthy of in-depth exploration. First, the model primarily focused on students’ body posture and large movements. It has limited detection capabilities for subtle behaviors, such as changes in facial expressions, eye contact, and microexpressions. This may lead to misjudgments of concentration or emotional states in practical applications and limit the comprehensive analysis of classroom behaviors. Second, FE may fail in low-light conditions or under extreme target occlusion, leading to misidentification or missed detection of behavior categories. Future work can address these limitations by incorporating multimodal information, such as facial recognition or eye tracking, and by enhancing data diversity. These improvements will make models more robust in real-world scenarios.