I.INTRODUCTION
Arecanut is a major industrial crop that provides economic security to a large population in India, whereas its cultivation generates various job opportunities for small-scale industries. India produces 57% of the overall Arecanut production, whereas Bangladesh, China, Myanmar, and other countries provide the rest of 43% of Arecanut. Although Arecanut cultivation is geographically limited to few regions, its consumption is widespread [1,2]. It is used to treat various medical conditions which include headaches, toothaches, and stomach issues because of its medicinal properties such as anti-inflammatory and digestive benefits. Its nut’s antioxidant and anti-inflammatory properties act as a remedy for various diseases [3]. High-quality Arecanuts are prized for their aroma, flavor, and texture and often are utilized as stimulants and ingredients in beverages and food. A higher market price signifies greater financial gains for suppliers, producers, and merchants. Additionally, Arecanut quality directly influences the composition of its vitamins and minerals [4]. However, the Arecanut is highly vulnerable to both biotic and abiotic stresses throughout its growth stages, with fungal diseases posing major threats. Meanwhile, climatic conditions often accelerate fungal activity and growth. Among these, fruit rot disease is particularly destructive, leading to the death of individual palm trees or spreading across an entire plantation, resulting in severe yield losses [5,6]. Arecanuts are categorized based on their qualities with Grade 1 representing the finest quality and Grade 4 indicating the lowest quality, with pricing adjusted accordingly. The parameters for quality measurements are texture, size, color, hardness, and density. Arecanut’s Grade 1 is measured as the finest quality and displays a full kernel with natural light brown skin color [7].
Significantly, Grade 1 Arecanuts contain visible external surface breaks that ensure a pristine appearance. Grade 2 Arecanuts are characterized by the presence of breaks around black holes on the surface near the kernel calyx which affects their quality and classification. Grade 2 Arecanuts retain relatively good quality, making them appropriate for numerous applications. Grade 3 Arecanuts are identified by a thin skin covering of a moderate lightweight kernel, whereas Grade 4 Arecanuts are determined as poor quality [8,9]. These have a dark brown or black color and are lightweight due to kernel porosity that affects density and enables easier processing. Compared to higher-grade Arecanuts, the presence of porosity indicates lower density which is associated with minimized nutritional value and overall inferior quality. Several studies have been conducted on Arecanut classification using machine learning (ML) methods [10,11]. However, these methods primarily rely on external appearance and fail to determine the intrinsic quality of Arecanuts [12]. However, the deep learning (DL) methods are employed for addressing various agricultural issues. Leaf disease is a significant challenge in agriculture, and most DL methods and models primarily rely on supervised learning for detection and classification [13–15]. It is estimated that approximately 35% of agricultural harvests are getting lost due to plant diseases, severely impacting the country’s economy and contributing to rising food prices. These losses minimize food availability and disrupt market stability, highlighting the need for timely disease management [16–18]. However, plant diseases vary in scales from fine details like spots or small lesions to larger areas of discoloration which lead to inaccurate performance. To address this issue, this research proposes Selective Kernel-DenseNet (SK-DenseNet) to classify the Arecanut plant disease effectively. SK-DenseNet introduces an adaptive convolutional mechanism that dynamically adjusts the receptive field size via SK which enables the network for an automatic selection of the most relevant kernel size for each feature region effectively and captures both fine-grained information and broader disease regions. Furthermore, dense connectivity in DenseNet ensures reusage of effective features and gradient propagation for minimizing the information loss and vanishing gradient issue. By integrating these mechanisms, SK-DenseNet achieves enhanced feature representation, high classification accuracy, and robustness to scale variations that enhance overall performance and reliability of Arecanut plant disease classification.
The major contributions are described as follows:
- •Unlike conventional DenseNet models that employ fixed receptive fields, the proposed SK-DenseNet integrates an SK mechanism that dynamically adjusts receptive field size. This innovation enables an adaptive focus on both fine-grained information and broad disease patterns, which leads to feature adaptability.
- •Resizing ensures uniform input dimensions which assist in preserving primary features, whereas label encoding converts categorical labels into numerical formats that allow the model to process effectively and distinguish multiple diseases accurately.
- •Consequently, the proposed SK-DenseNet exhibits improved adaptability, robustness, and classification accuracy by effectively capturing contextual information while maintaining dense connections for efficient feature reuse compared to the fixed kernel method.
This research paper is structured as follows: Section II presents the literature review and Section III shows the proposed methodology. Section IV illustrates experimental results, and Section V contains the conclusion.
II.LITERATURE SURVEY
Tabbakh and Barpanda [19] presented a Transfer Learning-based Method with a Vision Transformer (TLMViT) for plant disease classification. Initially, the image augmentation was applied to enhance the number of training samples and solve the overfitting problem. Then, the initial features were extracted by employing a pretrained model and deep feature extraction utilizing ViT method. Finally, classification was performed by applying a Multi-Layer Perceptron (MLP) classifier. By employing a pretrained model, the dimensionality of images was minimized which made the following phase less complex. However, TLMViT struggled with exhibiting intra-class variability which was growth stage, lighting conditions, or environmental factors that led to misclassification.
Kotwal et al. [20] suggested a hybrid method that depended on an optimized automatic DL to classify the plant leaf disease. At first, the disease-infected region was segmented by employing UNet which obtained appropriate regions and increased the disease classification accuracy. The UNet’s weights were tuned by using the Hunter Prey Optimization (Hunt-PO) model, whereas Scale-Invariant Feature Transformer (SIFT), Gabor filter, and Gray Level Co-occurrence Matrix (GLCM) were utilized to extract the features for classification. At last, Artificial Driving-EfficientNet (AD-ENet) was performed based on extracted features to classify the plant leaf disease. Nevertheless, AD-ENet struggled to capture fine-grained disease symptoms like minor discoloration because of its downsampling layers that minimized the classification accuracy.
Zhang et al. [21] established a Capsule Network (CapsNet) and residual network for plant leaf disease classification. ResNet’s initial convolutional layer was enhanced by replacing its kernel for extracting the features effectively in plant leaf lesions. Later, a channel attention mechanism was integrated into the residual block to enhance the model by emphasizing significant features. Finally, an improved ResNet was integrated effectively with CapsNet, whereas the initial pooling layer was eliminated to minimize the loss of positional information. The outcome of the third residual model of ResNet was integrated with CapsNet by leveraging the benefits of both the networks that improved the models’ robustness. However, CapsNet struggled with intricate backgrounds in plant leaf images due to emphasizing spatial hierarchies which misclassified the diseased regions while leaves were overlapped.
Yang et al. [22] developed an ECA-ResNet34 which is an improved channel attention mechanism termed ECAnet to classify the plant leaf disease. The developed model depended on ResNet34 and an improved aECAnet was incorporated in the initial and final layers of the network with a symmetric structure. The attention mechanism was applied for extracting local features of plant leaves that enhanced the accuracy of plant leaf pest detection and classification. Nevertheless, aECA-ResNet34 focused excessively on prominent features while neglecting subtle or less visible disease symptoms which minimized its ability to detect infections.
Quan et al. [23] introduced a lightweight convolutional neural network (CNN) for plant disease detection. Skip connections were used in convolutional MobileNetV3 that enriched the deep network’s input feature, and then feature fusion weight parameters in skip connections were optimized by utilizing an improved whale optimization method to attain high classification accuracy. During the learning process, the bias loss was applied as a loss function to minimize interference caused by the redundant data. However, lightweight CNNs struggled to capture intricate features or patterns because of a limited number of parameters and layers which led to less accuracy for diverse disease types.
From the overall analysis, the existing method had limitations such as exhibiting intra-class variability, struggling to capture fine-grained disease symptoms, less visible disease symptoms, and varying scales from fine details like spots or small lesions to larger areas of discoloration leading to inaccurate performance. To solve these issues, the SK-DenseNet is proposed to classify the Arecanut plant disease accurately. Its dense connections enhance the feature reusage that ensures better representation of less visible symptoms. The proposed SK-DenseNet enhances the model’s ability to detect spots and extensive discoloration effectively. Overall, SK-DenseNet achieves high accuracy in classifying Arecanut plant disease.
III.PROPOSED METHODOLOGY
This research proposes SK-DenseNet to classify the Arecanut plant disease accurately. Initially, the images are obtained from the Arecanut dataset and PlantVillage dataset to evaluate the model performance. Then, resizing and label encoding are applied to standardize the input dimensions and convert categorical labels into numerical formats in the preprocessing stage. Finally, the proposed SK-DenseNet is applied for classifying the plant diseases. Fig. 1 depicts a block diagram for the overall methodology process.
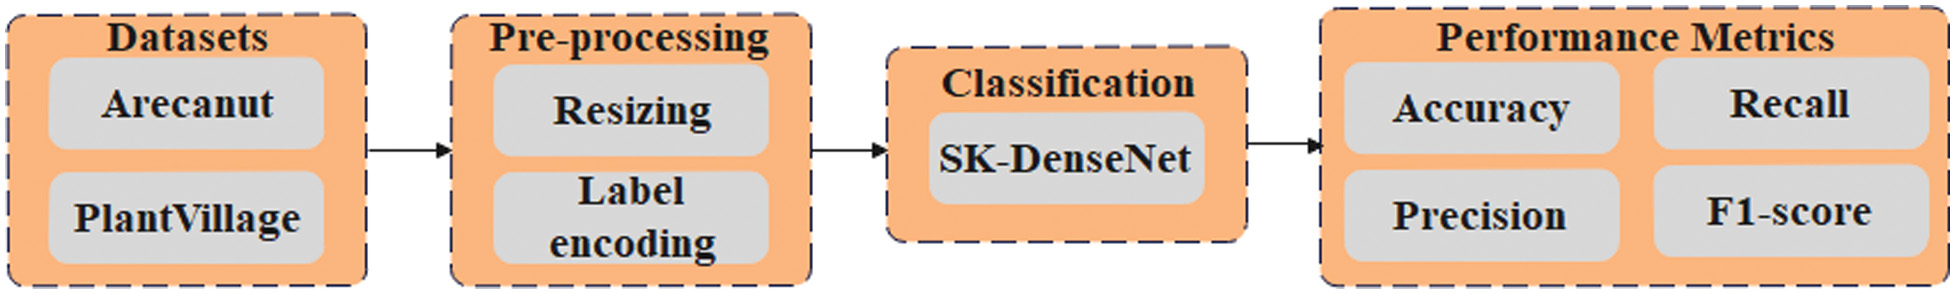 Fig. 1. Block diagram for the overall process.
A.DATASET
In this research, the Arecanut [24] and PlantVillage [25] datasets are used to determine the model performance. Arecanut is a collected dataset particularly curated for plant disease classification which focuses on the identification of diseases affecting Arecanut plants.
The PlantVillage dataset primarily utilizes a collection of images for plant disease classification which covers various plant species and disease types. A detailed description of the dataset is explained as follows.
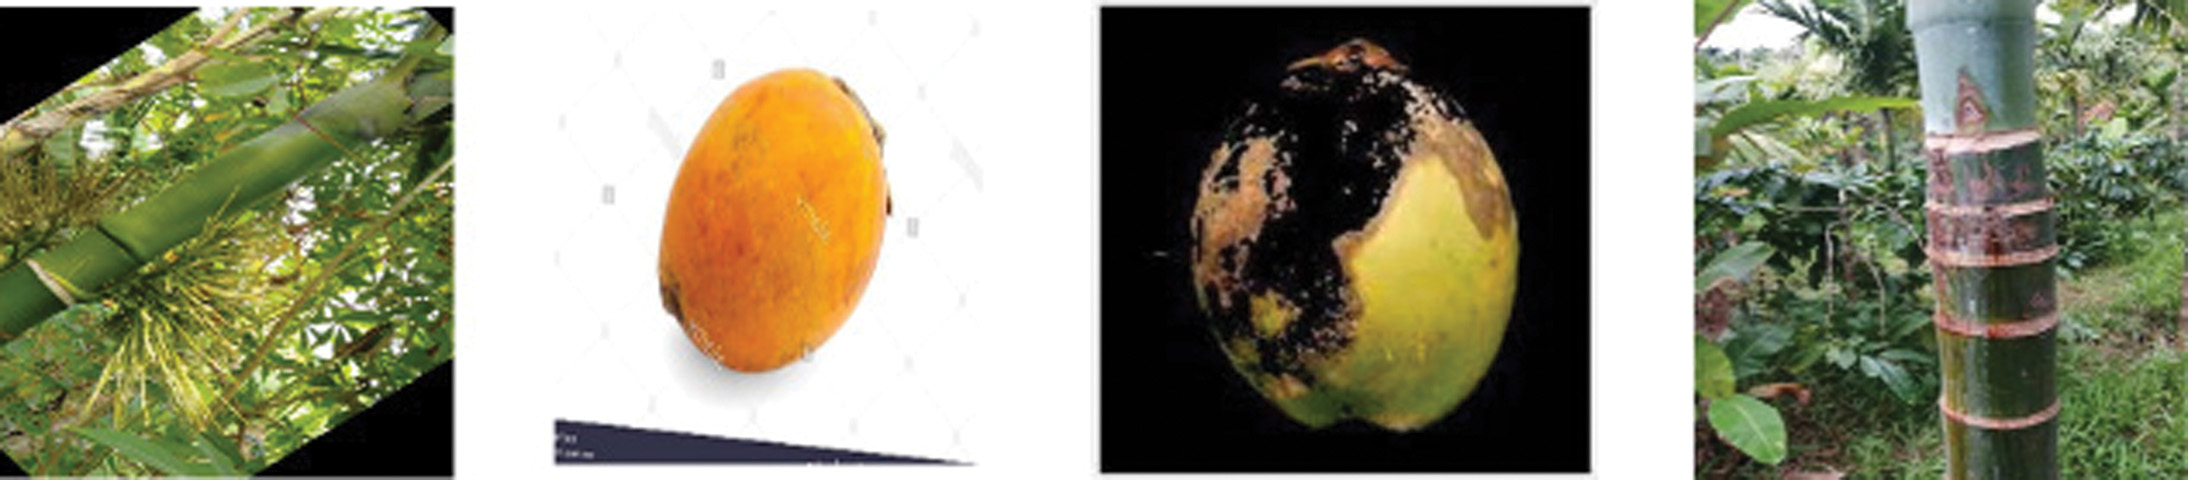
Arecanut: It contains diseased and healthy areca plants with yellow spots, stem bleeding, and Mahali. It has overall nine classes that are utilized to train and test the images for accurate detection and classification performance.
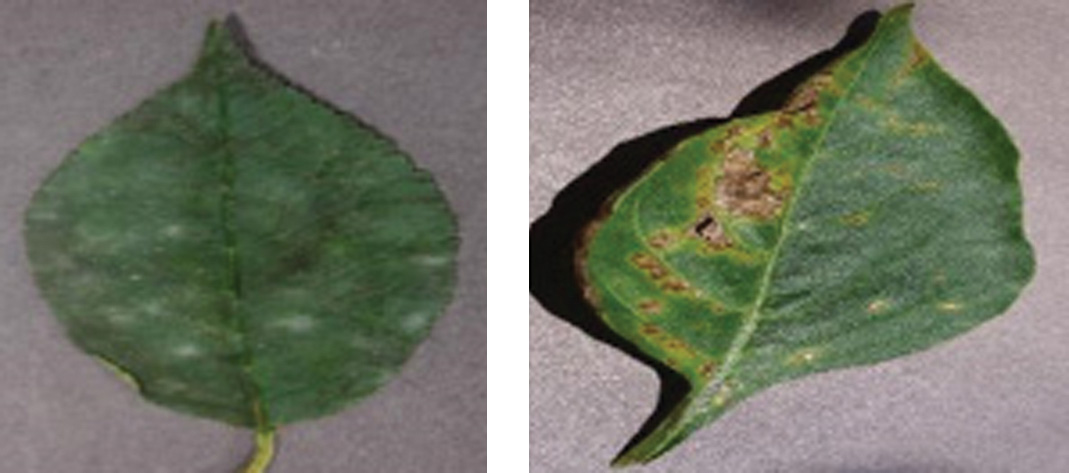
PlantVillage: It involves 54,303 diseased and healthy images containing 39 classes. Plant leaves of 14 species, such as corn, apple, bell pepper, corn, tomato, potato, grape, and the 10 types of diseases, including bacterial leaf spot, leaf blight, late blight, early blight, and rust, are presented. Figs. 2 and 3 depict the sample images for Arecanut and PlantVillage datasets, and these images are fed as an input to the preprocessing stage.
B.PREPROCESSING
After obtaining images, they are resized to standardized input dimensions for the plant disease classification. This resizing makes it compatible with DL methods while preserving significant features. Additionally, it assists in enhancing computational efficiency, increasing model training, and maintaining consistency across the dataset which improves classification accuracy. Label encoding [26] is applied for converting categorical labels like plant disease types into numerical values. Each unique disease class is assigned a distinct integer which makes the model process effective. Furthermore, this method simplifies the input data where the target variable is categorical. Thus, resizing ensures uniform input while label encoding converts categorical data into numerical format, thereby enabling the model for processing and distinguishing various disease types for classification. Then, the preprocessed input is fed into the classification process using SK-DenseNet.
C.FEATURE EXTRACTION AND CLASSIFICATION
Once preprocessing is done, SK-DenseNet is performed to extract and classify the Arecanut plant disease. DenseNet performs effective feature reuse by associating each layer with every other layer which ensures that the model captures complex patterns in disease-affected regions. The dense connections improve gradient flow, minimize vanishing gradient, and enable effective training in deep networks. Additionally, it is highly parameter-efficient which leads to a compact model that offers high accuracy without the requirement of computational resources. In traditional DenseNet [27], the SK-Net is incorporated for focusing on the small localized features by utilizing smaller kernels which enhance the model’s sensitivity to subtle disease symptoms. Therefore, this assists in distinguishing between diseased and healthy areas effectively. A detailed description of DenseNet is explained as follows.
Conv2d and Conv Maxpool 2d Layer: The initial layer applies a 2D convolution process to extract low-level features like texture and edges. Using a relevant filter of varying kernel size provides tensor results by convoluting the layers on which it is used. Then, the ConvMaxpool 2d layer is applied to minimize the characteristics that are identified from the feature map by considering the maximum value from the feature matrix.
Flatten and Dense Layer: It is used to compress features and schemes into a column format to assist in further processing. It is the most fundamental layer, where an activation function is employed for associated stacked neural networks to generate nonlinear output.
DenseNet is an amalgamation of normalization and convolution with Rectified Linear Unit (ReLU) using Equation (1). Normalization is performed in batches by relocating inputs that have zero-unit variance and mean value, and then ReLU function transforms negative values to zero:
DenseNet is primarily visualized as a network of three-layer chunks that are split into two 2D convolutional layers with convolution matrix. These layers are optimized by utilizing a maxpool filter after mapping which is followed by the ReLU activation function. The outcome of the layers acts as an input to the network of four dense layers, which is activated by ReLU. Finally, SoftMax is used in the last layer to generate the classification process.
SKNet: It selects the best kernel size for each region for capturing both fine-grained information and broader patterns. This enhances the model’s ability to capture subtle disease symptoms in localized areas of overall disease spread. Therefore, SKNet achieves an enhanced feature representation and classification accuracy which makes it particularly efficient for intricate tasks. The convolution kernels of various sizes are applied to convolve feature maps with convolution results and time axes that are fused to obtain standardization of features depending on the SKNet network. This approach realizes reasonable weight allocation to feature information and also prevents feature information redundancy. The indicates the input multi-dimensional feature matrix, determines the output of feature matrix by SKNet, denotes width, height, and number of channels of feature map, and indicates the internal computation of SKNet which is expressed in Equation (2) to (6):
where represents that is input to the convolution layer with convolution kernel in the size of convolution kernel, same denotes the filling method, indicates the ReLU activation function, demonstrates batch normalization, refers to the new feature acquired and the feature generated after process, is the input sequence, and illustrates the length. By employing function, the learning rate is increased or minimized, and the model is evaluated by utilizing sparse categorical cross-entropy loss with the Adam optimizer. Therefore, this mechanism enables the network to learn and focus on the most significant features of plant diseases that enhance classification accuracy. The integration of SKNet’s flexibility with DenseNet’s feature reuse makes a robust model to classify the plant diseases accurately.IV.EXPERIMENTAL RESULTS
The proposed SK-DenseNet is simulated using a Python 3.11 environment with 64 GB RAM, an Intel i7 processor, and a Windows 10 operating system. Accuracy, recall, F1-score, and precision are the metrics used to evaluate the model performance using Equation (7) to (10):
where indicates False Positive, represents True Positive, determines False Negative, and presents True Negative.A.PERFORMANCE ANALYSIS
Table I shows the performance analysis of different feature extraction methods. The existing methods like CNN, MobileNet, ResNet, and EfficientNet are compared with DenseNet. Compared to these existing methods, DenseNet obtains a high accuracy of 98.74% and 96.84% on PlantVillage and Arecanut datasets using dense connections that enable each layer to evaluate all prior layer outputs which enhance gradient flow and feature reuse. This minimizes the overfitting risk and increases the model’s ability to learn intricate patterns in plant images. The effective feature extraction process results in better generalization and high classification.
Table I. Analysis of different feature extraction methods
| Methods | Dataset | Accuracy (%) | Precision (%) | Recall (%) | F1-score (%) |
|---|---|---|---|---|---|
| CNN | PlantVillage | 88.9 | 87.6 | 86.9 | 87.25 |
| Arecanut | 89.45 | 88.3 | 87.6 | 87.94 | |
| MobileNet | PlantVillage | 86.78 | 85.4 | 85.1 | 85.25 |
| Arecanut | 87.9 | 86.7 | 86.3 | 86.5 | |
| ResNet | PlantVillage | 90.32 | 89 | 88.8 | 88.9 |
| Arecanut | 91.2 | 90.3 | 89.9 | 90.1 | |
| EfficientNet | PlantVillage | 88.9 | 87.6 | 86.9 | 87.25 |
| Arecanut | 89.45 | 88.3 | 87.6 | 87.94 | |
| DenseNet | PlantVillage | 98.74 | 98.68 | 98.52 | 98.59 |
| Arecanut | 96.84 | 96.72 | 92.43 | 94.53 |
Table II determines the performance analysis of different DL methods. SK-DenseNet obtains better accuracy of 99.99% and 98.92% on PlantVillage and Arecanut datasets due to its selective kernel that adjusts receptive fields to capture multi-scale disease patterns. DenseNet’s dense connectivity improves feature reuse to ensure better gradient flow and minimize overfitting. The model extracts fine-grained leaf variations and textures effectively for differentiating similar disease symptoms. Its deep hierarchical structure enhances the representation of features and robustness against intricate backgrounds with an integration of SKNet. Hence, the SK-DenseNet achieves high accuracy compared to existing methods like CNN, MobileNet, ResNet50, and VGG16. Also, the computational complexity is analyzed in terms of training time, memory usage, and inference time. SK-DenseNet achieves less training time due to DenseNet’s dense connectivity that provides efficient feature reuse and minimizes the redundant computations. Moreover, the SK mechanism adjusts receptive fields by allowing the model to concentrate on relevant features which leads to rapid speed and reduced training time.
Table II. Analysis of different DL methods
| Methods | Dataset | Accuracy (%) | Precision (%) | Recall (%) | F1-score (%) | Training time (s) | Memory usage (MB) | Inference time (s) |
|---|---|---|---|---|---|---|---|---|
| CNN | PlantVillage | 91.25 | 89.3 | 90.5 | 89.9 | 181.23 | 4121.45 | 3.23 |
| Arecanut | 92.78 | 91.6 | 90.9 | 91.24 | 166.57 | 3456.68 | 2.79 | |
| MobileNet | PlantVillage | 94.12 | 92.8 | 93.45 | 93.12 | 167.35 | 4123.12 | 4.23 |
| Arecanut | 95.34 | 94.5 | 93.7 | 94.1 | 142.23 | 3889.23 | 3.35 | |
| ResNet50 | PlantVillage | 92.98 | 91.2 | 90.9 | 91.05 | 195.68 | 4272.46 | 4.89 |
| Arecanut | 93.56 | 92.8 | 91.7 | 92.25 | 173.57 | 4085.57 | 3.01 | |
| VGG16 | PlantVillage | 90.87 | 89.1 | 88.9 | 89 | 175.12 | 5004.23 | 3.35 |
| Arecanut | 91.43 | 90.3 | 89.6 | 89.94 | 154.23 | 4357.35 | 3.57 | |
| SK-DenseNet | PlantVillage | 99.99 | 99.99 | 99.99 | 99.99 | 147.23 | 3812.12 | 3.35 |
| Arecanut | 98.92 | 98.98 | 94.48 | 96.43 | 139.35 | 3587.23 | 2.46 |
Tables III and IV represent the performance analysis of class-wise results on Arecanut and PlantVillage datasets. Arecanut and PlantVillage datasets contain 9 and 39 classes that obtain a high average precision of 99.99% and 98.98%, respectively. In the PlantVillage dataset, various classes obtain 100% across recall, precision, and F1-score which provides the model’s exceptional ability to manage a wide variety of plant diseases. For Arecanut, the model indicates better precision for most classes for healthy leaves, stem bleeding, healthy foot, and bud border.
Table III. Analysis of class-wise results for the Arecanut dataset
| Classes | Precision (%) | Recall (%) | F1-score (%) |
|---|---|---|---|
| Stem cracking | 95.04 | 99.26 | 97.10 |
| Stem bleeding | 100 | 97.37 | 98.67 |
| Healthy leaf | 100 | 98.68 | 99.34 |
| Yellow leaf disease | 96.86 | 100 | 98.40 |
| Healthy foot | 100 | 76.92 | 86.96 |
| Healthy trunk | 99.44 | 98.05 | 98.74 |
| Mahali koleroga | 99.69 | 99.69 | 99.69 |
| Bud borer | 100 | 80.56 | 89.23 |
| Healthy nut | 99.79 | 99.79 | 99.79 |
| Average | 98.98 | 94.48 | 96.43 |
Table IV. Analysis of class-wise results for the PlantVillage dataset
| Classes | Precision (%) | Recall (%) | F1-score (%) |
|---|---|---|---|
| Apple___Apple_scab | 100 | 98.41 | 99.20 |
| Apple___Black_rot | 100 | 100 | 100 |
| Apple___Cedar_apple_rust | 99.40 | 100 | 99.70 |
| Apple___healthy | 99.34 | 100 | 99.67 |
| Blueberry___healthy | 100 | 100 | 100 |
| Cherry_(including_sour)_Powdery_mildew | 100 | 100 | 100 |
| Cherry_(including_sour)_healthy | 100 | 100 | 100 |
| Corn_(maize)___Cercospora_leaf_spot | 100 | 100 | 100 |
| Corn_(maize)__Common_rust | 100 | 100 | 100 |
| Corn_(maize)___Northern_Leaf_Blight | 98.97 | 97.96 | 98.46 |
| Corn_(maize)___healthy | 100 | 100 | 100 |
| Grape___Black_rot | 100 | 100 | 100 |
| Grape___Esca_(Black_Measles) | 100 | 100 | 100 |
| Grape___Leaf_blight_(Isariopsis_Leaf_Spot) | 100 | 100 | 100 |
| Grape___healthy | 100 | 100 | 100 |
| Orange___Haunglongbing | 100 | 100 | 100 |
| Peach___Bacterial_spot | 100 | 100 | 100 |
| Pepper,_bell___Bacterial_spot | 100 | 100 | 100 |
| Peach___healthy | 100 | 100 | 100 |
| Pepper,_bell___healthy | 100 | 100 | 100 |
| Potato___Early_blight | 100 | 100 | 100 |
| Potato___Late_blight | 100 | 100 | 100 |
| Raspberry___healthy | 100 | 100 | 100 |
| Soybean___healthy | 100 | 100 | 100 |
| Potato___healthy | 100 | 100 | 100 |
| Squash___Powdery_mildew | 100 | 100 | 100 |
| Strawberry___Leaf_scorch | 100 | 100 | 100 |
| Strawberry___healthy | 100 | 100 | 100 |
| Tomato___Bacterial_spot | 100 | 100 | 100 |
| Tomato___Late_blight | 99.48 | 99.48 | 99.48 |
| Tomato___Early_blight | 100 | 100 | 100 |
| Tomato___Leaf_Mold | 100 | 100 | 100 |
| Tomato___Septoria_leaf_spot | 100 | 100 | 100 |
| Tomato___Spider_mites | 100 | 100 | 100 |
| Tomato___Target_Spot | 100 | 100 | 100 |
| Tomato___Tomato_Yellow_Leaf_Curl_Virus | 100 | 100 | 100 |
| Tomato___Tomato_mosaic_virus | 100 | 100 | 100 |
| Tomato___healthy | 99.38 | 100 | 99.69 |
| Average | 99.99 | 99.99 | 99.99 |
Figure 4 demonstrates the epoch vs accuracy of SK-DenseNet: 4(a) Arecanut and 4(b) PlantVillage dataset. Both the datasets represent a rapid increase in accuracy for the initial epochs which indicates rapid convergence. For Arecanut, accuracy stabilizes at 99.99% which shows the model’s strong generalization and robustness. A smaller gap between validation and training accuracy indicates less overfitting, improved reliability, and better capture of disease-specific patterns, resulting in better classification performance. These outcomes provide its effectiveness in classifying plant disease with high precision.
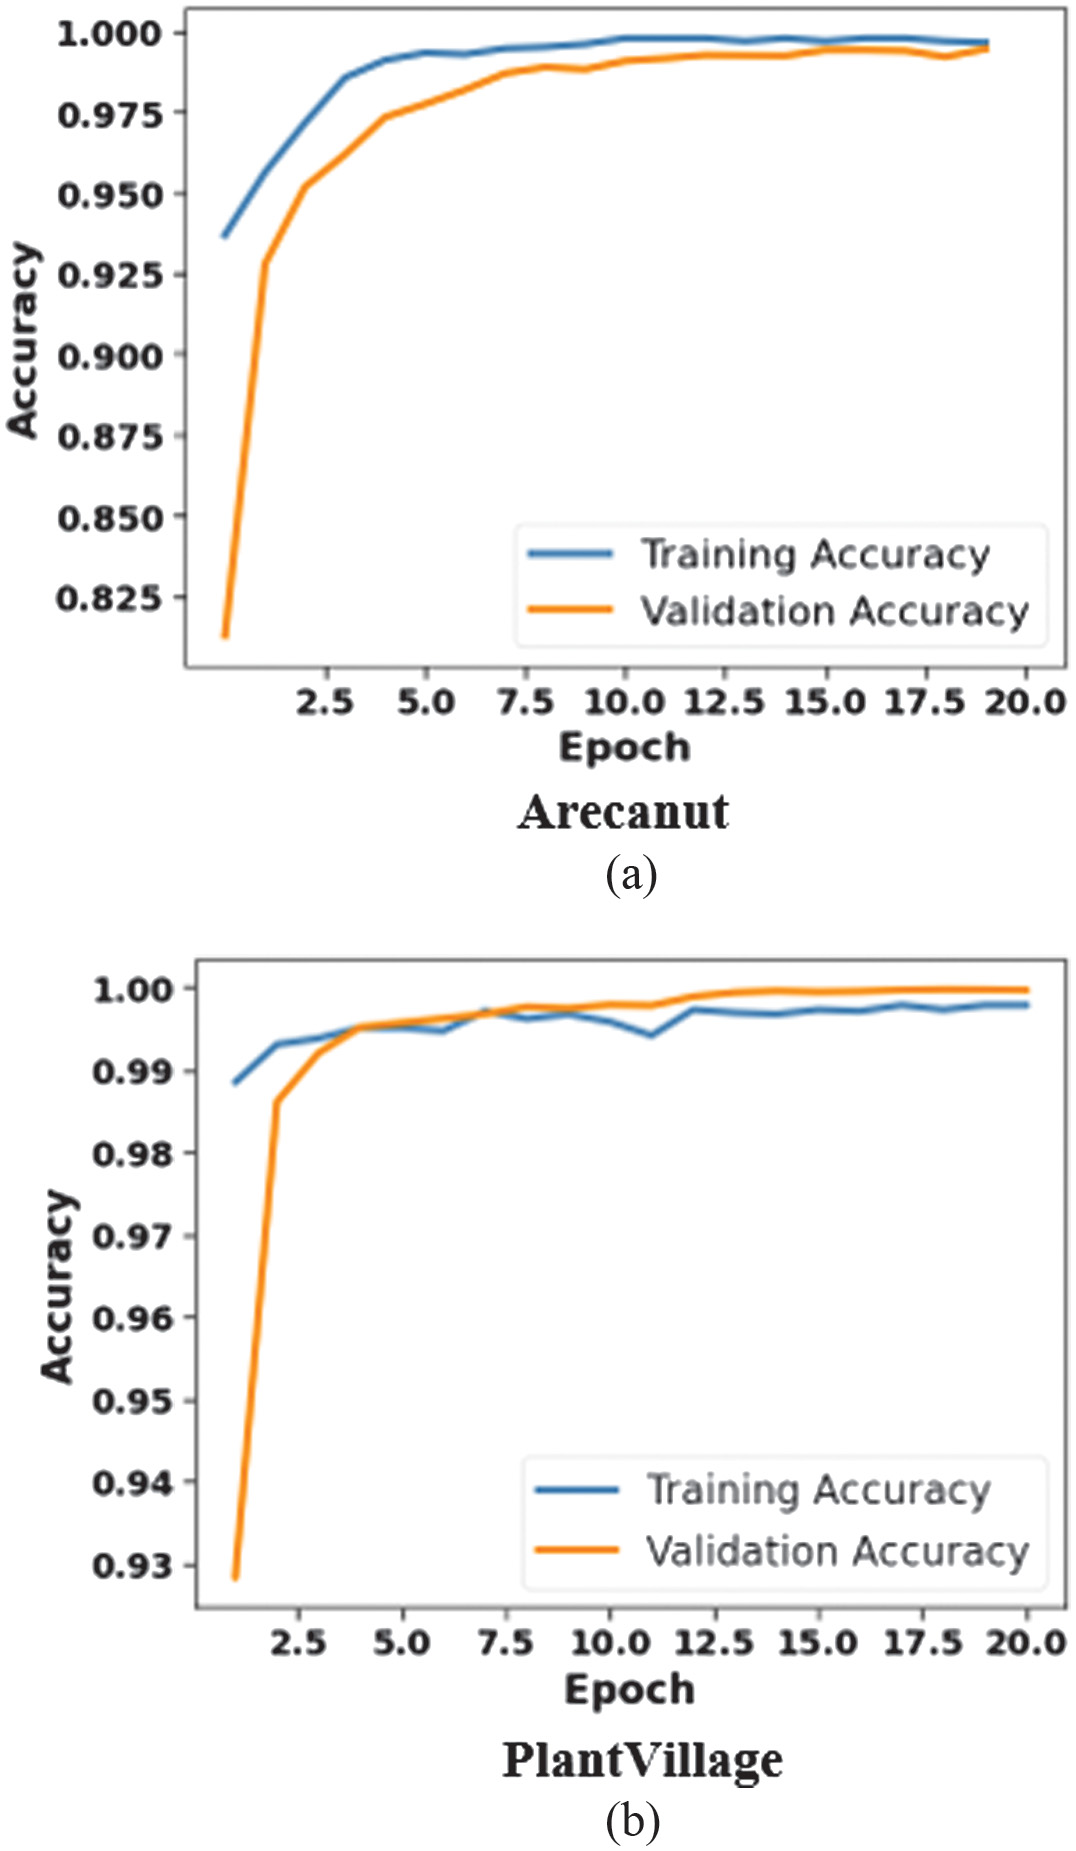 Fig. 4. Analysis of epoch vs accuracy for SK-DenseNet: 4(a) Areacanut dataset and 4(b) PlantVillage dataset.
Figure 5 indicates epoch vs loss for proposed method: 5(a) Arecanut and 5(b) PlantVillage dataset over 20 epochs. Both validation and training loss are minimized rapidly in initial epochs which provides effective learning. The curves are flattening gradually, representing that the model stabilizes with minimum loss, whereas a small gap between validation and training loss demonstrates less overfitting that ensures robustness. The PlantVillage dataset begins with a high initial loss but converges quickly to near zero which leads to validating SK-DenseNet’s effectiveness in obtaining accurate and reliable plant disease classification.
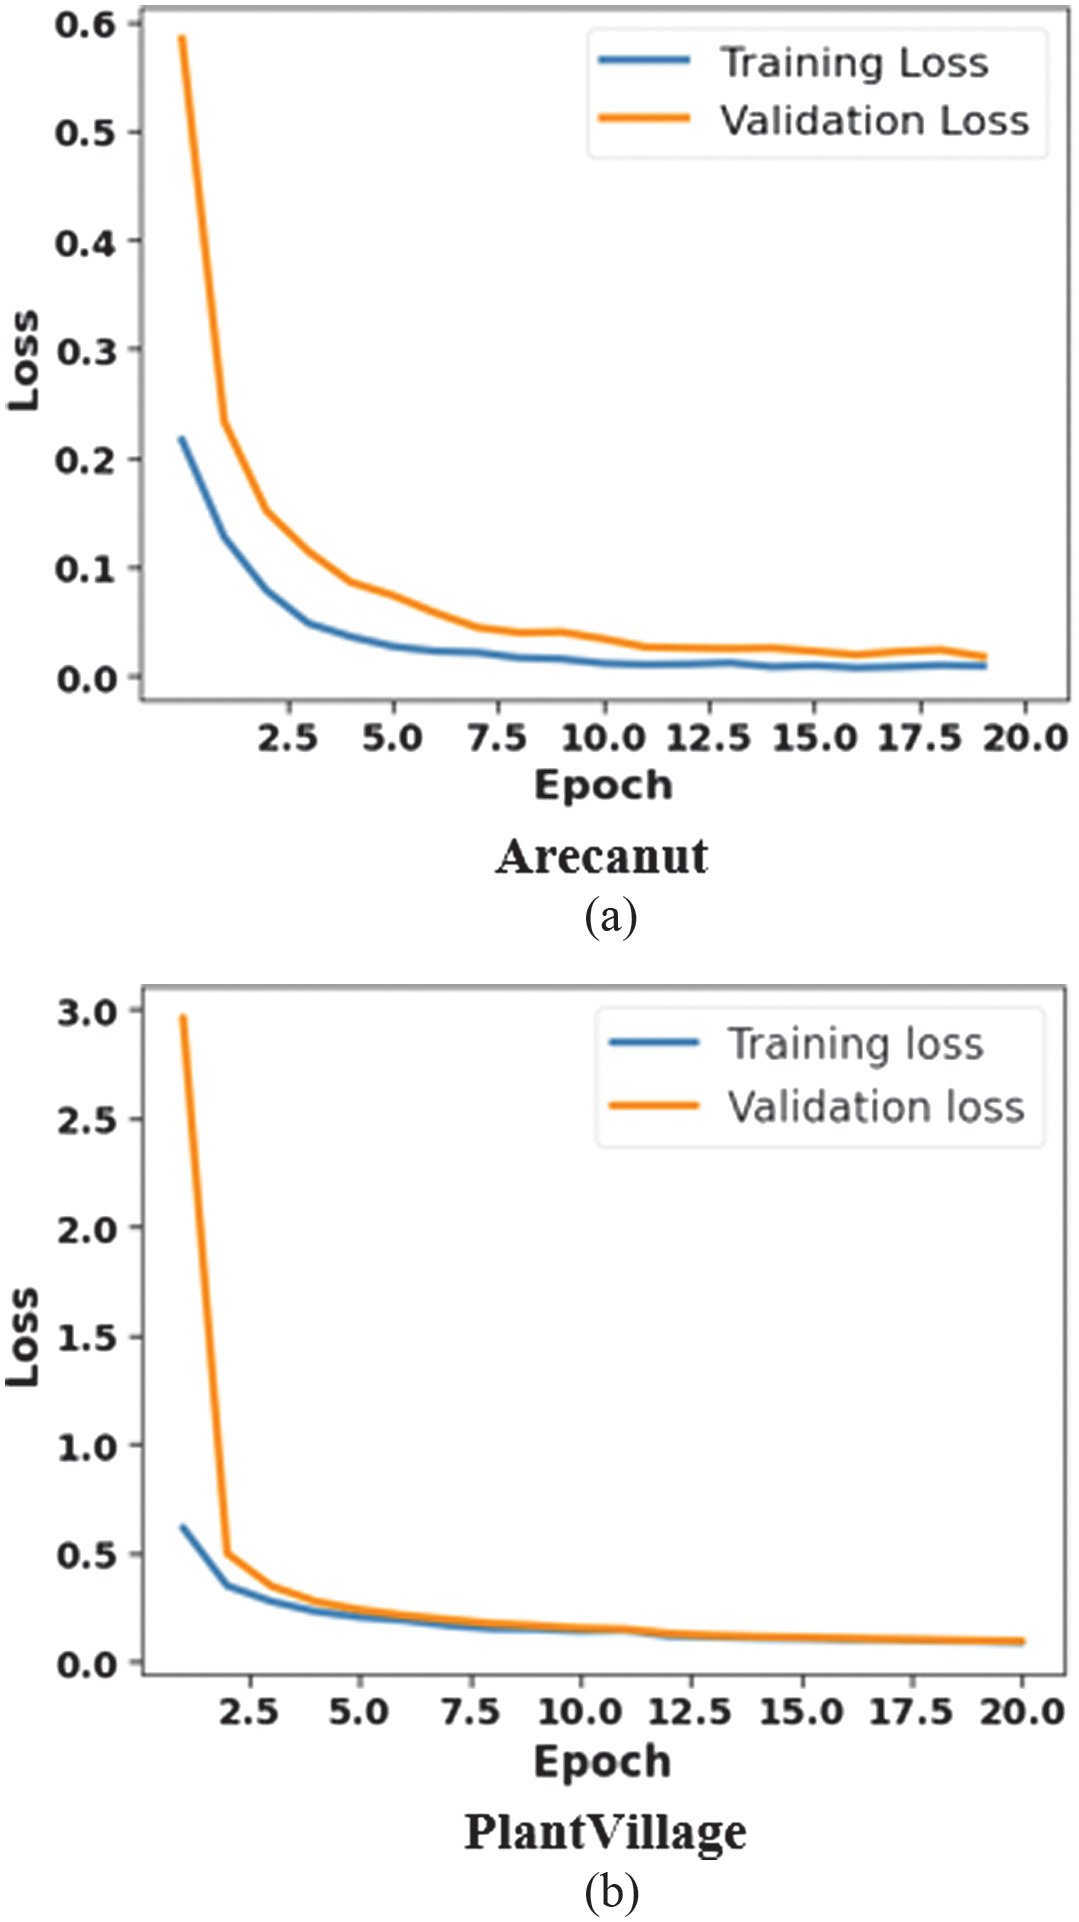 Fig. 5. Analysis of epoch vs loss for SK-DenseNet: 5(a) Areacanut dataset and 5(b) PlantVillage dataset.
Figure 6 represents the confusion matrix for the proposed method 6(a). Arecanut 6(b). PlantVillage dataset. The minimal misclassification determines the model’s ability to differentiate among various disease classes effectively. The PlantVillage dataset displays near-perfect performance which confirms the model’s robustness, whereas the high TP demonstrates effective generalization and feature learning abilities. These outcomes validate the proposed SK-DenseNet as a significant method for accurate plant disease classification.
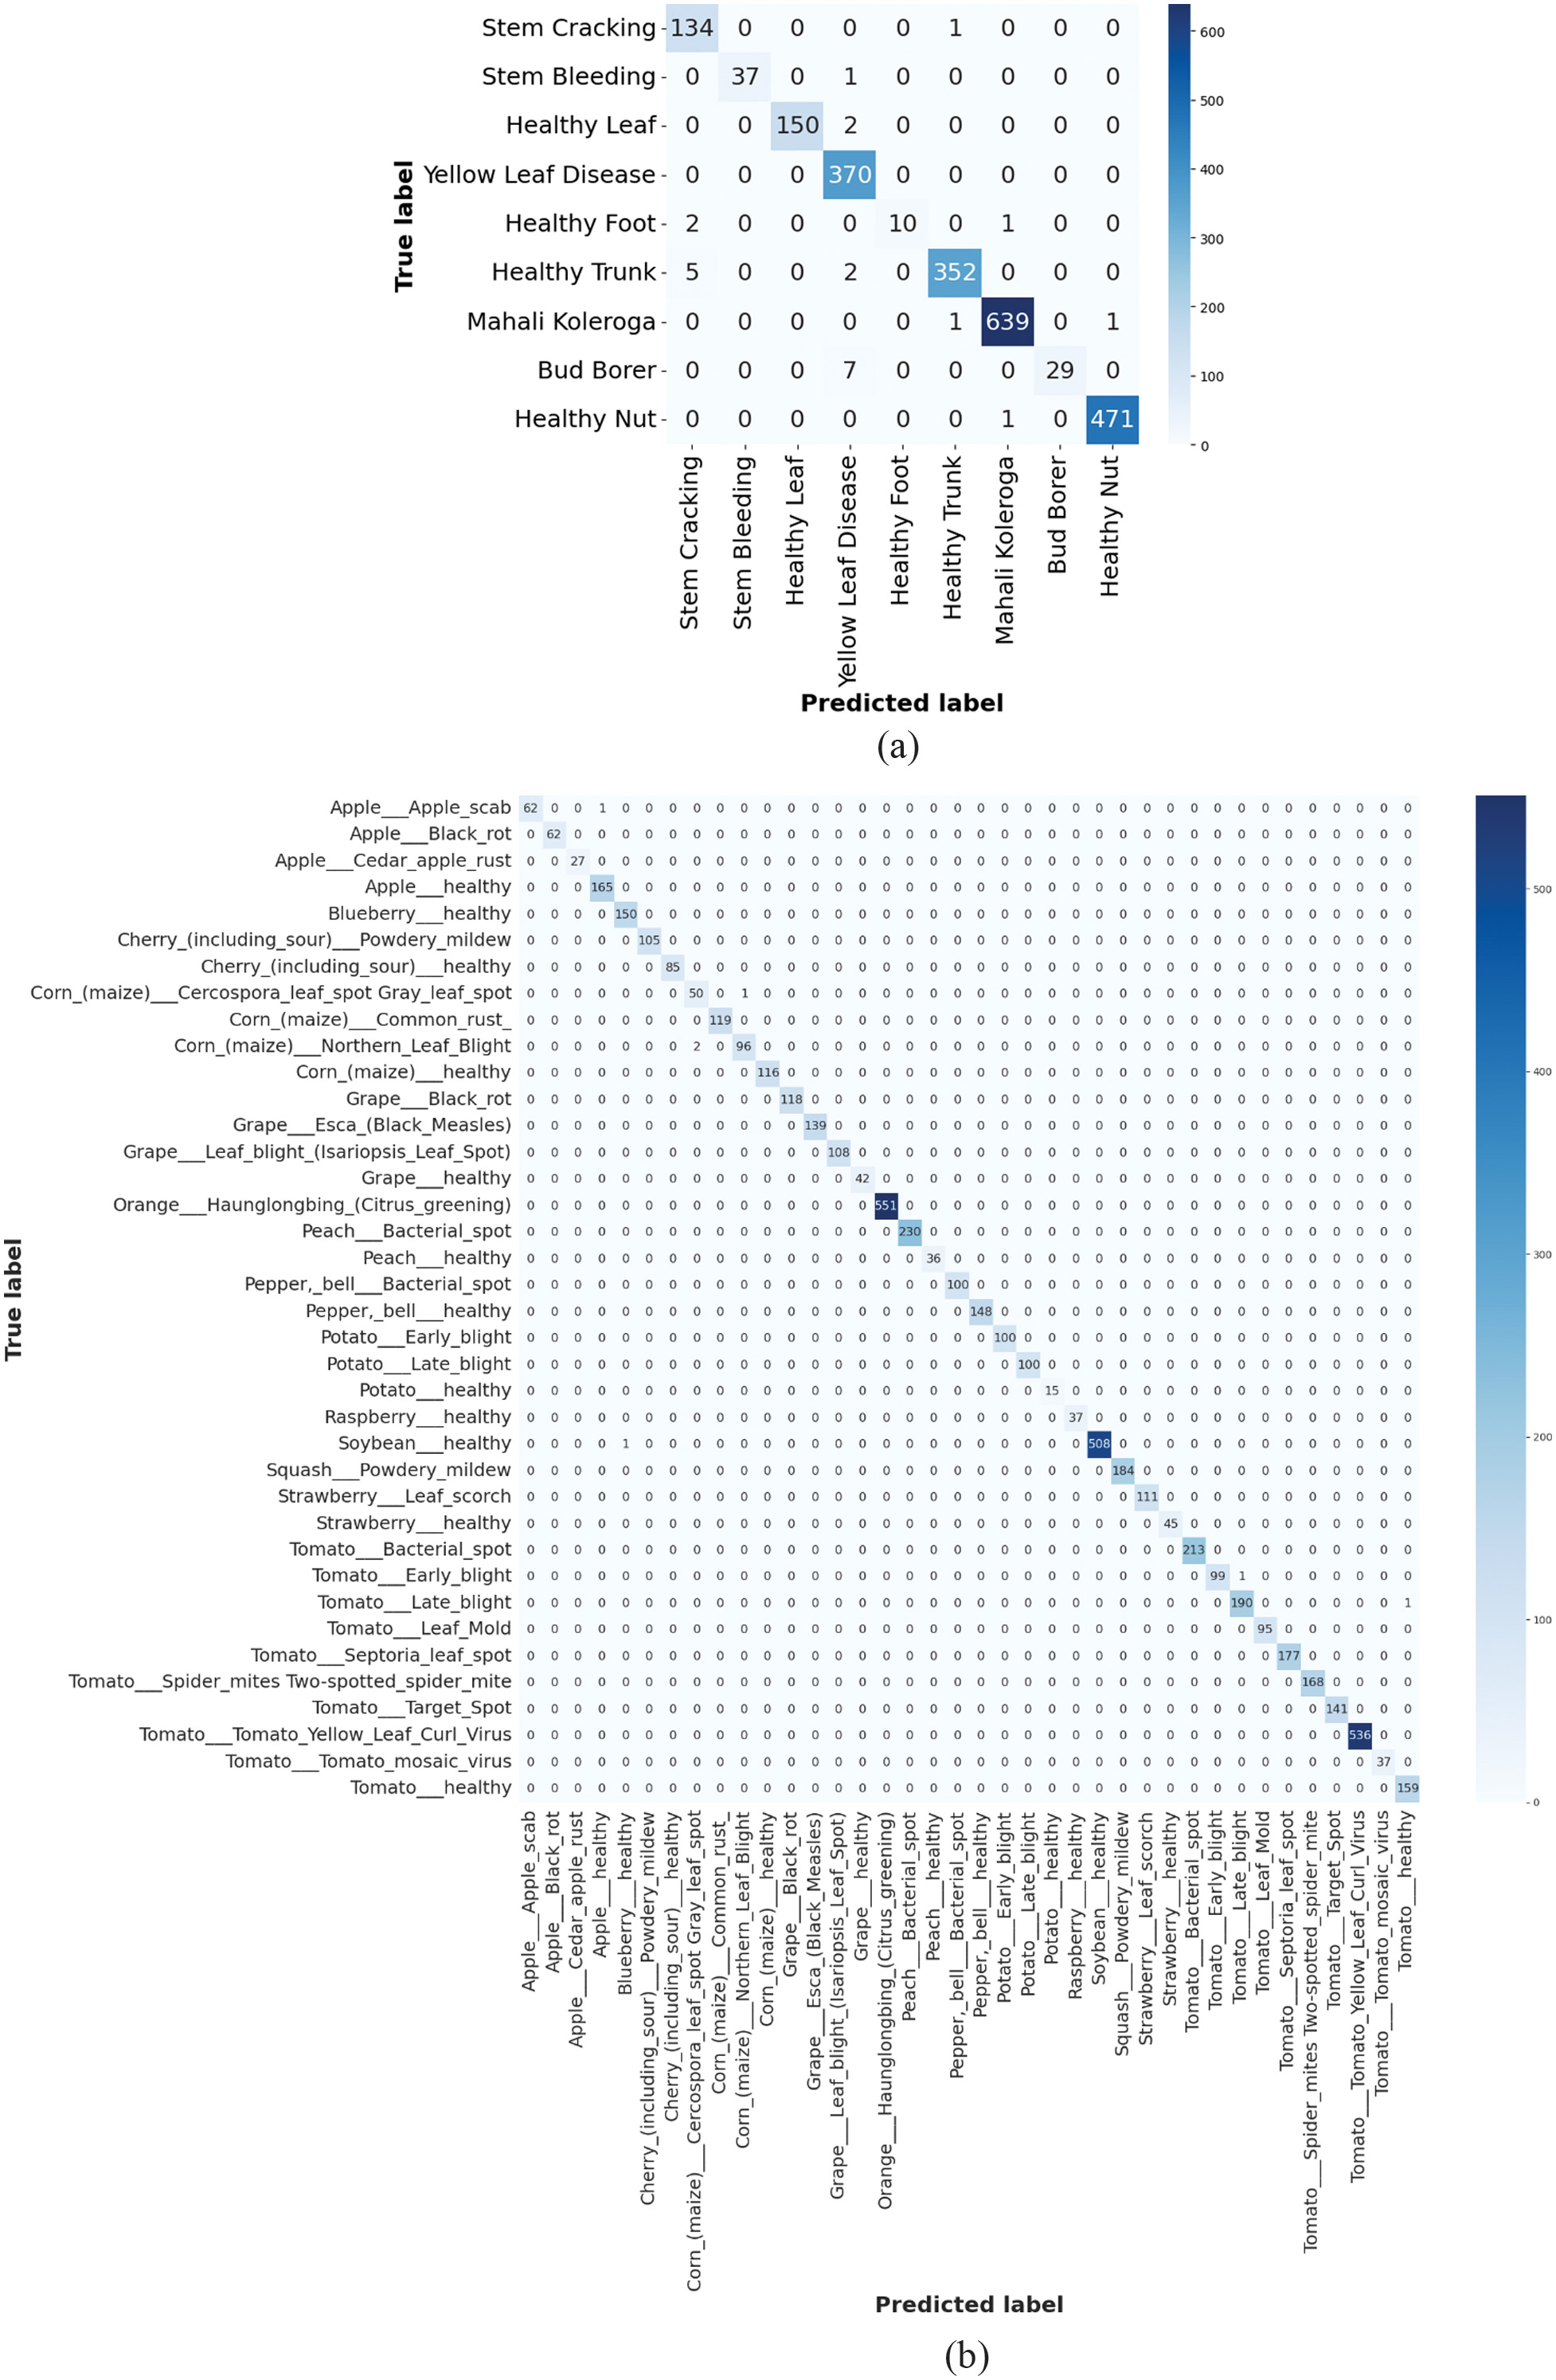 Fig. 6. Analysis of confusion matrix using SK-DenseNet: 6(a) Areacanut dataset and 6(b) PlantVillage dataset.
B.COMPARATIVE ANALYSIS
Table V determines the comparative analysis of existing methods. The existing methods like VGG19-ViT [19], AD-ENet [20], SE-SK-CapResNet [21], ECA-ResNet 34 [22], and MS-Net [23] are compared with the proposed SK-DenseNet. When compared with these methods, the proposed SK-DenseNet obtains a high accuracy of 99.99% and 98.92% on PlantVillage and Arecanut datasets by integrating a selective kernel method that makes it to adjust receptive fields in capturing disease-specific features.
Table V. Comparative analysis of existing techniques
| Methods | Dataset | Accuracy (%) | Precision (%) | Recall (%) | F1-score (%) |
|---|---|---|---|---|---|
| VGG19-ViT [ | PlantVillage | 98.81 | 98.72 | 98.76 | 98.73 |
| AD-ENet [ | PlantVillage | 99.91 | 99.87 | 99.81 | 99.84 |
| SE-SK-CapResNet [ | PlantVillage | 98.58 | 98.58 | 98.58 | 98.58 |
| ECA-ResNet 34 [ | Plant Village | N/A | N/A | 98.6 | 98.5 |
| MS-Net [ | PlantVillage | 99.80 | N/A | N/A | 99.80 |
| Proposed | PlantVillage | 99.99 | 99.99 | 99.99 | 99.99 |
| Arecanut | 98.92 | 98.98 | 94.48 | 96.43 |
The densely connected layers maximize feature reusage which leads to an effective gradient propagation and improved learning. The model extracts both global and local features effectively which makes it highly efficient in differentiating plant disease variations.
V.CONCLUSION
In this research, the SK-DenseNet was proposed to classify the Arecanut plant disease effectively. By integrating DenseNet with SK-Net, the model adjusted receptive fields in capturing broader patterns and fine-grained information to enable accurate classification of different diseases. The resizing and label encoding were applied in the preprocessing stage to ensure uniformity and convert categorical data into numerical data for better classification. Therefore, this study assisted to distinguish between diseased and healthy areas effectively. The experimental outcomes represented that the model’s superior performance achieved high accuracy of 99.99% and 98.92% on Arecanut and PlantVillage datasets when compared with existing methods like VGG19-ViT. This accuracy and robustness enabled the proposed SK-DenseNet as a significant method for Arecanut plant disease classification. This research had a significant impact on the agriculture domain, especially for Arecanut farmers. In the future, it will be extended to classify the diseases in other crops which can contribute to sustainable agricultural practices using the DenseNet with transformer model.
CONFLICT OF INTEREST STATEMENT
The author(s) declare that they have no conflicts of interest to report regarding the present study.
AUTHOR CONTRIBUTIONS
Conceptualization: PKPM and RML; methodology: PKPM; software: PKPM; validation: PKPM and RML; formal analysis: RML; investigation: PKPM; resources: PKPM; data curation: RML; writing—original draft preparation: PKPM; writing—review and editing: RML; visualization: RML; supervision: RML; project administration: RML; funding acquisition: PKPM.