I.INTRODUCTION
Diabetic retinopathy (DR) is a potentially blinding disorder associated with diabetes that is frequently observed in people with untreated diabetes. Timely and accurate diagnosis plays a vital role in effectively managing this condition. The advancement of DR can be tracked by observing retinal abnormalities, including exudates (EX), hemorrhages (HM), microaneurysms (MA), intra-retinal microvascular abnormalities (IRMA), and neovascularization (NV), as shown in Fig. 1. Based on the existence of particular retinal characteristics, DR can be classified as mild, moderate, severe, or proliferative [1]. The first stage, known as mild DR, is defined by the presence of hemorrhages, microaneurysms, and exudates in the retina. Moderate DR is distinguished by an increased number of hemorrhages and microaneurysms, along with venous bleeding and soft and hard exudates. The severe and proliferative stages of advanced DR can cause significant vision loss or even blindness if ignored. When DR is severe, the extent of retinal damage is accentuated, while in proliferative DR, the growth of new, abnormal blood vessels is highlighted. Over the years, the classification of DR has changed significantly, moving away from traditional image processing approaches due to the development of advanced machine learning and deep learning technologies [2]. DR classification using deep learning methods [3] has proven to be far more precise than typical machine learning techniques [4]. Recently introduced transformer models [5] for DR classification use attention mechanism to capture global contextual information from the retinal images. The combined strength of CNN-Transformer [6] can be used to capture local information using CNN and dependencies among the features using a transformer to enhance the disease grading of DR.
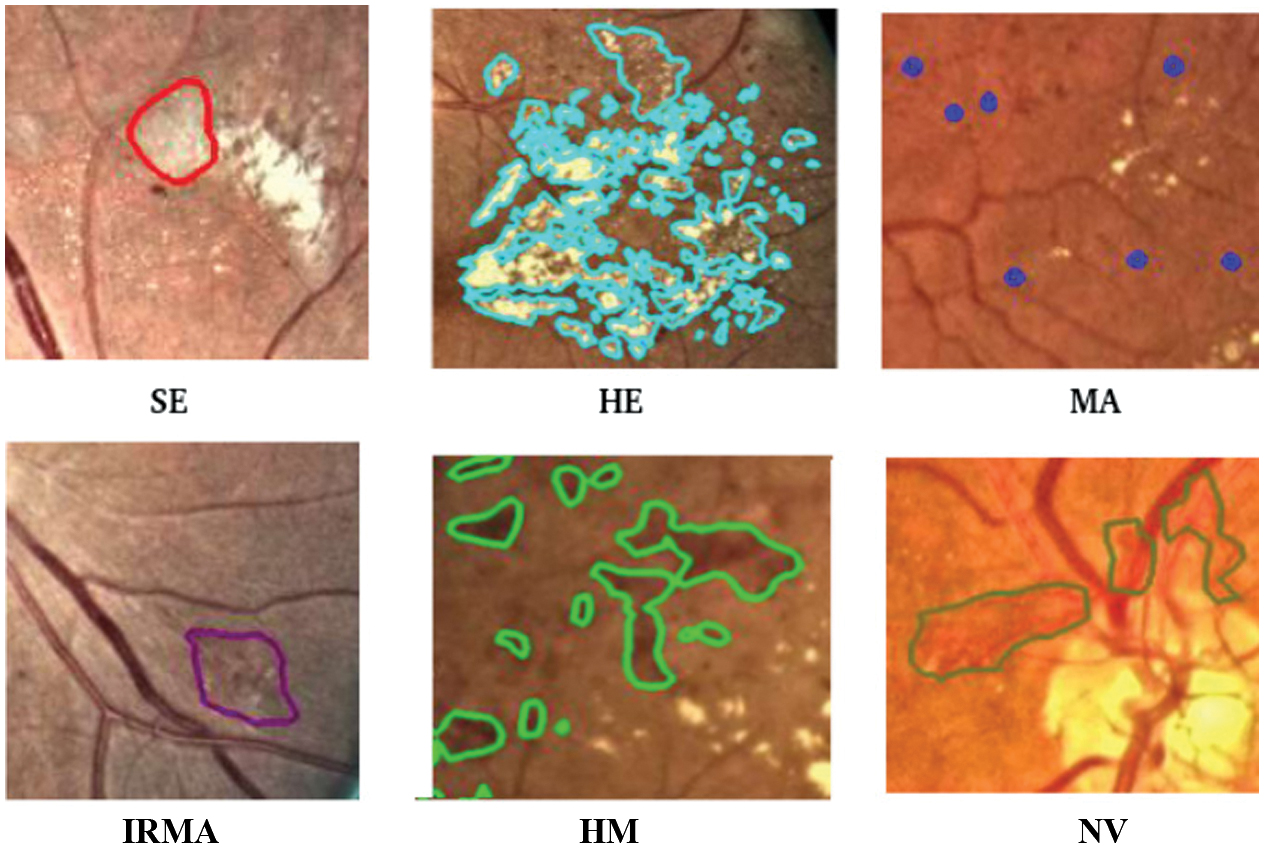 Fig. 1. Abnormalities of human retina.
By segmenting specific regions of retinal images, we can improve the precision of identifying and classifying different types of retinopathy, leading to a more accurate analysis. Segmentation-assisted classification in DR can be extremely difficult because of inconsistent annotations and a lack of training data. A powerful method for increasing the classification accuracy and precision of DR grading is pre-segmentation classification, in which image segmentation is employed as a precondition. Considering these findings, we propose a novel segmentation-assisted DR grading model.
The following are the principal contributions of the developed method:
- ○To develop a hybrid customized ResNet-ViT model for extracting features from both normal retinal images and segmented lesions.
- ○To identify and fuse maximally correlated features: unique features of segmented images and unique features of normal images using canonical correlation analysis (CCA) to create a more compact and informative retinal feature representation suitable for DR classification.
- ○To analyze the performance of ML classifiers that use the features from the fusion model and thus select the best model for DR grading.
The rest of the paper is structured as follows. Section II discusses related literature. Details of the datasets and methodology used in this study are presented in Section III, and the outcome and discussions are provided in Section IV. Section V concludes with findings and recommendations for further research.
II.LITERATURE REVIEW
Over the past decade, advancements in machine learning and deep learning have significantly contributed to the development of automated DR detection systems.
A.SEGMENTATION OF RETINAL LESIONS
Compared to conventional systems, deep learning gives superior performance in lesion localization, delivering both higher accuracy and speed. A compound scaling encoder–decoder network architecture was presented by Dewei Yi et al. [7] with the goal of improving the precision and effectiveness of microvascular lesion segmentation. For HE, MA, EX, and SE segmentation, the model obtained mean intersection over union (mIoU) scores of 23.36 % and 24.81 % on the test and validation sets, respectively. A semi-supervised multitask learning method [8] has been proposed to enhance DR segmentation performance by leveraging the widely accessible datasets such as Kaggle-EyePACS, fine-grained annotated diabetic retinopathy (FGADR), and IDRiD. A lesion-patch multiple instance learning method (LpMIL) with semantic constraint adaptation (LpSCA) [9] was proposed for lesion identification. Mean value of segmentation performance is 0.3963 on the FGADR dataset and is 0.4374 on EyePACS dataset. To accomplish precise and effective segmentation of different lesion types, BiSeNetV2 [10] employs a hybrid attention mechanism with ghost feature mapping, successfully addressing issues such as poor contrast and size variation. It performs better for MA lesions, with an IoU score of 0.57.
B.CLASSIFICATION OF DR
Different classes of DR have been successfully identified through the use of convolutional neural networks (CNNs) and other cutting-edge deep learning methods. Nazih et al. [11] proposed a ViT-based deep learning model that shows great promise for the accurate assessment of retinopathy severity using the FGADR dataset. The ViT model yielded identical results for its F1-score, accuracy, precision, and recall, each measuring 0.825. The Area Under the Curve (AUC) and specificity are 0.964 and 0.956, respectively. In [12], an ensemble model for DR detection is proposed that combines the ResNeXt and modified DenseNet101 architectures. The proposed method achieves an accuracy of 96.98% on the DIARETDB1 dataset. In the case of multi-class classification using the APTOS dataset, it attains an accuracy of 86.08%. A hybrid model utilizing SVMs, Random Forests, and Decision Trees was created for DR detection [13]. Features were extracted from the retinal images using three deep learning models: Inception ResNetV2, DenseNet121, and MobileNetV2. This model performed well on the APTOS dataset in both binary (98.36%) and multi-class (95.50%) classification. With the use of a decision tree-based ensemble learning algorithm, the research [14] describes a unique approach for diagnosing DR based on the gray-level intensity and texture characteristics retrieved from fundus images. This approach makes use of the XGBoost classification algorithm, which produces an F-measure of 93.51% and an accuracy of 94.20% on APTOS dataset. Ref. [15] introduced an ensemble of ResNet50, InceptionV3, Xception, DenseNet121, and DenseNet169, achieving an F1-score of 0.90 on the Kaggle dataset.
C.SEGMENTATION-ASSISTED CLASSIFICATION
A reliable method for identifying DR is provided by a synergistic approach that combines segmentation and classification. Deshmukh suggested a Unet-based segmentation technique [16] to identify relevant lesions in retinal images and is then used to extract statistical properties, such as area, skewness, mean, variance, kurtosis, entropy, and CNN features. The stated values for the accuracy, specificity, and sensitivity were 91.42%, 92.54%, and 90.54%, respectively. To classify the severity of DR, the approach [17] leverages the k-nearest neighbor technique after retinal image segmentation using the U-Net model, which achieves an accuracy of 82.96% on the Kaggle dataset. Ref. [18] provided a segmentation-assisted DR classification approach in which retinal NV was segmented using a fully convolution network, and the CNN was trained to classify DR.
The proposed system [19] consists of two interconnected deep learning models: an updated YOLOv3 for detecting and localizing DR lesions and CNN512 for classifying the entire image into one of five DR stages. This combined approach achieved an accuracy of 89%, a sensitivity of 89%, and a specificity of 97.3% on the DDR dataset. In order to segment data and classify DR, the method [20] integrates MobileNetv2 into the encoder portion of UNet and EfficientNetB0. The system that was designed achieves test accuracy of 91.2%. A cross-attention fusion [21] of retinal images and lesion map embedding increases the accuracy of DR detection. This work introduces Swin-Unet for lesion segmentation and attention method to integrate both lesion maps and original images for classification. This method uses FGADR and EyePAC dataset for lesion segmentation. In this study, EyePAC dataset for DR classification offers an accuracy of 94.6%. Ejaz et al. proposed a hybrid CNN with CCA-based feature fusion for retinal fundus analysis [30]. This method, validated on RFMiD 2.0 dataset, achieved 93.39% accuracy for DR, demonstrating high robustness and effectiveness.
D.FEATURE FUSION METHODS
Feature fusion, the process of combining data from various sources or modalities, is a crucial technique in medical image analysis, especially for complex diagnostic tasks like DR grading. A fusion method [22] that integrates fundus retinal images, optical coherence tomography, and electronic health records within a long short-term memory network. This multimodal fusion model, which makes use of local binary patterns (LBP), produced an outstanding AUC of 0.99, improving the detection of DR. By employing a two-stage preprocessing technique, Bibi et al. [23] suggested a computationally efficient and successful method for DR detection by extracting important diagnostic signs from fundus images. Several feature descriptors, including LBP and LTP, were employed, and it was shown that fused LBP and LTP features had a high classification accuracy of 96.6% on a local database when classified by a cubic kernel support vector machine (SVM).
III.METHODOLOGY
This section introduces a multi-stage segmentation-assisted classification system for DR grading, as illustrated in Fig. 2. The overall framework is composed of three sections: 1) preprocessing and segmentation, 2) feature extraction using customized ResNet-ViT, and 3) feature fusion of normal retinal images and segmented lesions using CCA and ML classifications.
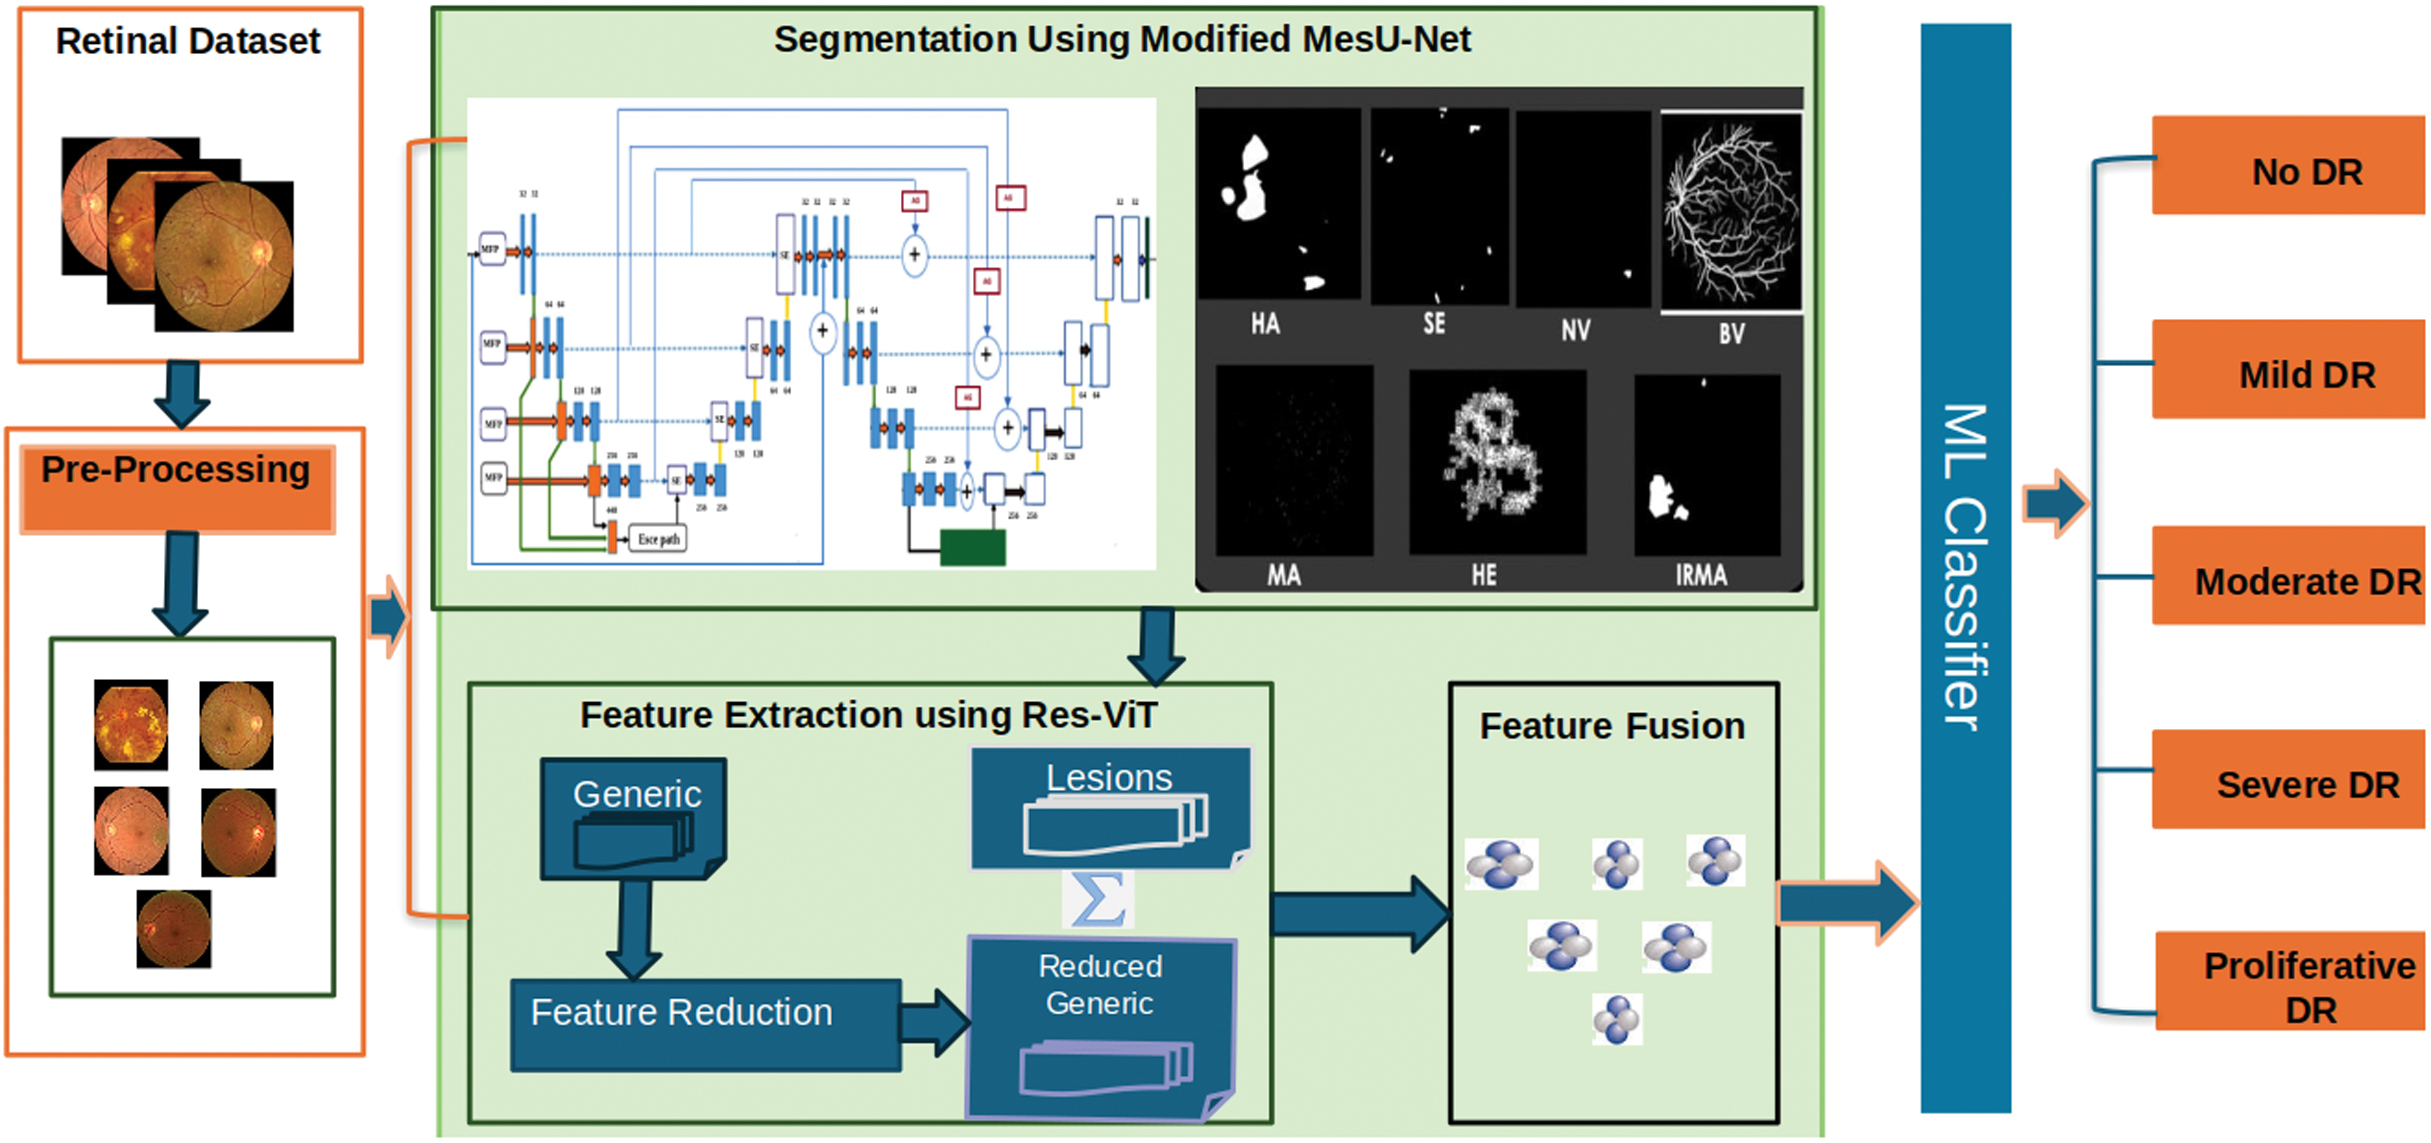 Fig. 2. Proposed architecture.
A.PREPROCESSING AND SEGMENTATION OF RETINAL LESIONS
Effective preprocessing of input data is essential for performance optimization in automated segmentation and classification applications. Segmentation is necessary to increase the accuracy of DR grading systems. However, traditional segmentation-assisted classification methods require datasets that include annotated lesions in addition to DR severity classifications. Although the classification data lack annotations for specified labels, the segmentation data lack lesion labels, which is addressed by the FGADR dataset [24], and offers a useful resource. It contains labels for DR severity that match the segmented lesions in images. FGADR is a large-scale, elaborately annotated DR dataset containing approximately 2842 images. Of these, 1842 images contained fine-grained annotations for specific lesions related to DR such as MA, HM, HE, SE, IRMA, and NV. Dataset distribution with classification/grading of images (0—No DR, 1—mild DR, 2—moderate DR, 3—severe DR, and 4—proliferative DR) in the segmentation set is shown in Fig. 3.
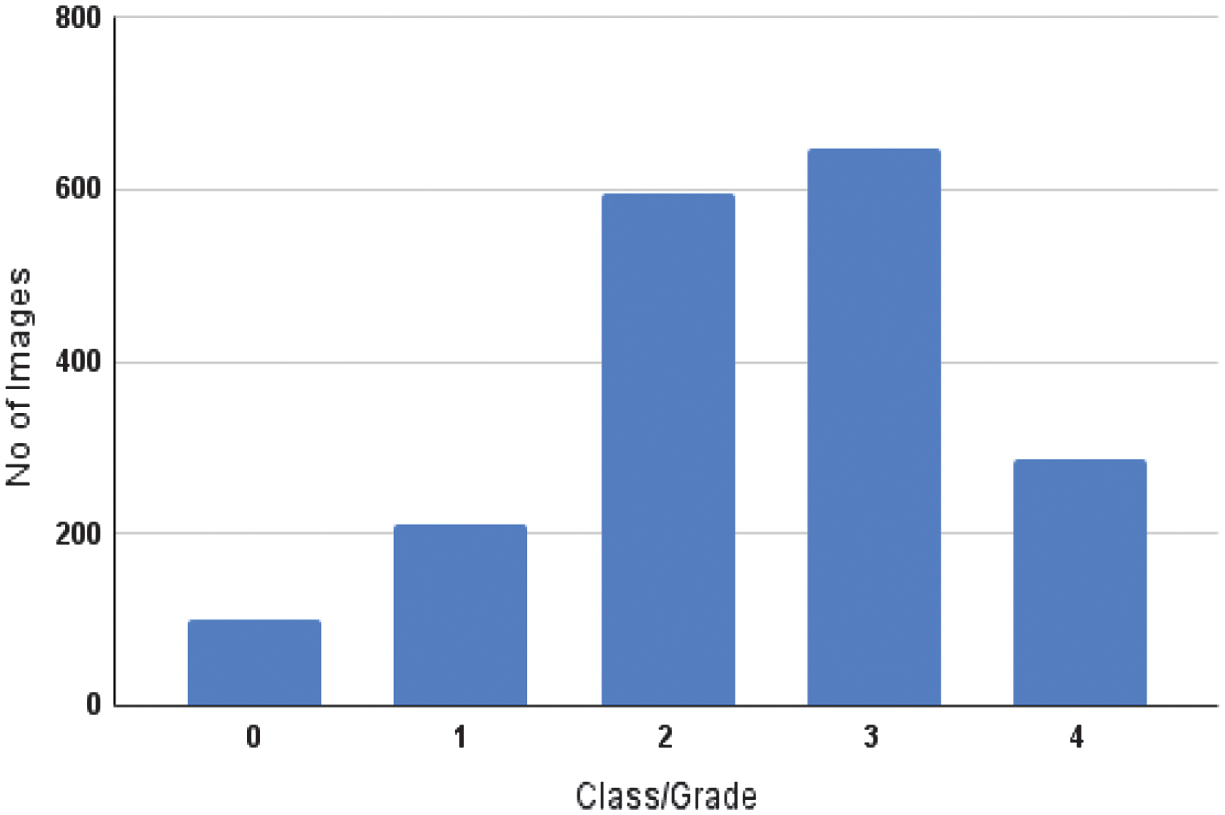 Fig. 3. Class-wise distribution of the dataset.
An anisotropic diffusion filter [25,26] was used in the images to denoise without losing significant structural information. Stability factor of 0.1 preserves edges and noise suppression. A medium value of diffusion weight 20 was selected empirically upon testing range 10–30 to preserve micro-lesion boundaries with diminished background noise. Reduction of smoothing is regulated by iteration count. Fifty iterations were found to be the most effective method since they eliminated background artifacts while maintaining the lesions’ morphological integrity. All the images were then resized uniformly to 256 × 256 pixels to meet the model input requirements. Handling class imbalance was accomplished by only applying data augmentation to the minority classes. This method allowed for increasing underrepresented category sample sizes, reducing bias toward majority classes, and improving average model performance. It involved horizontal and vertical flipping, and rotation of up to 15 degrees. The models’ flexibility and generalization abilities were then further enhanced by the use of data augmentation approaches such as vertical flips with a probability of 0.2, horizontal flips with a probability of 0.5, and rotations applied with a probability of 0.3. The preprocessed and augmented images were then fed into the subsequent segmentation and classification models.
We developed a cascaded segmentation framework, which is the modified version of MesU-Net [27], as shown in Fig. 4 for the segmentation of retinal lesions. This architecture can be used to segment lesions such as MA, HM, HE, SE, IRMA, and NV using the FGADR dataset. By directly concatenating retrieved multi-scale features with the encoder feature maps, this network explicitly captures multi-scale semantic information. This allows the network to leverage both fine-grained details and broader contextual cues simultaneously. The decoder pathway is incorporated with a channel attention mechanism. This module assists the network in automatically focusing on the most valuable feature map channels in a dynamic manner. This ensures that pertinent information is efficiently transferred and used for accurate segmentation mask reconstruction, bridging semantic gaps between the encoder and decoder pathways.
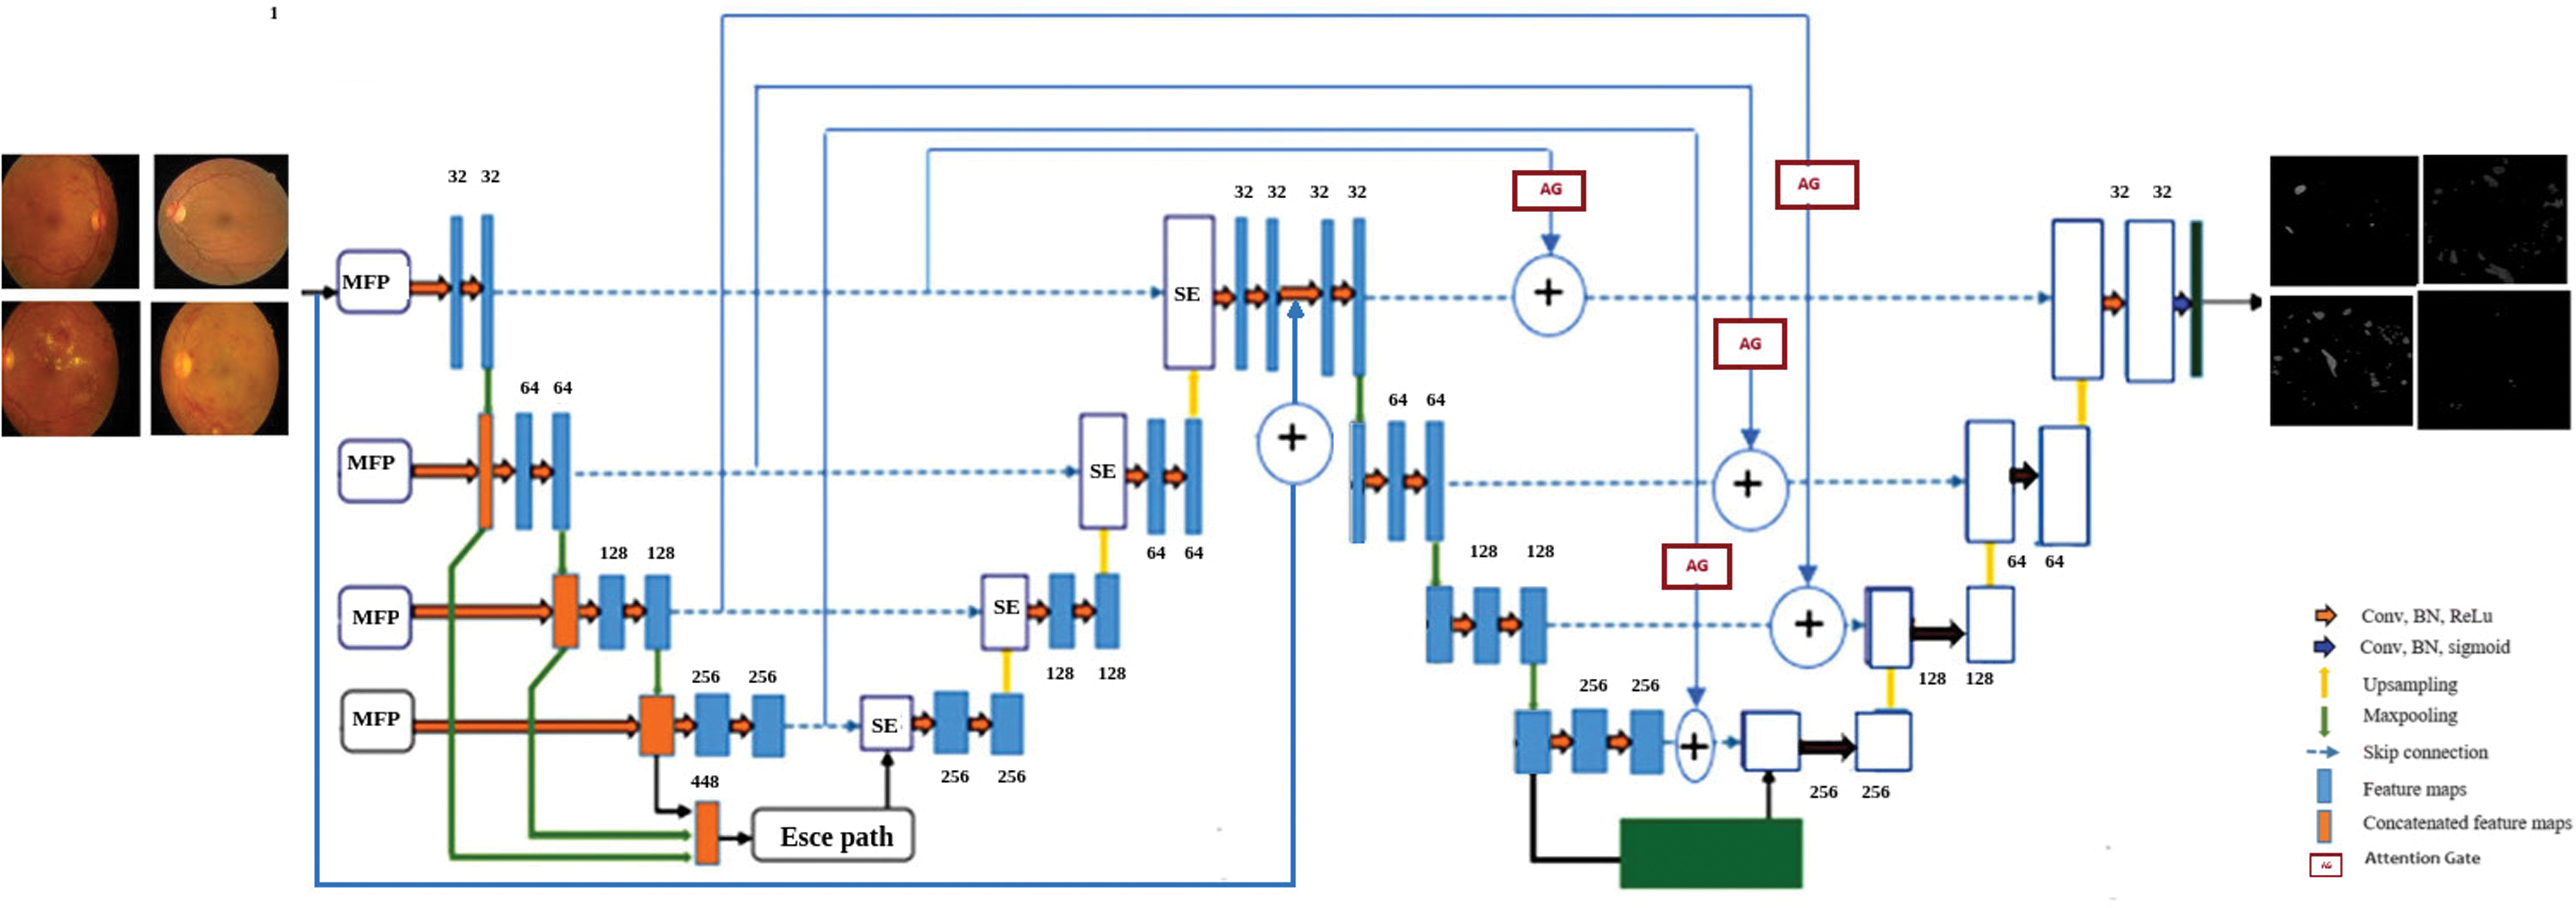 Fig. 4. Modified MesU-Net architecture.
A key innovation lies in the cross-attention skip connection mechanism to refine the output of the second U-Net. These gates selectively channel relevant multi-scale features from MES-Net encoder directly to the second U-Net’s decoder, guiding precise pixel-level adjustments. The model uses a hybrid loss function that combines binary cross-entropy and the Dice coefficient for optimization. A fixed threshold of 0.5 was applied to generate binary masks. The network’s final layer then applies a 1 × 1 convolution and a sigmoid activation function to generate a single-channel output mask, producing a refined probability map for lesion presence.
B.FEATURE EXTRACTION USING ResNet-ViT MODEL
Traditional CNN models [28] frequently have limitations in their capacity to capture global contextual information and long-range relationships within fundus images because of their relatively small receptive fields. The strengths of both architectures are successfully combined in hybrid CNN-ViT models, which also address CNNs’ inherent limitations in this area by incorporating ViTs’ capacity to capture long-range contextual information and global dependencies through self-attention mechanisms. A ResNet-ViT hybrid architecture is used in the proposed approach to address this, combining a pretrained CNN (ResNet50) with a customized ViT model for thorough feature extraction.
The first step is to use the ResNet50 backbone to process the input fundus images. With each channel focusing on identifying distinct patterns such as edges, textures, or complex patterns, its convolution layers effectively extract low level and hierarchical spatial information. High-level abstract characteristics that summarize the visual content are efficiently encoded by the ResNet50 output feature map, which is usually of shape (batch_size, 7, 7, 2048) for a 224 × 224 × 3 input image. The pretrained ResNet50 model was initially implemented with its layers frozen to support in learning and minimize overfitting. The ResNet50 is frozen, so its weights are not updated during training. This 4D feature map is then converted into a sequence of learnable tokens suitable for the transformer encoder.
Specifically, each of the 7x7 spatial locations in the ResNet50 feature map contributes a 2048-dimensional feature vector, resulting in 49 such vectors. These 4D feature maps are reshaped into a 3D sequence of tokens, which is then processed by a trio of Vision Transformer blocks. The blocks are trainable, meaning their weights will be updated during the training process. Within these blocks, multi-head self-attention mechanisms are employed to capture global dependencies and long-range relationships across all 49 tokens, enabling the model to focus on both localized and broad contextual aspects. Nonlinear activation functions, such as GELU, are employed to enhance feature representation. In addition, layer normalization is used in every block to guarantee training stability. The features extracted by the final ViT block represent a rich, contextualized representation of the retinal image. These robust features are subsequently utilized for the classification of DR. By fusing the effective local feature extraction capability of CNNs with the global contextual awareness of ViTs, this integrated approach provides strong performance.
Several pretrained CNN models and standalone ViT architectures were used in our comparative studies for feature extraction and classification. For feature extraction, the results clearly show that the ResNet-ViT network performed better than the other models under investigation. The highest accuracy of 97.6% for DR grading was attained by the ResNet-ViT when combined with an SVM classifier. MesU-Net and ResNet-ViT training details are shown in Table I. The proposed model consists of 100.4 million trainable parameters, requires approximately 3.4 GB of memory, with the inference time is about 157 ms per image, making it suitable for clinical applications. The effectiveness of the proposed hybrid approach has been proven by its improved performance, which further demonstrates promising for reliable and accurate DR classification.
Table I. Training details of proposed model
| Hyper parameter | Modified MesU-Net | ResNet-ViT |
|---|---|---|
| Learning Rate | .0004 | .0004 |
| Optimizer | Adam | AdamW |
| Batch size | 32 | 32 |
| Early Stopping | monitor=val-accuracy,patience=5 | monitor=val-accuracy, patience=10 |
| Seed | 42 | 42 |
| GPU | NVIDIA Tesla V100,32 GB NVIDIA Tesla T4,16 GB | NVIDIA A100-SXM4,40 GB |
C.FEATURE FUSION AND ML CLASSIFICATION
The feature fusion module increases the accuracy of DR grading by merging features from segmented lesions and normal retinal images. Principal component analysis (PCA), which removes redundant features while retaining the most informative ones, is used to refine the features that ResNet-ViT extracts from normal retinal images. Using these optimized features along with the features derived from segmented lesions are fused using the CCA method [29] as shown in Fig. 5. The purpose of this method is to provide a more robust and selective feature representation for DR grading by carefully utilizing the complementary information found in both modalities. CCA is used as a feature-level fusion technique because it captures correlations between modalities and generates maximally correlated projections. The segmented dataset features provide a local perspective, whereas the normal dataset features provide a global context. By connecting these related elements of information, it produces a more robust representation than either feature set could on its own. It identifies the components that are most associated and combines them together. Additionally, special characteristics from both sets are incorporated to the final fused set. In this paper, CCA was utilized for feature fusion since it efficiently brings two different feature sets into alignment within a common subspace where their correlation is maximized. In this way, corresponding complementary information from both the original retinal images and lesion-based features can be utilized jointly, and redundancy is minimized while dimensionality is reduced relative to the use of a simple concatenation. Even though CCA is a linear method, in this paper, it is used on ResNet-ViT-extracted features, which are themselves already nonlinear and highly expressive. This implies that the initial conversions have already abstracted out intricate relationships in the data, and CCA is primarily concerned with correlating and combining the two representations in a correlated subspace [30]. This is especially relevant when dealing with high-dimensional features from deep networks, since a complicated, nonlinear fusion layer would easily overfit to the training set. So, the linearity of CCA does not really restrict its usefulness here, since it acts upon nonlinear embeddings instead of raw image data.
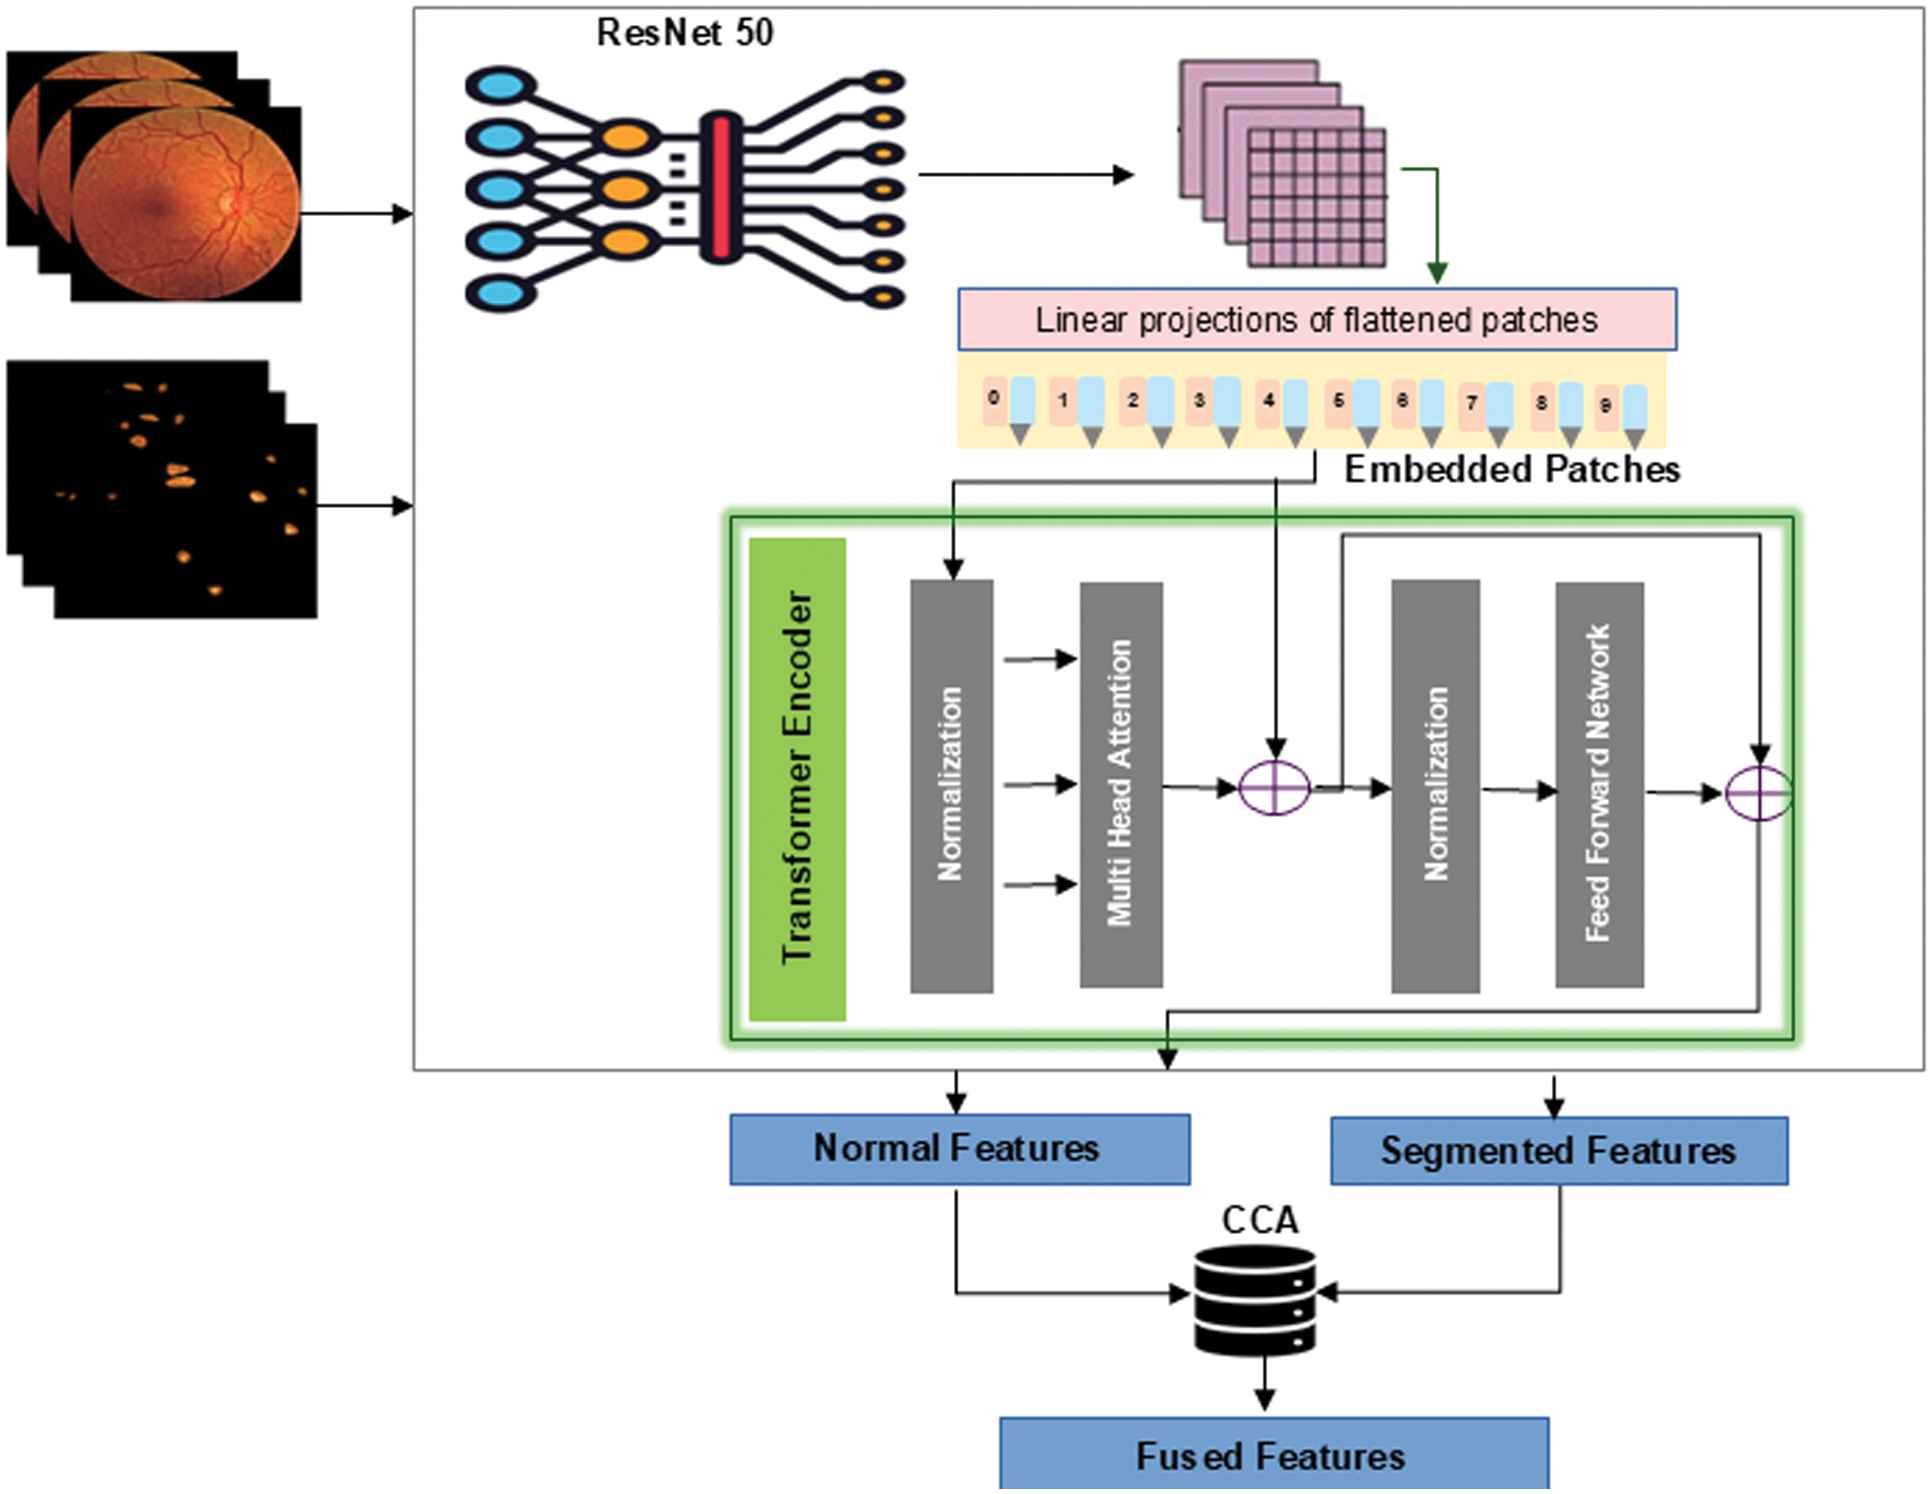 Fig 5. Feature extraction using ResNet-ViT and feature fusion using CCA.
The feature fusion algorithm using CCA is described in Algorithm 1. To choose the optimal number of components for CCA, a cross-validation approach was used to prevent overfitting. The model was trained using different component settings (16, 32, and 64) on the training set, and its performance was assessed on a separate validation set by computing the canonical correlations. Among these, 64 components were chosen, as this configuration yielded the highest generalization capability to unseen data. Fused features are given to various ML classifiers such as Random Forest, K-Nearest Neighbour, XGBoost, and SVM. Among these, SVM provides a promising result that outperforms traditional methods and provides a more accurate and reliable diagnosis of DR. The radial basis function kernel was employed in the SVM model, which relied on the regularization parameter’s default value. Ablation study of various fusion techniques along with an SVM classifier is shown in Table II.
Algorithm 1: Feature Fusion Using CCA
| 1. Initialize PCA model P with kp components. |
| P ← PCA(n_components = kp) |
| 2. Reduce the dimensionality of Xn': |
| Xn'' ← P.fit_transform(Xn') |
| 3. Initialize CCA model C with kc components. |
| C ← CCA(n_components = kc) |
| 4. Fit CCA model on Xs' and Xn'':C.fit(Xs', Xn'') |
| 5. Transform features into canonical variates: |
| U ← C.transform(Xs'),V ←C.transform(Xn'') |
| 6. Extract unique features: |
| Uuniq from Xs', Vuniq from Xn'' |
| 7. Concatenate canonical and unique features: |
| F ← [U | V | Uuniq | Vuniq] |
Table II. Ablation study of fusion techniques for diabetic retinopathy classification using SVM
| Sl.No | Fusion techniques | Accuracy of fused set (ResNet-ViT + SVM) |
|---|---|---|
| 1. | Concatenation | 93% |
| 2. | Gated Fusion | 79% |
| 3. | Max. Fusion | 88.3% |
| 4. | Cross Attention | 77% |
| 5. | Canonical Correlation Analysis | 97.6% |
IV.RESULTS & DISCUSSION
This section discusses in detail the experimental evaluation models and a segmentation-assisted classification approach. Moreover, the effectiveness of fusing features from both segmented and normal images is assessed using machine learning classifiers.
A.SEGMENTATION OF RETINAL LESIONS
Retinal image segmentation has been done in this study using deep neural networks like the modified MesU-Net, which combines MES-Net and U-Net. Segmentation result of modified MesU-Net is presented in Fig. 6. Performance indicators of these models are presented in Table III. Model performance was measured with the Dice coefficient, IoU, sensitivity, specificity, and pixel-level accuracy. The ablation study demonstrated in Table IV shows that the modifications were crucial for enhancing the model’s ability to concentrate on key features and achieve precise segmentation. The segmented image masks, which are the segmentation model’s output, are then fed into the ResNet-ViT model for feature extraction, demonstrating a multistage pipeline in which segmentation refines inputs for further analysis. This model shows an IoU score of 0.662 and a dice coefficient of 0.797 for exudates detection. There is still a dearth of training data for NV and IRMA. Low IoU scores and other subpar results are the result of the model’s inability to correctly learn the complex patterns and variations in IRMA and NV with small sample sizes. MesU-Net with an attention mechanism and inter-stage fusion achieved a mean IoU of 0.63, while the variant with only the attention mechanism also performed competitively with a mean IoU of 0.62.
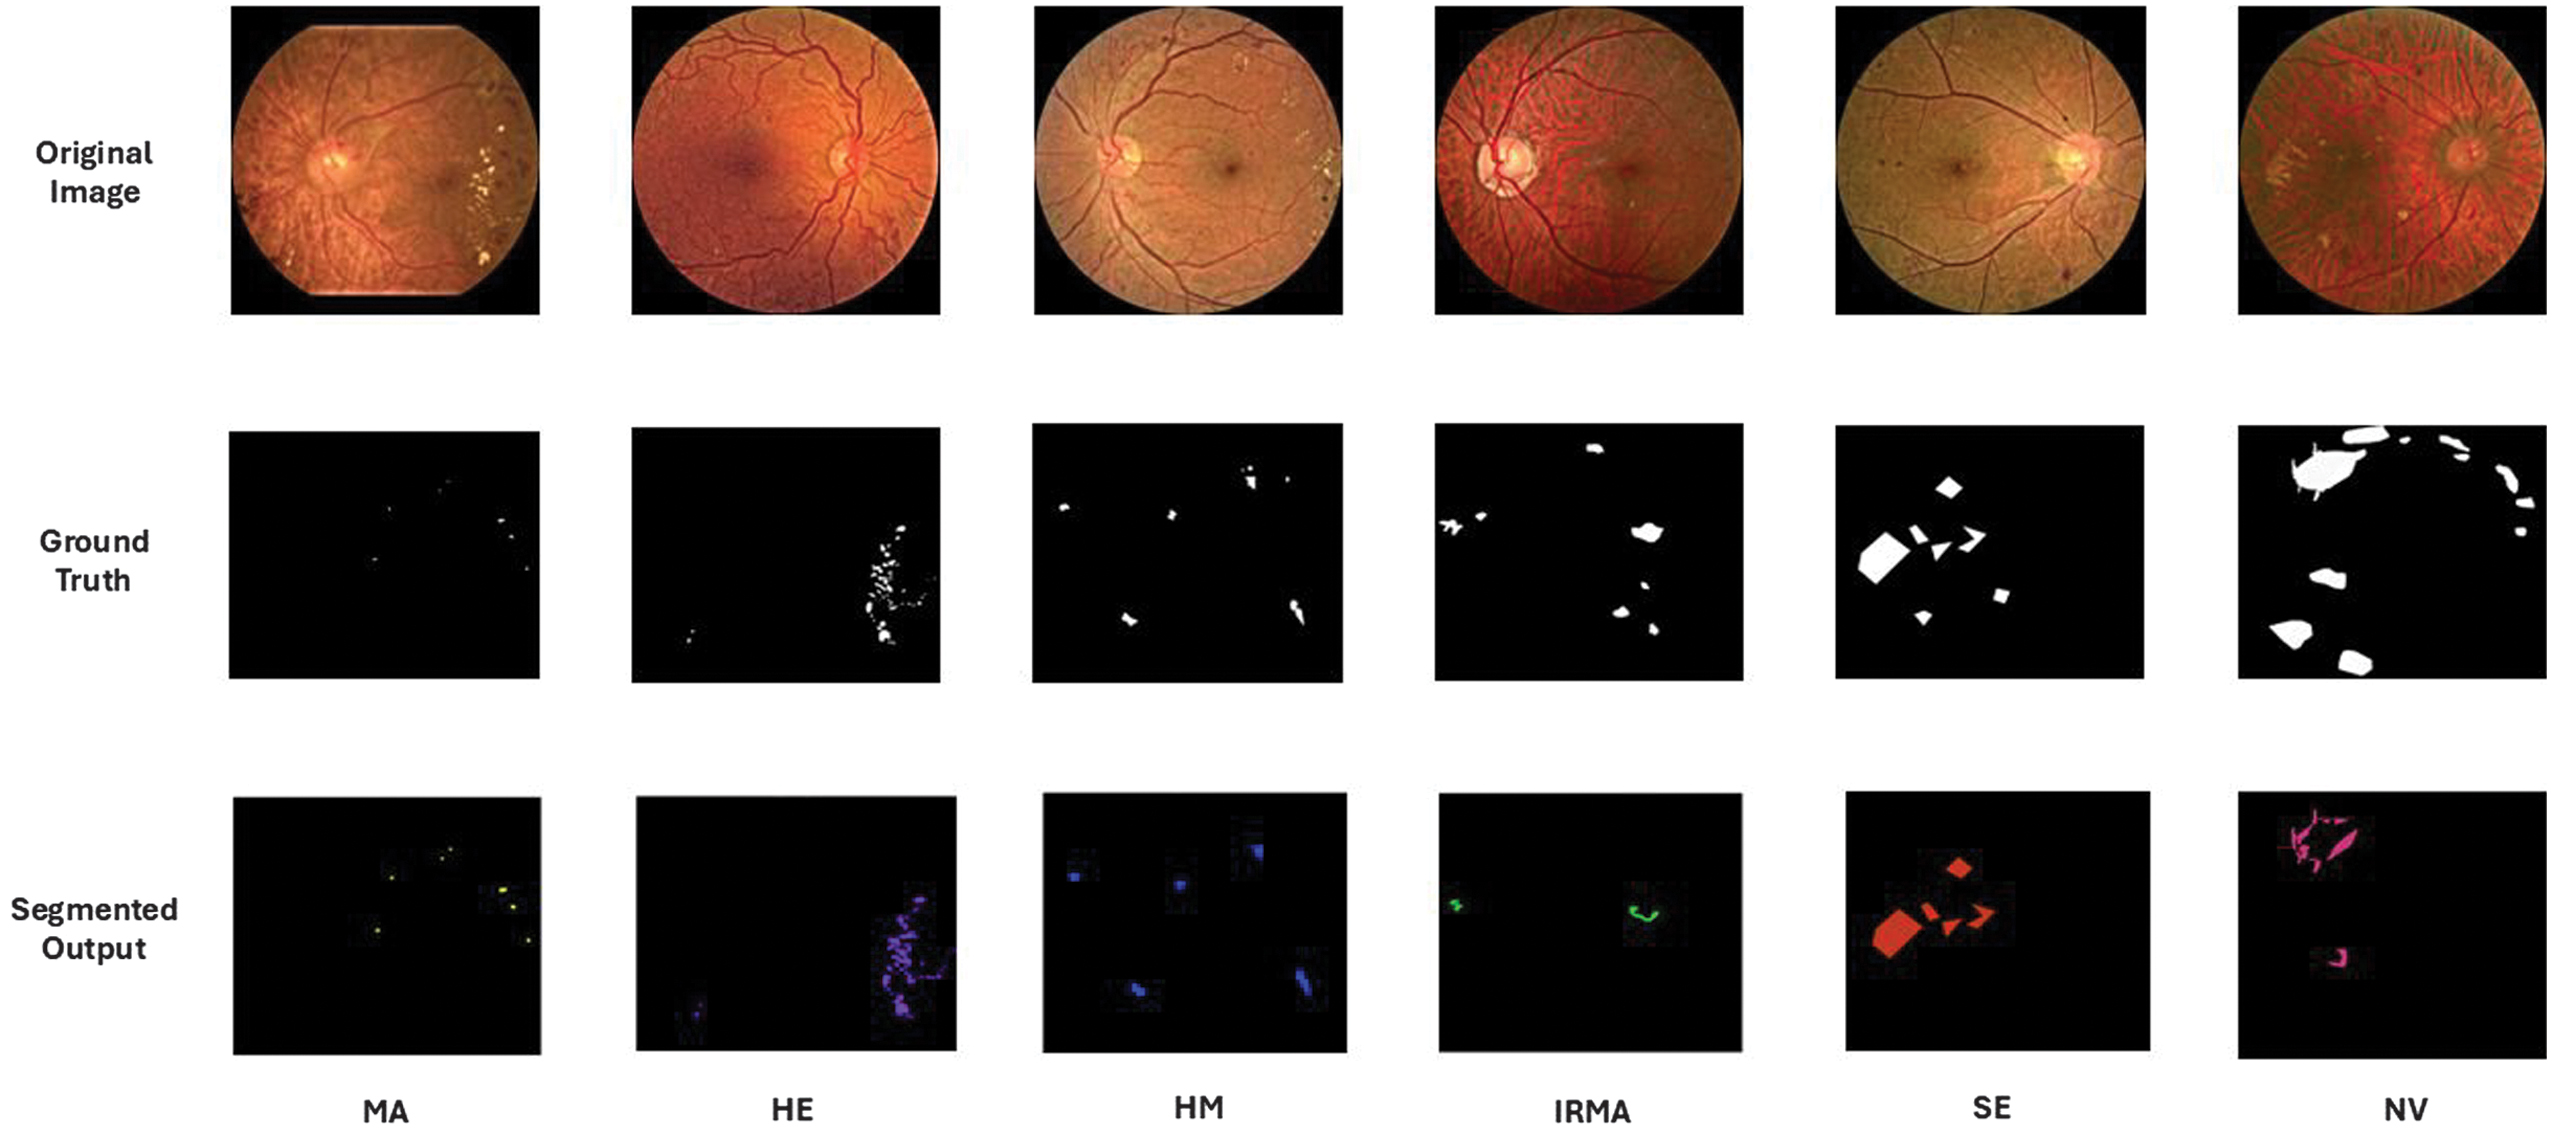 Fig. 6. Segmented lesions across different grades of diabetic retinopathy.
Table III. Performance metrics of different segmentation models
| Model | MA | HM | ||||||||
|---|---|---|---|---|---|---|---|---|---|---|
| AC | Dice | IoU | SE | SP | AC | Dice | IoU | SE | SP | |
| U-Net | 0.790 | 0.592 | 0.424 | 0.793 | 0.892 | 0.899 | 0.660 | 0.493 | 0.901 | 0.903 |
| Mes-Net | 0.846 | 0.653 | 0.485 | 0.853 | 0.891 | 0.902 | 0.712 | 0.553 | 0.902 | 0.903 |
| MesU-Net | 0.877 | 0.705 | 0.514 | 0.899 | 0.903 | 0.923 | 0.743 | 0.591 | 0.935 | 0.946 |
| U-Net | 0.897 | 0.628 | 0.458 | 0.921 | 0.943 | 0.911 | 0.699 | 0.537 | 0.917 | 0.922 |
| Mes-Net | 0.924 | 0.732 | 0.577 | 0.943 | 0.967 | 0.956 | 0.731 | 0.576 | 0.961 | 0.973 |
| MesU-Net | 0.947 | 0.763 | 0.617 | 0.946 | 0.959 | 0.966 | 0.763 | 0.617 | 0.976 | 0.984 |
| U-Net | 0.785 | 0.635 | 0.465 | 0.798 | 0.813 | 0.719 | 0.693 | 0.531 | 0.812 | 0.834 |
| Mes-Net | 0.802 | 0.693 | 0.530 | 0.841 | 0.852 | 0.802 | 0.718 | 0.560 | 0.818 | 0.867 |
| MesU-Net | 0.895 | 0.724 | 0.577 | 0.899 | 0.902 | 0.893 | 0.732 | 0.590 | 0.891 | 0.895 |
Table IV. Ablation study of MesU-Net with AG and fusion enhancements
| Model | MA | HM | HE | SE | IRMA | NV | mean | ||||||
|---|---|---|---|---|---|---|---|---|---|---|---|---|---|
| Dice | IoU | Dice | IoU | Dice | IoU | Dice | IoU | Dice | IoU | Dice | IoU | IoU | |
| MesU-Net+Inter stage fusion | 0.73 | 0.58 | 0.78 | 0.60 | 0.75 | 0.66 | 0.77 | 0.62 | 0.73 | 0.57 | 0.73 | 0.58 | 0.60 |
| MesU-Net+AG | 0.76 | 0.61 | 0.77 | 0.63 | 0.75 | 0.65 | 0.80 | 0.66 | 0.74 | 0.58 | 0.75 | 0.60 | 0.62 |
| MesU-Net+AG + Inter stage fusion | 0.77 | 0.62 | 0.78 | 0.63 | 0.80 | 0.66 | 0.80 | 0.66 | 0.74 | 0.60 | 0.75 | 0.60 | 0.63 |
B.SEGMENTATION-ASSISTED DR GRADING
Segmented images were provided to the pretrained models for classification, resulting in higher accuracy compared with classification without segmentation. The performance of the pretrained models with and without segmentation was assessed, and the precision, recall, accuracy, and F1 score of each model were computed and are shown in Table V. Among all models, ResNet50 performed better than the others. To classify both normal and segmented retinal images, transformer-based models like ViT and ResNet-ViT were used in addition to pretrained networks. After feature extraction using deep learning models such as ResNet50 and ResNet-ViT, DR grading was done using conventional machine learning classifiers.
Table V. Performance metrics across models for DR feature grading
| FGADR Dataset without Segmentation | ||||||||
|---|---|---|---|---|---|---|---|---|
| CNN | Without augmentation | With augmentation | ||||||
| Accuracy | Precision | Recall | F1-score | Accuracy | Precision | Recall | F1-score | |
| VGG16 | 68.1 | 0.68 | 0.68 | 0.68 | 71.3 | 0.72 | 0.71 | 0.72 |
| Efficient Net B5 | 67.9 | 0.68 | 0.67 | 0.68 | 69.5 | 0.69 | 0.70 | 0.69 |
| Inception V3 | 67.1 | 0.67 | 0.67 | 0.67 | 69.1 | 0.68 | 0.69 | 0.70 |
| Inception ResNet V2 | 70.8 | 0.71 | 0.70 | 0.71 | 72.5 | 0.72 | 0.71 | 0.72 |
| DenseNet121 | 71.5 | 0.72 | 0.71 | 0.72 | 73.7 | 0.73 | 0.72 | 0.73 |
| ResNet 50 | 72.9 | 0.72 | 0.72 | 0.73 | 75.6 | 0.75 | 0.76 | 0.76 |
| VGG16 | 72.9 | 0.72 | 0.71 | 0.72 | 74.9 | 0.75 | 0.74 | 0.73 |
| Efficient Net B5 | 70.8 | 0.70 | 0.71 | 0.71 | 71.8 | 0.70 | 0.71 | 0.72 |
| Inception V3 | 68.4 | 0.68 | 0.68 | 0.68 | 69.9 | 0.69 | 0.70 | 0.69 |
| Inception ResNet V2 | 72.1 | 0.72 | 0.71 | 0.72 | 73.6 | 0.73 | 0.72 | 0.74 |
| DenseNet121 | 74.4 | 0.74 | 0.75 | 0.75 | 76.3 | 0.75 | 0.76 | 0.76 |
| ResNet 50 | ||||||||
Comparison of classification accuracy of normal and segmented images is provided in Table VI. Segmentation-assisted classification strategies provide an improvement of approximately 5% in the classification accuracy of DR without segmentation. The proposed grading method for DR includes a lesion segmentation using the modified MesU-Net and feature extraction using the ResNet-ViT model. Both normal retinal images and segmented lesions were fed into the ResNet-ViT model to extract features from each image. The features obtained from the normal images were reduced using PCA with a variance of 90%. The reduced features were combined with the extracted features of the segmented lesions using different fusion strategies, such as concatenation, attention-based fusion, recursive elimination, and CCA. Among them, CCA performed well, with the number of components set to 64.
Table VI. Comparison of classification accuracy of normal and segmented images
| Model | Normal image accuracy | Segmented image accuracy | ||
|---|---|---|---|---|
| ResNet50 | 72.9 % | 75.6% | 77.4 % | 79.5% |
| ViT | 65.4% | 68.9% | 69.9% | 71.2% |
| ResNet-ViT | 68.7% | 70.2% | 72.2% | 73.4% |
| ResNet50 + SVM | 74.8 % | 77.4% | 78.1 % | 79.4% |
In this fusion, after transformation of the reduced normal and segmented retinal feature sets are concatenated, a fused set is created. These combined features were divided into 60% for training, 20% for testing, and 20% for validation, and fed into various machine learning classifiers such as KNN, Random Forest, XGBoost, and SVM for DR grading. For feature fusion, segmentation masks were carefully created using just the training dataset in order to prevent data leaks and to give a precise representation of model performance based on the model’s capacity to generalize new data. This methodology, which integrates lesion segmentation with classification, proved to be effective in terms of performance matrices. The advantages of multi-source information were demonstrated by comparing the classification accuracy of the SVM classifier across three feature inputs: segmented lesions, normal images, and a combination of both (fused features).
A comparison of the accuracies of these three different features is shown Fig. 7. We evaluated the performance of several popular machine learning algorithms, such as Random Forest, KNN, XGBoost, and SVM, in the classification of the proposed study using the dataset with fused features. Each of these classifiers was trained using the fused features. Also accuracy, precision, recall, and F1-score for each class from class 0 to class 4 are calculated. A fivefold cross-validation was carried out on the baseline and proposed models, with the outcomes summarized in Table VII.
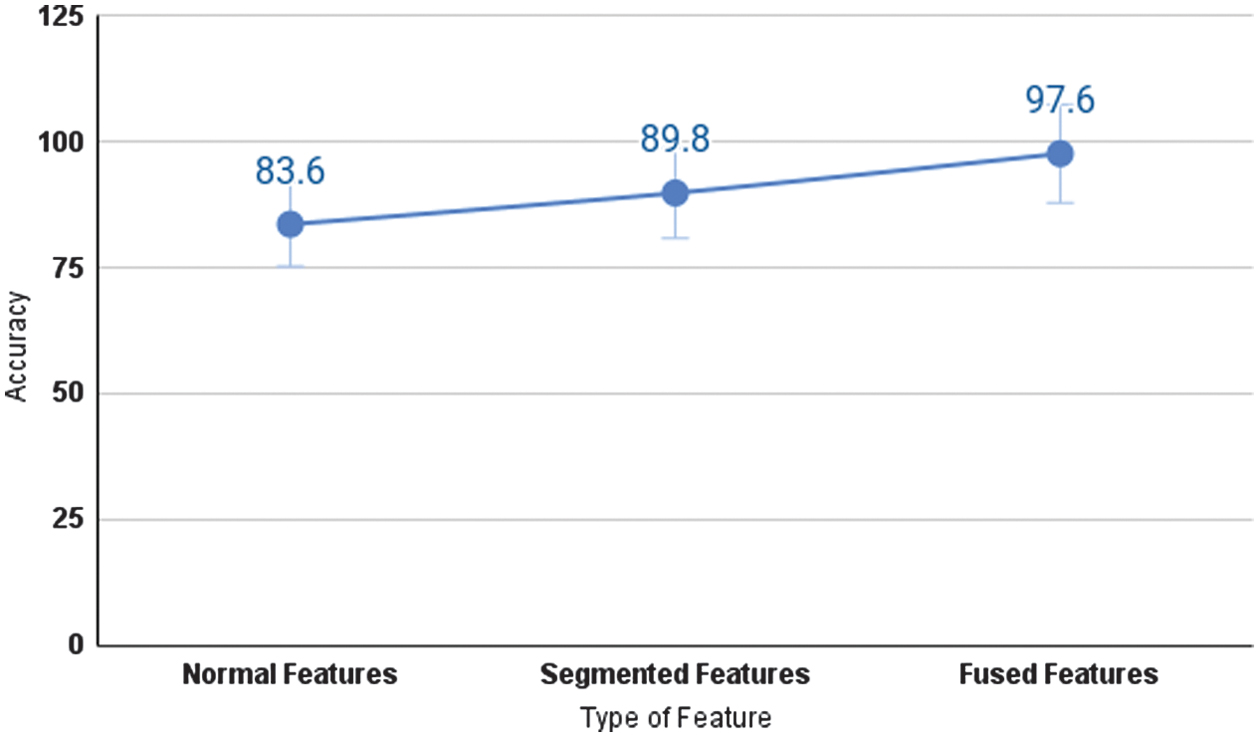 Fig. 7. Performance of the proposed model in terms of classification accuracy.
Table VII. Performance of segmentation-assisted classification of DR
| Random Forest (RF) | K-Nearest Neighbors (KNN) | ||||||||
|---|---|---|---|---|---|---|---|---|---|
| Class | Accuracy | Precision | Recall | F1-score | Class | Accuracy | Precision | Recall | F1-score |
| 0 | 0.98 ± 0.24 | 0.98 + 0.23 | 0.98 ± 0.23 | 0.98 ± 0.24 | 0 | 0.95 ± 0.07 | 0.95 ± 0.34 | 0.96 ± 0.66 | 0.95 ± 0.34 |
| 1 | 0.96 ± 0.64 | 0.95 ± 0.33 | 0.98 ± 0.24 | 0.96 ± 0.66 | 1 | 0.92 ± 0.09 | 0.86 ± 0.05 | 0.98 ± 0.24 | 0.91 ± 0.31 |
| 2 | 0.89 ± 0.47 | 0.97 ± 0.27 | 0.81 ± 0.24 | 0.88 ± 0.45 | 2 | 0.89 ± 0.48 | 0.91 ± 0.34 | 0.90 ± 0.43 | 0.91 ± 0.32 |
| 3 | 0.89 ± 0.45 | 0.89 ± 0.47 | 0.89 ± 0.48 | 0.89 ± 0.47 | 3 | 0.93 ± 0.42 | 0.93 ± 0.44 | 0.93 ± 0.43 | 0.93 ± 0.43 |
| 4 | 0.95 ± 0.25 | 0.93 ± 0.43 | 0.98 ± 0.24 | 0.95 ± 0.34 | 4 | 0.94 ± 0.34 | 0.95 ± 0.33 | 0.94 ± 0.34 | 0.94 ± 0.38 |
| 0 | 0.97 ± 0.28 | 0.96 ± 0.55 | 0.99 ± 0.11 | 0.97 ± 0.26 | 0 | 0.97 ± 0.26 | 0.98 ± 0.02 | 0.99 ± 0.07 | 0.99 ± 0.11 |
| 1 | 0.97 ± 0.29 | 0.97 ± 0.29 | 0.97 ± 0.26 | 0.97 ± 0.27 | 1 | 0.97 ± 0.27 | 0.98 ± 0.21 | 0.97 ± 0.31 | 0.98 ± 0.22 |
| 2 | 0.85 ± 0.23 | 0.93 ± 0.42 | 0.78 ± 0.17 | 0.85 ± 0.23 | 2 | 0.96 ± 0.63 | 0.96 ± 0.64 | 0.95 ± 0.42 | 0.96 ± 0.62 |
| 3 | 0.80 ± 0.20 | 0.91 ± 0.31 | 0.71 ± 0.18 | 0.80 ± 0.21 | 3 | 0.90 ± 0.31 | 0.91 ± 0.02 | 0.90 ± 0.31 | 0.90 ± 0.31 |
| 4 | 0.93 ± 0.42 | 0.91 ± 0.32 | 0.96 ± 0.63 | 0.93 ± 0.39 | 4 | 0.98 ± 0.23 | 0.97 ± 0.27 | 0.98 ± 0.23 | 0.98 ± 0.24 |
A focused ablation study that assesses PCA and CCA’s distinct contributions to the proposed approach is shown in Table VIII. The statistical significance of the performance improvements was evaluated using paired t-tests, and the corresponding results are reported in Table IX. The SVM classifier achieved consistently high F1-scores across multiple classes, with no DR (0.99), mild DR (0.98), and proliferative DR (0.98), indicating strong classification performance. It implies that the learning mechanism and features of the SVM are ideal for modeling the patterns associated with these particular classes. The precision and recall of moderate and severe cases were slightly lower than those of the other classes. This could occur because the lesion characteristics of these stages fluctuate slightly, which can cause feature overlap and make differentiation more challenging. In spite of these difficulties, the SVM classifier performed exceptionally well, achieving micro average accuracy of 97.6% and a kappa score of 0.963. The learning curve of SVM classifier is presented in Fig. 8.
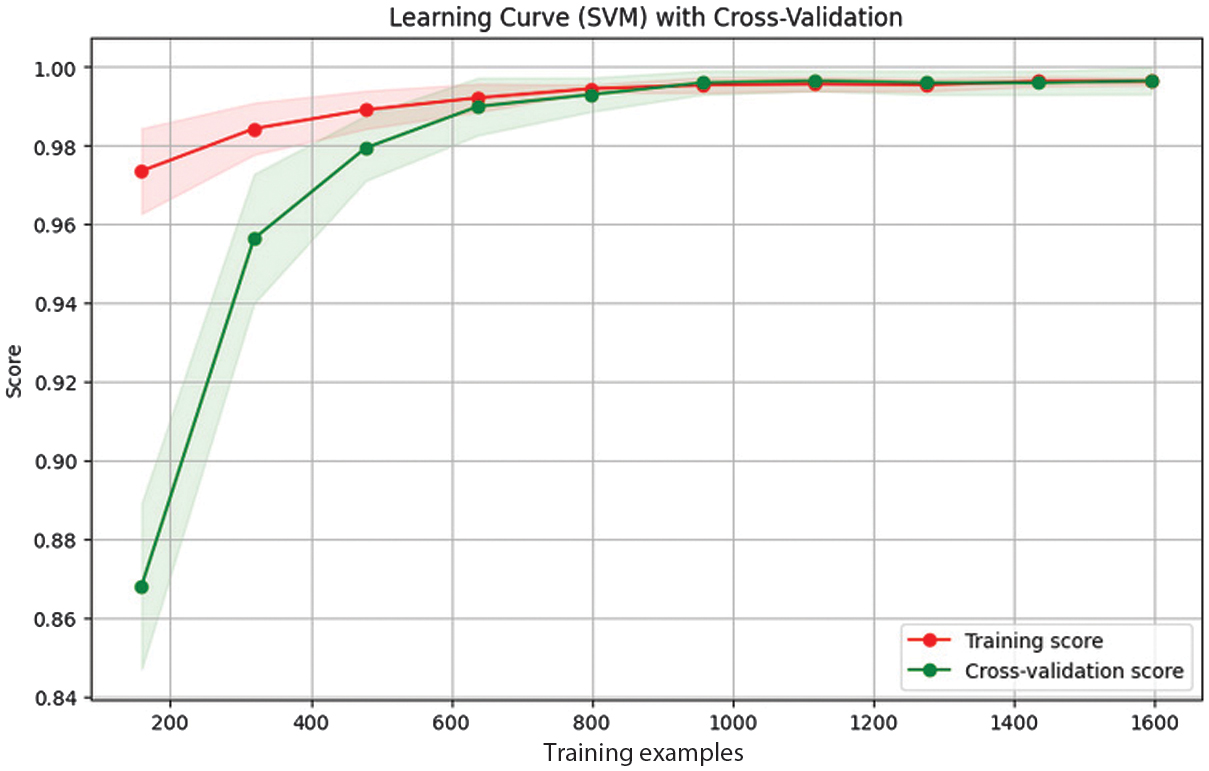 Fig. 8. Learning curve of the SVM model trained on fused features.
Table VIII. Ablation study of classification of DR using feature fusion pipeline
| Model | PCA | CCA | Accuracy |
|---|---|---|---|
| ResNet50 | No | No | 79.5% |
| ViT | No | No | 71.2% |
| ResNet-ViT | No | No | 73.4% |
| ResNet50 + SVM | No | Yes | 83.6% |
| ResNet-ViT + SVM | No | Yes | 93.1% |
| ResNet50 + SVM | Yes | Yes | 87.4% |
| ResNet-ViT + SVM | Yes | Yes | 97.6% |
Table IX. T-test result of baseline and proposed model
| Model | P-value | T-statistic |
|---|---|---|
| ResNet-ViT + CCA + SVM, ResNet-ViT + SVM | 0.00000013 | −17.32219 |
| ResNet-ViT, ResNet-ViT + SVM | 0.0000002 | −22.313278 |
Among these classifiers, SVM performed well. Due to the class imbalance, the model’s performance was also evaluated using macro-averaging. This approach revealed strong, consistent performance across all classes, achieving a macro-averaged precision of 0.967, a recall of 0.968, and an F1-score of 0.967.
High AUC values (which range from 0.90 to 0.99 for all classes in the Receiver Operating Characteristic (ROC) analysis) support this finding and show how effectively the model distinguishes between different DR severity levels. ROC curve for macro and micro AUC is presented in Fig. 9. Per class ROC curve and confusion matrix are also presented in Fig. 10 and Fig. 11, respectively. The most notable performance limitation of the model is its compromised discriminative capability between moderate (Class 2) and severe (Class 3) DR. The confusion matrix substantiates this specific failure mode, showing that nine true severe cases were misclassified as moderate. Furthermore, two severe cases were incorrectly downgraded to mild (Class 1). The performance comparison of proposed method with various state-of-the-art methods is presented in Table X.
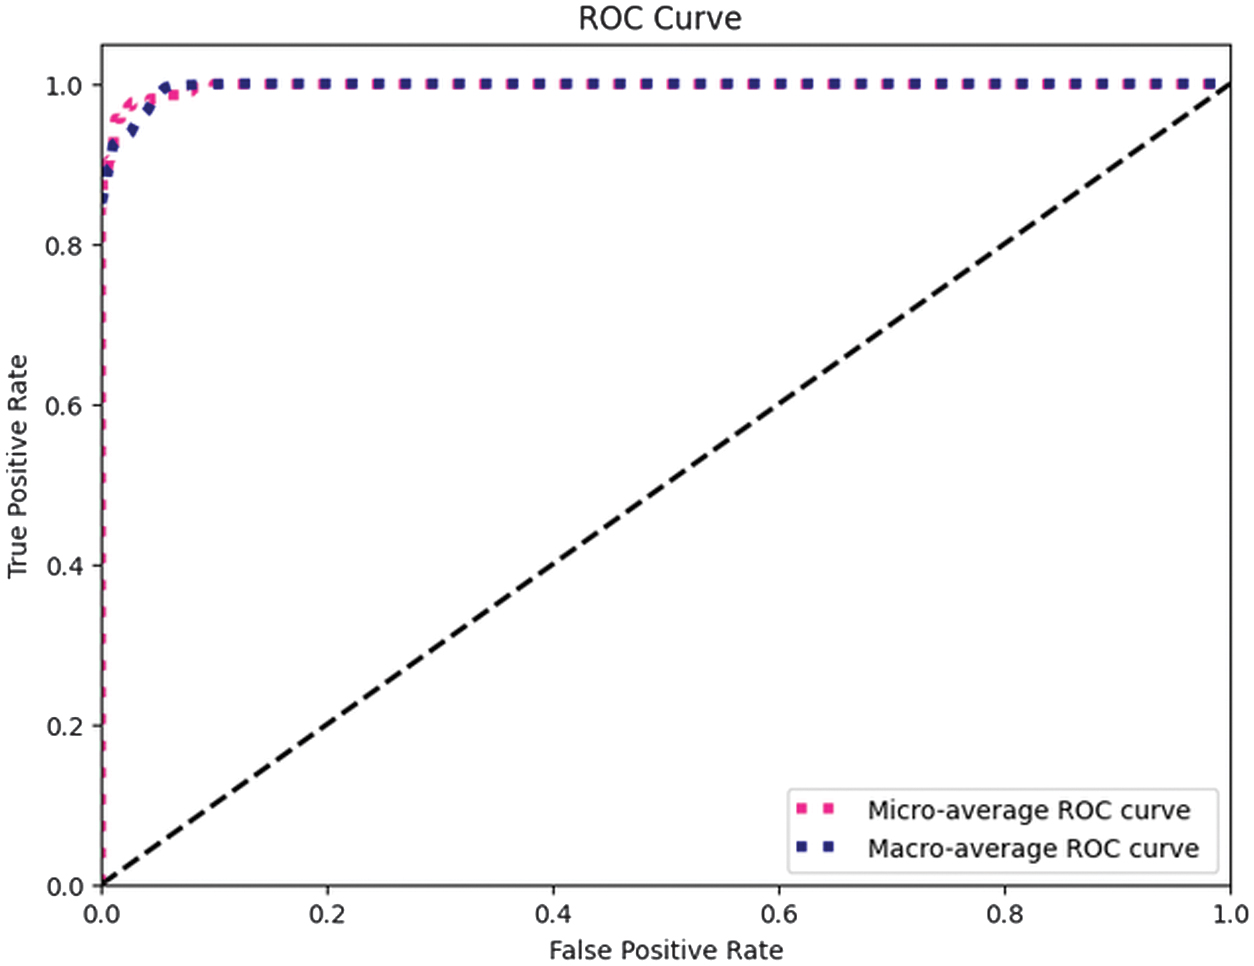 Fig. 9. ROC curves illustrating macro and micro averaged AUC.
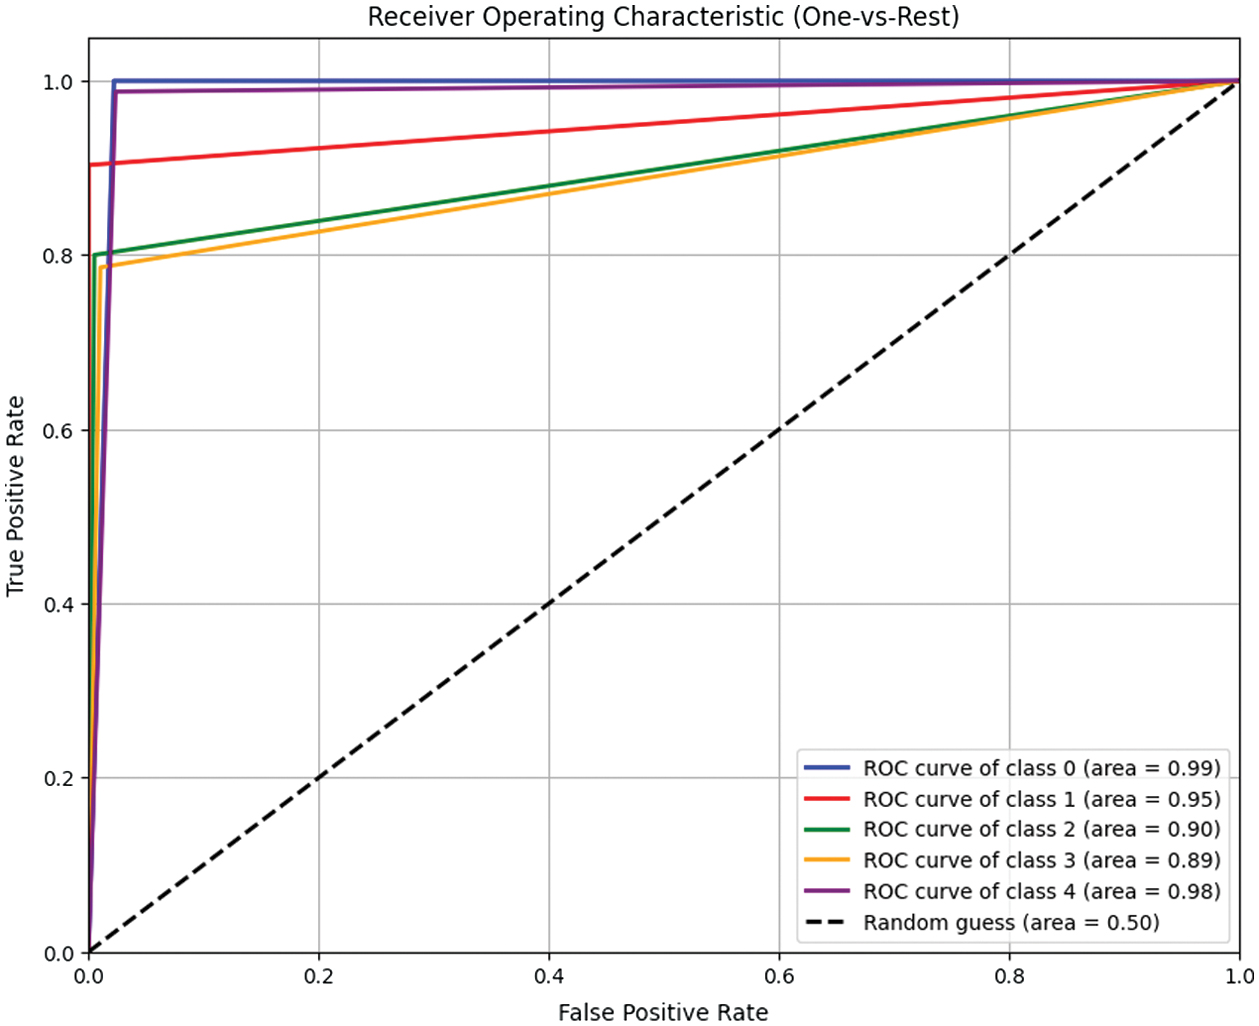 Fig. 10. Class-wise ROC analysis of the SVM model.
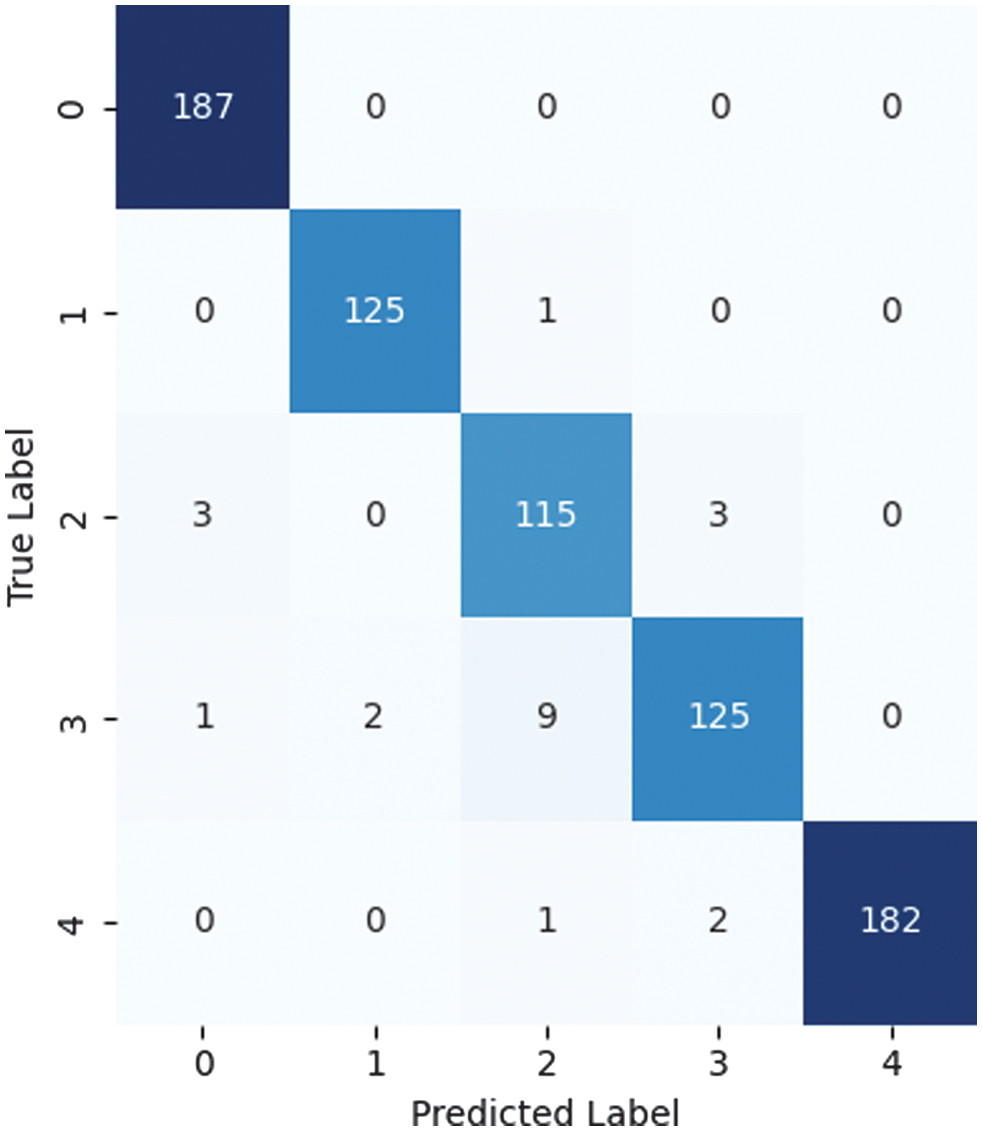 Fig. 11. Confusion matrix illustrating the performance of the proposed model.
Table X. Comparison of recent methods on segmentation-assisted classification using FGADR
| Segmentation model | Classification | Accuracy |
|---|---|---|
| Swin U-Net [ | Swin Transformer | 94.6% |
| Multilabel Segmentation, S-Net [ | Attention-based Classifier, G-Net | 87.2% |
| U-Net [ | SVM | 95.1% |
| ResNet+U-Net [ | Random Forest | 97.5% |
| FCN [ | CNN | 87.7% |
| CNN [ | Ensemble ML models | 93.39% |
V.CONCLUSION AND FUTURE WORK
This study combines deep learning advancements with segmentation-assisted preprocessing to propose an innovative method for diagnosing the degree of DR. Six different types of retinal lesions were precisely segmented using the innovative modified MesU-Net architecture, enabling a thorough examination of retinal features using the FGADR dataset. This approach leveraged the capabilities of vision transformers to capture complex dependencies in retinal fundus images by using the hybrid ResNet-ViT architecture. Normal and segmented features were fused using the CCA fusion method. A variety of machine learning classifiers were employed to examine the fused features, which combined segmented lesions and normal retinal images. In terms of accuracy and dependability, this method not only outperformed current approaches but also demonstrated the benefits of integrating segmentation techniques with innovative neural architectures for medical imaging tasks. Using improved feature fusion and selection techniques in the future can open up even more possibilities and lead to more accurate and scalable DR classification solutions.
A more thorough examination of preprocessing methods like color normalization and lighting correction, as well as the incorporation of interpretability assessments like Grad-Class Activation Map visualizations to optimize the pipeline, will be part of future development. Because the model was trained just on the FGADR dataset, its clinical application is restricted. To verify the model’s capacity to adapt to domain change and generalize to real-world situations, external validation on a variety of patient groups and imaging devices is required.