I.INTRODUCTION
Today, digital innovations [1] are changing healthcare by improving care quality, handling big data [2], streamlining documentation workflows [3], and intensifying security challenges [4] as systems and data scale. More frequent, sophisticated cyber threats [5] endanger the confidentiality and availability of healthcare information.
Healthcare organizations handle extensive volumes of sensitive data, such as personal information, medical histories, and diagnostic results, which makes them attractive targets for cybercriminals. Data leaks of confidential information can carry serious consequences for organizations.
Healthcare facilities manage vast amounts of confidential information, including personal details, medical histories, and diagnostic records, making them prime targets for cybercriminals. Data breaches and unauthorized access to medical or financial records can lead to severe consequences, including service disruptions, economic loss, and compromised patient safety.
Among the most critical cybersecurity threats in this domain are distributed denial-of-service (DDoS) [6], man-in-the-middle (MitM) [7], malware [8], phishing [9], and SQL injections [10]. DDoS attacks overwhelm healthcare networks with illegitimate traffic, rendering systems inaccessible and delaying critical procedures. For instance, a 2019 DDoS attack on a US healthcare provider caused widespread outages, disrupting patient appointments and communications.
MitM attacks intercept communications between healthcare professionals and medical devices, enabling unauthorized access to sensitive information [11]. For example, attackers may capture data transmitted from medical equipment to electronic health record (EHR) systems, leading to data breaches or manipulation. Malware, such as ransomware, encrypts critical data and demands payment for access restoration [12]. A notable case is the 2017 WannaCry attack, which disrupted healthcare services globally and endangered patient safety.
Phishing attacks deceive healthcare staff via fraudulent emails or messages, tricking them into revealing credentials or clicking malicious links [13]. For instance, a phishing email impersonating a medical supplier could prompt staff to share login information, exposing the network to further threats. SQL injection exploits application vulnerabilities by injecting malicious SQL code, allowing attackers to access or alter databases. A poorly secured hospital website, for example, could be exploited to extract confidential patient records [14].
Given the severity and evolving nature of these threats, healthcare institutions must adopt advanced tools capable of detecting and preventing real-time cyberattacks. The traditional methods are mostly not effective against complex types of attacks and threats. Therefore, machine learning (ML) [15] and deep learning (DL) [16] approaches have become strong cybersecurity tools in healthcare environments.
These technologies offer several key benefits:
- −Detecting threats and initiating immediate countermeasures [17].
- −Adaptability to emerging threats: Continuously learning and evolving to recognize novel attack patterns [18].
- −Automation and reduced human error: Minimizing reliance on human intervention and decreasing error rates [19].
- −Scalability: Effectively handling and securing large volumes of sensitive patient data [20].
- −Detection of hidden threats: Uncovering subtle or previously undetected threats that traditional systems might miss [21].
As cyber threats grow in complexity, integrating ML and DL models into healthcare cybersecurity frameworks becomes an essential part of the systems.
In addition to software-based defenses, robust integration of both hardware and software is crucial for establishing a secure healthcare IT infrastructure. Therefore, a comprehensive hardware–software architecture was developed to ensure secure authentication, establish encrypted communication channels, and integrate flow encryption keys directly into hardware components. This system addresses several critical security challenges, including the protection of communication channels through cryptographic methods, secure information transfer within isolated networks, effective routing of network participants, and the secure transmission of cryptographic keys. The routing of cryptographic keys was implemented using WireGuard, a modern VPN protocol known for its simplicity and high performance. WireGuard establishes tunnel interfaces (e.g., wg0 and wg1) on top of existing network interfaces, which are configured using the ifconfig, ip, and route tools. Tunnel behavior is controlled using the wg tool, which associates IP addresses with public keys and remote endpoints to manage communication between nodes securely. This configuration provides a lightweight and secure foundation for encrypted communication in healthcare systems.
In this study, we combine these architectural and cryptographic advancements with ML and DL models for detecting cyber threats in healthcare. Among ML models, the support vector machine (SVM) and random forest (RF) are taken for the experiments, along with a convolutional neural network (CNN), a dense neural network (DNN), a hybrid CNN-long short-term memory (CNN-LSTM) network, and an LSTM-gated recurrent unit (LSTM-GRU) network. Other parts of the paper include a related methodology, an implemented approach, a description of experimental results, and a conclusion of the whole research work.
II.RELATED WORKS
The presented cyber threats are covered in many different research works. The paper [22] introduces an advanced intrusion detection system (IDS) by proposing an improved variant of the LSTM model designed to detect DDoS attacks with the use of the model which integrates convolutional, bidirectional LSTM (Bi-LSTM), and bidirectional gated recurrent unit (Bi-GRU) layers, allowing it to effectively capture both temporal and spatial features from Internet of Things (IoT) network traffic. The results demonstrate exceptional accuracy and F1-scores of 0.95 and an Area Under the Curve Receiver Operating Characteristic (AUC-ROC) score of 0.99.
The main research results of the paper [23] indicate that MitM attacks can be effectively detected with the use of LSTM, SVM, and RF models. The experiments demonstrate that RF has the highest accuracy score of 0.94, while LSTM is also close, reaching a score of 0.92. Only the SVM model’s accuracy score is below 0.90, achieving a score of 0.86. The results demonstrate enhanced robustness in handling noisy or incomplete data, as well as strong generalization capabilities to unseen scenarios. Furthermore, comparative analysis confirms that the proposed models improved predictive quality, making them suitable for practical, real-world applications.
The main research results of the paper [24] indicate the implementation of Naïve Bayes (NB), k-nearest neighbors (KNN), and CNN in the detection of MitM attacks in the IoT environment. The comparison of models confirms a reduction of computational complexity while maintaining the high predictive quality. NB, KNN, and CNN achieve accuracy scores of 0.94, 0.97, and 0.99, respectively.
The study [25] presents comprehensive research on developing a novel DL AutoEncoder model with XGBoost for detecting and preventing MitM in IoT networks. The research thoroughly describes the limitations of traditional IDSs, which often struggle with high-dimensional data, evolving attack strategies, and real-time constraints. Applied to the intrusion detection dataset, the model achieved accuracy, precision, recall, and F1-scores of 0.97, 0.96, 0.95, and 0.96, outperforming the standard models, such as RF, SVM, and standard XGBoost. The approach also demonstrated a superior AUC-ROC value of 0.97, indicating robust discrimination between benign and malicious traffic.
The study [26] describes the TuneDroid technique for detecting Android malware. It explicitly addresses three prevailing challenges: obfuscation, accuracy detection, and computational efficiency in the presented domain. The model was evaluated on a dataset with 3000 benign and 3000 malicious Android applications. TuneDroid provided an opportunity to achieve an accuracy score of 0.99. This approach demonstrates significant improvements over traditional static analysis methods, highlighting the potential of dynamic tuning in malware detection.
The research in the paper [27] focuses on the rising threat of phishing websites by leveraging ML and DL models within cloud and fog computing contexts. The study introduces a new dataset containing benign and malicious traffic and employs RF and SVM models. The SVM model reached an accuracy score of 98%.
The research [28] presents a comprehensive evaluation of phishing email detection models with 14 ML and DL algorithms across 10 datasets, including a newly created merged dataset. The datasets range from classic corpora like Enron and SpamAssassin to specialized sets such as Nazario and Nigerian scams, ensuring diversity in phishing patterns. For ML models, Term Frequency – Inverse Document Frequency (TF-IDF) vectorization and preprocessing were applied, while DL models were trained on raw text to capture semantic nuances. The results showed that BERT and RoBERTa transformer models achieved the highest scores of 0.98 and 0.99, respectively. These models maintained a strong precision–recall balance, crucial for reducing both false positives and false negatives. In contrast, graph convolutional networks performed poorly because email text is linear. Among ML models, the SGD Classifier delivered the best overall results with 0.98 average accuracy, showing adaptability across datasets. The study proved the transformer-based models to be the most effective for phishing detection, enhancing resilience against evolving phishing attacks.
The paper [29] analyzes the rapid increase in web application attacks, both in frequency and complexity. The proliferation of these attacks is primarily fueled by the extensive data available online, which has become highly attractive to cybercriminals. Structured Query Language Injection (SQLi) attacks are especially prevalent and pose severe risks to the information in various databases. In this paper, the classification of SQLi was implemented with the LSTM model. It was tested across three datasets and got accuracy scores from 0.98 to 0.99.
The research works [30–33] implemented two innovative CNN models: SQL Injection-attack Detection Network-1 (SIDNet-1) and SQL Injection-attack Detection Network-2 (SIDNet-2). These models are specifically designed to classify and detect SQLi, thereby enhancing the security of web applications. In the classification results, SIDNet-1 and SIDNet-2 achieved remarkable accuracy scores of 0.97 and 0.98, respectively, on the SQLIV2.
Beyond the evaluated threat models, a broader and often under-examined concern was the adversarial vulnerability gap, referring to the discrepancy between threats considered during evaluation and the full spectrum of potential adversarial manipulations that neural networks may face in practice. While the neighborhood expectation attribution attack (NEAA) demonstrates strong transferability and effectively disrupts intrinsic feature representations across models, an inherent limitation remains in measuring robustness solely against tested attacks. This gap highlights a critical risk that is defined by defenses and robustness strategies, which may appear effective under restricted or predefined attack settings but remain susceptible to unforeseen adversarial strategies under different assumptions [34].
Another case is related to the Multi-Feature Attention Attack (MFAA), which demonstrates effectiveness in improving transferability through multilayer feature fusion and ensemble attention mechanisms. However, it implicitly exposes a structural weakness in deep neural networks: their reliance on overlapping, model-agnostic feature hierarchies that can be systematically manipulated. By exploiting cross-layer semantic consistency and disrupting shared category-related representations, MFAA reveals that even advanced models with defensive strategies remain susceptible when adversarial signals align with naturally learned semantics. This highlights a fundamental concern: robustness evaluations that focus only on known threat models or architectures may underestimate real-world susceptibility to novel, feature-aware adversarial strategies [35].
III.METHODOLOGY
This research employs an ML- and DL-based approach to classify five major cybersecurity threats: DDoS, MitM, malware, phishing, and SQL injection. The methodology includes a list of phases: dataset collection, data preprocessing and normalization, feature selection/extraction, model training, and performance evaluation. All these steps allow the support of the consistency and heterogeneity of datasets.
While this work primarily focuses on DL-based threat detection, secure data handling is crucial during both the training and deployment stages in sensitive environments, such as healthcare. Hardware–software architecture is implemented to support secure communication channels and facilitate the routing of cryptographic keys. The system leverages WireGuard, a lightweight and modern VPN protocol, to establish encrypted tunnels between network nodes. These secure interfaces (e.g., wg0 and wg1) operate on top of conventional interfaces and are configured via standard tools such as ifconfig, ip, and route. WireGuard associates each peer with a public key and an internal IP address, allowing only authenticated devices to exchange data. The wg utility facilitates real-time configuration and monitoring of the encrypted channels. This infrastructure complements the ML and DL models by safeguarding data integrity, confidentiality, and compliance during experimentation and operational deployment. This setup provides a lightweight, scalable, and cryptographically sound communication framework that complements the DL models by ensuring data integrity and confidentiality during both model training and real-time operation. The entire framework is illustrated in Fig. 1.
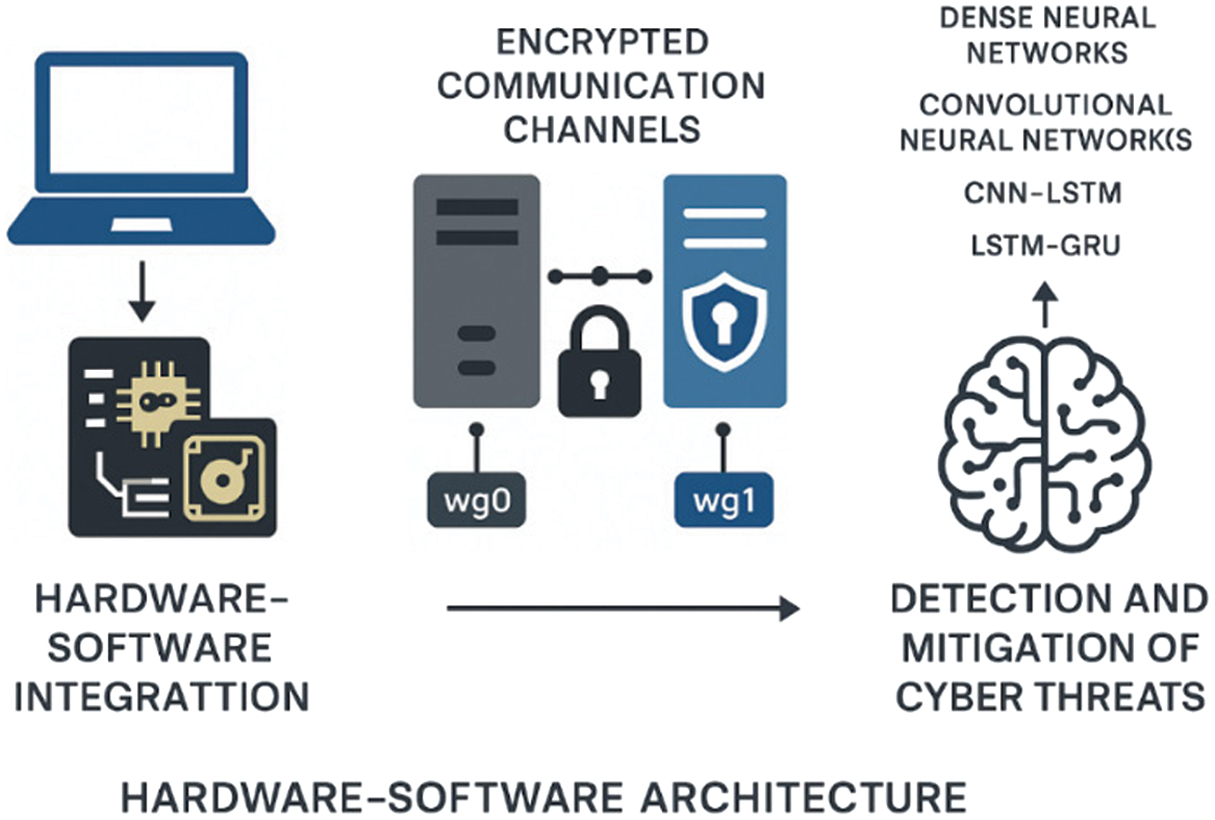 Fig. 1. The system’s infrastructure.
This secure architecture provides an opportunity for protected data transmission; however, subsequent steps focus on deploying a protection system against cyber threats using deep learning models. The steps toward the preparation of these models are described in the next subsections.
A.DATASETS
To train efficient DL models for detecting DDoS, MitM, malware, phishing, and SQL injection cyber threats, five advanced datasets are compiled for each of these categories. These datasets are collected from different publicly available sources.
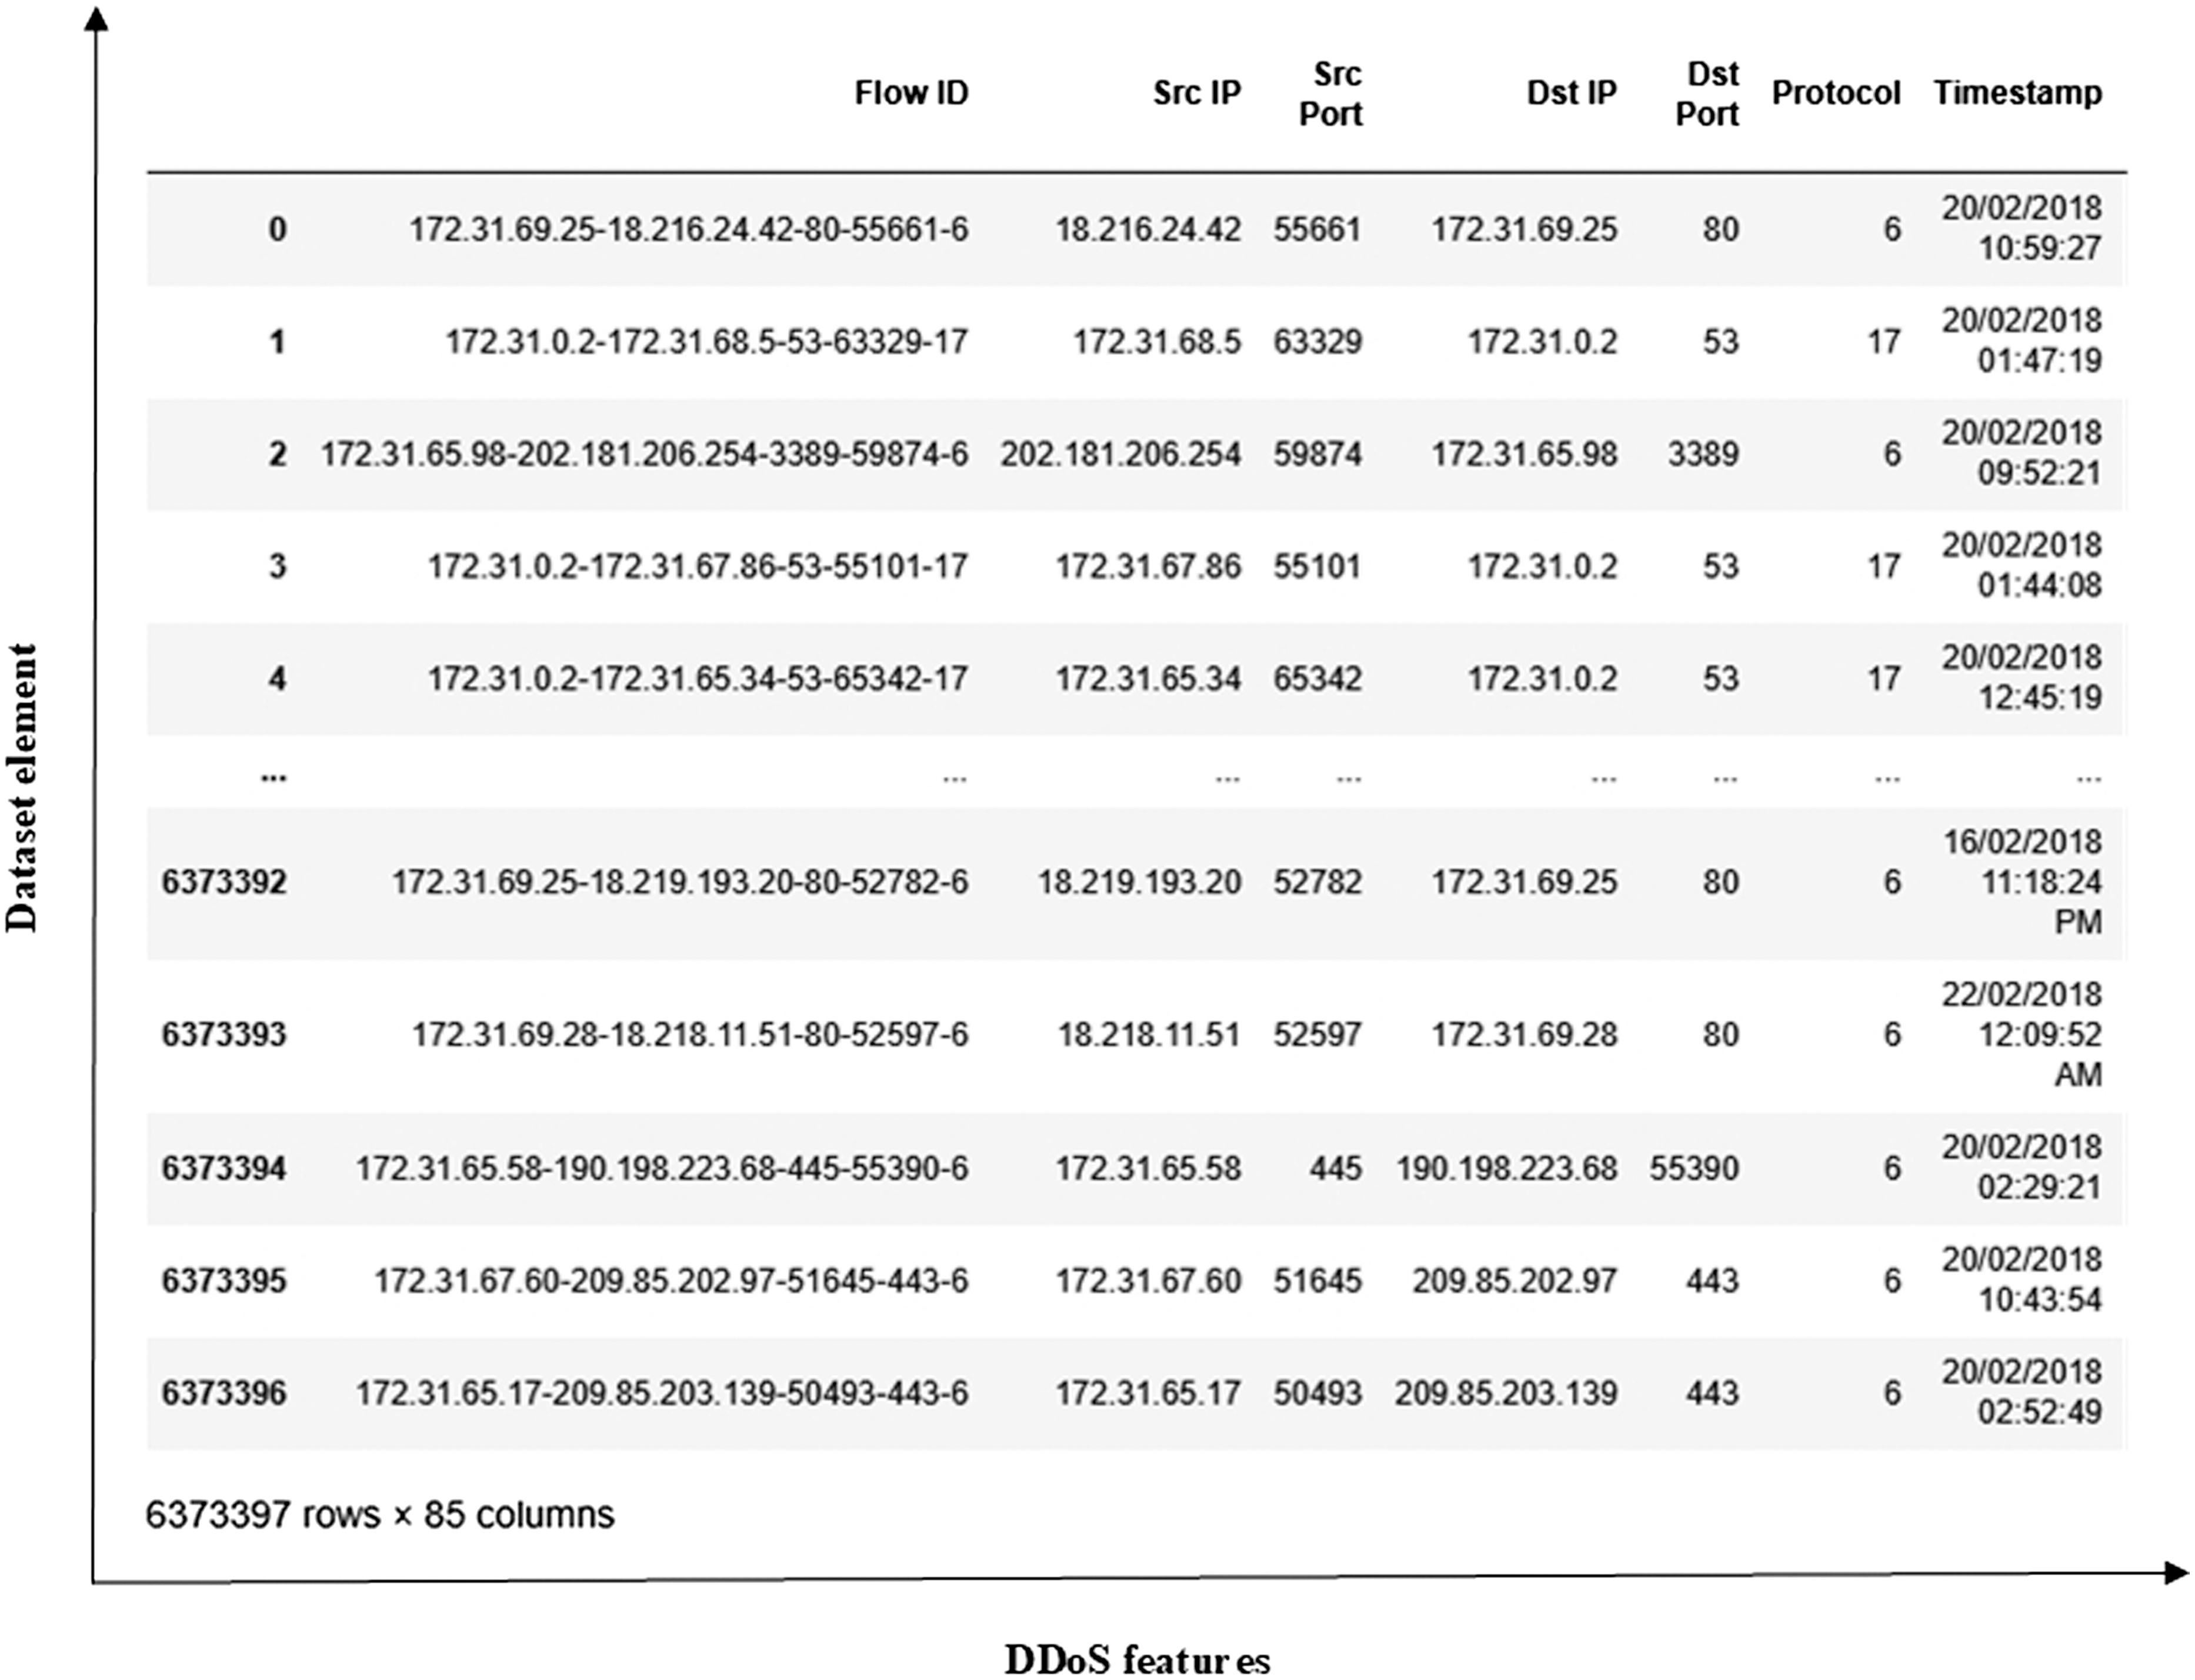
The DDoS dataset (https://www.kaggle.com/code/taruntambrahalli/ddos-nbc) is a comprehensive collection of various attacks compiled from CICDoS2016, CICIDS2017, and CIC-IDS2018 sources. These datasets are created in different years using diverse DDoS traffic generation tools. The extracted DDoS flows are then combined with benign traffic, which is separately extracted from the same original datasets, to create a single, unified dataset. The features of the dataset contain comprehensive information about IP addresses, ports, sizes of data packets, etc. The whole dataset includes 6373397 elements and 84 features. The whole DDoS dataset is shown in Fig. 2.
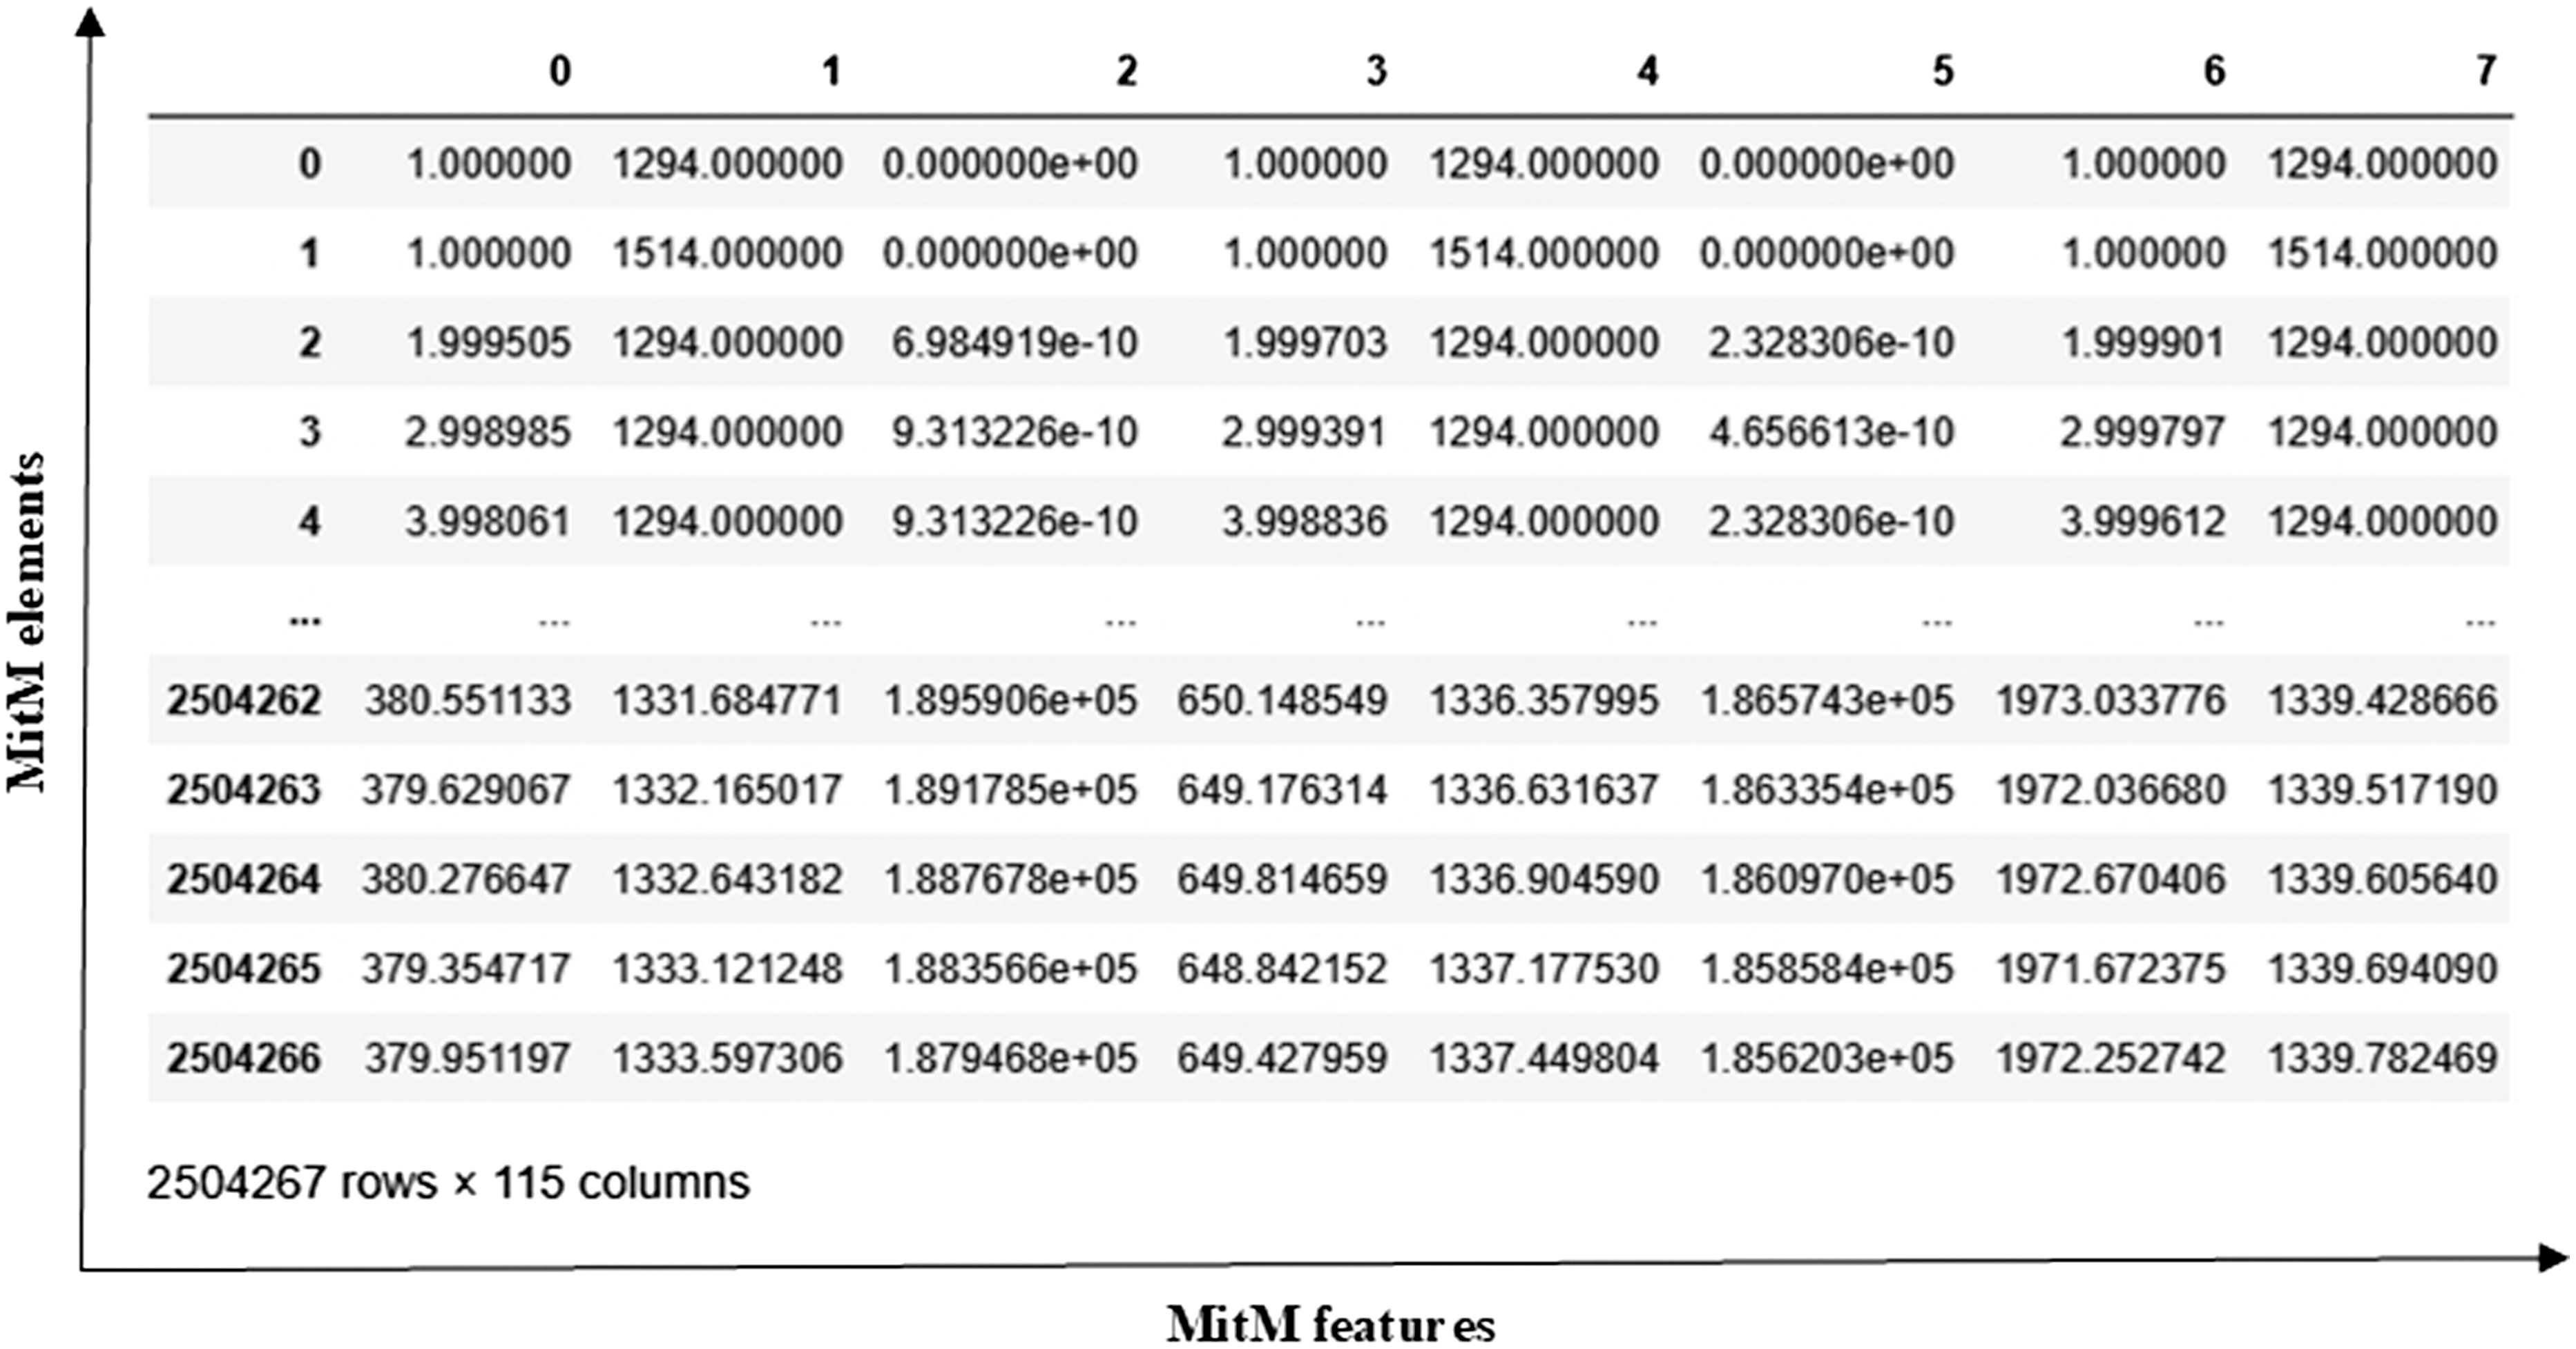
The MitM dataset (https://www.kaggle.com/datasets/ymirsky/network-attack-dataset-kitsune/data) is also a complex collection of network attack datasets that have been captured from network IoT devices. It has various types of attacks, such as Active Wiretap, OS Scan, SSDP Flood, Mirai Botnet, and others. The entire dataset comprises both benign and malicious traffic, enabling the development of models that can distinguish between normal and attack behaviors. Each network packet is represented by features obtained by the Kitsune Network Intrusion Detection System (NIDS), which provides a more detailed analysis and model training. The MitM dataset comprises 2504267 elements and 115 features, as shown in Fig. 3.
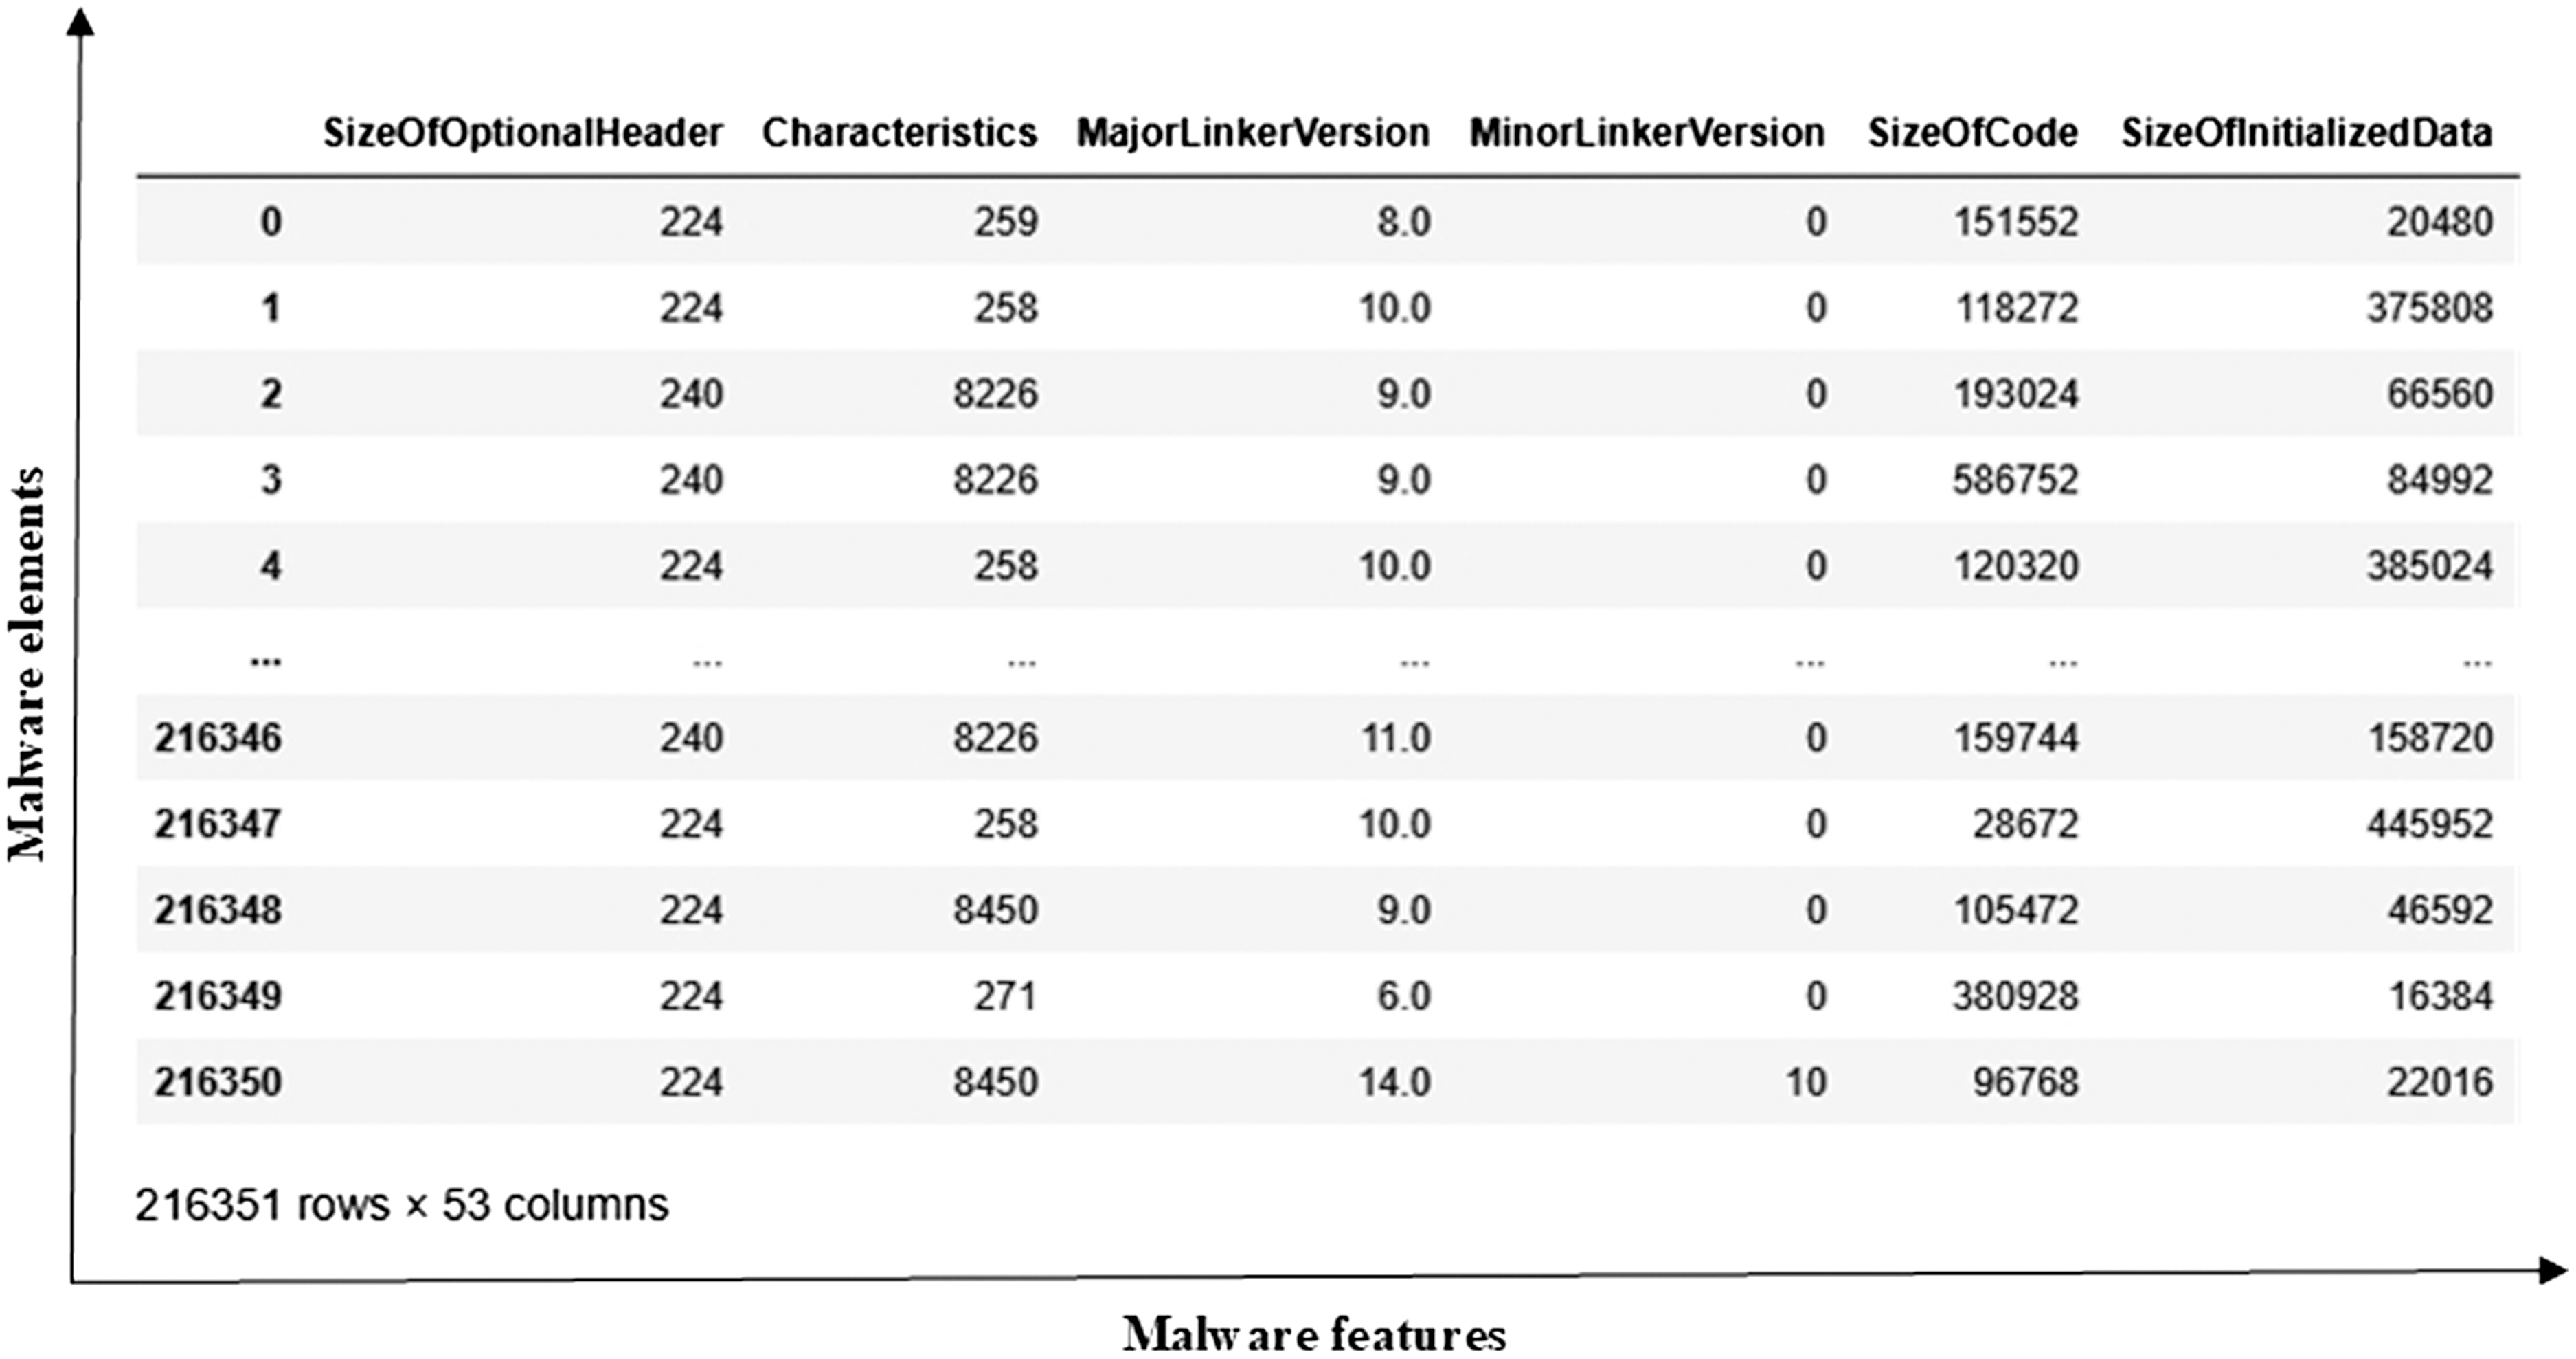
The malware dataset (https://github.com/saurabh48782/Malware_Classification/blob/master/MalwareData.csv) is designed for binary classification of malicious and benign objects. This dataset is adaptable for different DL algorithms for malware detection. Malicious software poses significant threats to information systems. There is a large variety of malware, such as worms, viruses, trojans, and others. The entire dataset comprises 216351 malware elements and 53 features. It is shown in Fig. 4.
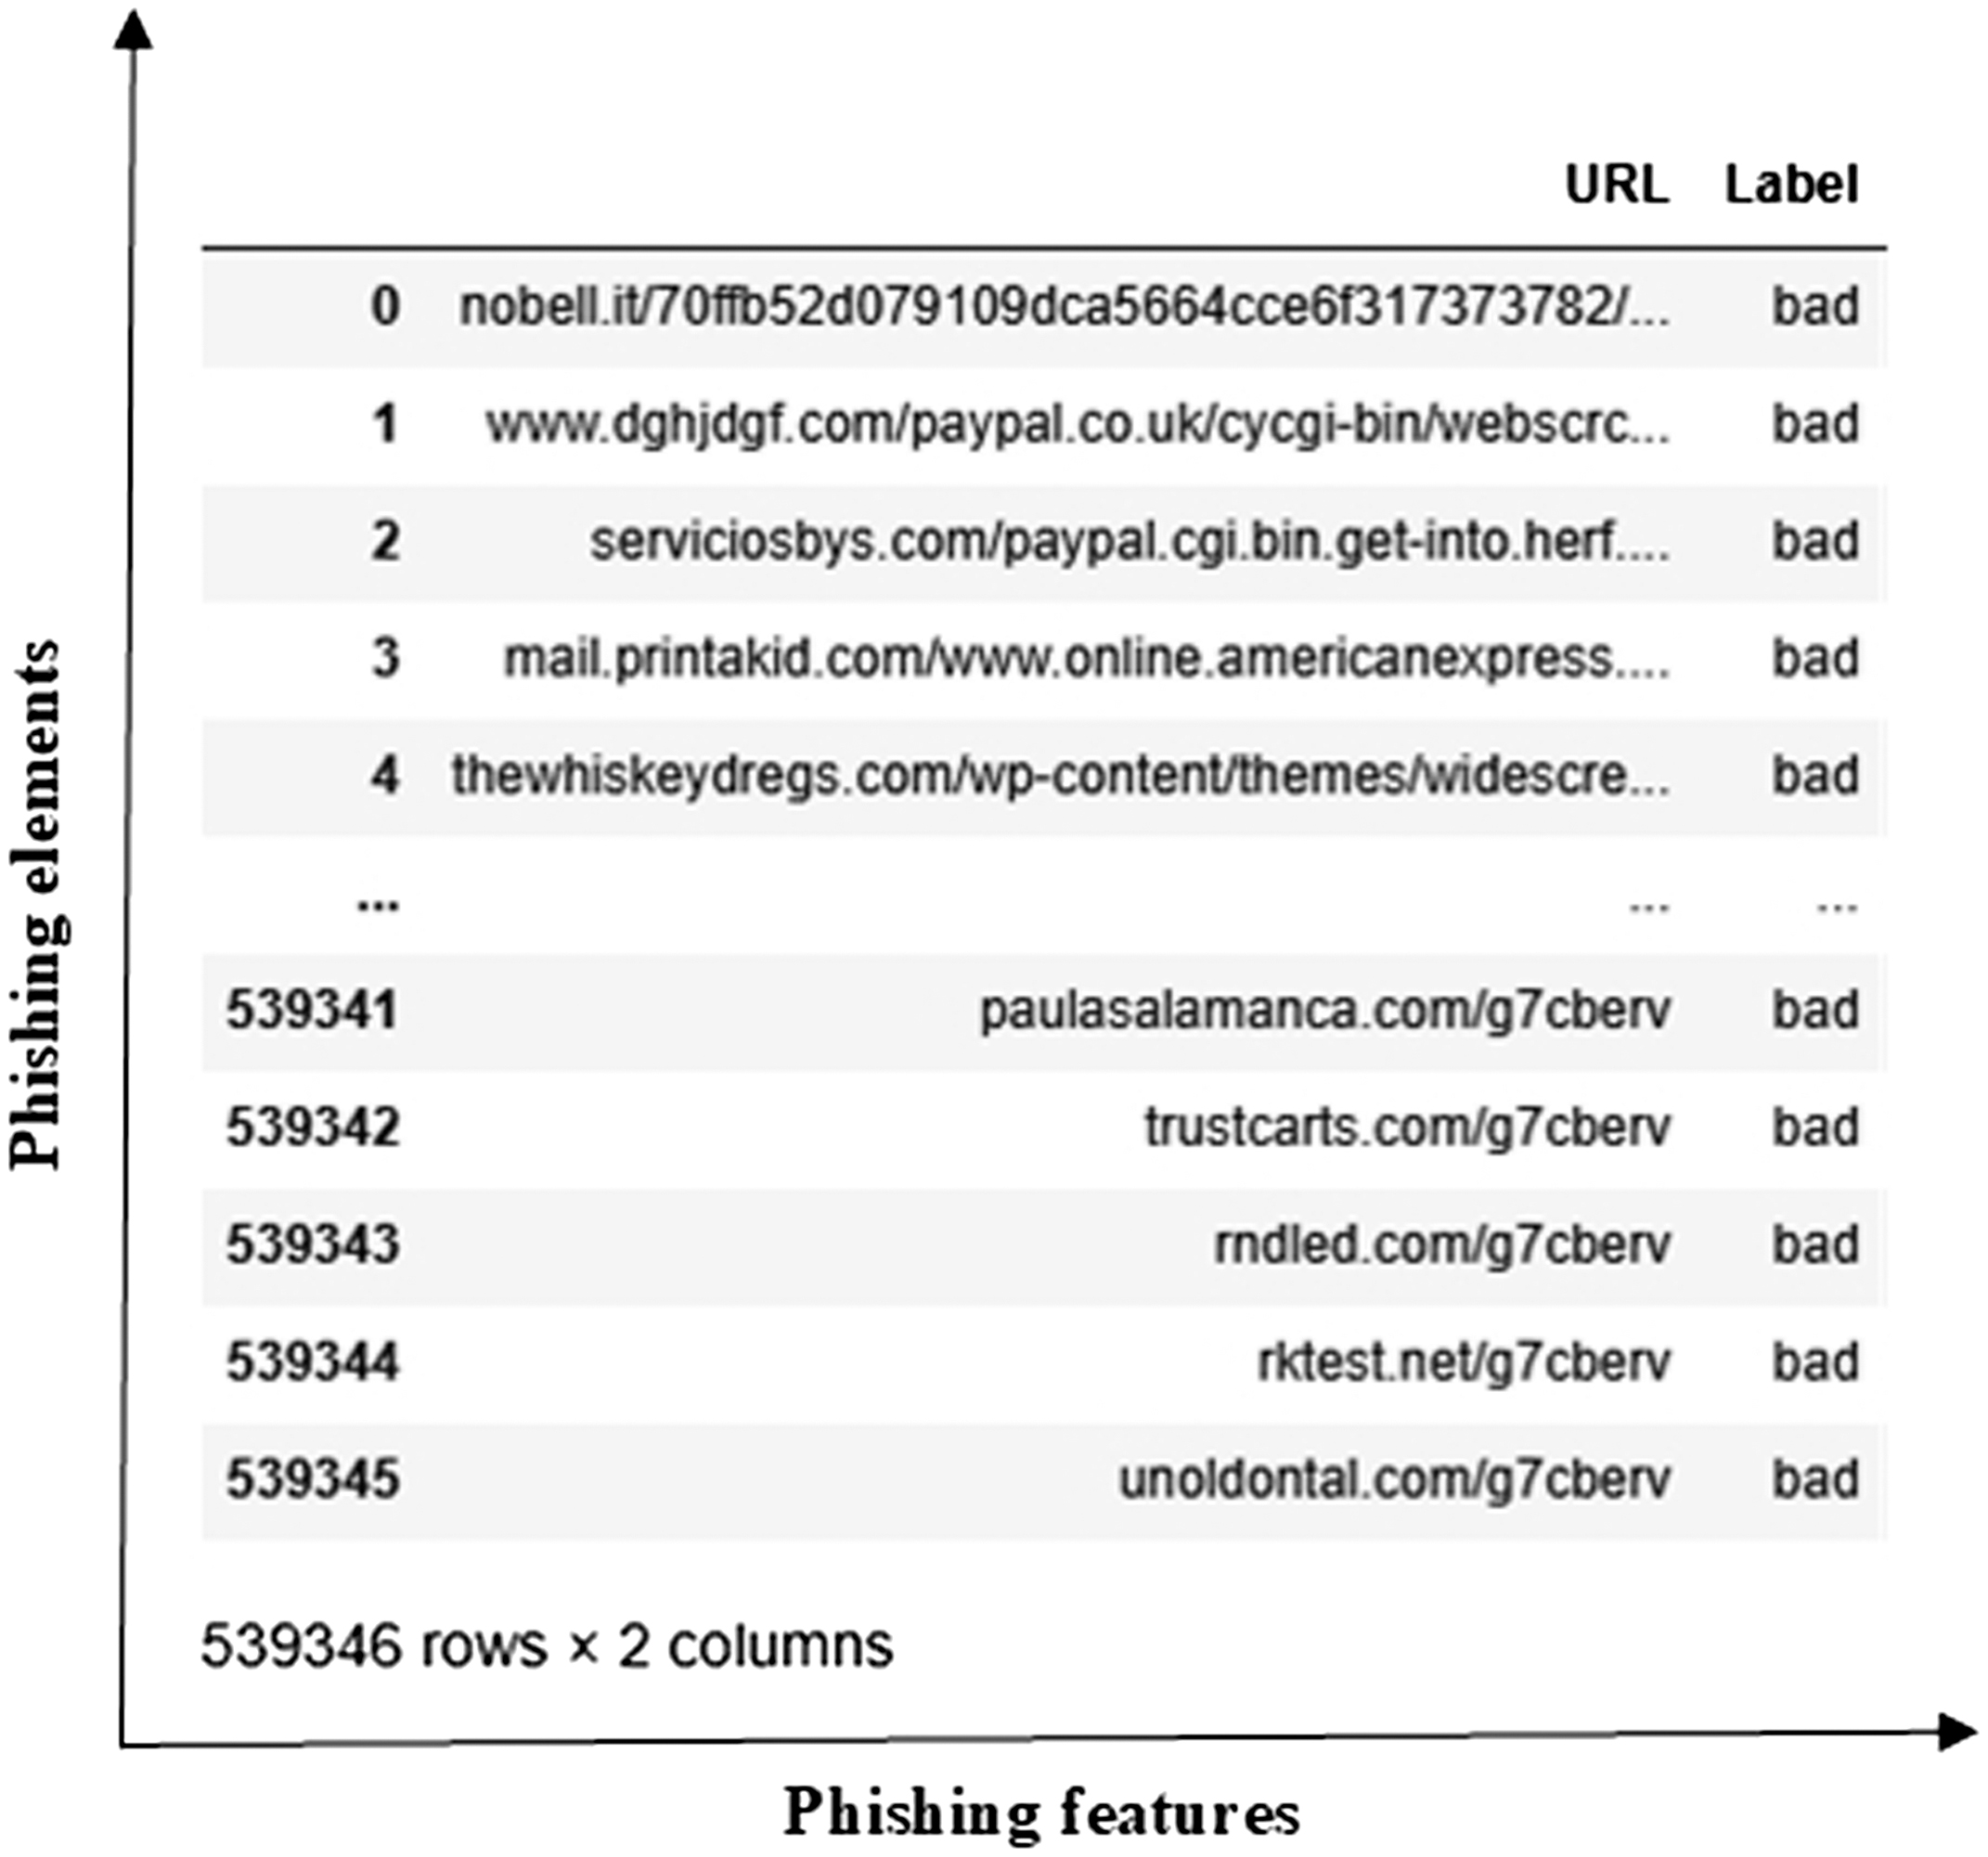
The phishing dataset (https://www.kaggle.com/datasets/taruntiwarihp/phishing-site-urls) is a substantial resource for developing and testing ML and DL models to detect phishing websites. It comprises approximately 549346 elements, each consisting of a URL and a corresponding label indicating whether the site is legitimate or a phishing attempt. The dataset’s data structure includes a URL (the web address to be analyzed) and a Label (the URL classification, where 0 denotes a legitimate site and 1 indicates a phishing site). The dataset is shown in Fig. 5.
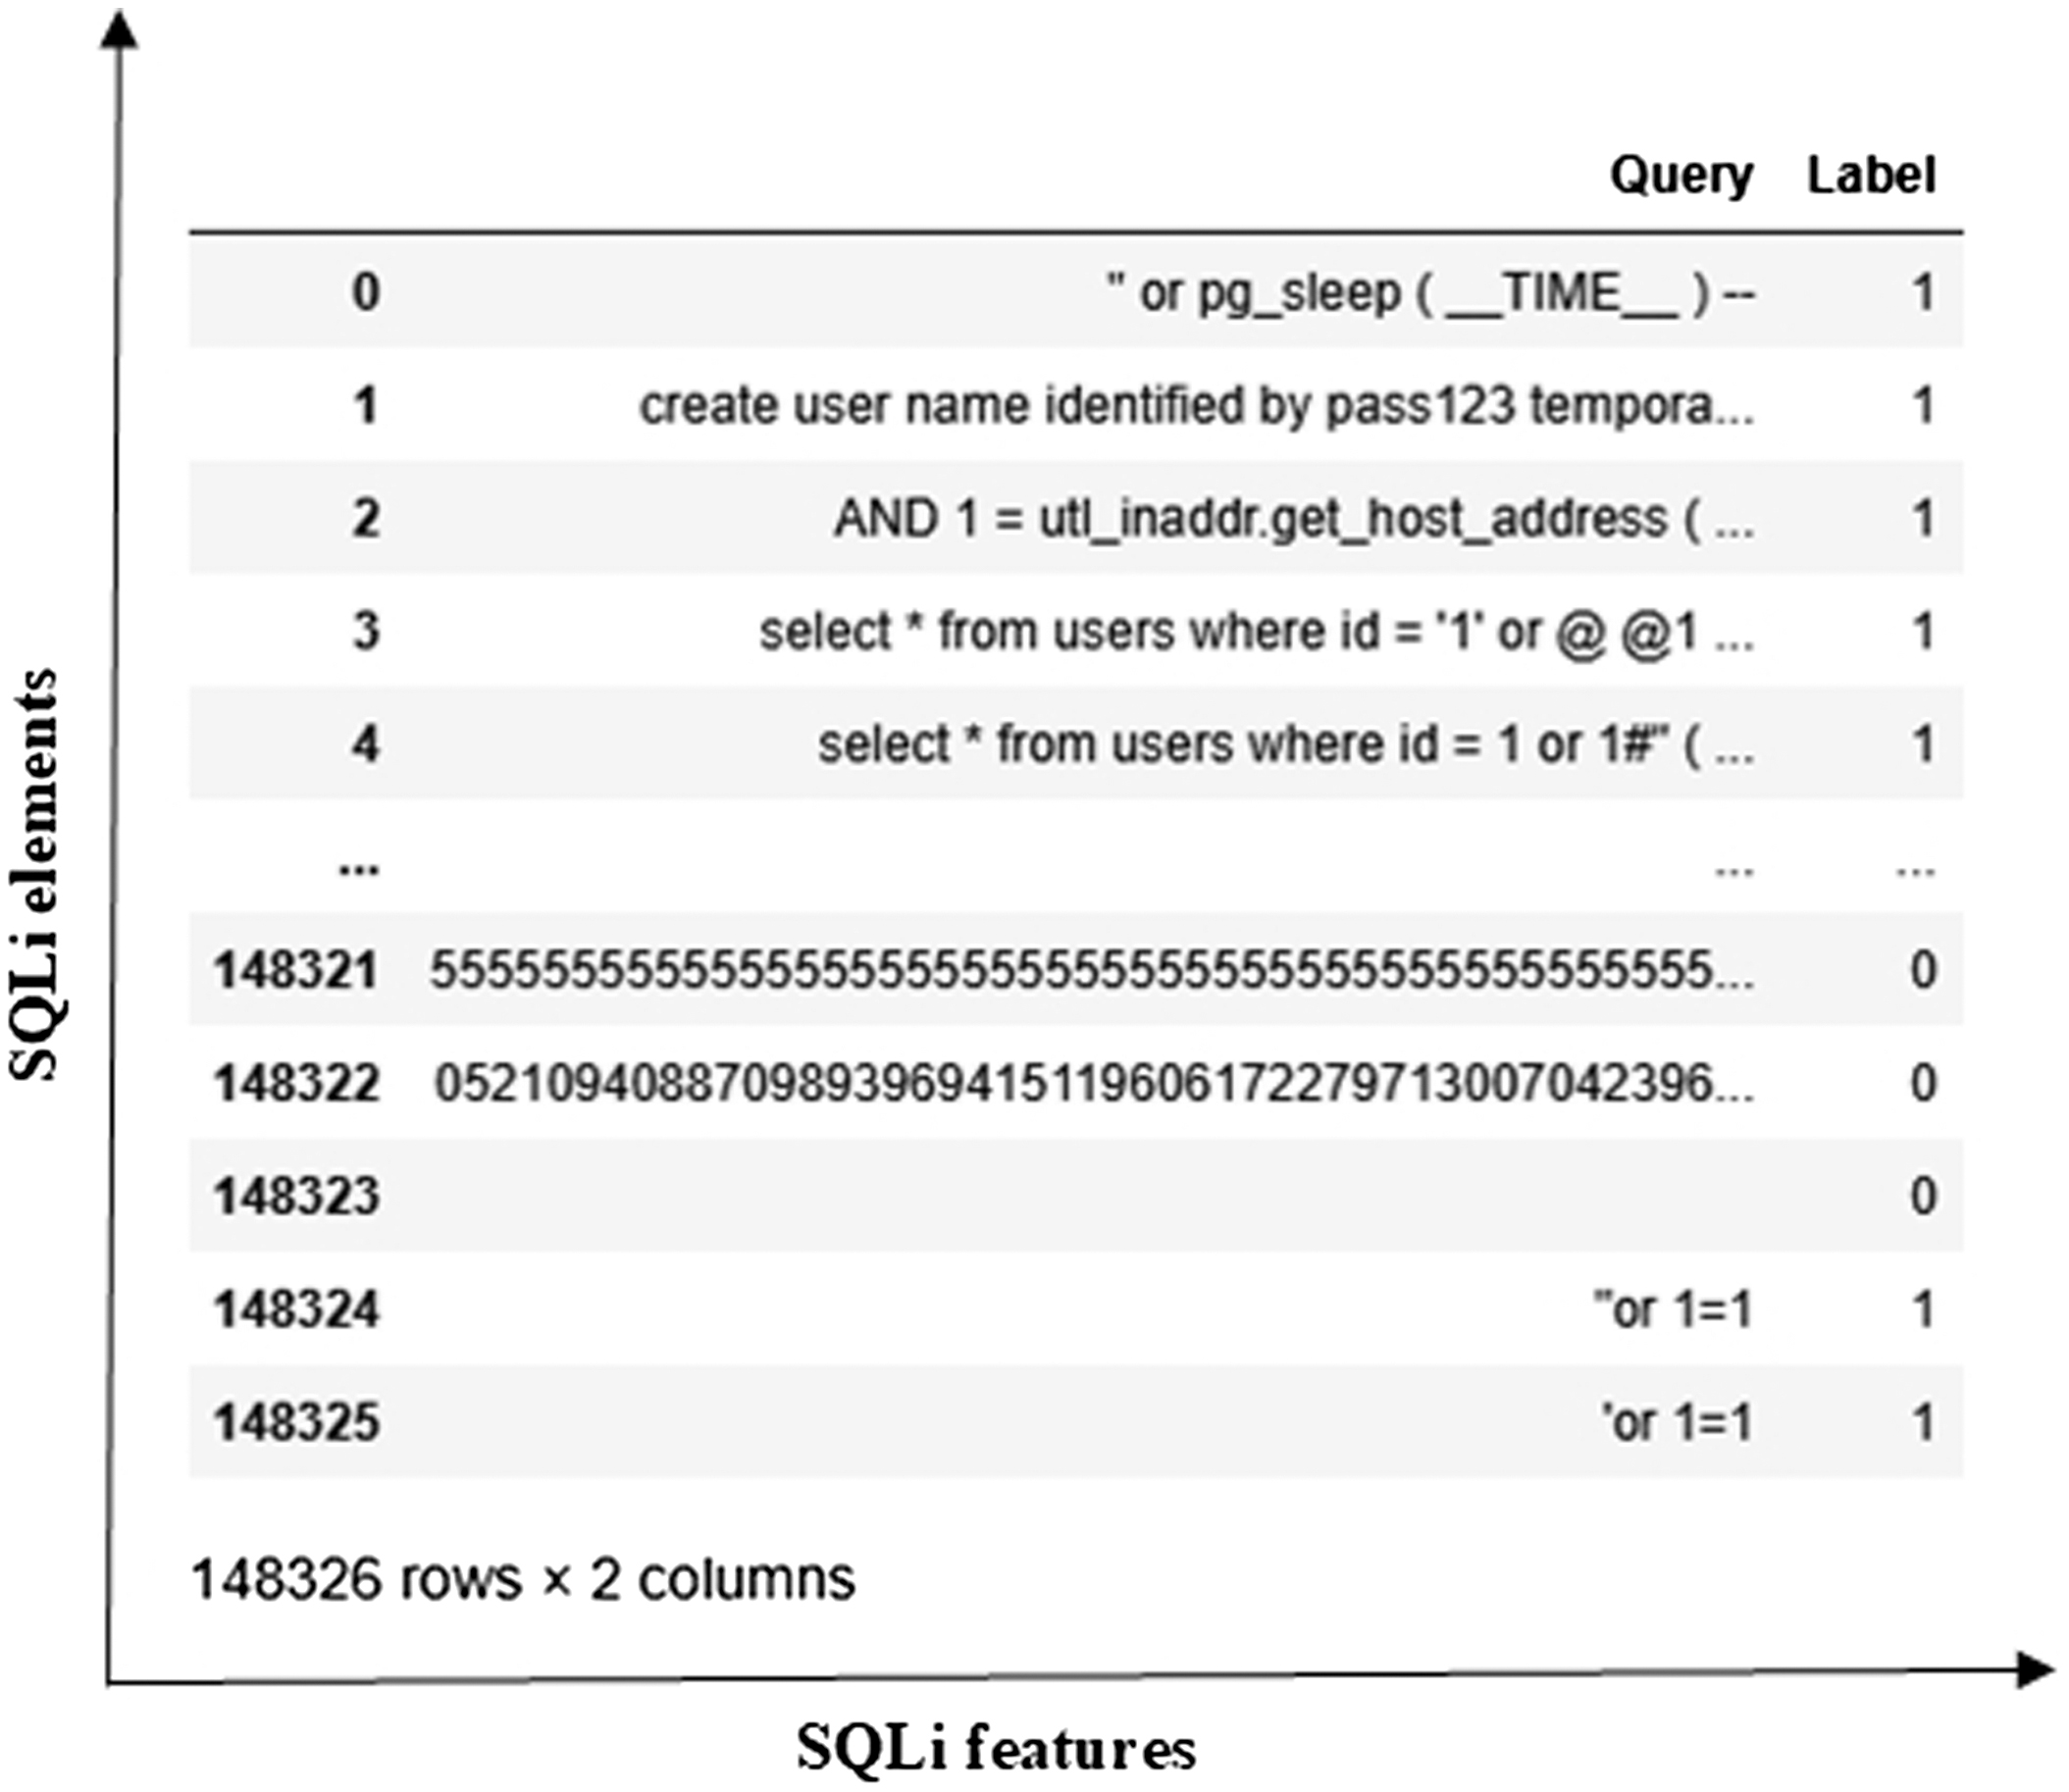
The SQLi dataset (https://www.kaggle.com/datasets/gambleryu/biggest-sql-injection-dataset) is designed to support research and development in the detection of SQL attacks. The corresponding dataset is effectively used to train advanced DL models aimed at identifying SQLi patterns. This dataset includes the Query and Label columns, consisting of 148326 elements. The dataset is shown in Fig. 6.
B.DATA PROCESSING AND NORMALIZATION
To ensure consistent and effective model performance, distinct preprocessing pipelines were implemented based on the nature of each dataset. For the DDoS, MitM, and malware datasets, which typically consist of structured network traffic data, the preprocessing began with data cleaning to remove duplicate records, incomplete entries, or anomalies.
Min–max normalization is a feature-scaling technique for transforming feature values into a scale from 0 to 1. It ensures all features contribute equally to algorithms. The min–max technique is computed by (1):
where is an initial value, is a minimum value, is a maximum value, and is a normalized value.C.FEATURE SELECTION
After normalization, feature selection was performed using the chi-square metric. This technique gives the most important features. The chi-square metric measures the dependence between each feature and the target class label using the chi-square () test of independence. This feature selection technique is especially suitable for discretized numerical features, helping to reduce dimensionality while preserving meaningful input. The chi-square metric is computed in the following way (2):
where is an observed value, is an expected value, and is a degree of freedom.In this work, the 20 best features of DDoS, MitM, and malware datasets were chosen in the feature selection stage.
D.FEATURE EXTRACTION
In contrast to other datasets, the phishing and SQL injection datasets mainly contain raw text data, such as URLs and SQL query strings. The conversion of textual strings is implemented using the TF-IDF metric, which converts textual data into numerical vectors by evaluating their importance in the whole dataset. This representation effectively captures both common structures that may signal phishing or SQL injection attacks.
TF-IDF is computed by (3):
The significance of is evaluated as (4):
where is the number of times a word takes place in a sentence, and is the total number of words in a sentence.IDF is the inverse of the frequency of a word in a sentence and is computed as (5):
where is the full number of sentences; is the number of sentences where takes place.E.ML AND DL MODELS
The datasets in this work are classified with a bunch of ML and DL models.
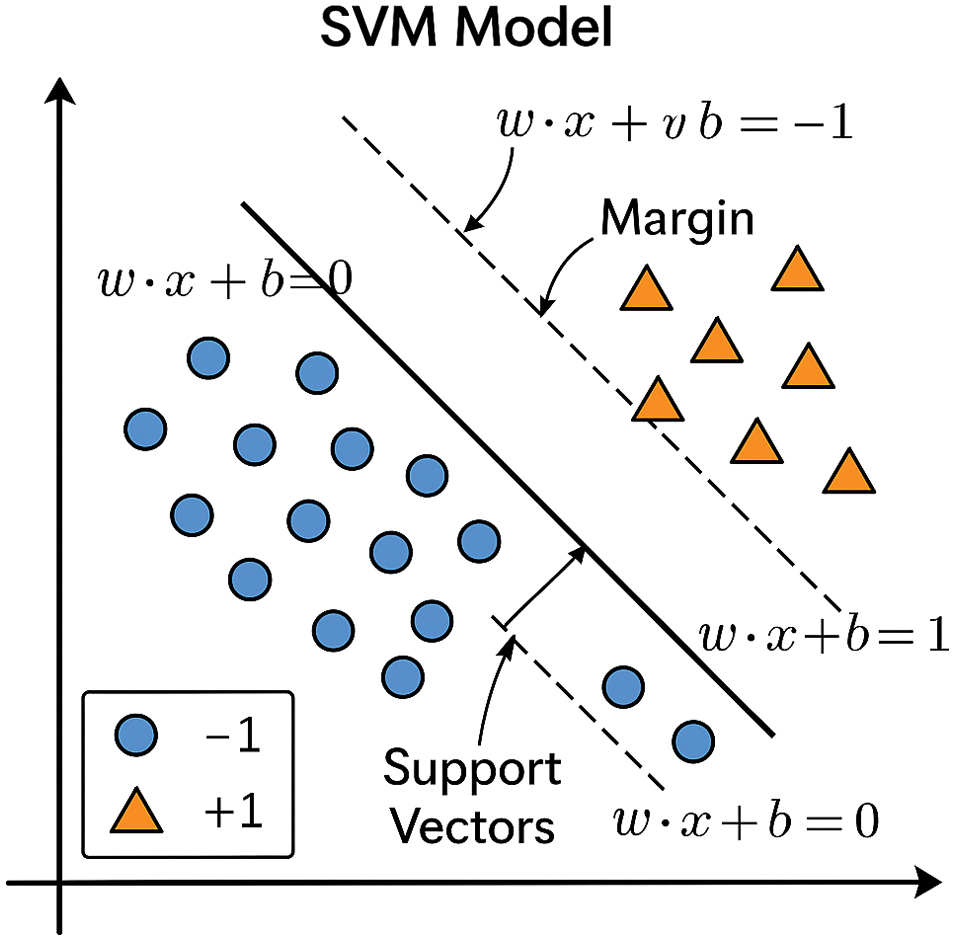
An SVM is a type of algorithm efficiently used for classification and regression tasks. It focuses on finding the optimal decision boundary for separating data points of different classes with a margin. The hyperplane of SVM is defined as (6):
where is a weight vector, is a data vector, and is a bias.The SVM model is shown in Fig. 7.
An RF is an ensemble learning method that builds a collection of decision trees and combines their predictions to improve accuracy and stability. It works by creating multiple random samples from the dataset through a process called bagging, where each sample is drawn with replacement and used to train an individual tree. To further diversify the trees, RF selects a random subset of features at each split, which reduces correlation among the trees. Once all the trees are built, their predictions are aggregated: for classification tasks, the model outputs the class chosen by the majority of trees. The RF model is shown in Fig. 8.
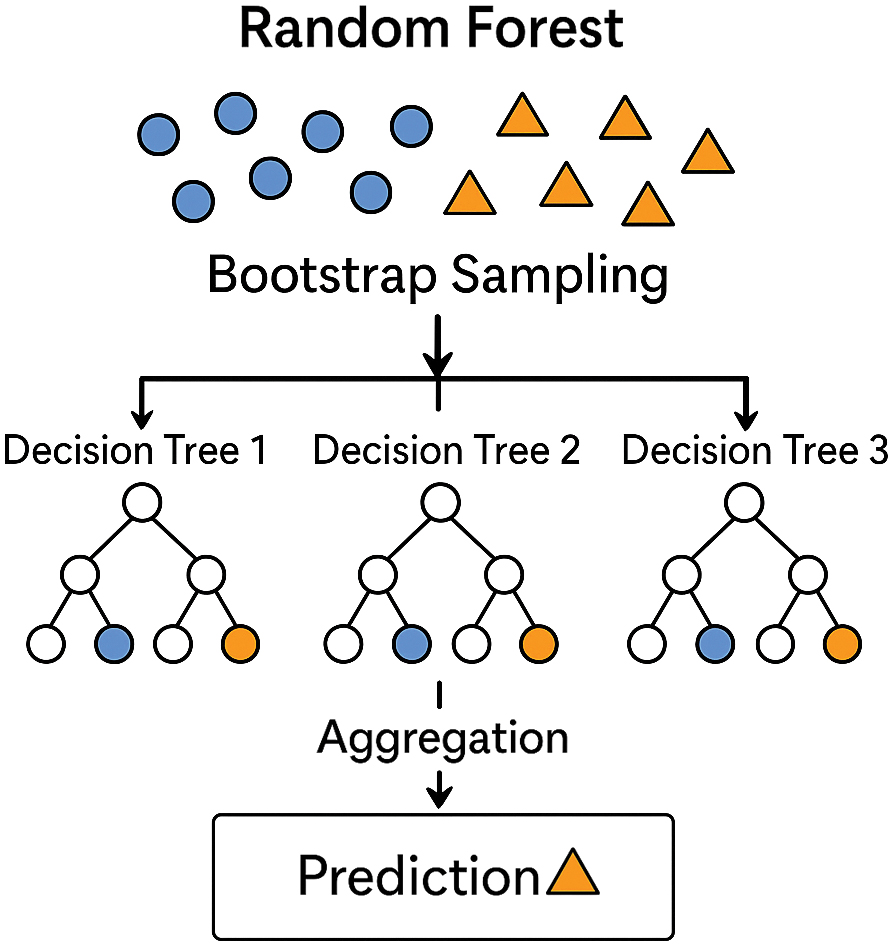 Fig. 8. The random forest model.
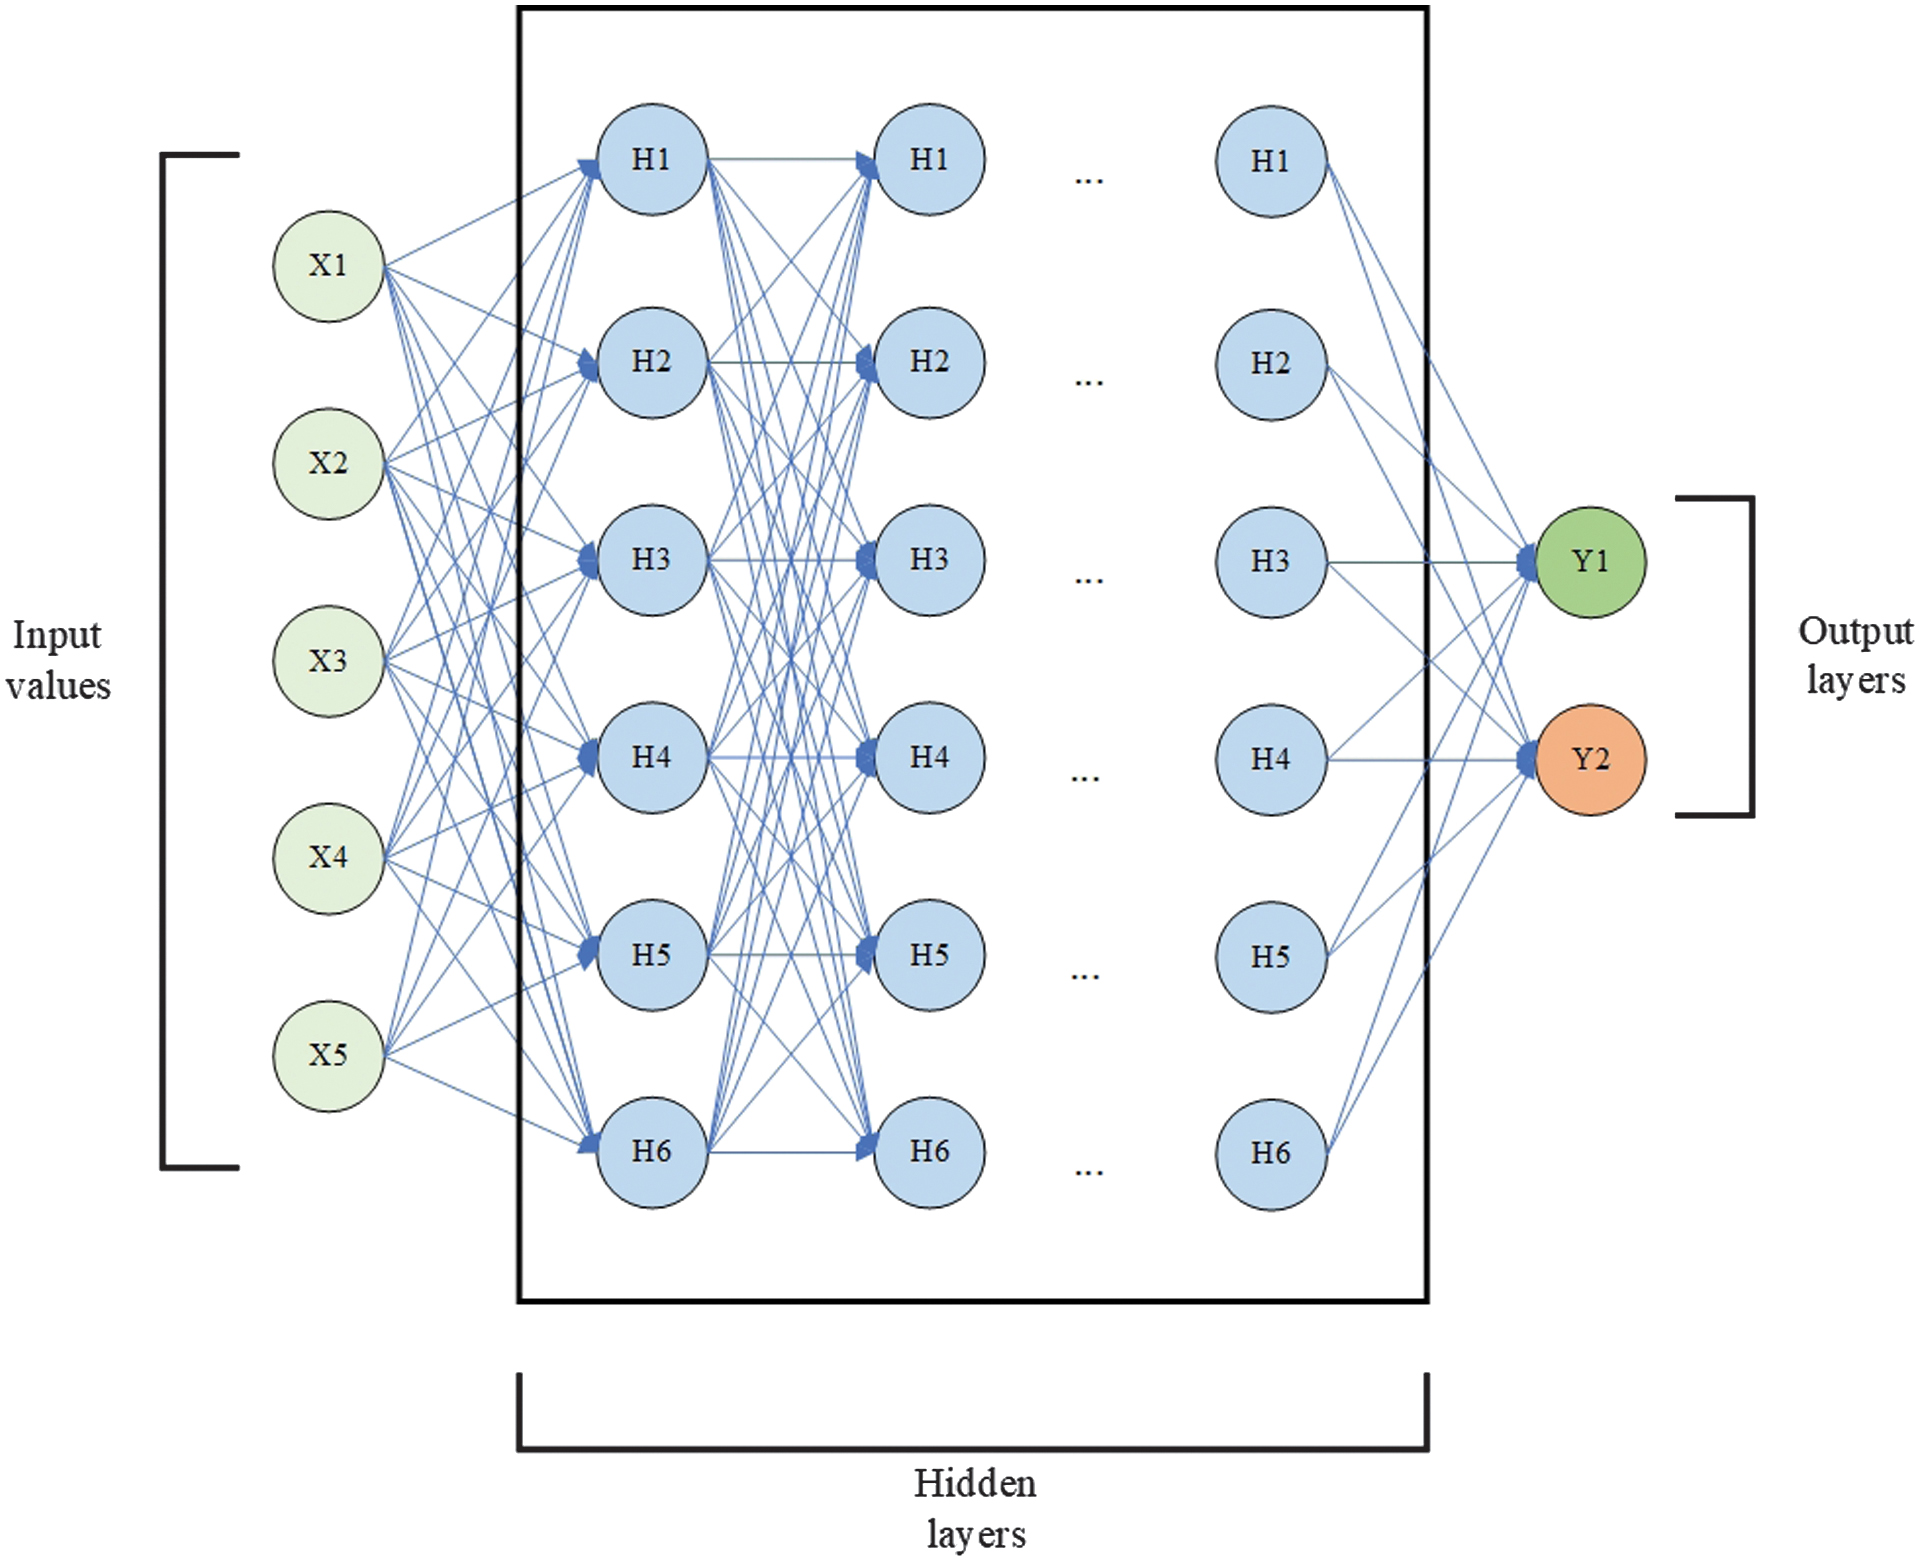
A DNN is a fully connected network and the basic DL architecture. Every neuron of the layer is connected to neurons of the next layer. It allows the network to combine information from all features, enabling it to capture complex, nonlinear relationships within the data. Due to its versatility, DNN is good for various classification assignments, representing the learning process.
The structure of a DNN includes an input layer, which receives a fixed-size numerical vector. The input vector is followed by several hidden layers where weights are multiplied by neuron values and summed up with each other and a bias. The results of the multiplications then undergo Rectified Linear Unit (ReLU) or sigmoid activation functions. This computation is shown as (7):
where are the input values, are the weights, is the bias, and is the activation function.The output layer provides the final prediction, with the sigmoid function for binary classification. The DNN scheme is shown in Fig. 9.
A CNN is a DL architecture designed to learn spatial hierarchies of features from input data. It is especially effective for analyzing special structures, like images, but can also be applied to other datasets. Unlike the traditional DNNs with feedforward-connected layers, CNNs implement specialized layers to learn hierarchies of patterns through local connectivity and weights. The core components of CNN are convolutional layers, where filters slide across the input data. These convolutional layers are followed by ReLU activation functions, which introduce nonlinearity in models and facilitate the handling of complex functions. After applying ReLU functions, max pooling layers decrease the dimensionality of feature maps. Pooling also summarizes the most essential features in each region. The output is flattened into a one-dimensional vector when the dimensions are sufficiently reduced through successive convolution and pooling layers. The output layer of the network gives the final prediction of the sigmoid function. The mathematical computations are shown in (8)–(11):
- 1.Convolutional operations: where is an input image of size and is a kernel filter of size .
- 2.The ReLU activation function:
- 3.Max pooling:
- 4.Fully connected layer: where is a weight matrix, is a bias vector, and is an activation function.
The scheme of CNN is shown in Fig. 10.
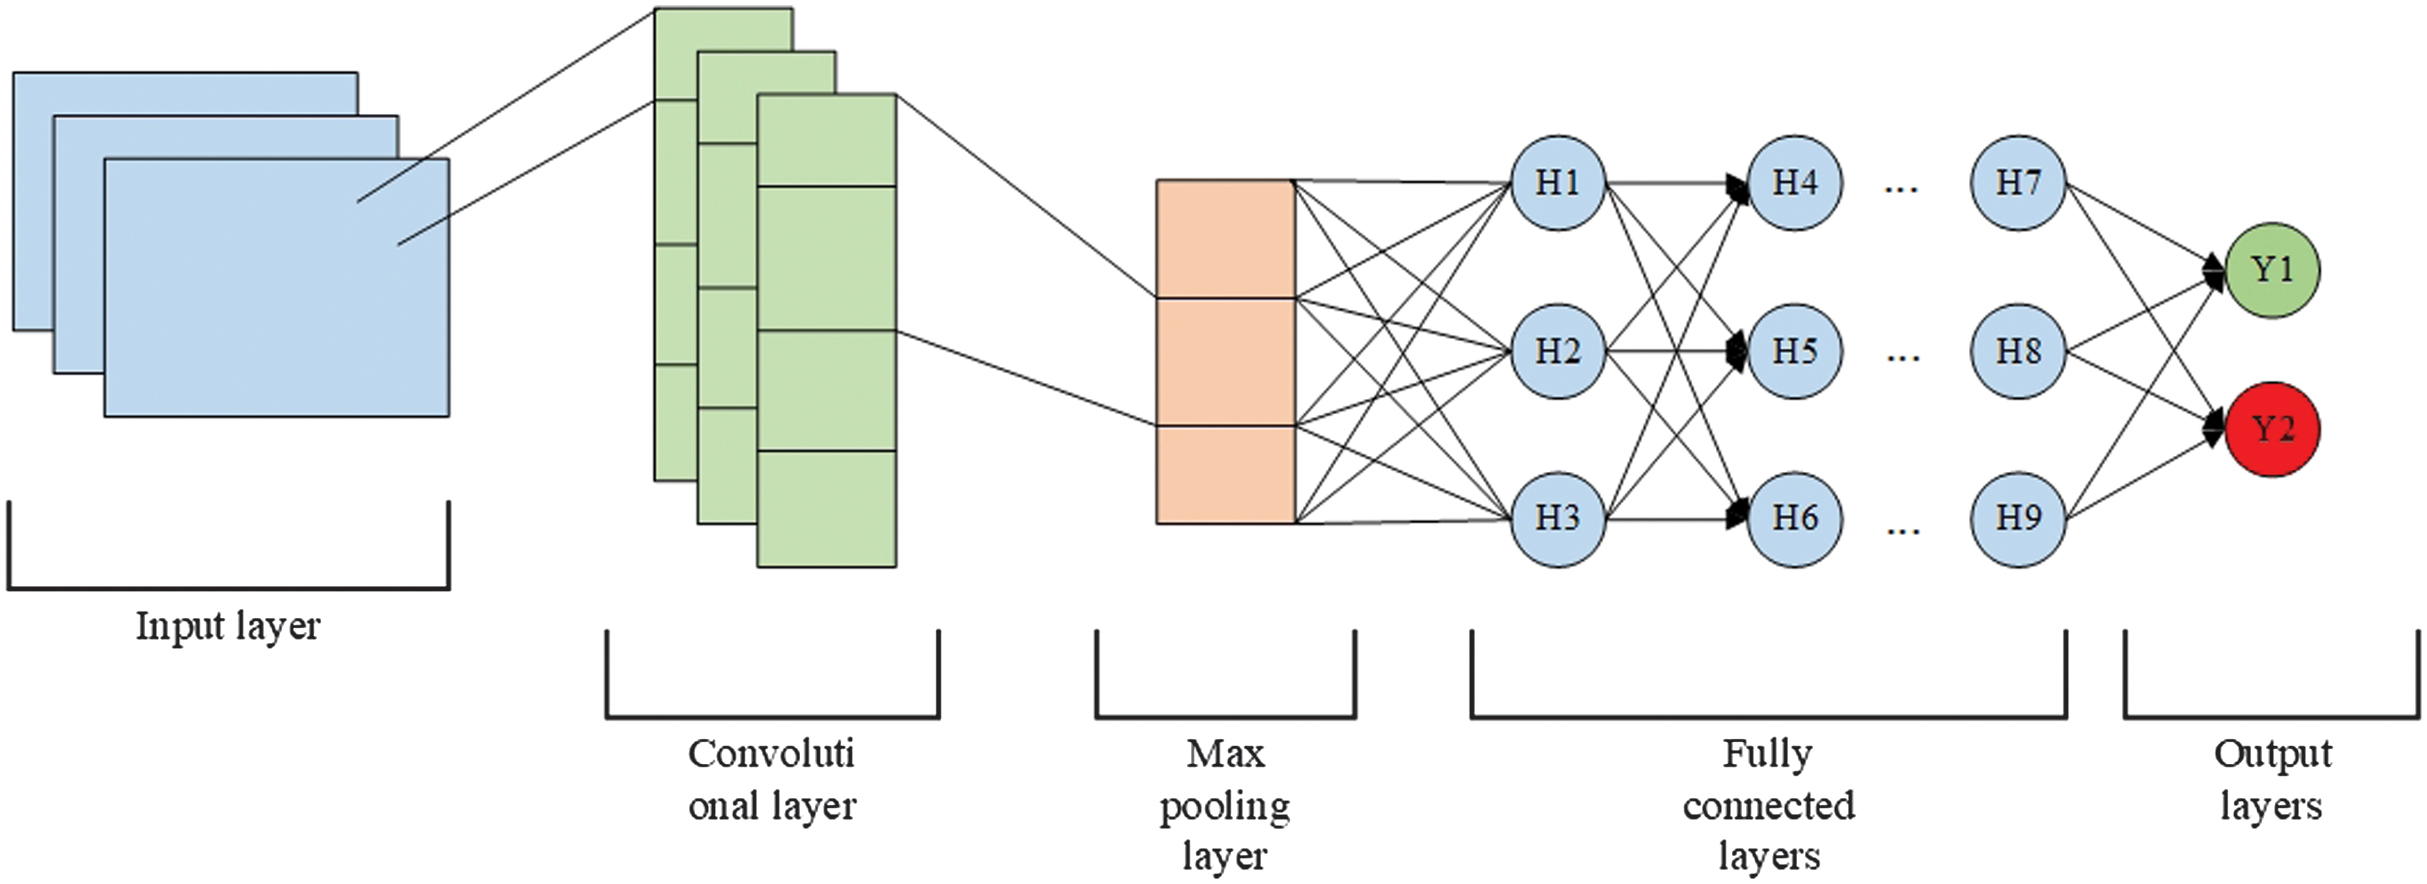 Fig. 10. Convolutional neural network.
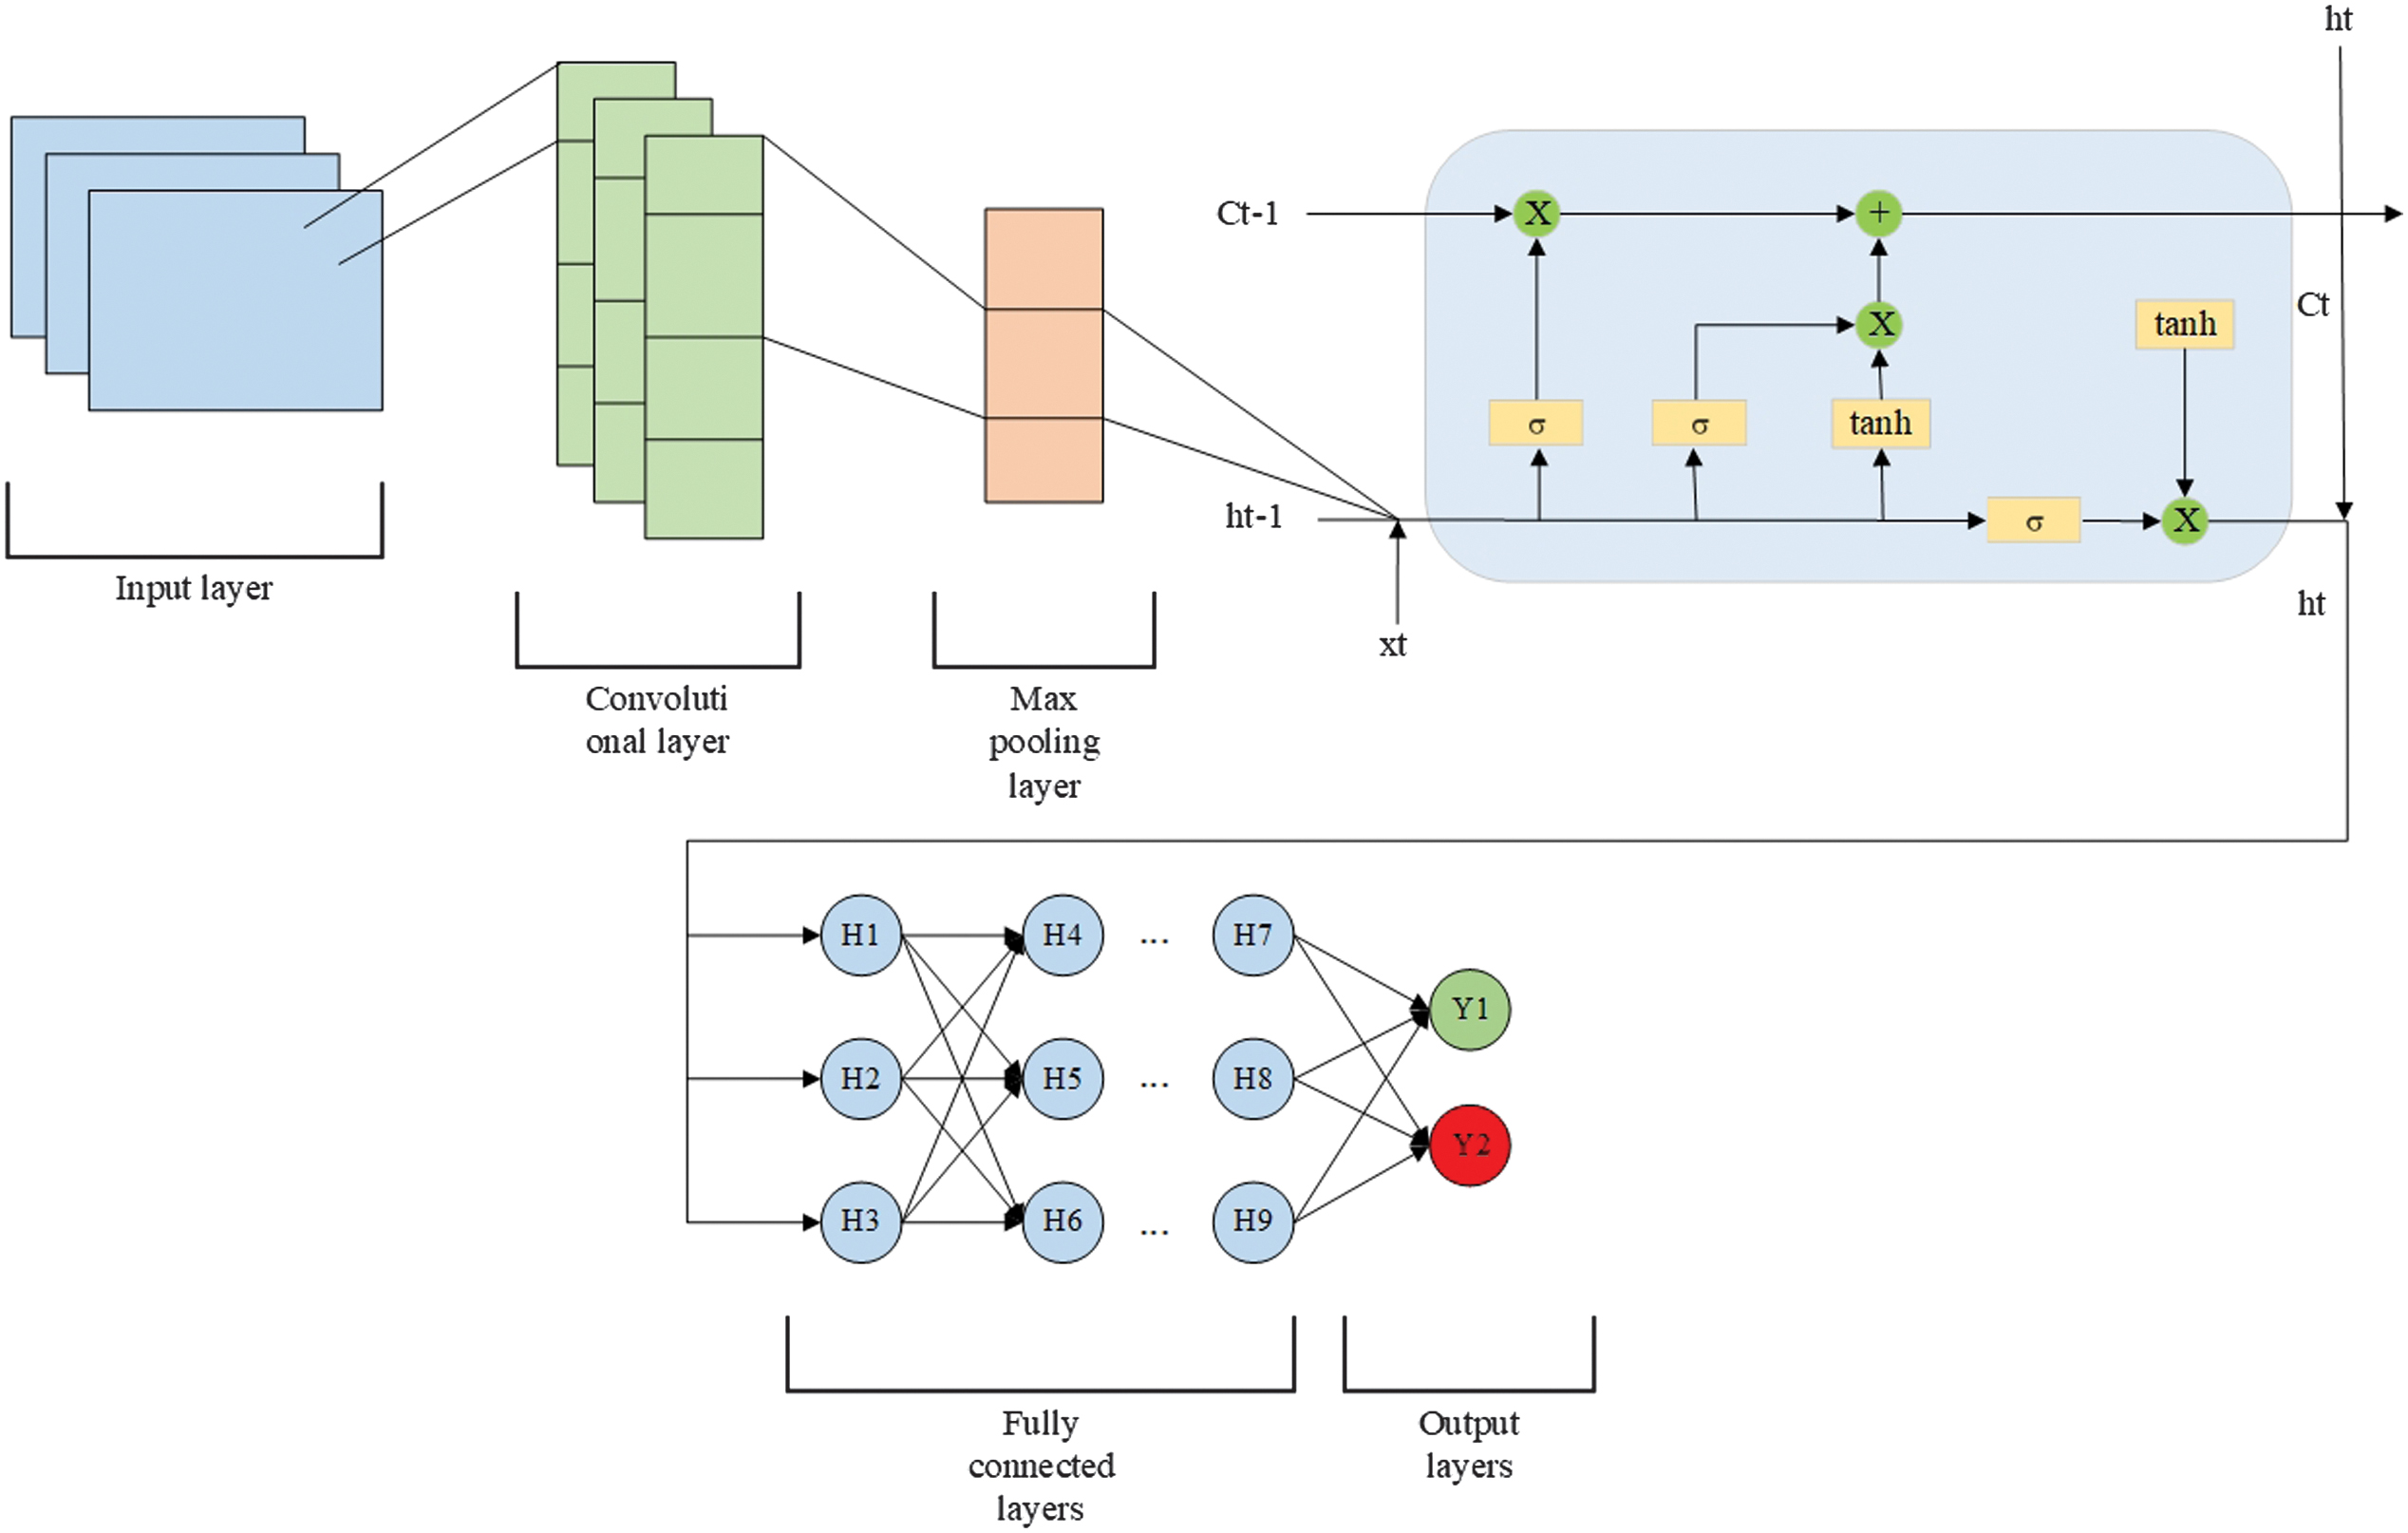
A CNN-LSTM is a hybrid DL architecture that merges the strengths of CNN and LSTM networks. The model begins with a convolutional layer, applying multiple filters to the input sequences, such as those with shapes of (20, 1) or (100, 1), depending on the dataset—to capture local spatial patterns. The ReLU activation function introduces nonlinearity, enabling the detection of complex feature interactions. This is followed by a global max pooling layer, which compresses each feature map into a single value, reducing dimensionality while preserving the most salient features. The pooled features are then passed through a fully connected dense layer, projecting them into a higher-dimensional space. Next, an LSTM layer processes these representations, leveraging its gated architecture to retain and model temporal dependencies in the data. Additional dense layers with ReLU activation further refine the learned features, transforming them into a task-specific representation. The model concludes with a single-neuron output layer using a sigmoid activation, producing a probability score in the range of 0 and 1, suited for binary classification.
The CNN-LSTM scheme is shown in Fig. 11.
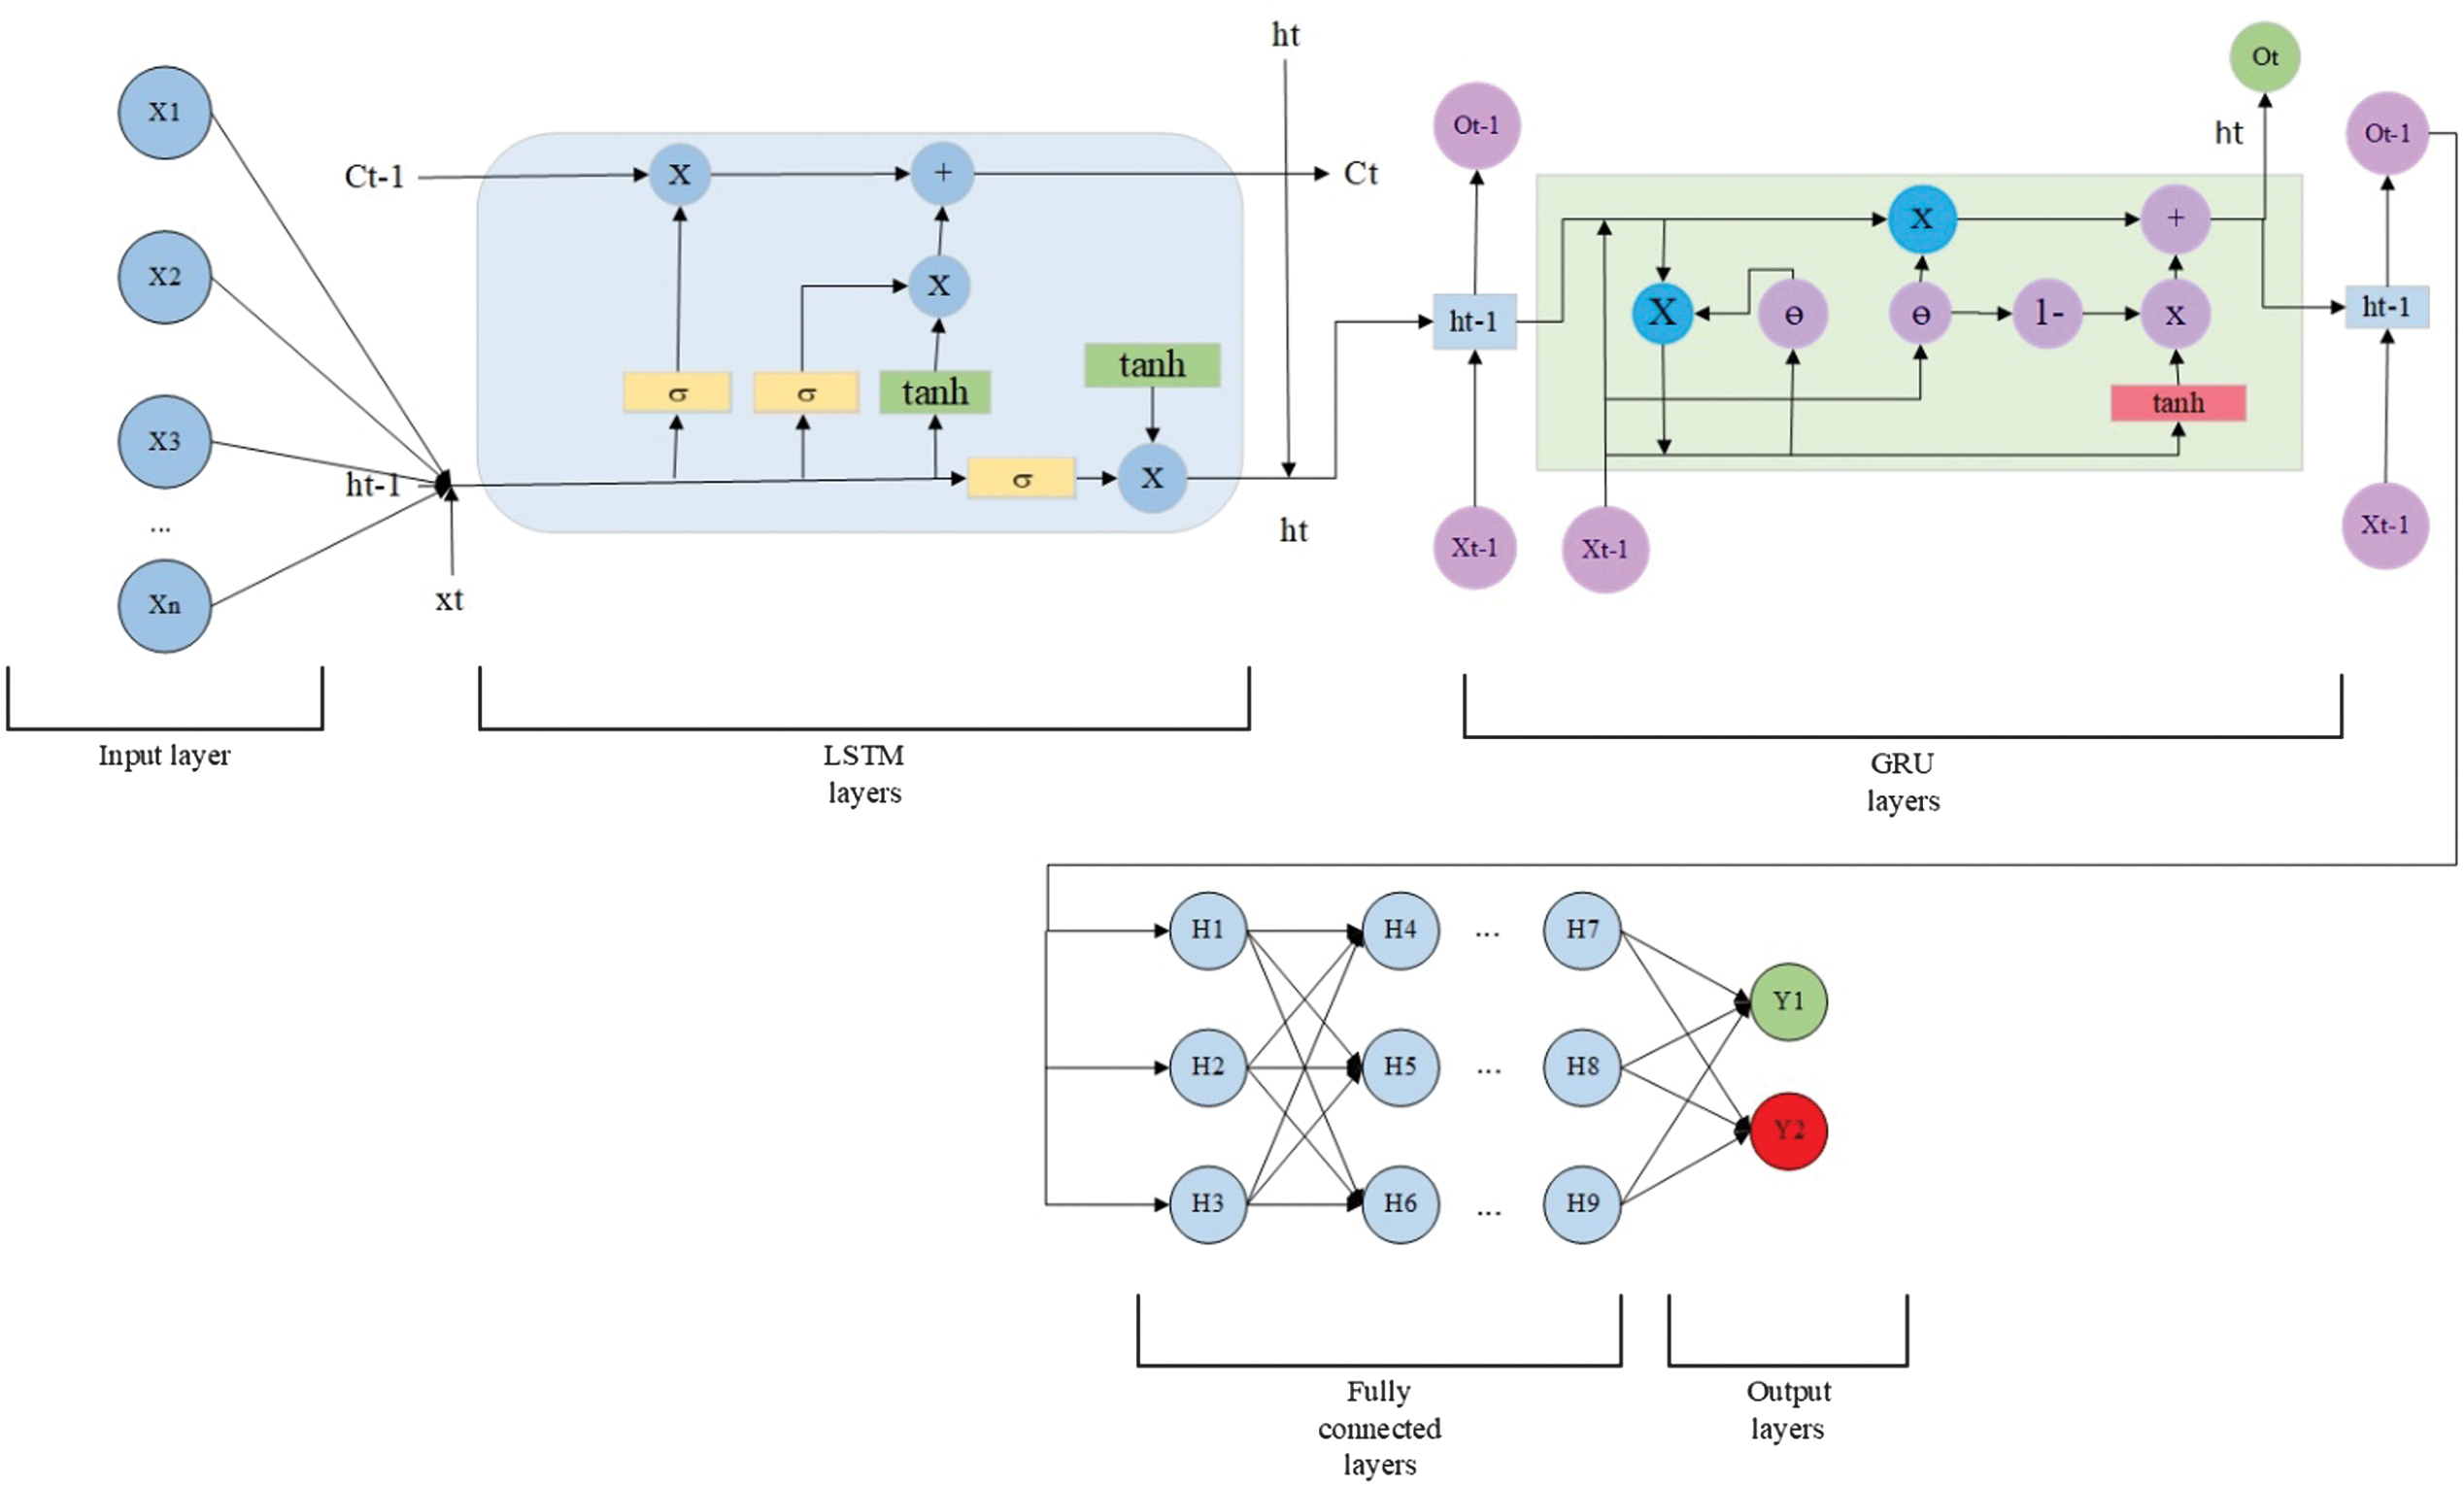
An LSTM-GRU neural network is a hybrid recurrent architecture that combines two types of GRUs: LSTM and GRU. Both LSTM and GRU are designed to process long-term dependencies, but they do so in different ways. Combining them in a single network can leverage their complementary strengths for enhanced sequence modeling. The first layer of the combined model is an LSTM layer with the input data of (20, 1) or (100, 1) shapes, depending on the dataset type. The output from the LSTM is then put into a GRU layer. The GRU is simpler and more computationally efficient than LSTM and is used here to process the temporal patterns extracted by the LSTM further. Following the GRU, a standard dense layer with a single unit and a sigmoid activation function outputs a probability between 0 and 1. The scheme of LSTM-GRU is shown in Fig. 12.
The presented DL models are actively used in the subsequent experiments.
IV.EXPERIMENTAL RESULTS
Experimental results on classifying cyber threats were conducted using four DL models: DNN, CNN, CNN-LSTM, and LSTM-GRU. Each architecture was trained and tested on labeled threat data to evaluate its effectiveness in identifying malicious activity. The models’ performance was estimated using accuracy, precision, recall, and F1-score classification metrics (12)–(15):
where TP is true positives, TN is true negatives, FP is false positives, and FN is false negatives.Additionally, the performance of the DL models was visually assessed through accuracy, loss, and confusion matrix plots. The accuracy plot illustrates the model’s progression in correctly classifying samples during the training and validation phases, providing insight into how well the model learns over time. The loss plot tracked the model’s error over time, helping to identify signs of convergence, underfitting, or overfitting by comparing training and validation loss curves. Additionally, confusion matrix plots were used to examine the distribution of true positives, true negatives, false positives, and false negatives for each model. These matrices offered a transparent and interpretable representation of the models’ classification behavior, revealing whether they were biased toward certain classes or struggling with specific misclassifications. Together, these visualizations had a significant role in evaluating and comparing the effectiveness and reliability of each model in detecting cyber threats.
The classification results of DDoS attacks are shown in Table I. The accuracy, loss, and confusion matrices plots are presented in Fig. 13–17.
Table I. Classification results of DDoS attacks
| Metrics | SVM | Random forest | DNN | CNN | CNN-LSTM | LSTM-GRU |
|---|---|---|---|---|---|---|
| Accuracy | 0.979 | 0.999 | 0.976 | 0.972 | 0.975 | 0.951 |
| Precision | 0.961 | 0.999 | 0.962 | 0.952 | 0.959 | 0.953 |
| Recall | 0.998 | 0.999 | 0.991 | 0.995 | 0.994 | 0.949 |
| F1-score | 0.979 | 0.999 | 0.976 | 0.973 | 0.976 | 0.951 |
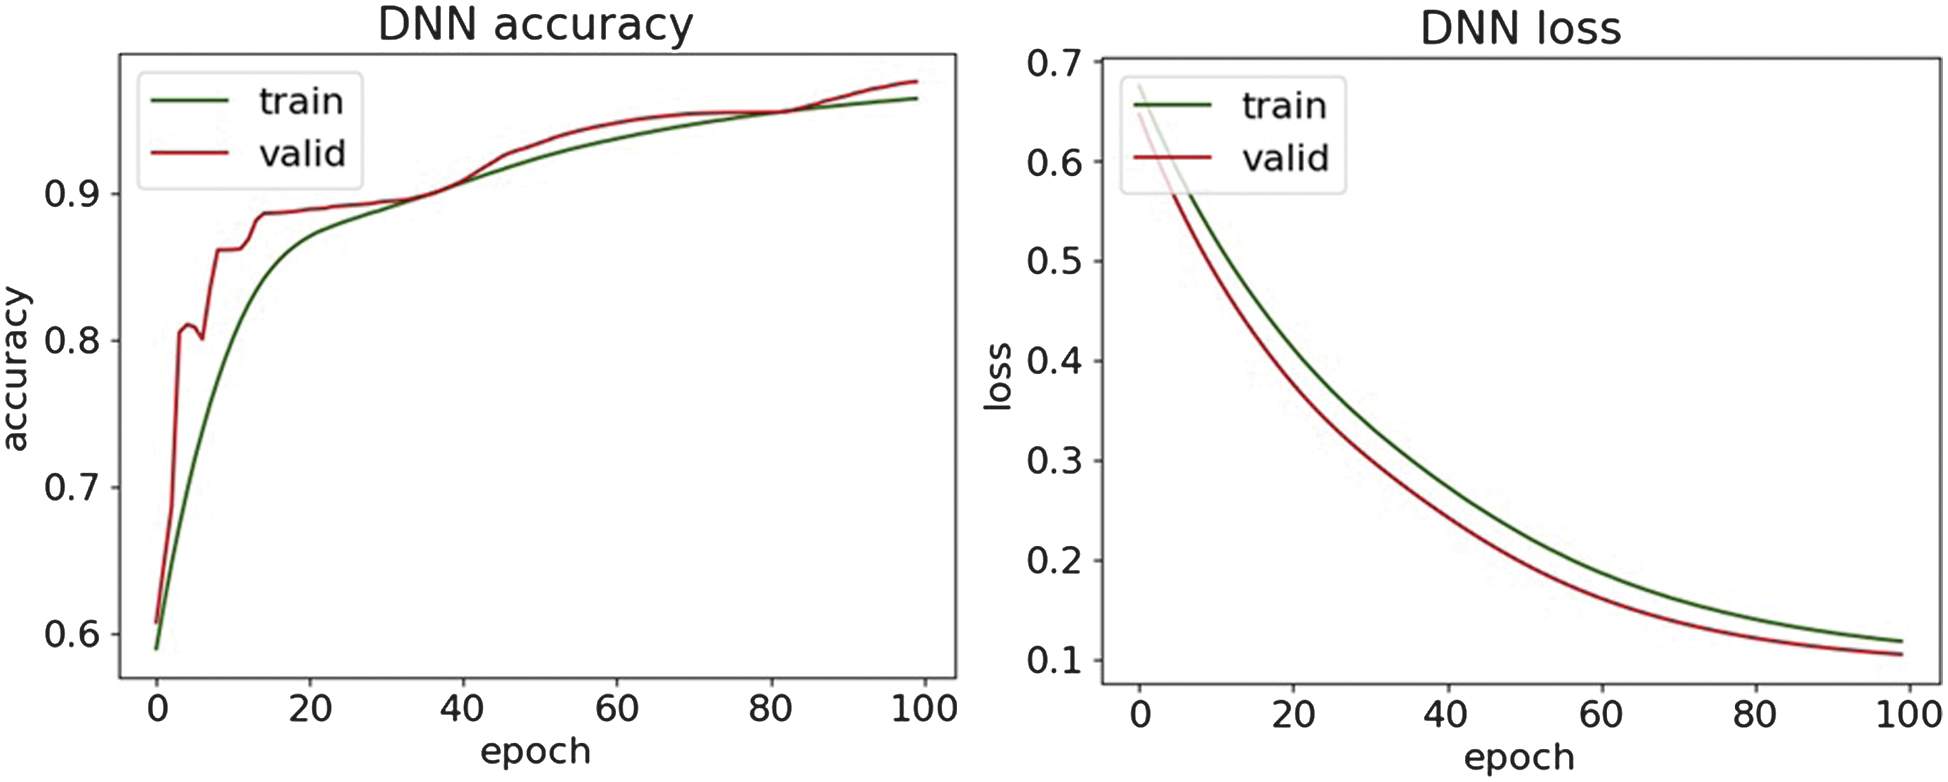 Fig. 13. The accuracy and loss plots of DNN.
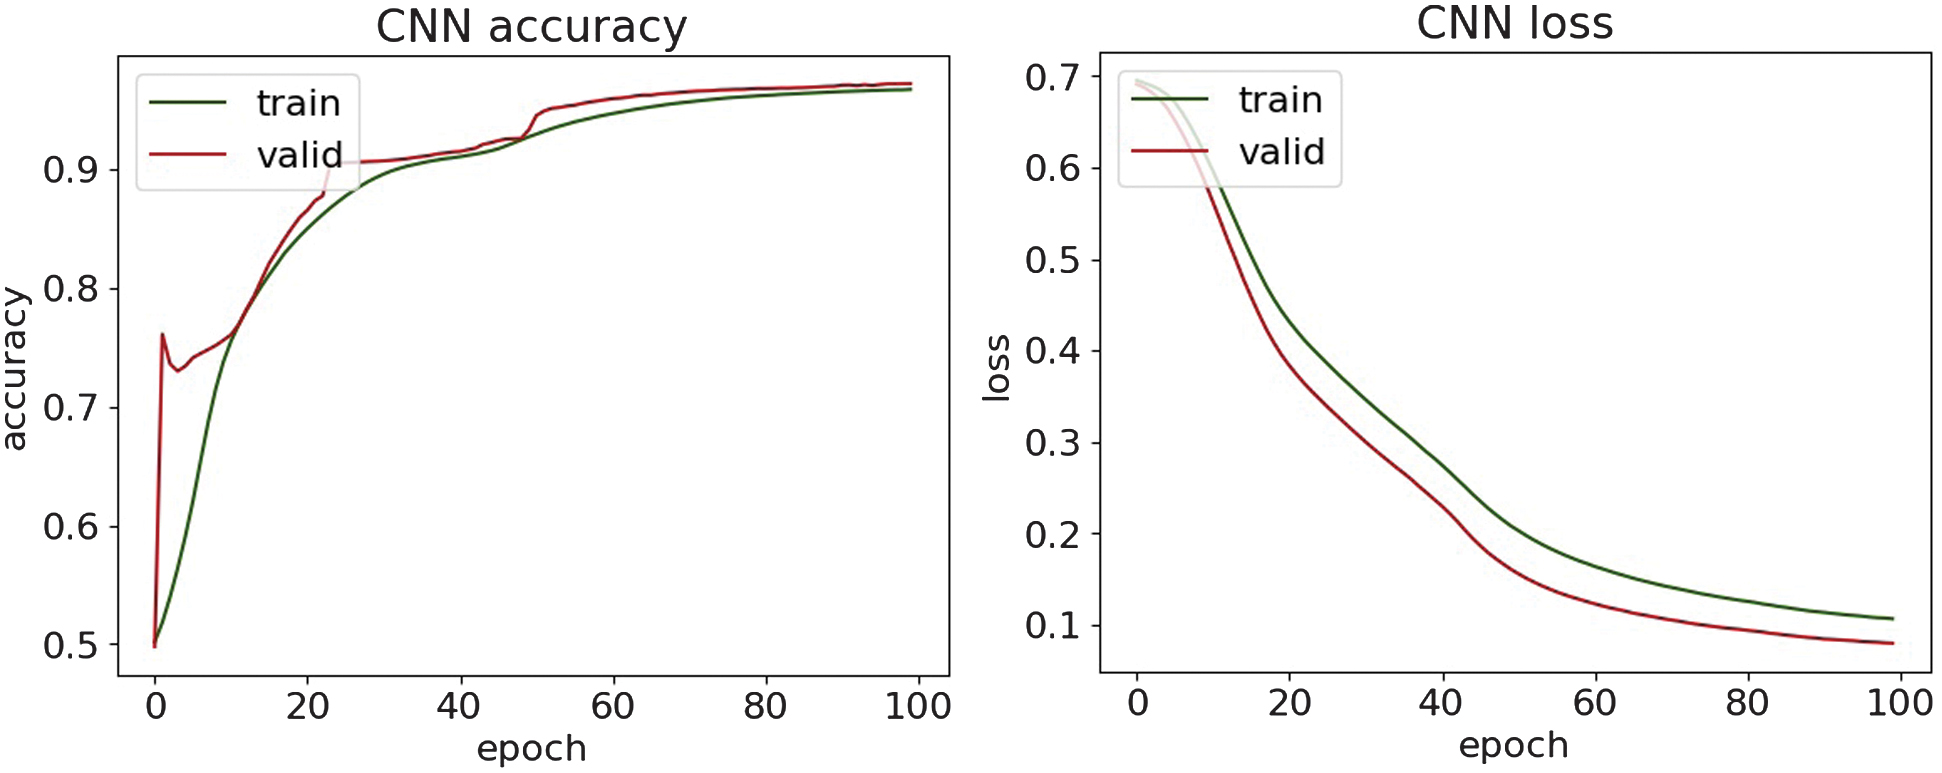 Fig. 14. The accuracy and loss plots of CNN.
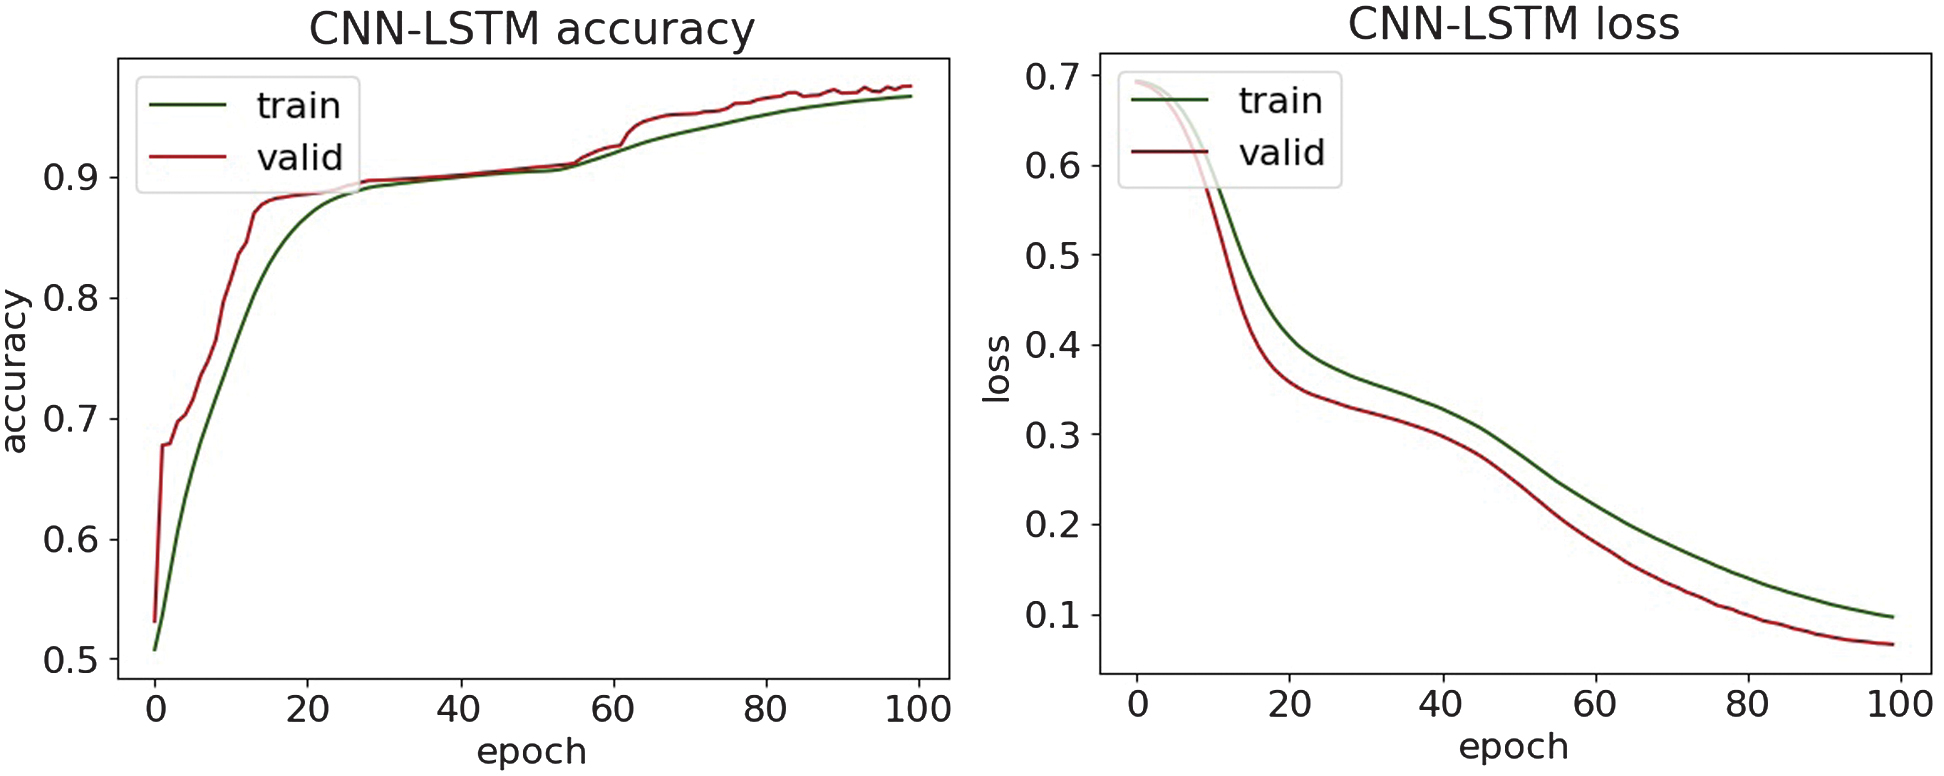 Fig. 15. The accuracy and loss plots of CNN-LSTM.
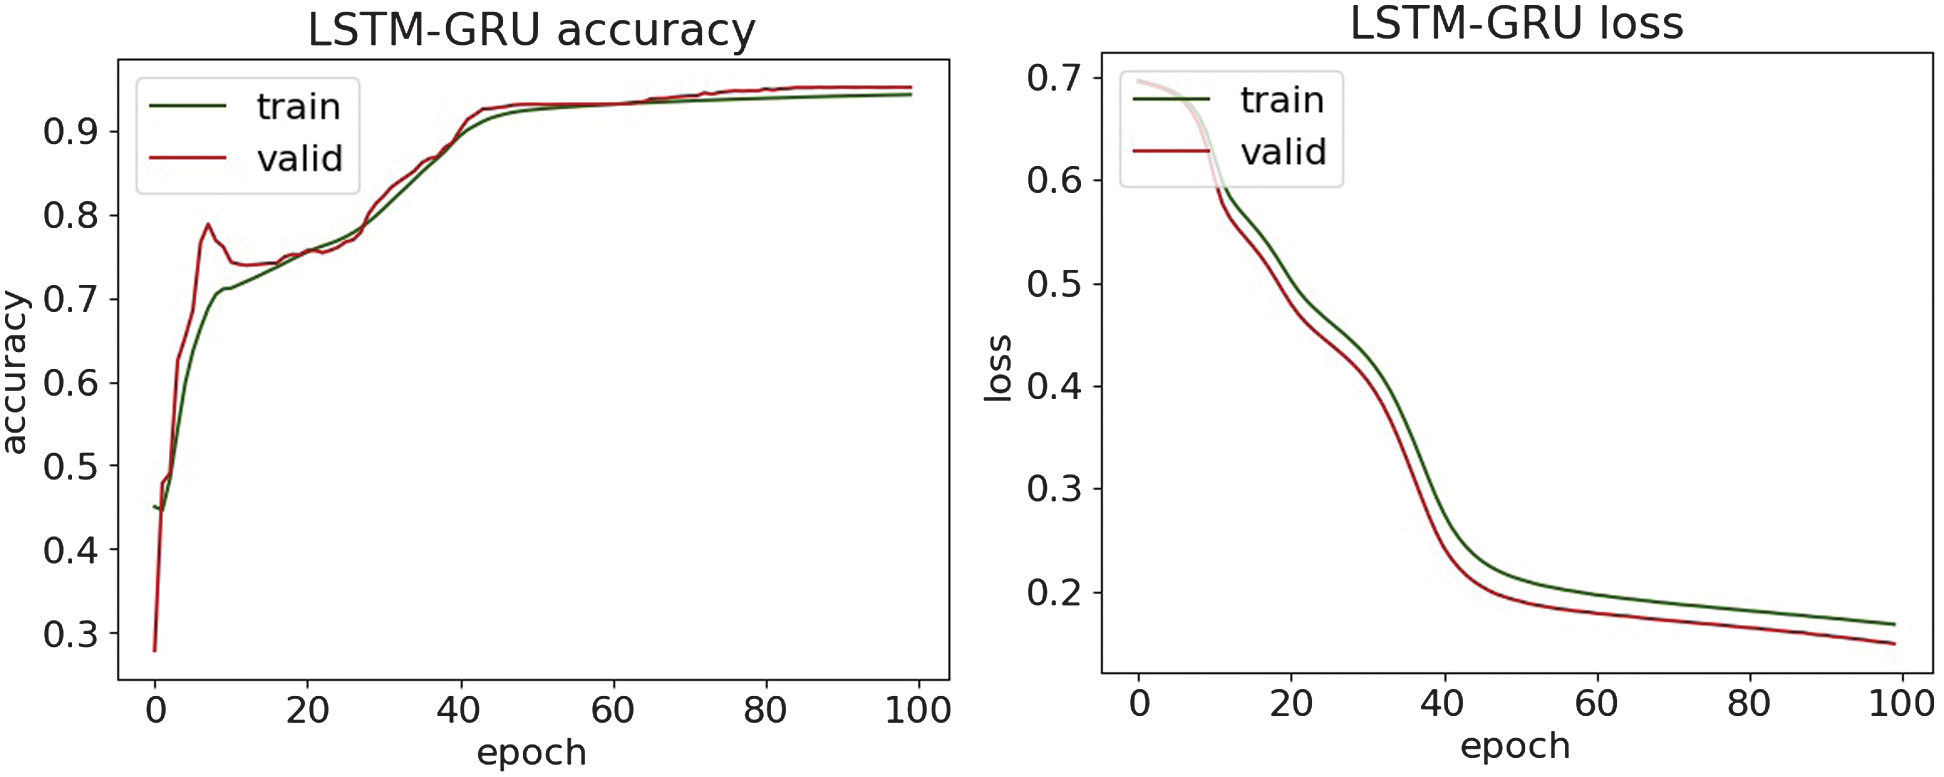 Fig. 16. The accuracy and loss plots of LSTM-GRU.
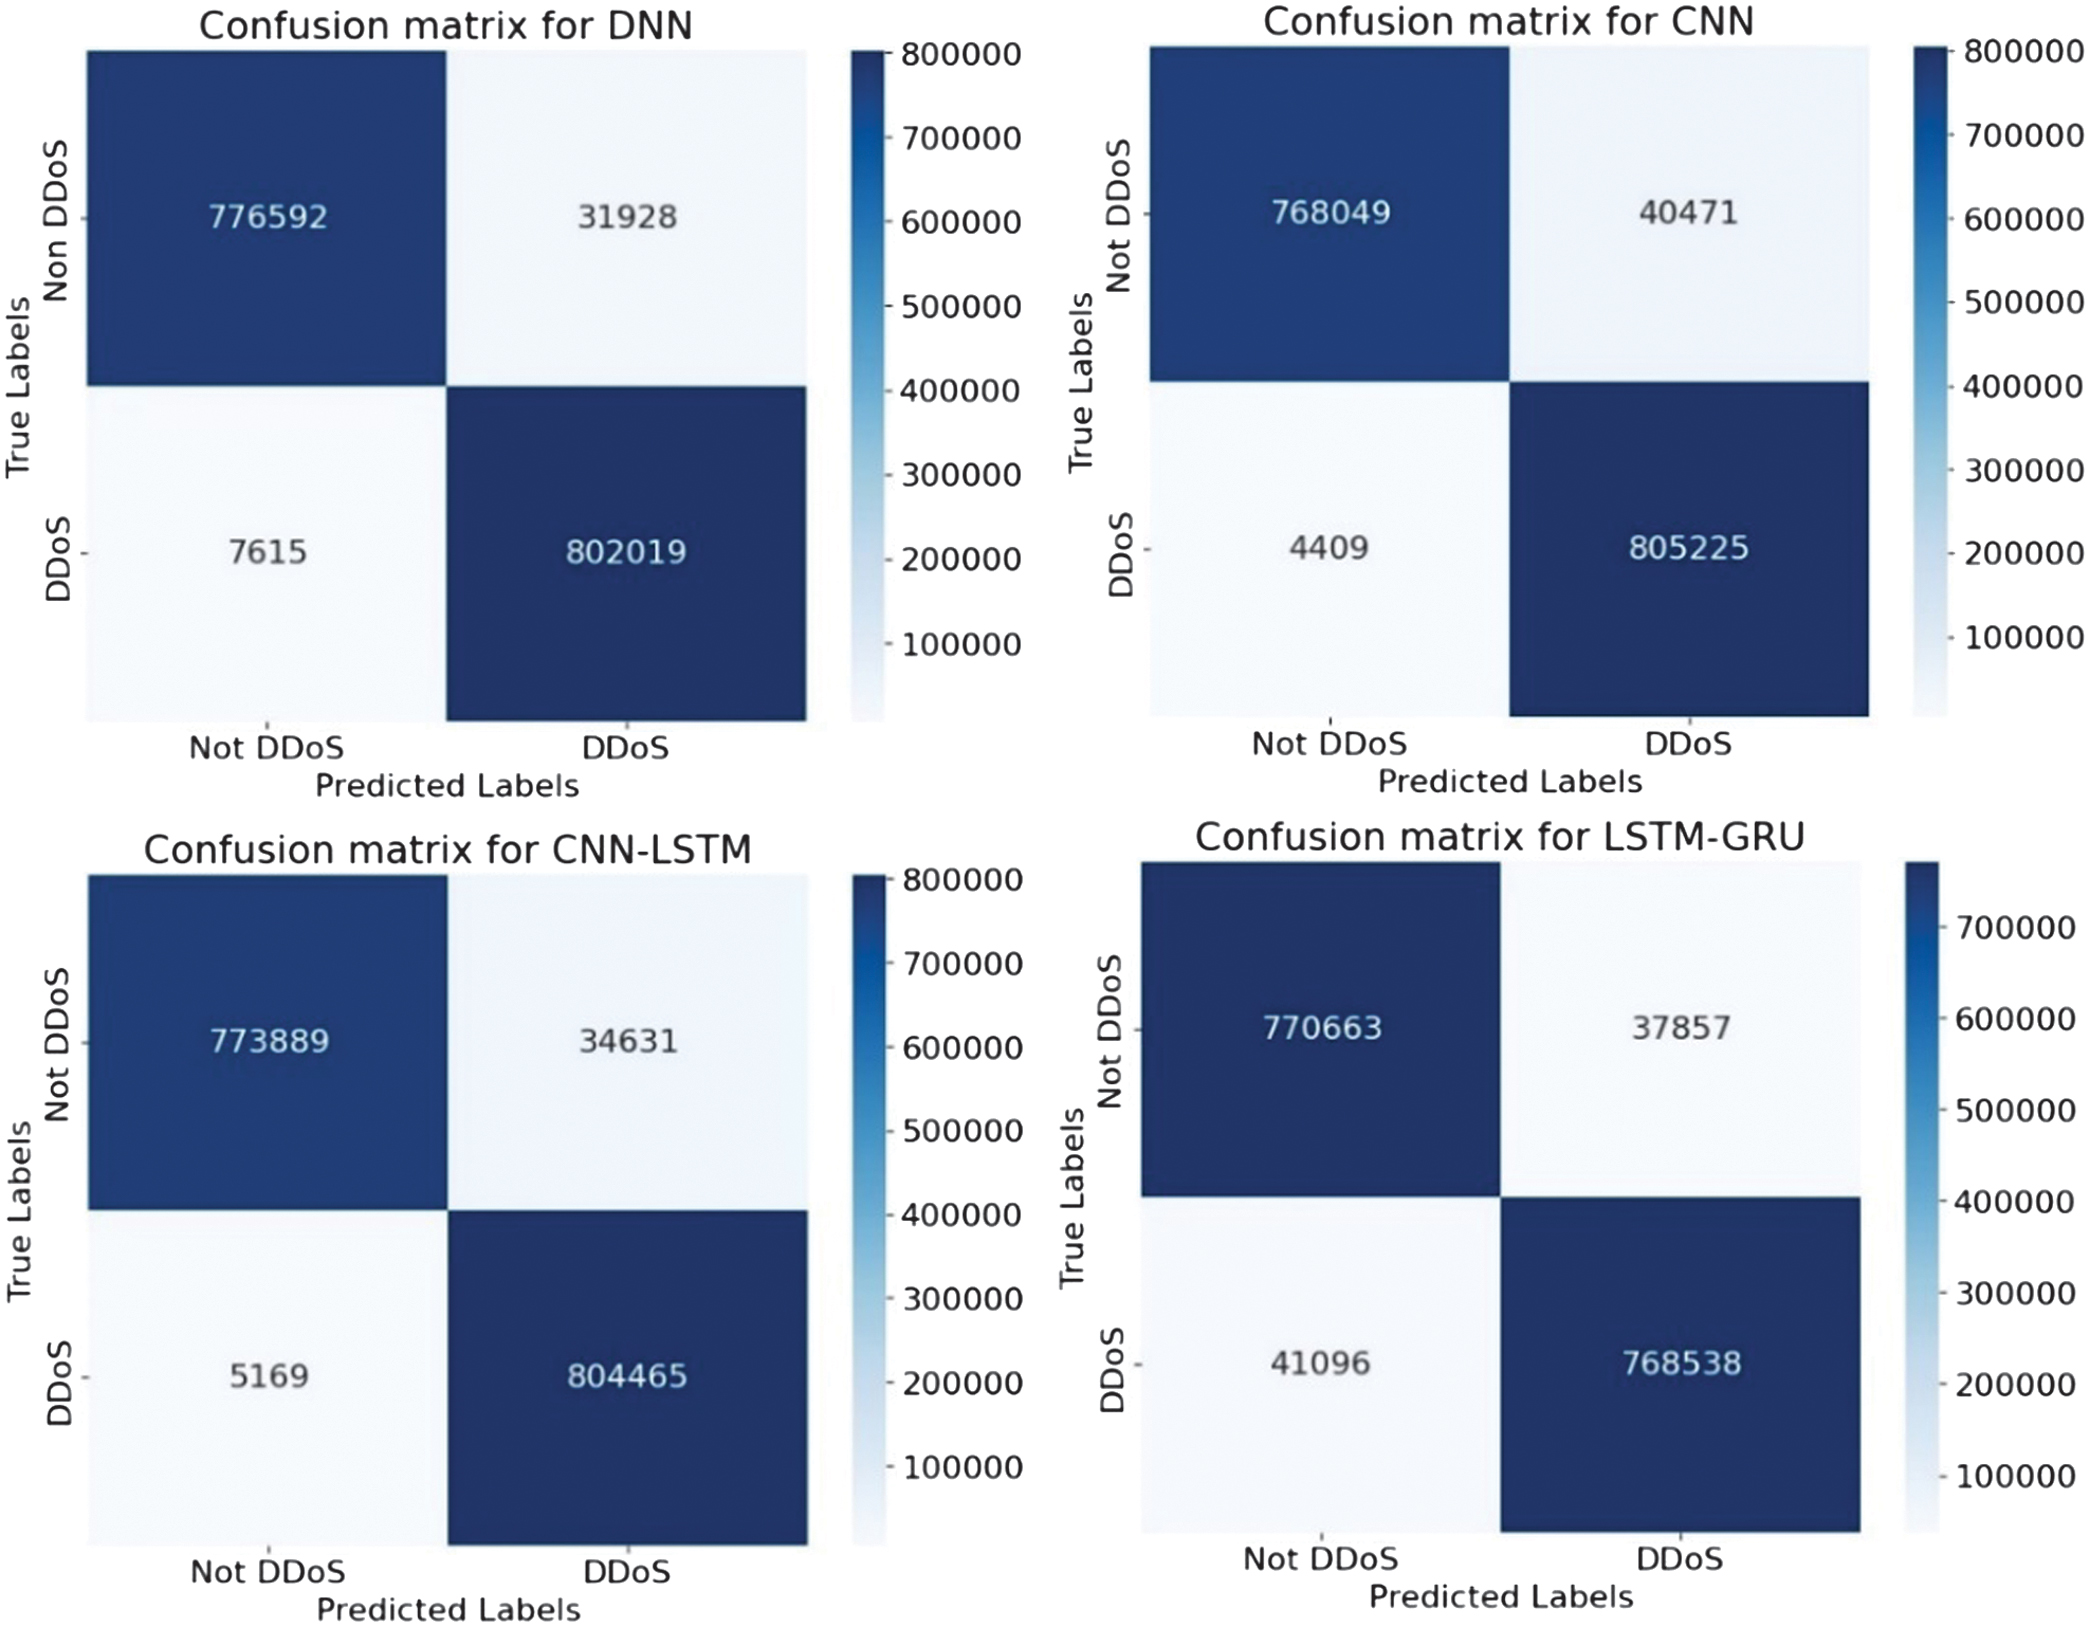 Fig. 17. The confusion matrices.
Along with the comparison of the received results themselves, they are evaluated with the results of the paper [36]. The obtained experimental results demonstrate superior detection performance, achieving accuracy values in the range of 95% and 97%, while the reported reference paper results have a maximum accuracy of 93.41% on a similar dataset. These findings highlight the effectiveness of the methods used in detecting the DDoS attack.
The classification results of MitM attacks are shown in Table II. The accuracy, loss, and confusion matrices plots are presented in Fig. 18–22.
Table II. Classification results of MitM attacks
| Metrics | SVM | Random forest | DNN | CNN | CNN-LSTM | LSTM-GRU |
|---|---|---|---|---|---|---|
| Accuracy | 0.952 | 0.999 | 0.976 | 0.973 | 0.968 | 0.976 |
| Precision | 0.923 | 0.999 | 0.961 | 0.976 | 0.971 | 0.969 |
| Recall | 0.986 | 0.999 | 0.994 | 0.970 | 0.964 | 0.982 |
| F1-score | 0.953 | 0.999 | 0.977 | 0.973 | 0.967 | 0.976 |
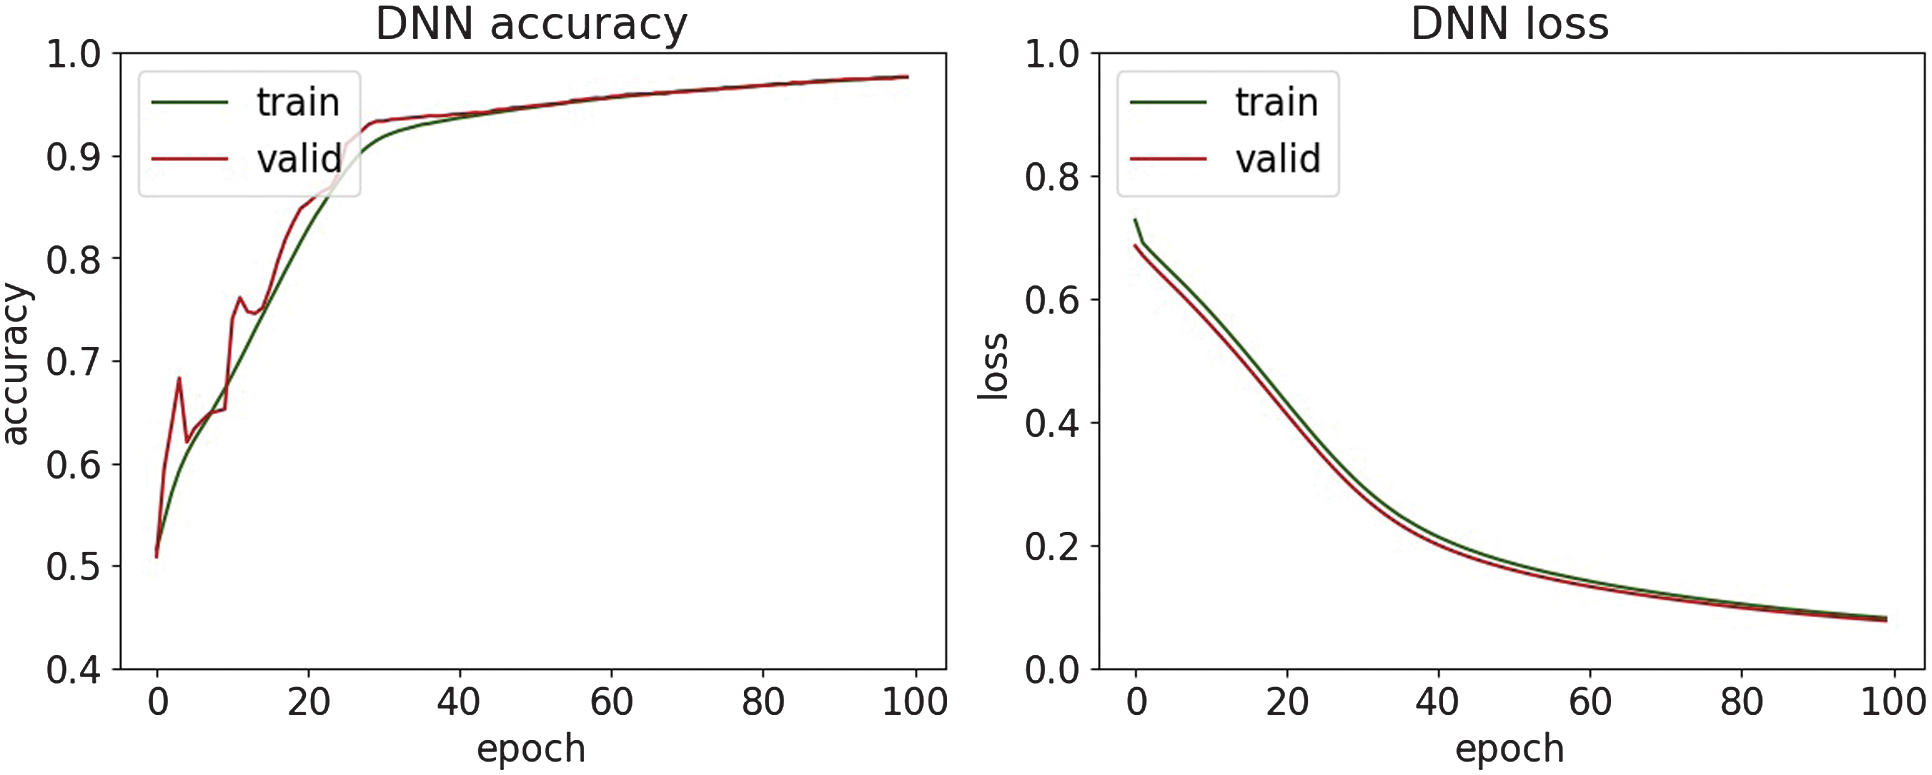 Fig. 18. The accuracy and loss plots of DNN.
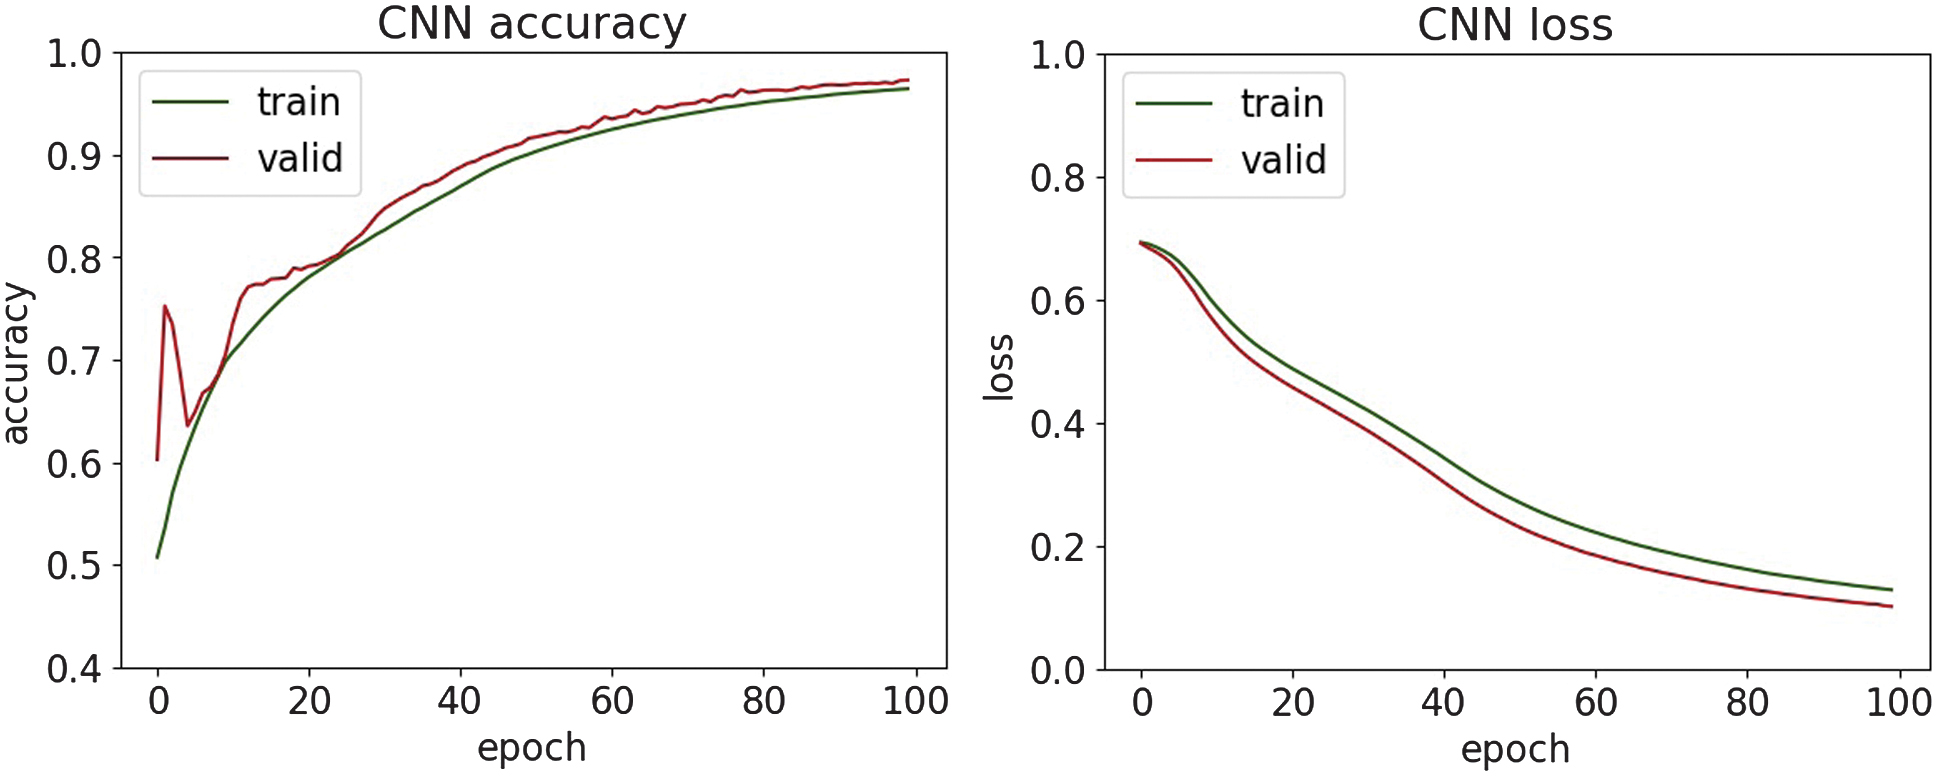 Fig. 19. The accuracy and loss plots of CNN.
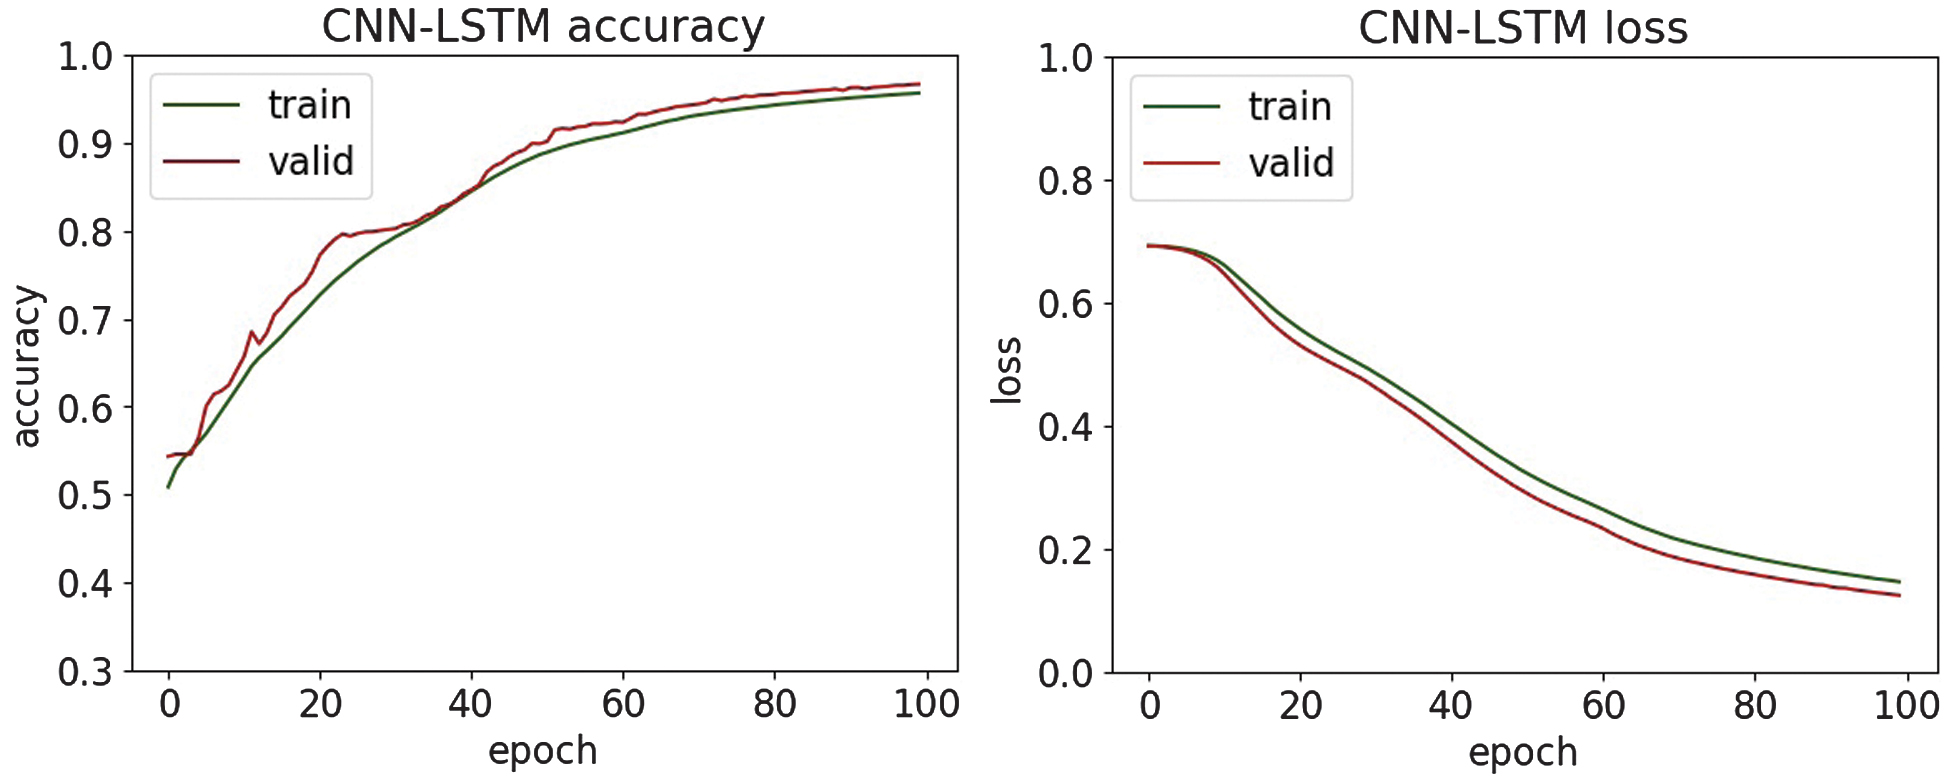 Fig. 20. The accuracy and loss plots of CNN-LSTM.
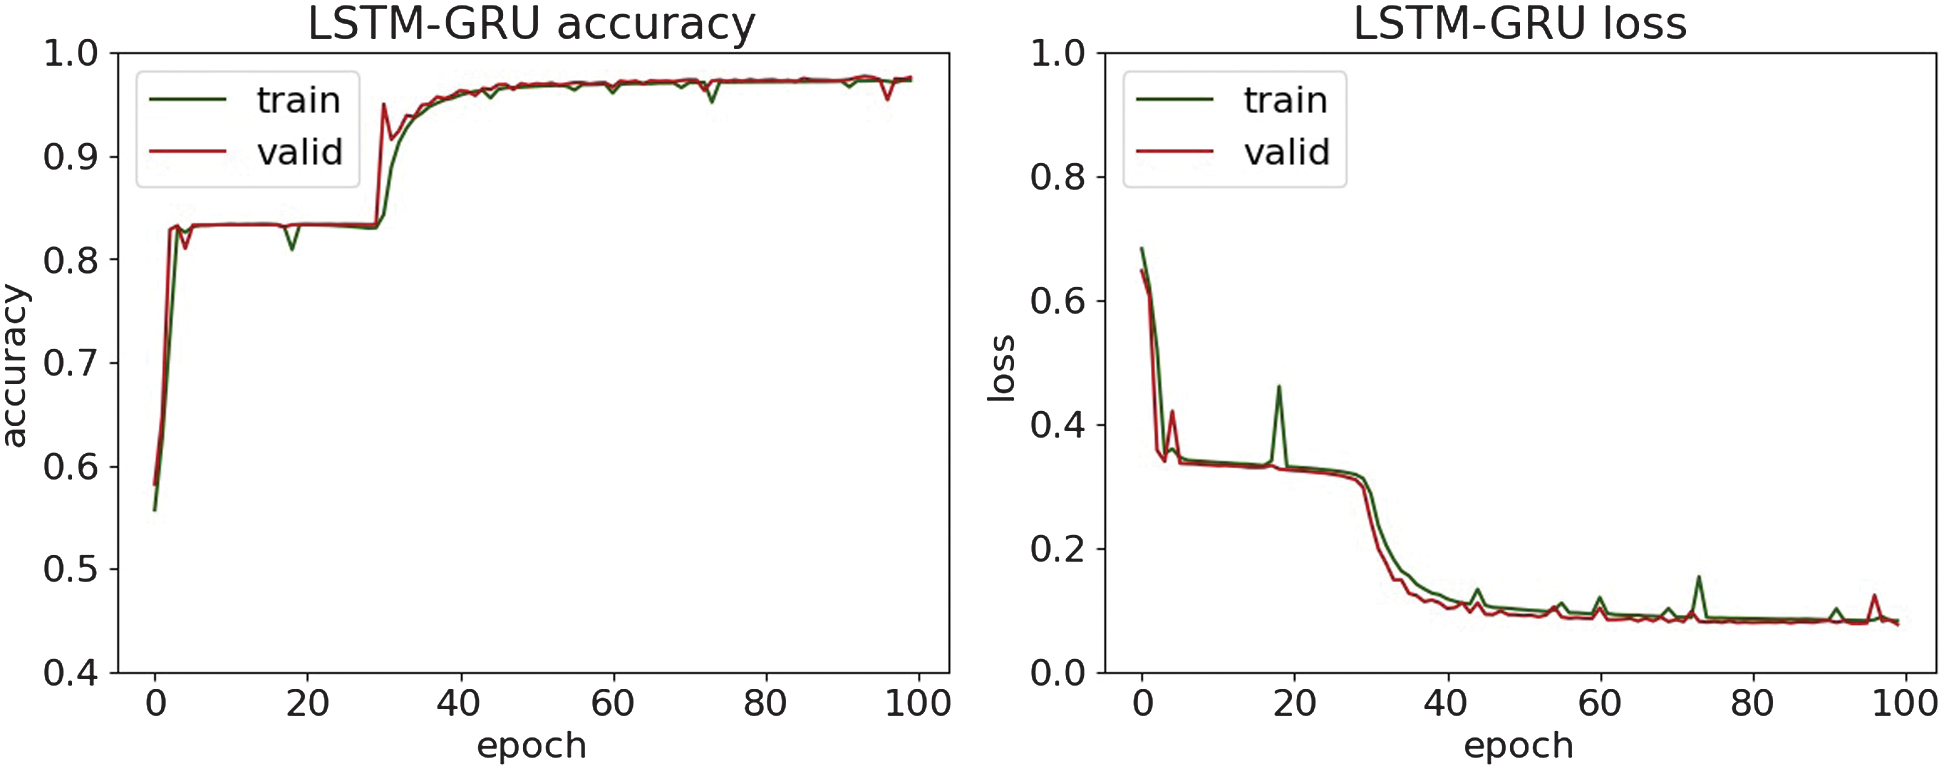 Fig. 21. The accuracy and loss plots of LSTM-GRU.
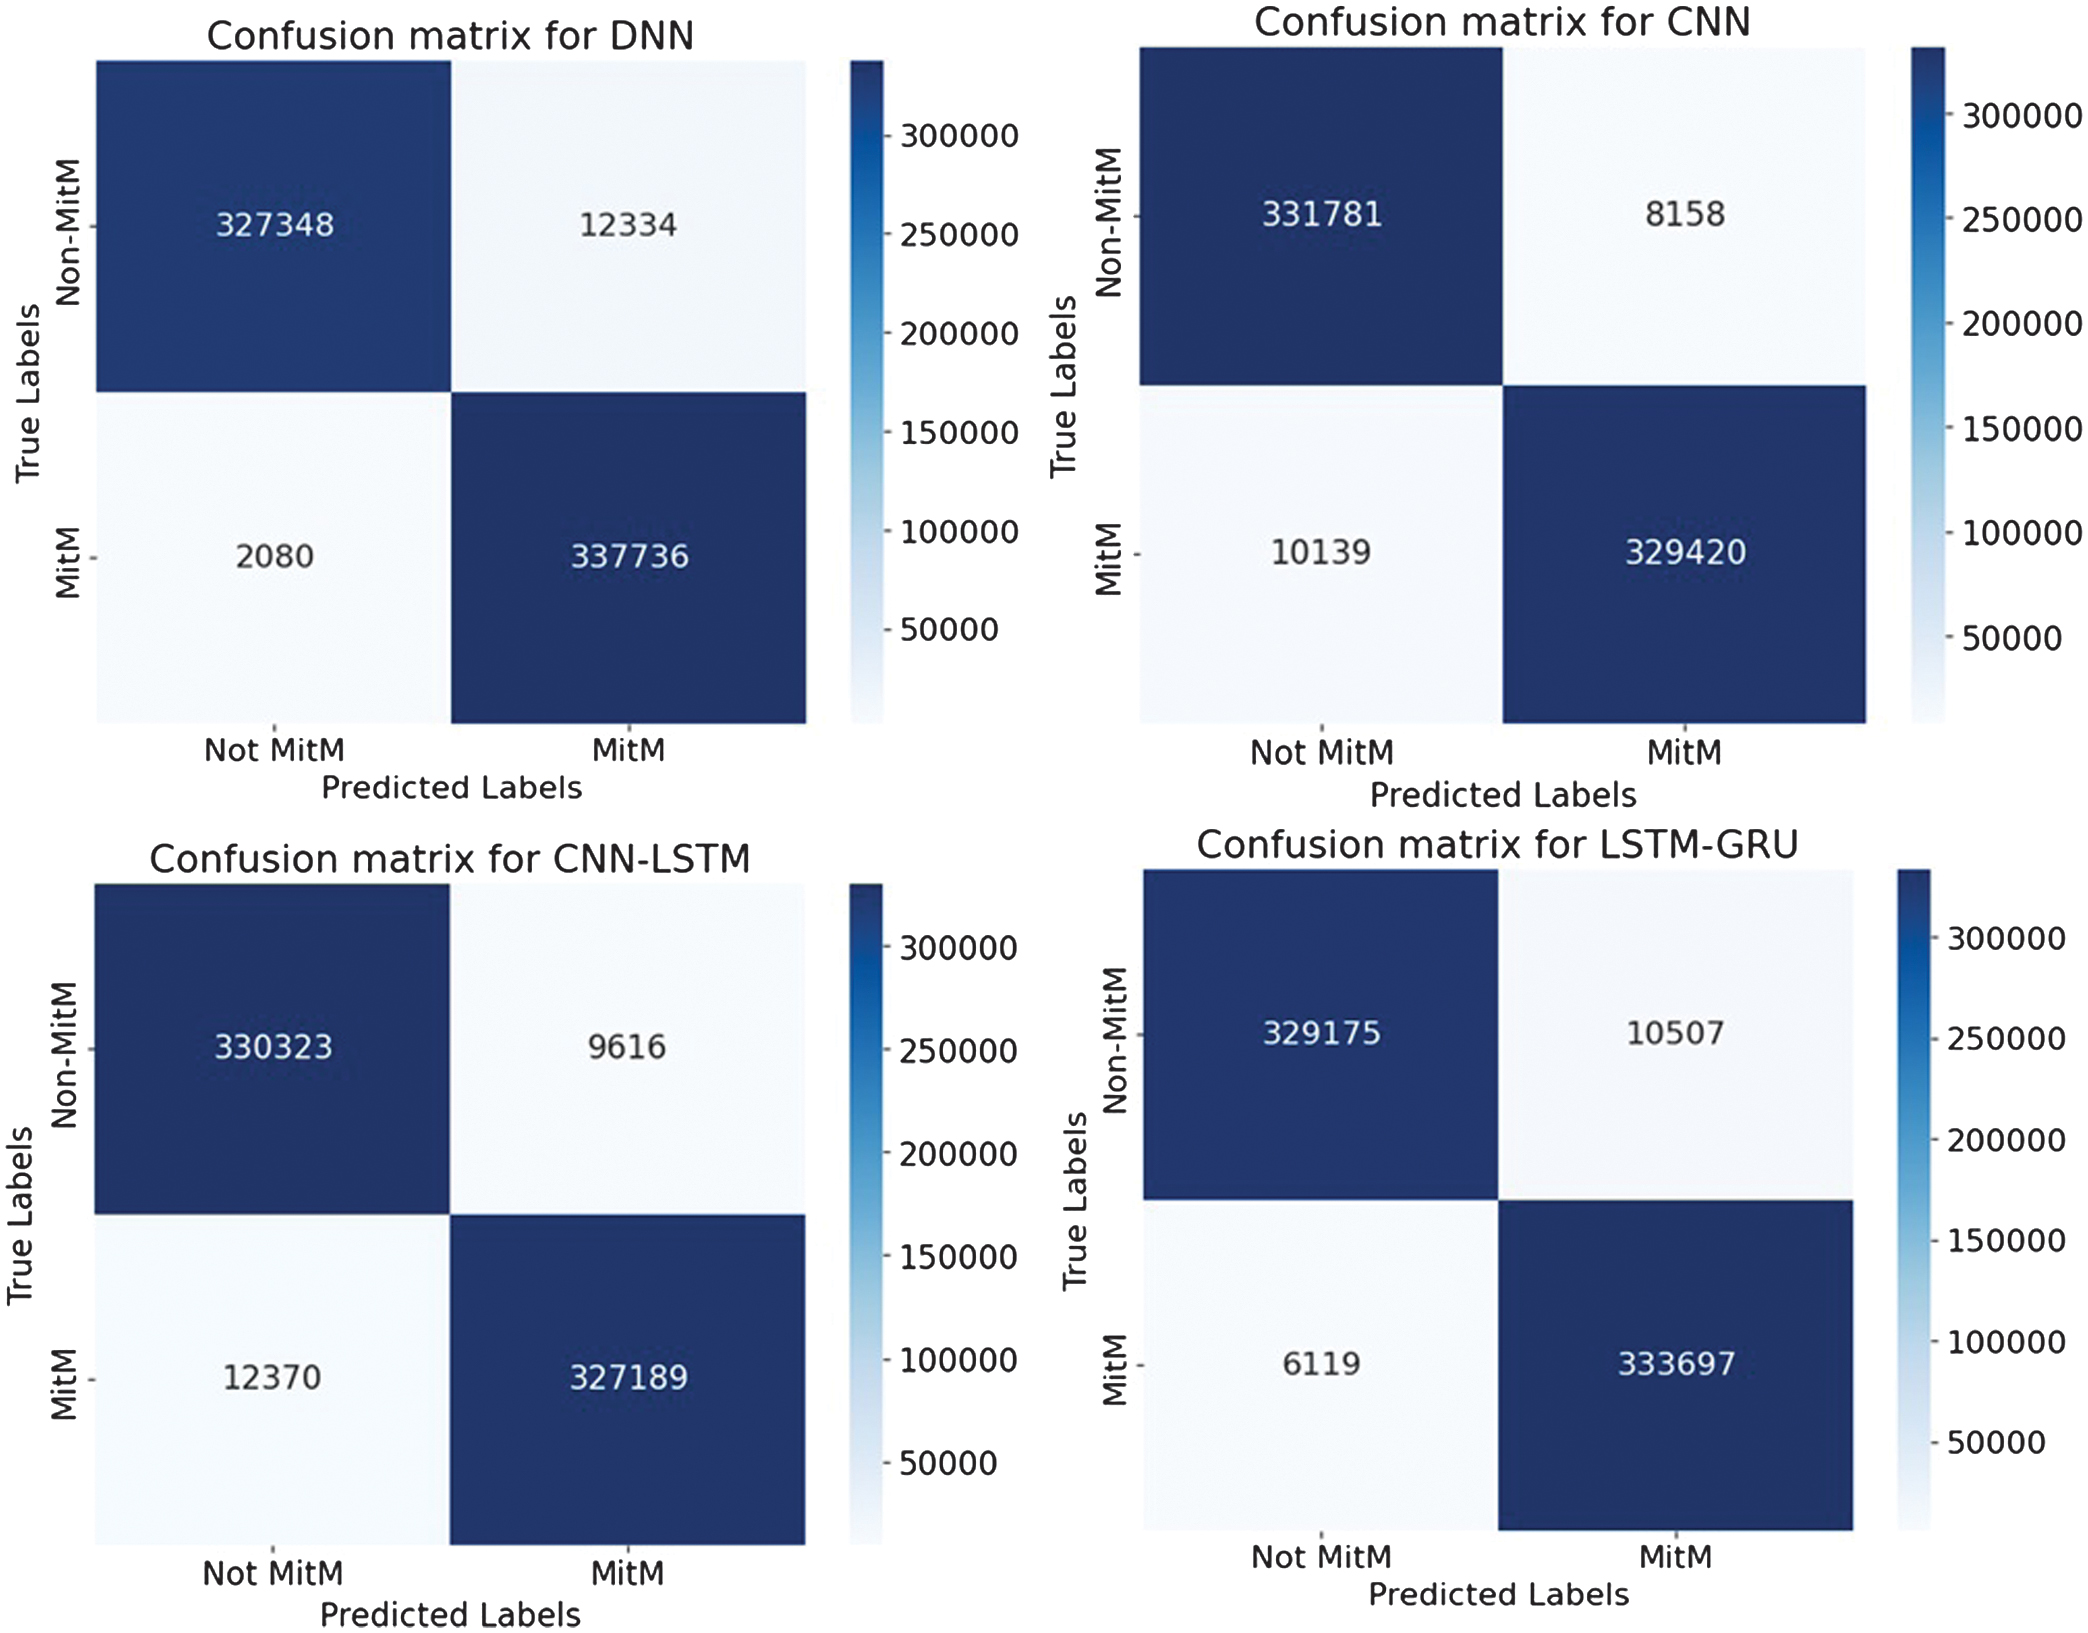 Fig. 22. The confusion matrices.
The comparison of MitM classification results with the paper [37], which applies a multimodal Generative Adversarial Networks-enhanced detection framework, reports an accuracy score of approximately 83% on the MitM dataset. The presented research demonstrates substantially stronger detection. It delivers a targeted DL pipeline for MitM attacks, achieving an accuracy score of 97.6%. This combination of higher empirical performance and system-level implementation underscores the practical superiority and contribution of the presented study.
The classification results of malware attacks are shown in Table III. The accuracy, loss, and confusion matrices plots are presented in Fig. 23–27.
Table III. Classification results of malware
| Metrics | SVM | Random forest | DNN | CNN | CNN-LSTM | LSTM-GRU |
|---|---|---|---|---|---|---|
| Accuracy | 0.984 | 0.999 | 0.956 | 0.941 | 0.926 | 0.909 |
| Precision | 0.983 | 0.999 | 0.953 | 0.941 | 0.927 | 0.909 |
| Recall | 0.985 | 0.999 | 0.959 | 0.941 | 0.925 | 0.911 |
| F1-score | 0.984 | 0.999 | 0.956 | 0.941 | 0.926 | 0.910 |
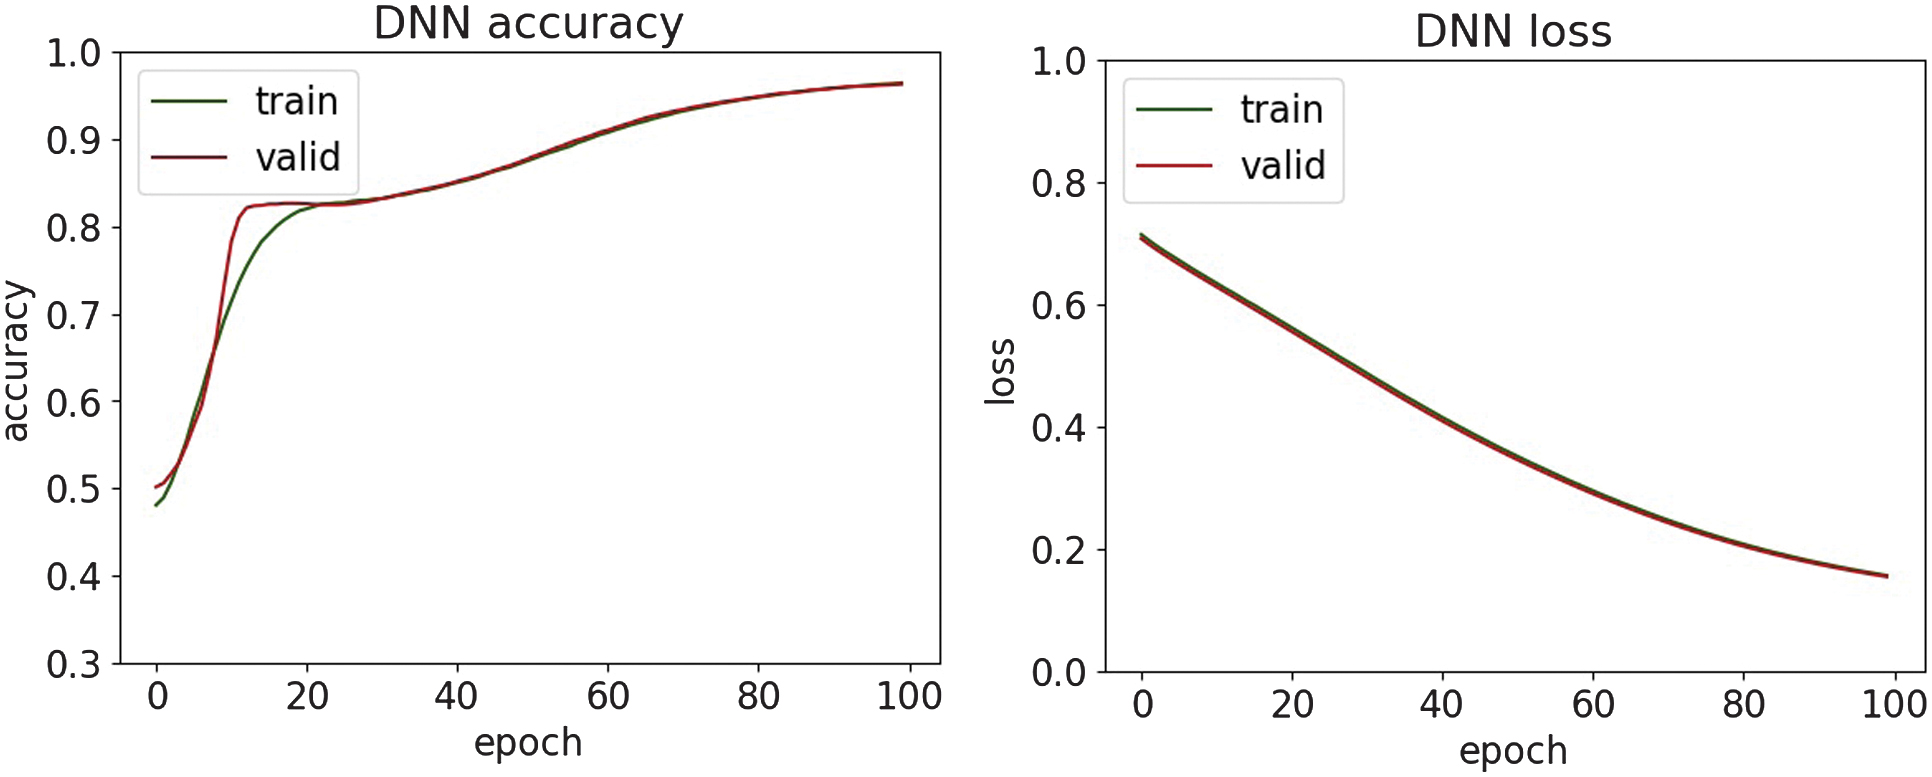 Fig. 23. The accuracy and loss plots of DNN.
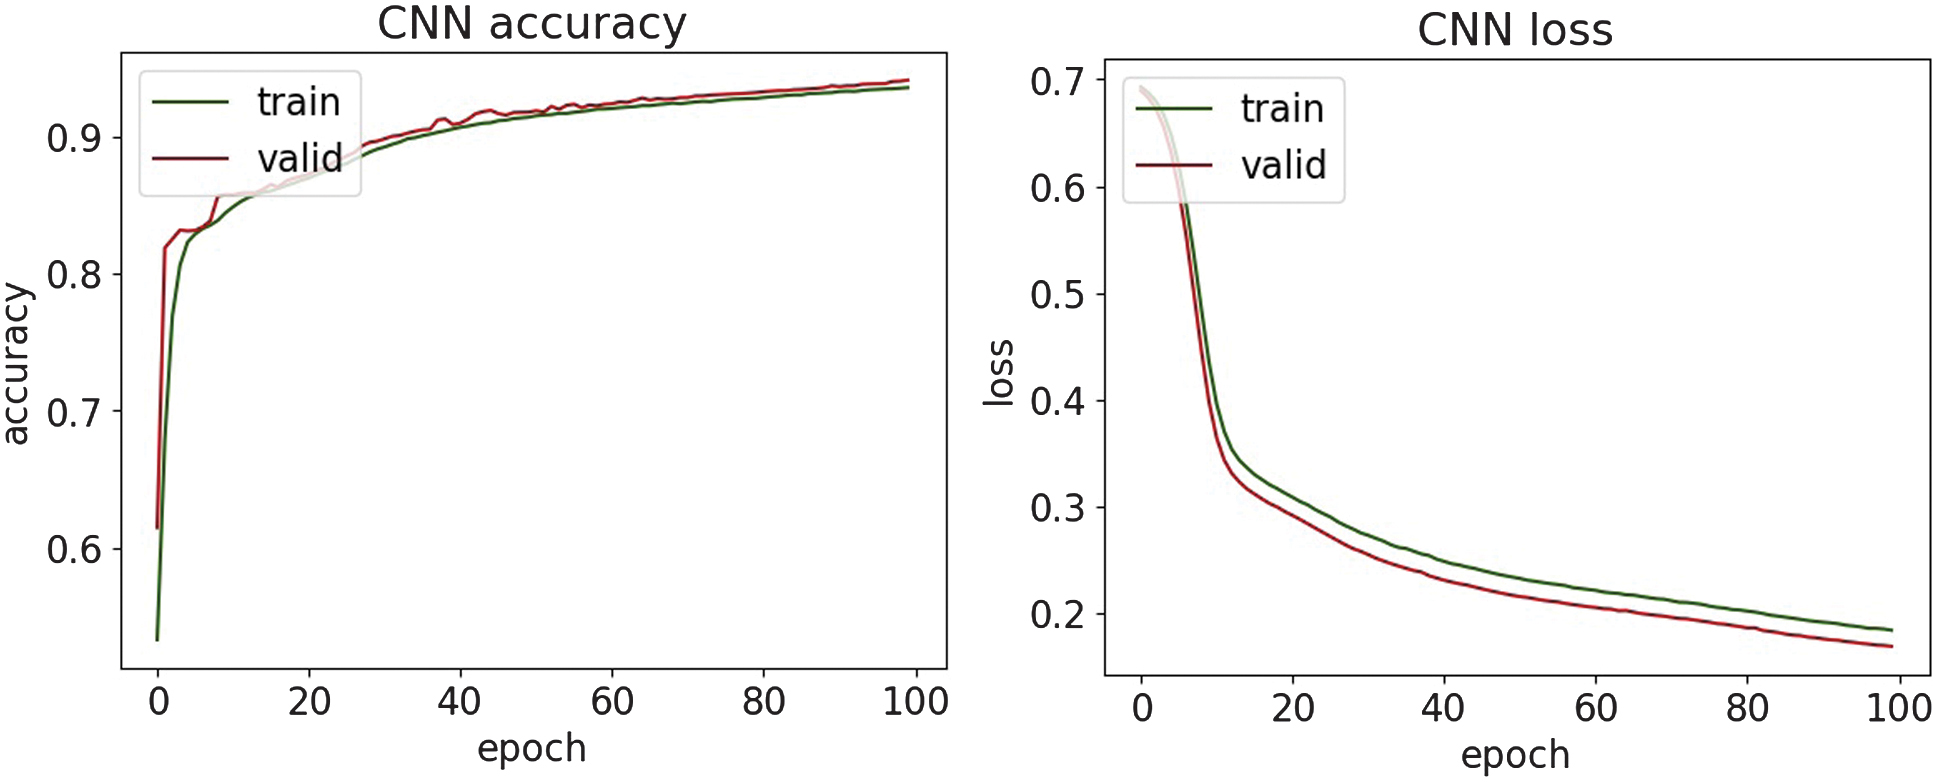 Fig. 24. The accuracy and loss plots of CNN.
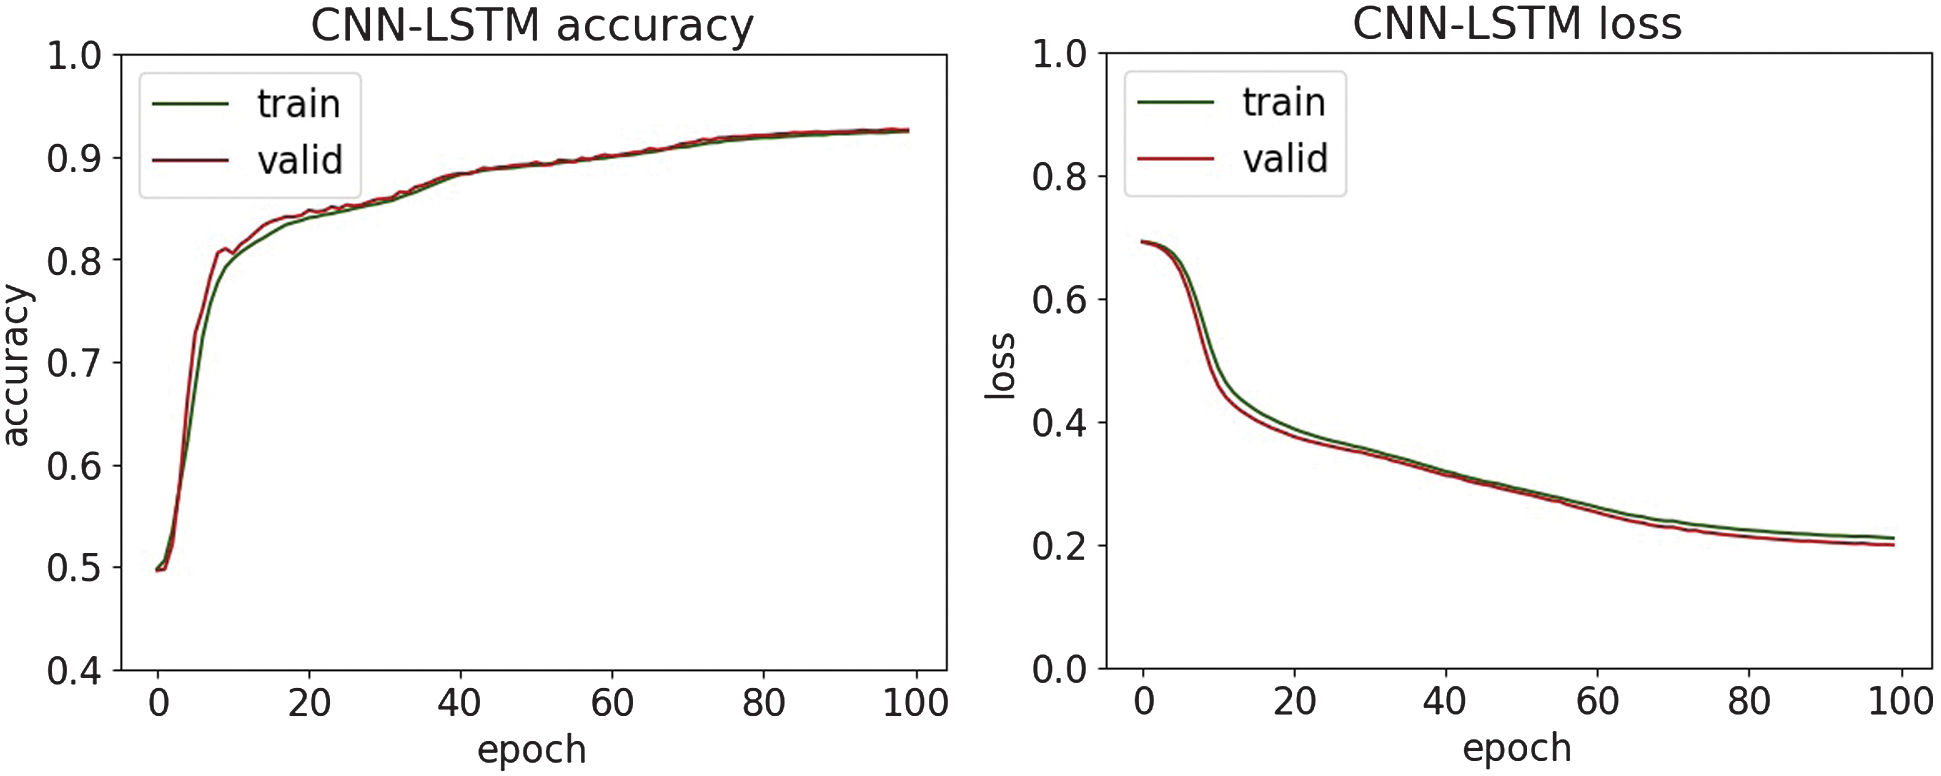 Fig. 25. The accuracy and loss plots of CNN-LSTM.
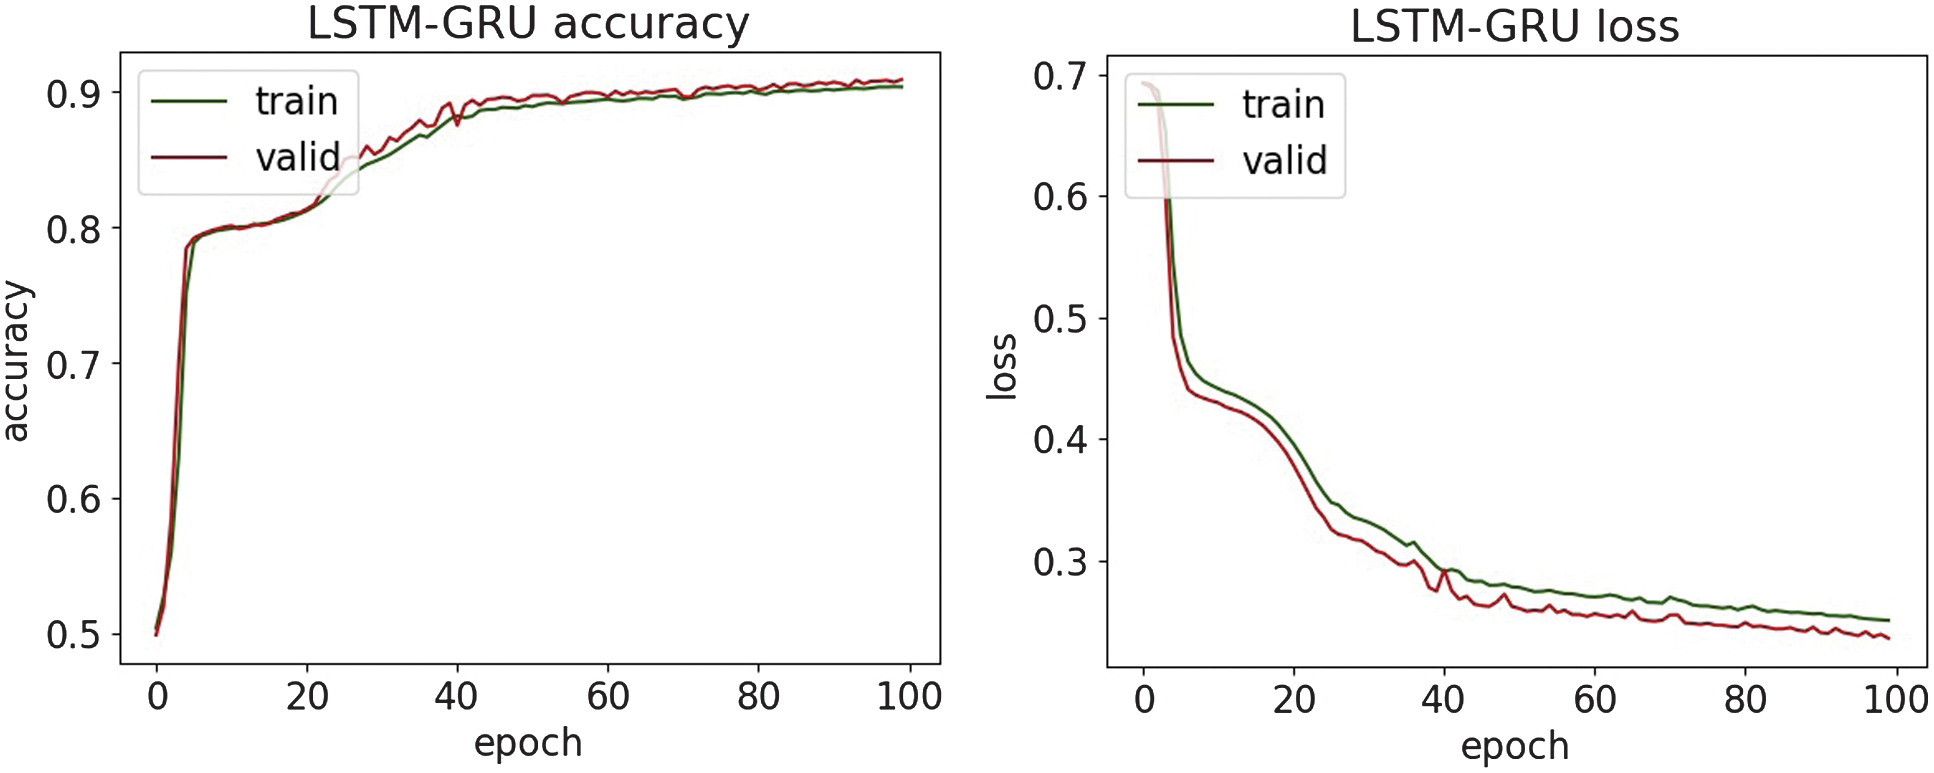 Fig. 26. The accuracy and loss plots of LSTM-GRU.
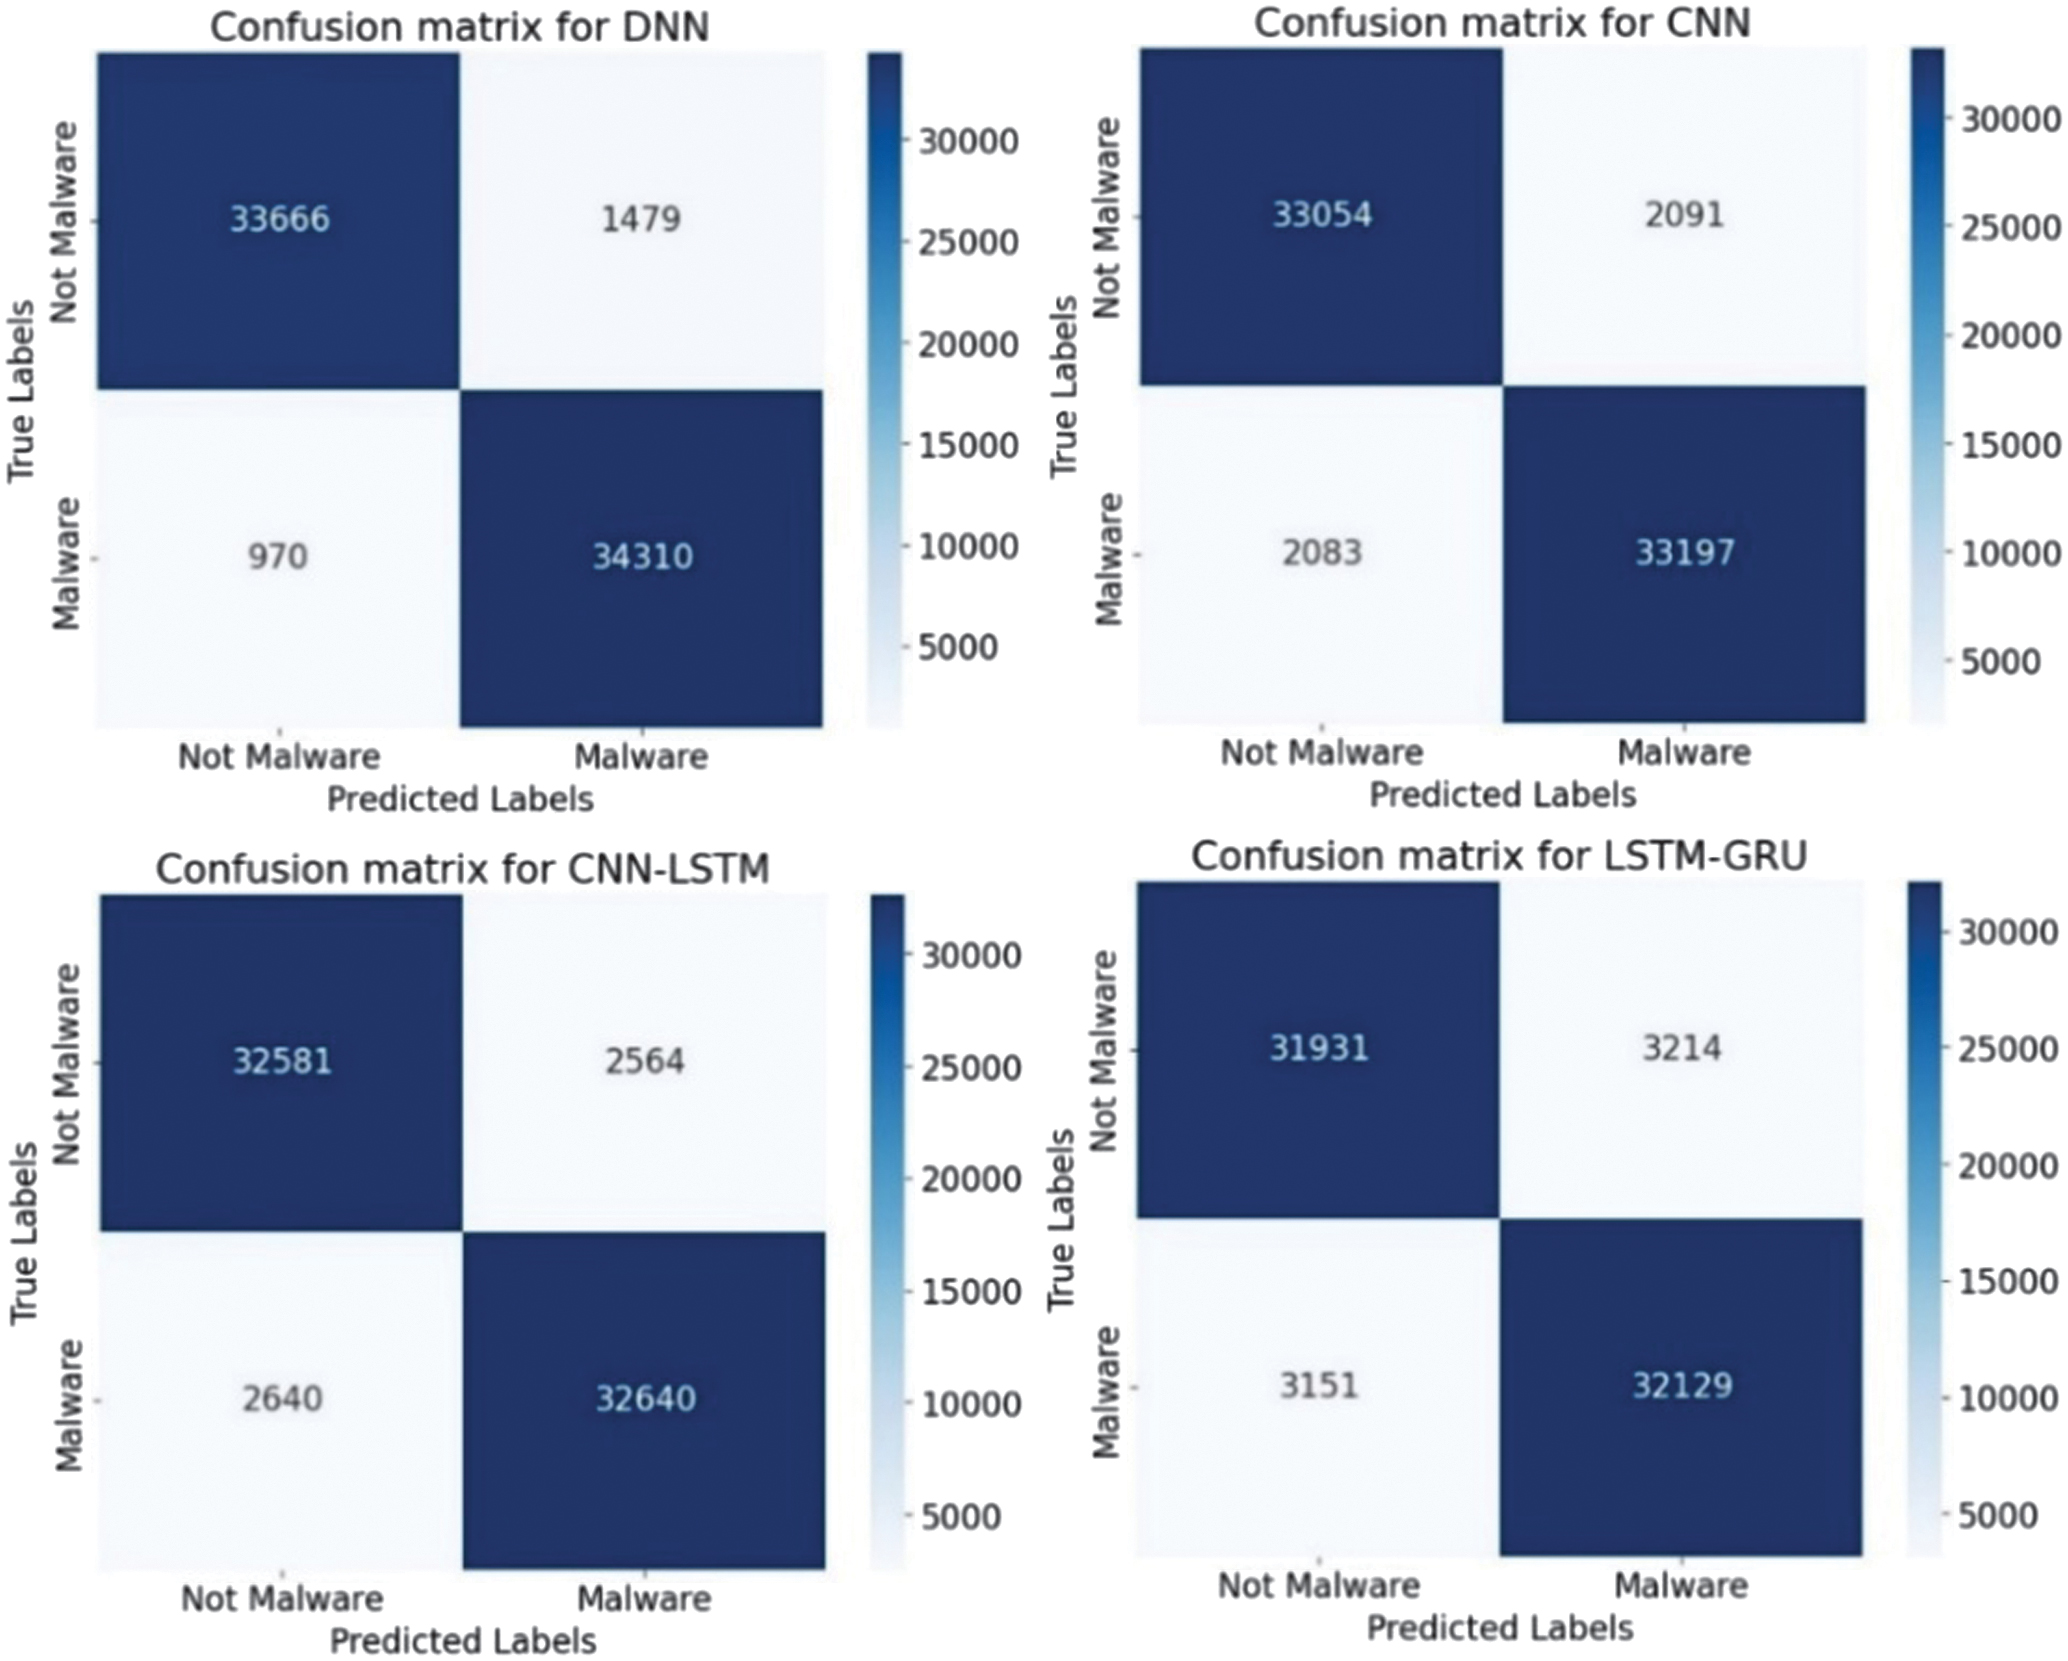 Fig. 27. The confusion matrices.
The malware classification results are compared with research [38], where the DL model achieves only a 69% accuracy score, indicating limited generalization capability for malware behavior patterns in this dataset. In contrast, the presented approach in the paper demonstrates substantially stronger performance, achieving above 94% accuracy on the same malware dataset category by efficient modern DL architectures and optimized training strategies. This comparison highlights that while previous work struggles to adapt deep models to this dataset effectively, this study advances the state of practice by delivering a significantly more robust malware detection pipeline.
The classification results of phishing are shown in Table IV. The accuracy, loss, and confusion matrices plots are presented in Fig. 28–32.
Table IV. Classification results of phishing
| Metrics | SVM | Random forest | DNN | CNN | CNN-LSTM | LSTM-GRU |
|---|---|---|---|---|---|---|
| Accuracy | 0.812 | 0.846 | 0.817 | 0.622 | 0.628 | 0.735 |
| Precision | 0.873 | 0.913 | 0.881 | 0.776 | 0.737 | 0.774 |
| Recall | 0.732 | 0.766 | 0.733 | 0.341 | 0.395 | 0.662 |
| F1-score | 0.797 | 0.833 | 0.801 | 0.474 | 0.515 | 0.714 |
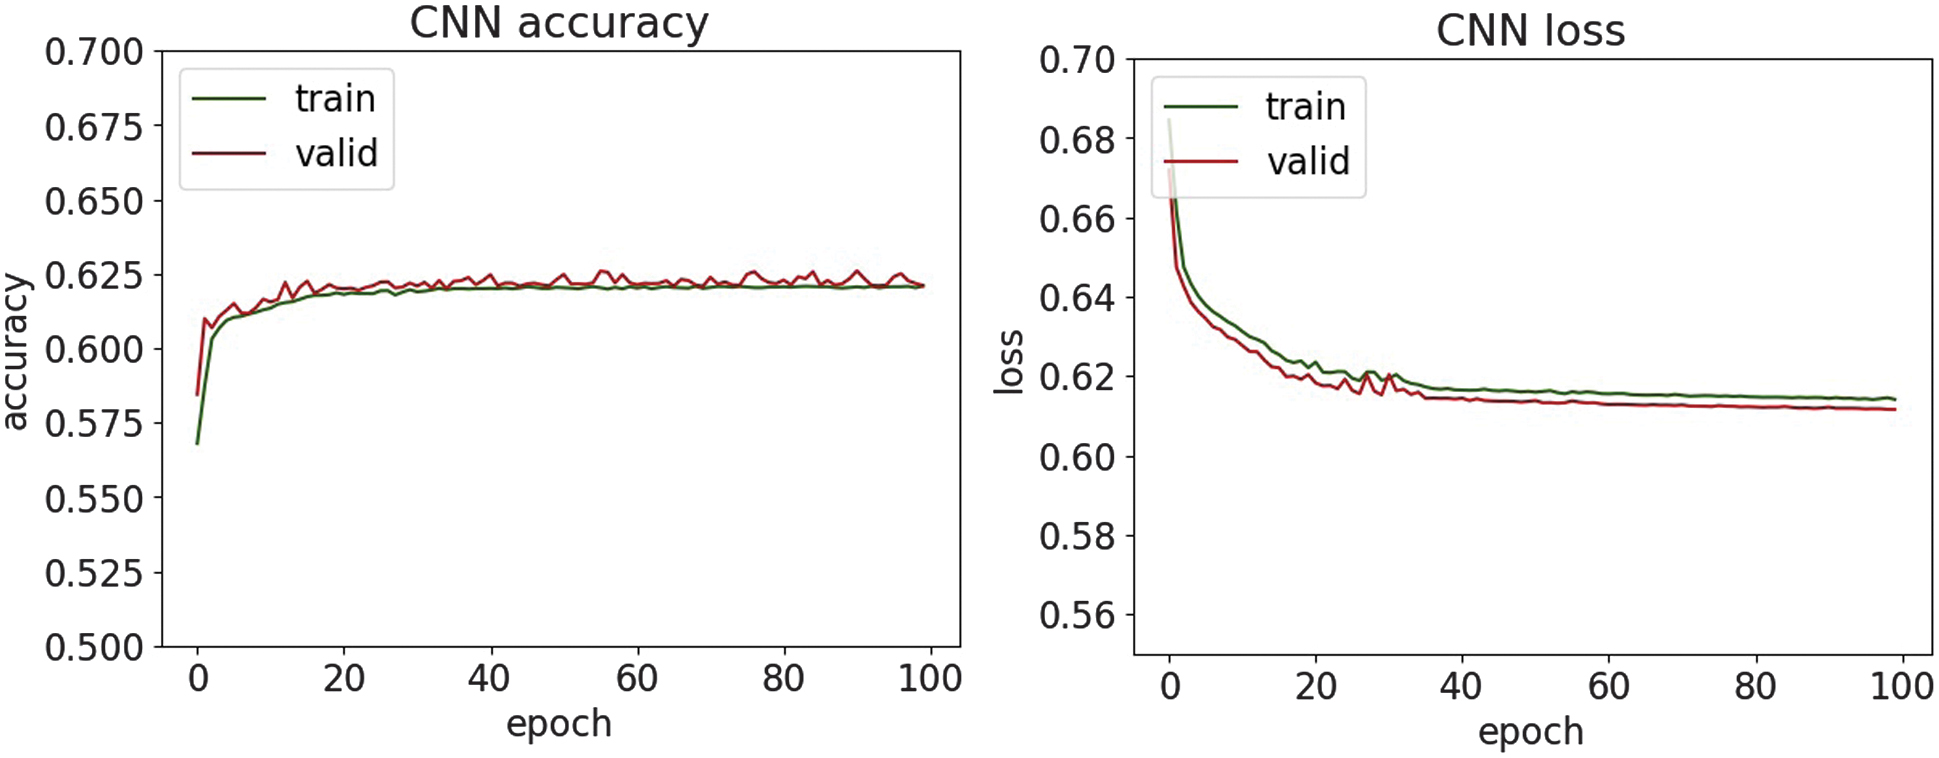 Fig. 28. The accuracy and loss plots of DNN.
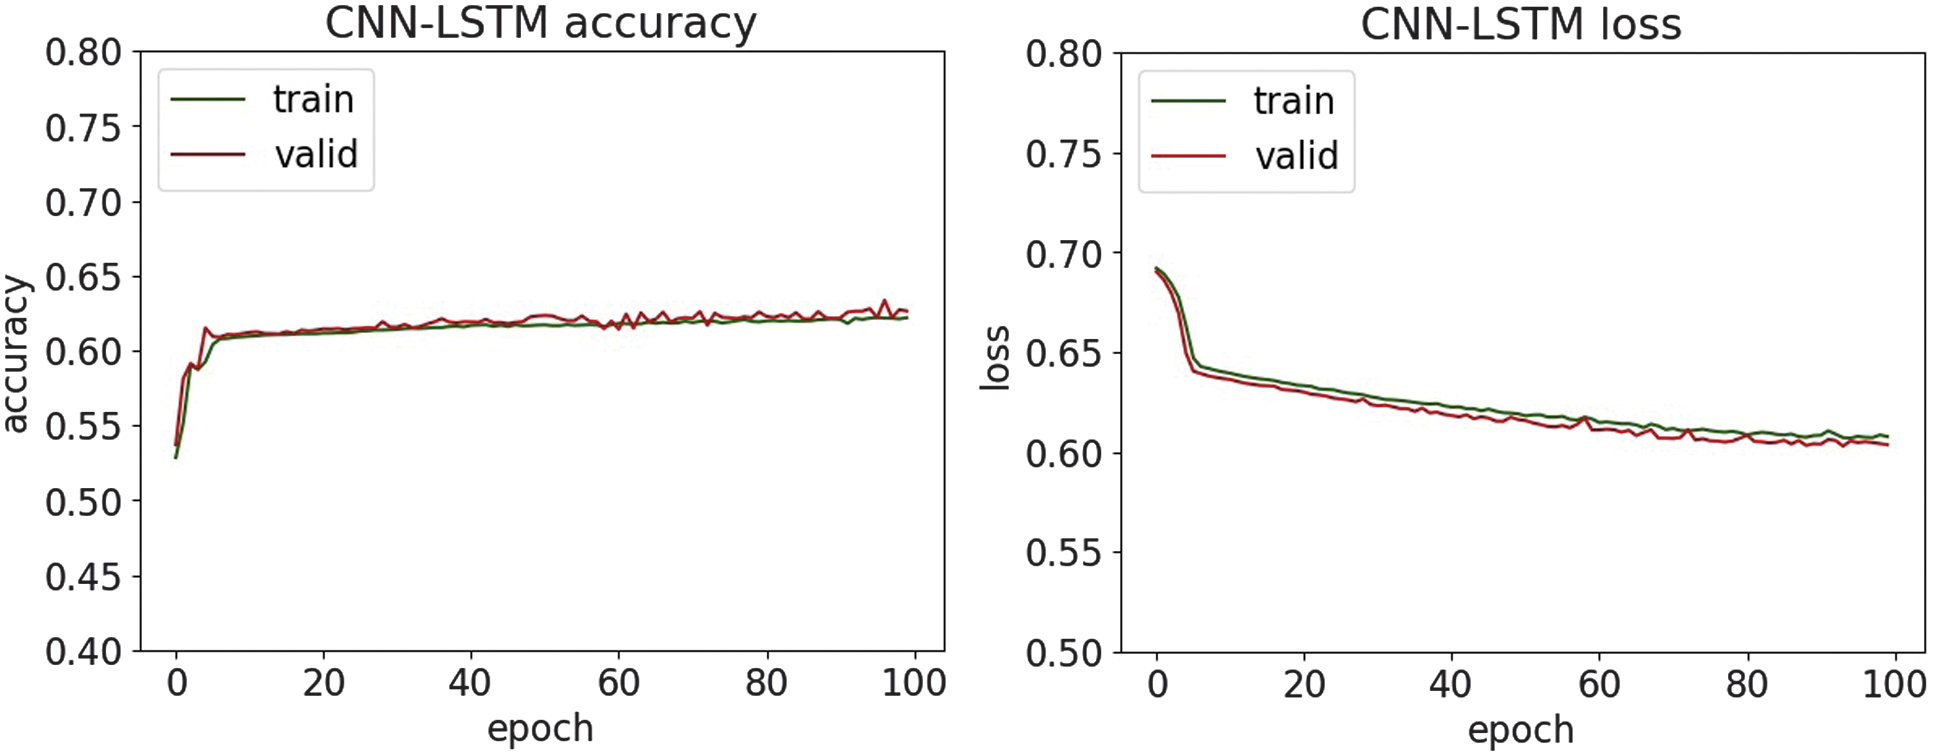 Fig. 29. The accuracy and loss plots of CNN.
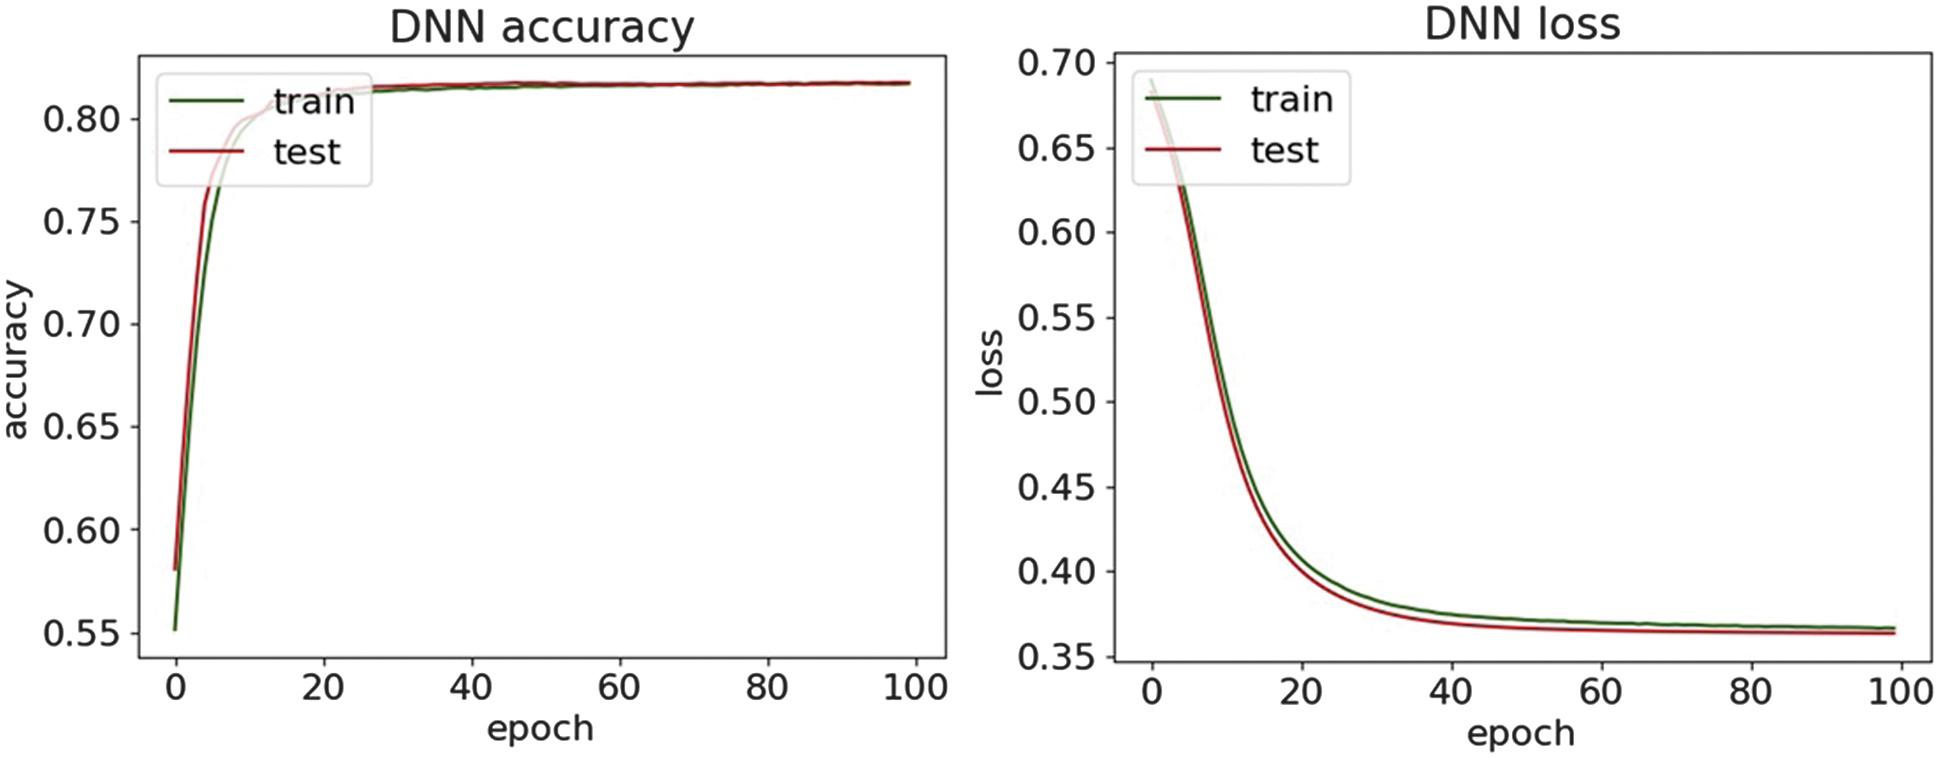 Fig. 30. The accuracy and loss plots of CNN-LSTM.
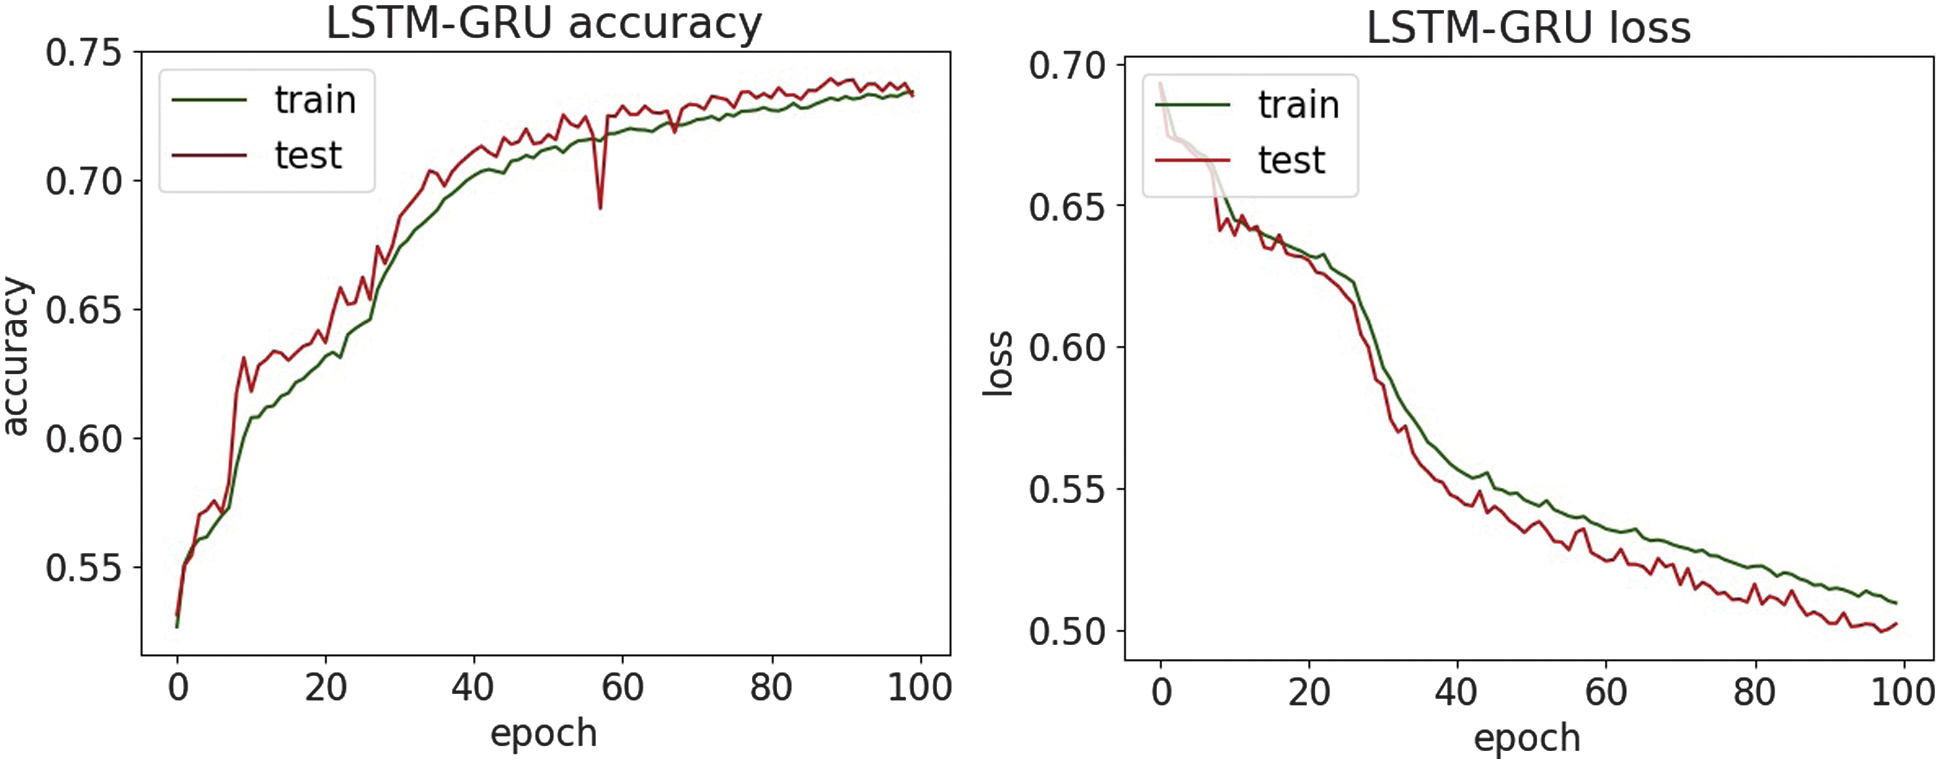 Fig. 31. The accuracy and loss plots of LSTM-GRU.
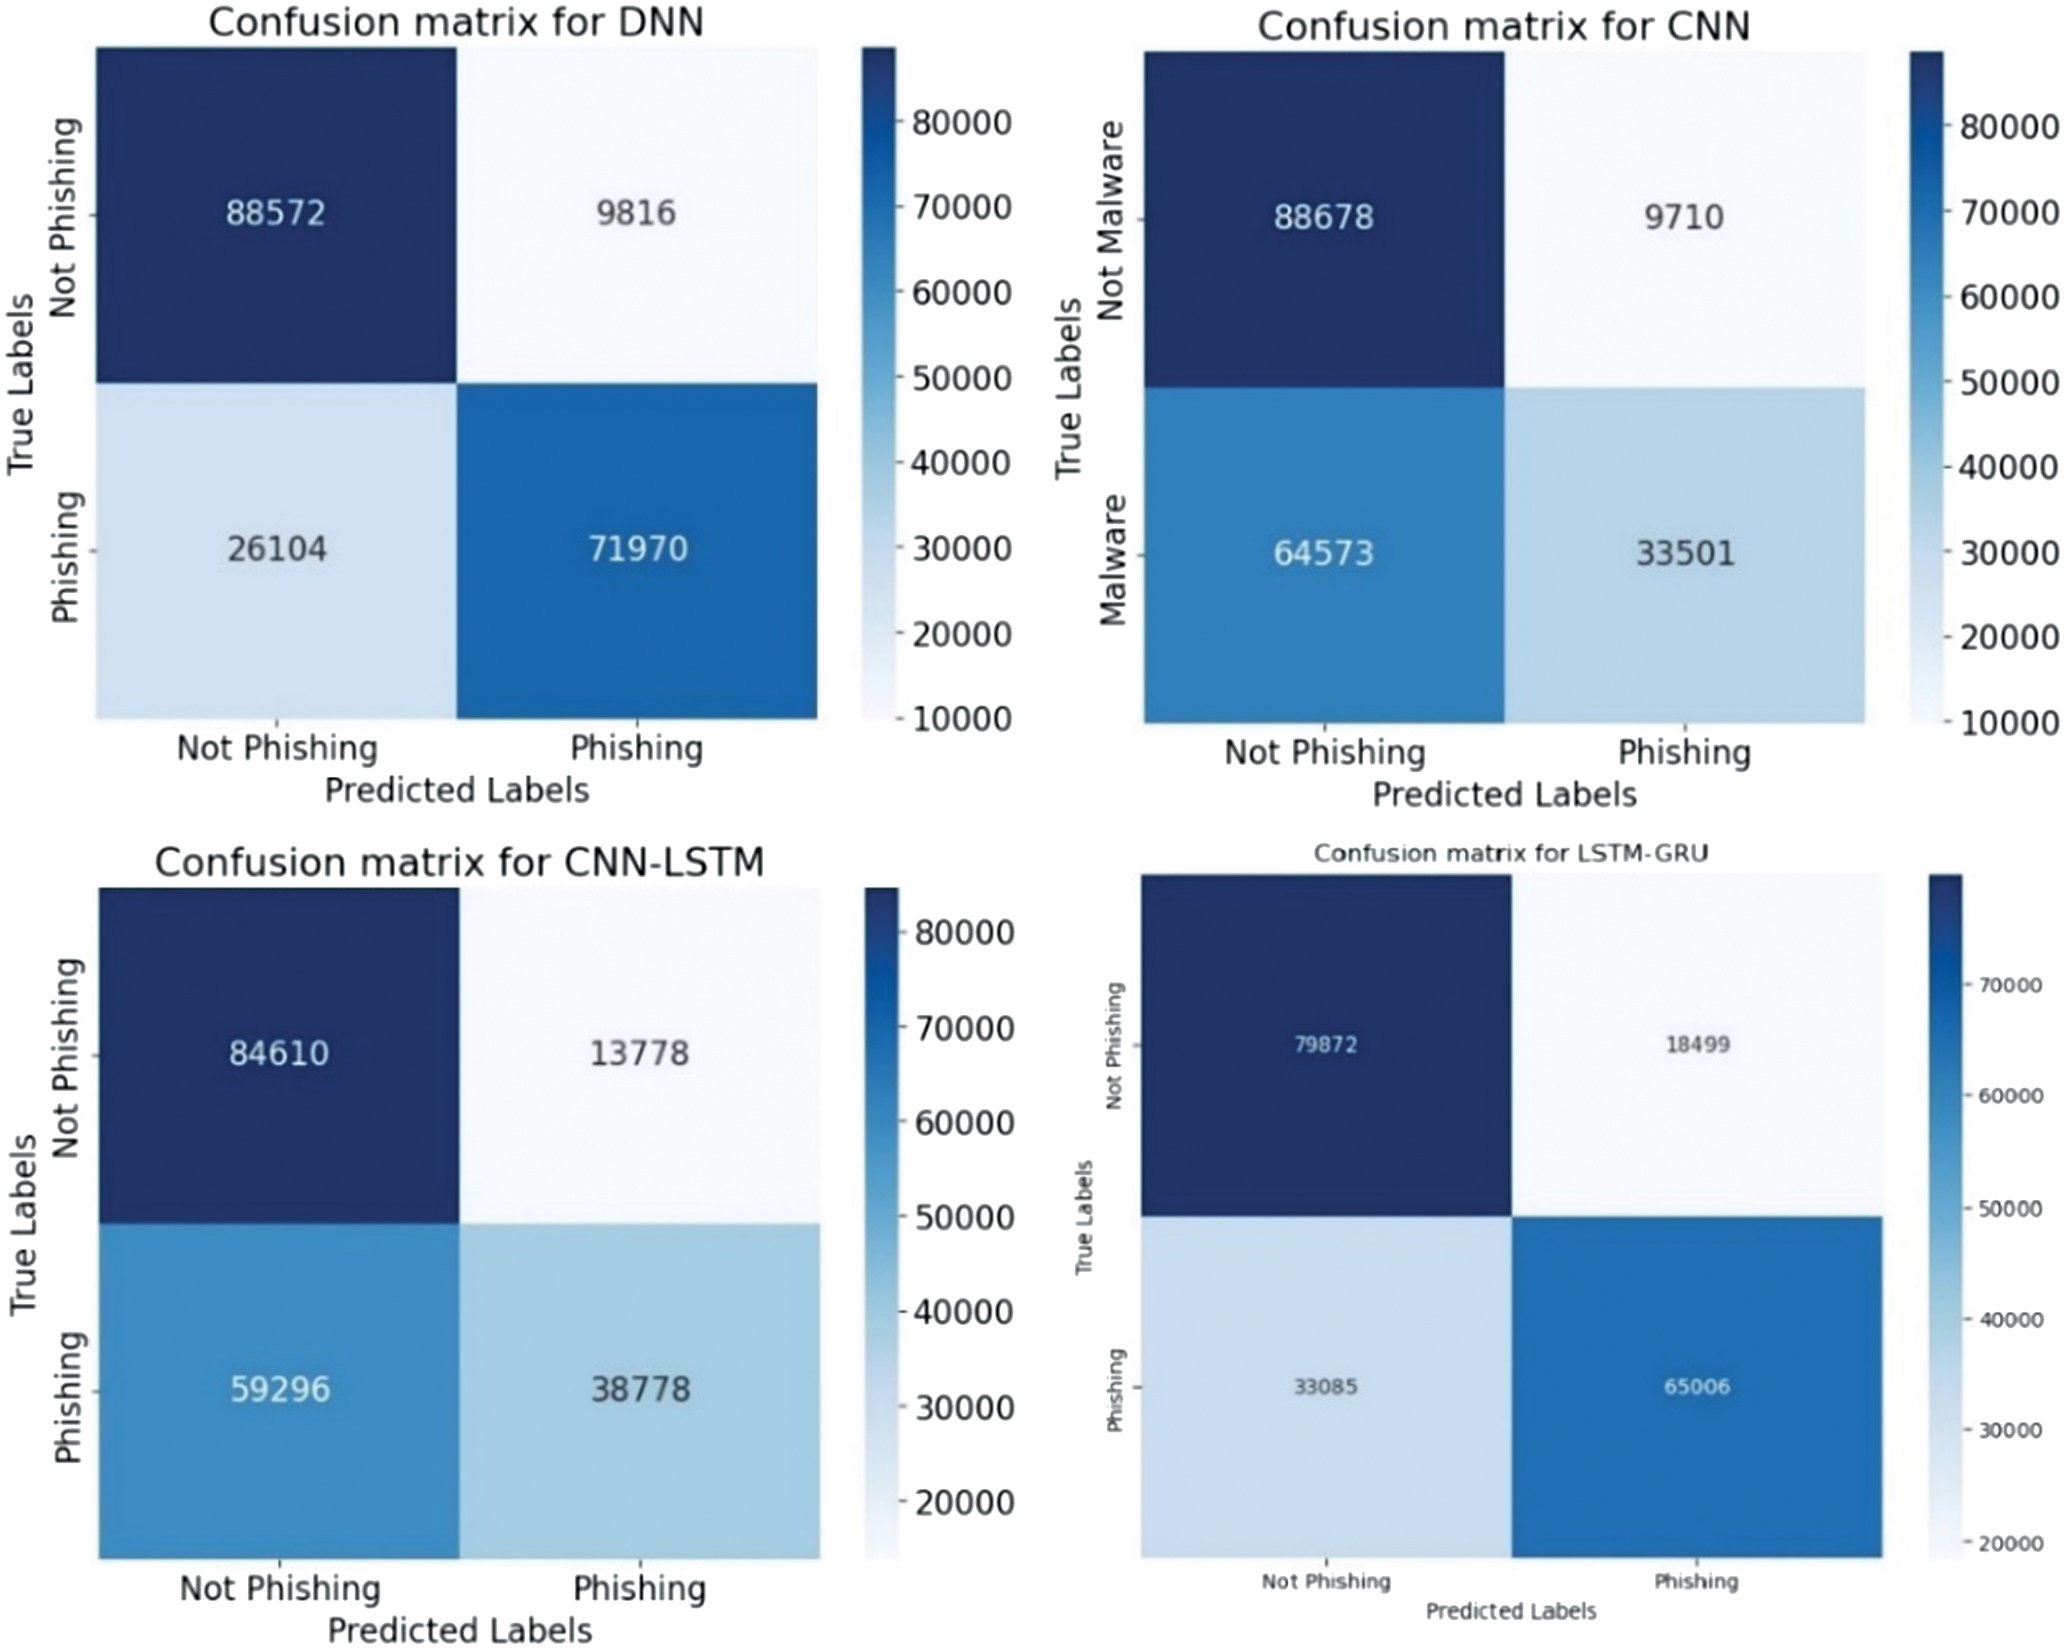 Fig. 32. The confusion matrices.
In [39], several classical ML classifiers are evaluated on a large phishing dataset and report the highest accuracy of 76%. On the contrary, the presented research leverages DL architectures, such as CNN-LSTM and LSTM-GRU, and applies enhanced feature extraction techniques tailored for URL patterns, achieving over 81% accuracy on the same dataset. Therefore, the presented method pushes performance significantly higher, establishing a new benchmark for phishing detection.
The classification results of SQL injection are shown in Table V. The accuracy, loss, and confusion matrices plots are presented in Fig. 33–37.
Table V. Classification results of SQL injection
| Metrics | SVM | Random forest | DNN | CNN | CNN-LSTM | LSTM-GRU |
|---|---|---|---|---|---|---|
| Accuracy | 0.908 | 0.951 | 0.911 | 0.785 | 0.787 | 0.784 |
| Precision | 0.954 | 0.985 | 0.942 | 0.766 | 0.761 | 0.823 |
| Recall | 0.856 | 0.917 | 0.877 | 0.823 | 0.840 | 0.724 |
| F1-score | 0.903 | 0.950 | 0.908 | 0.793 | 0.799 | 0.770 |
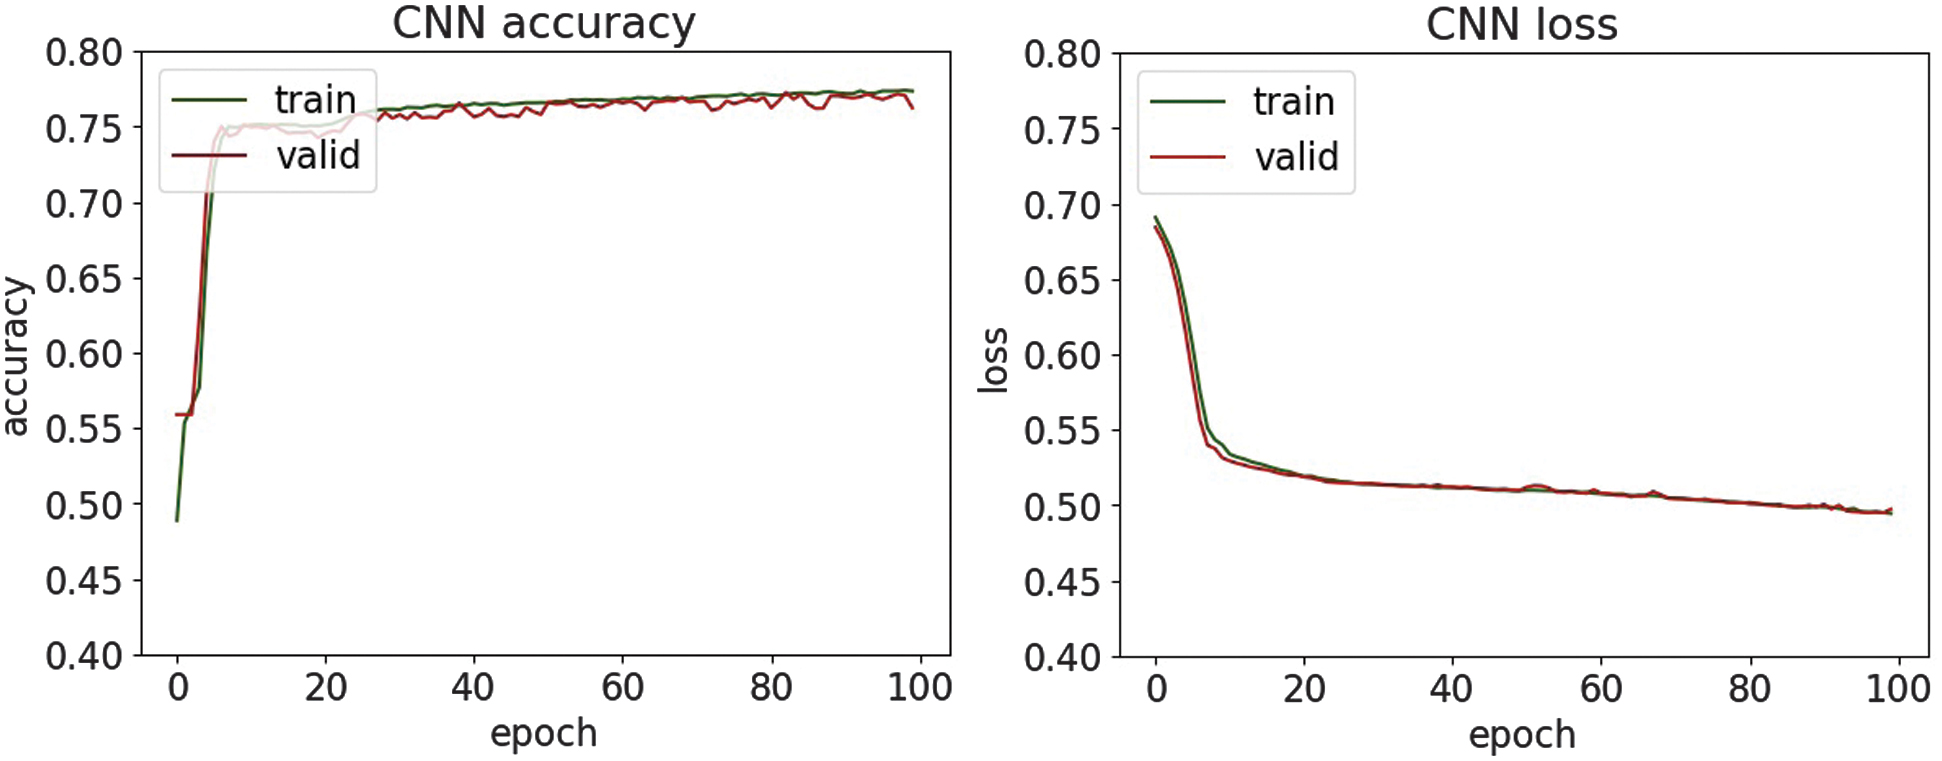 Fig. 33. The accuracy and loss plots of DNN.
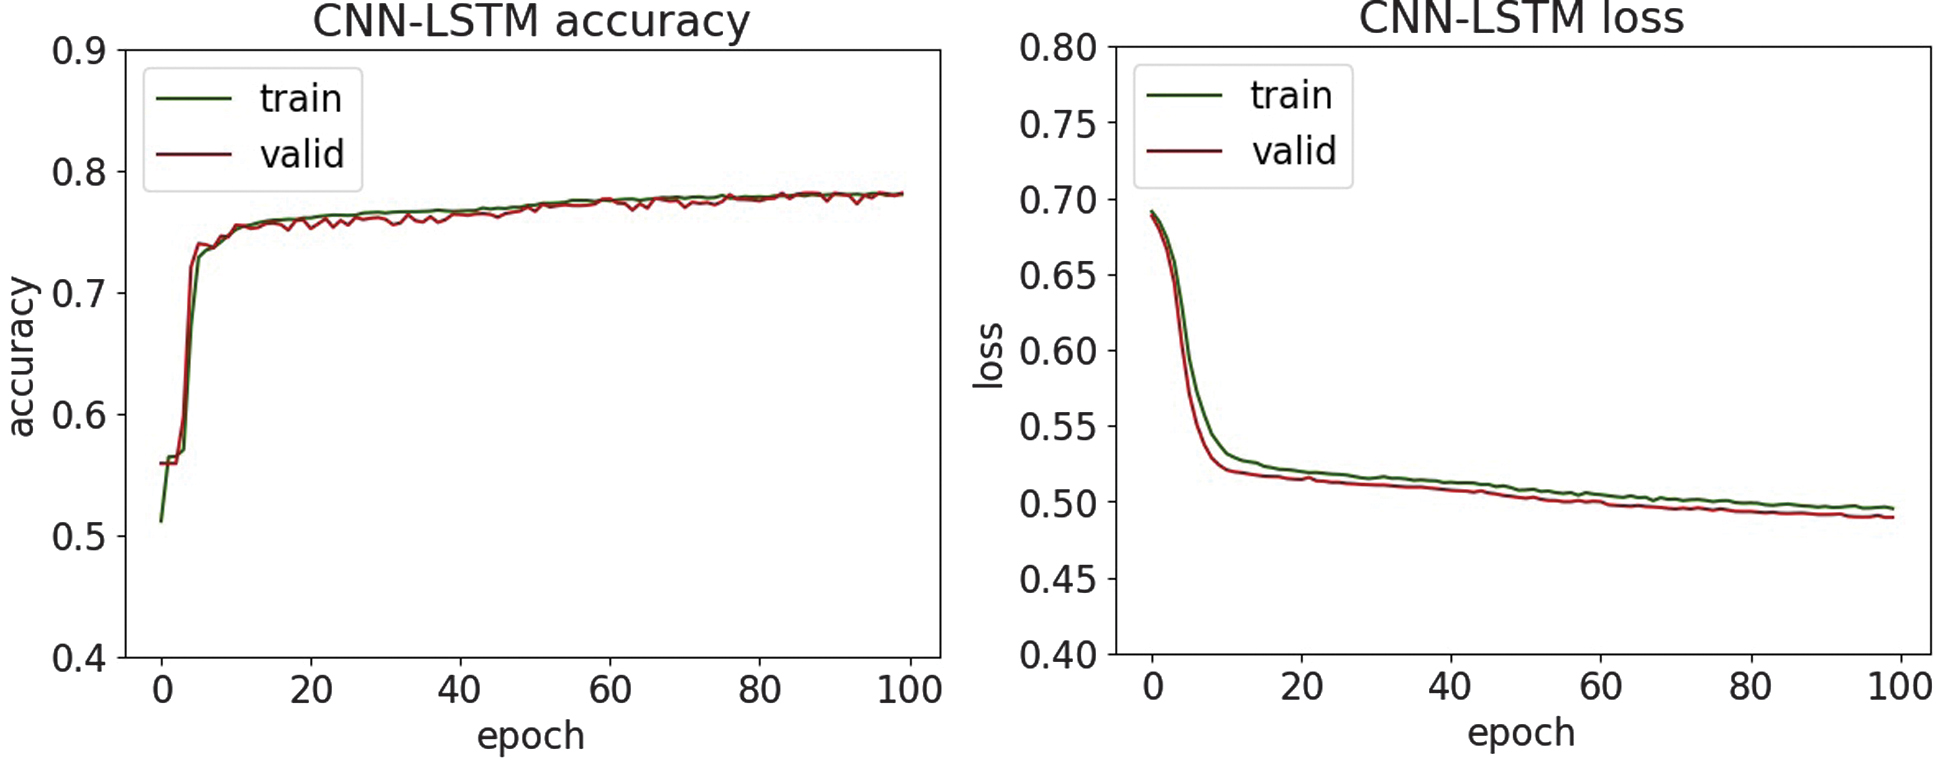 Fig. 34. The accuracy and loss plots of CNN.
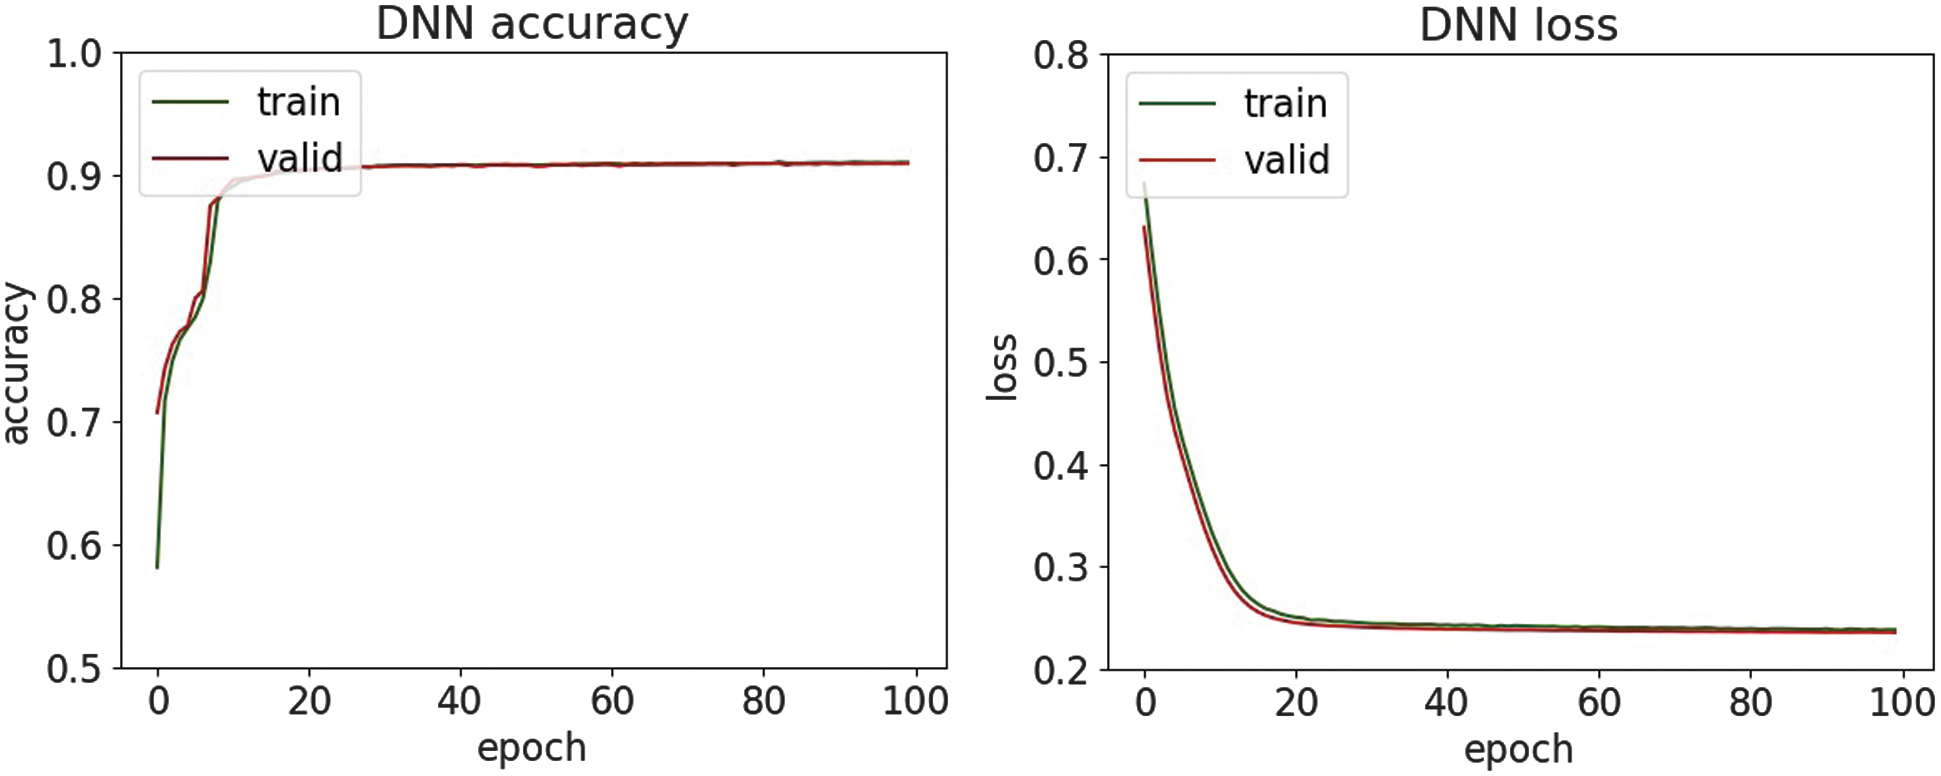 Fig. 35. The accuracy and loss plots of CNN-LSTM.
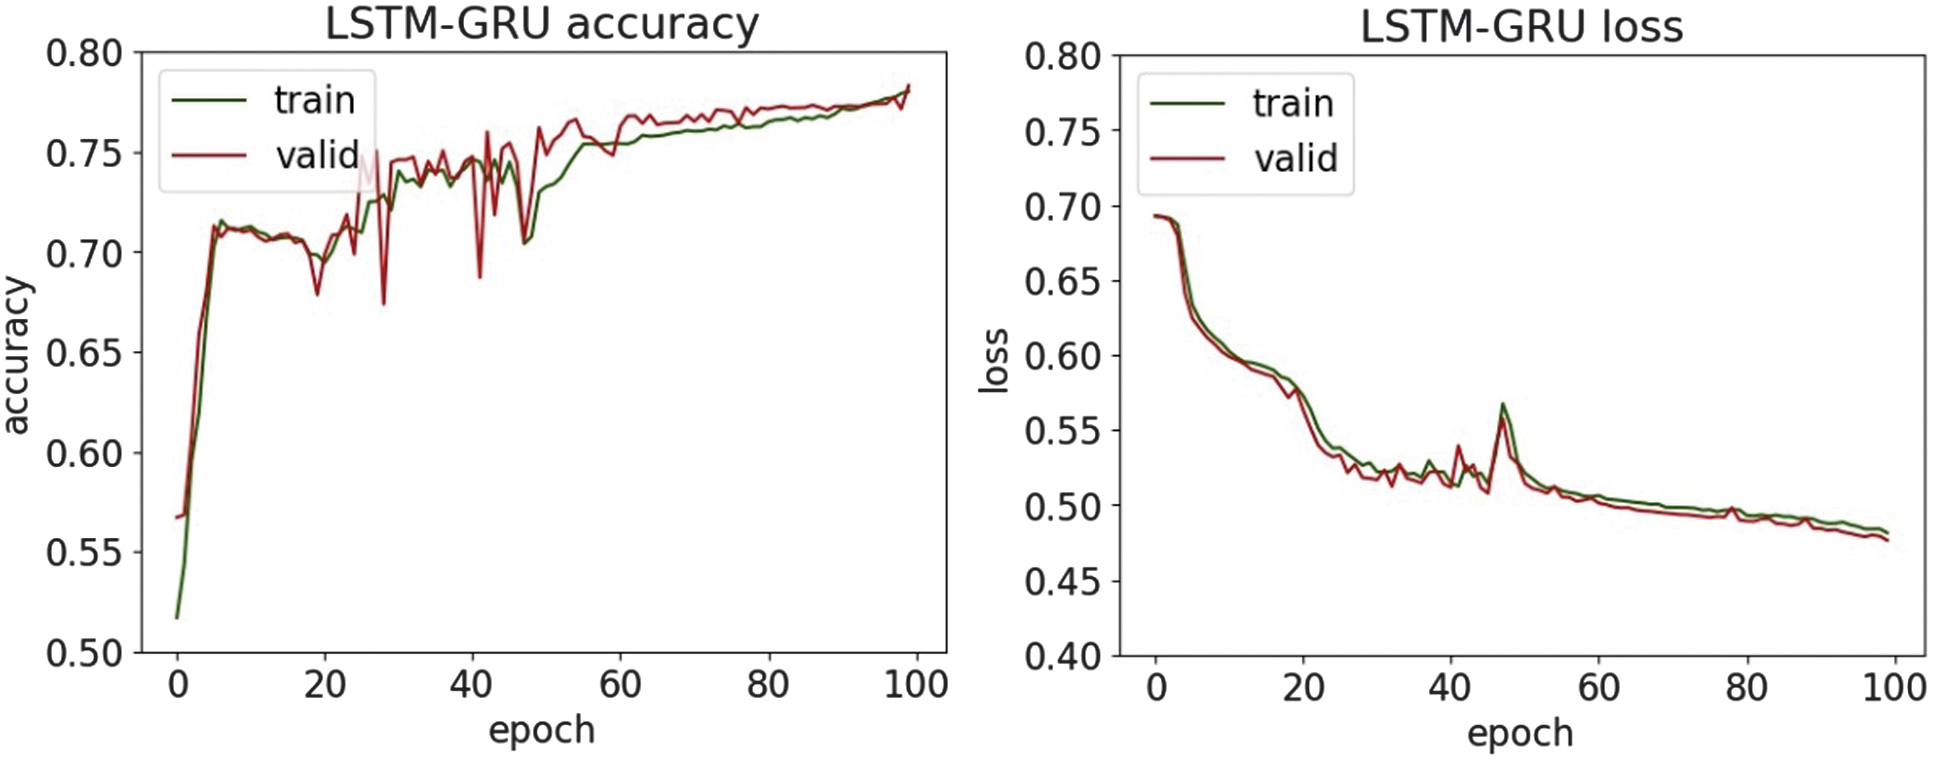 Fig. 36. The accuracy and loss plots of LSTM-GRU.
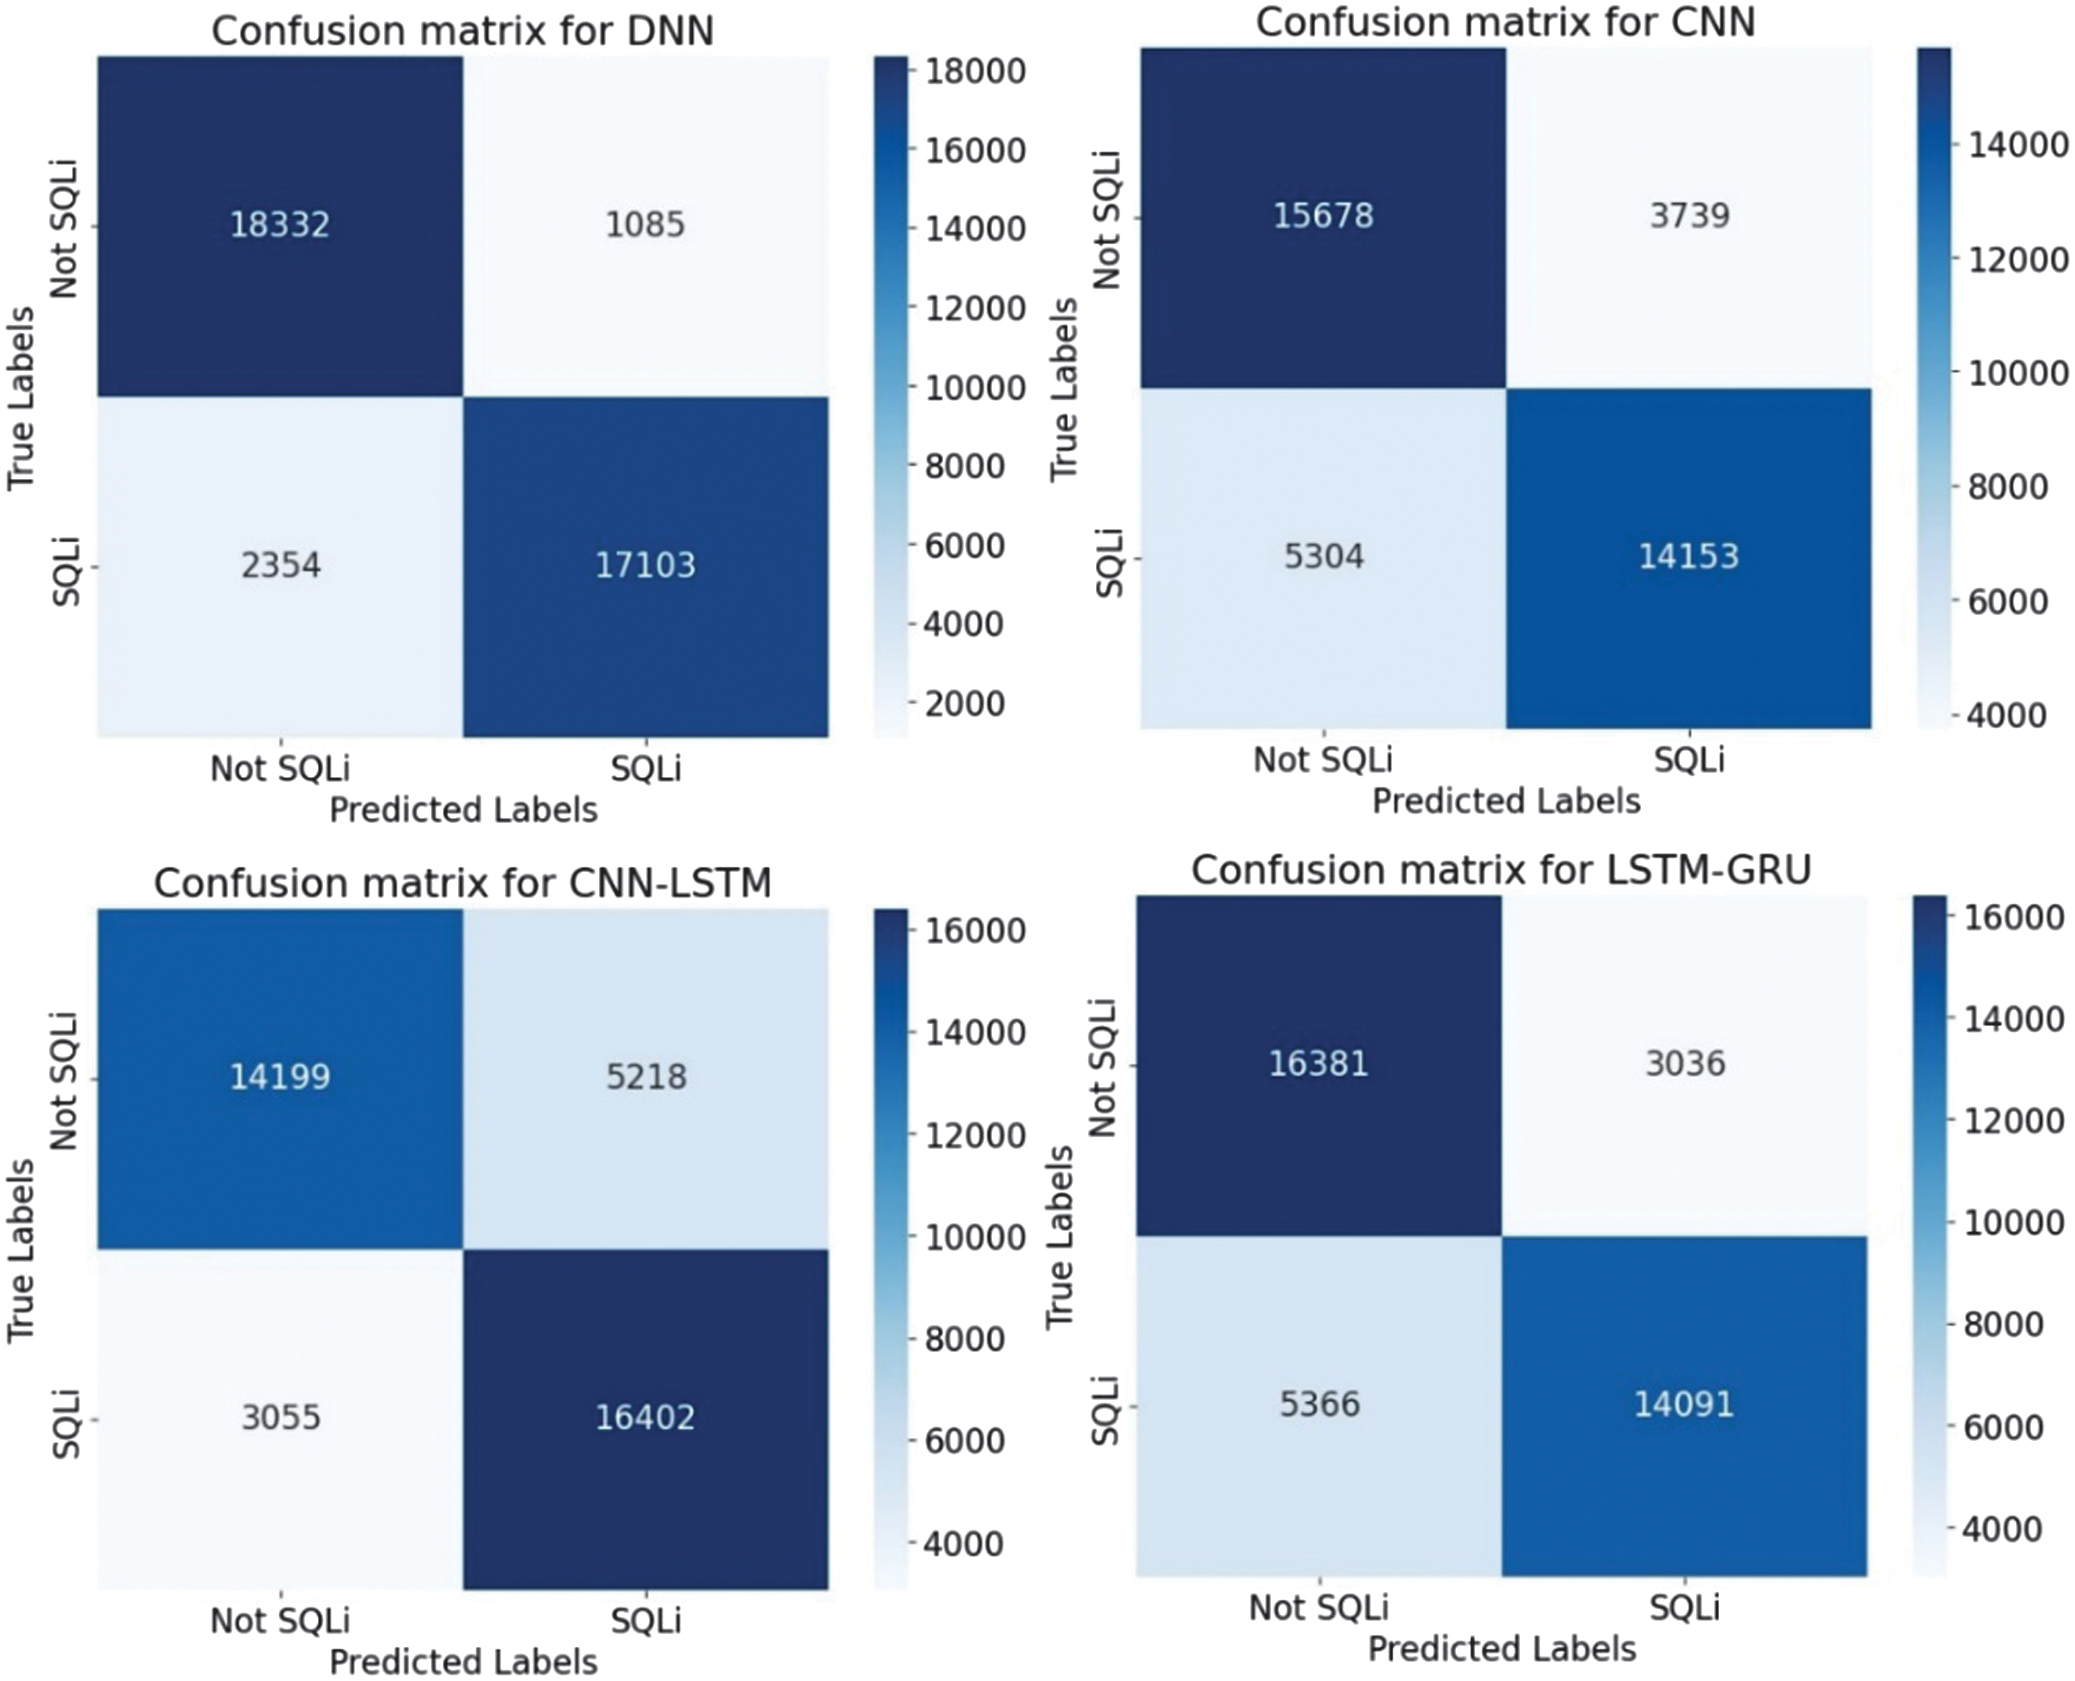 Fig. 37. The confusion matrices.
In the study [40], there is a CNN for feature extraction and an RF classifier for decision-making to detect SQL injection attacks and report an accuracy of 75.6% under their experimental setup. By contrast, the presented research reaches higher accuracy on the same or comparable SQL injection dataset and demonstrates classification accuracies of up to 95%. This shows that our model surpasses the previously reported benchmark, thereby offering improved detection performance and broader applicability in security contexts.
An experimental evaluation of the proposed DL models highlights both the strengths and limitations of each architecture in detecting various types of cyber threats. Across all datasets, DNN and CNN-LSTM demonstrate consistently high accuracy, particularly in classifying structured network threats, such as DDoS and MITM attacks. It suggests that the fully connected nature of DNN and the temporal–spatial processing capabilities of CNN-LSTM are well suited to modeling regular patterns in network traffic. For DDoS detection, all four models achieved accuracy above 95%, with DNN and CNN-LSTM achieving the highest F1-scores of 97.6%. It shows an ability to distinguish between legitimate and malicious traffic, which is essential for real-time defense mechanisms. Similar trends are observed in MitM classification, where the precision and recall metrics further validate the robustness of the models. Interestingly, LSTM-GRU showed competitive performance, reflecting the usefulness of combining memory-based architectures for consistent attack detection. For malware classification, performance dropped slightly, although DNN and CNN were still able to maintain precision and recall above 94%. The drop in overall precision suggests that malware features may be more diverse and more challenging to generalize, requiring deeper or more specialized networks.
On the other hand, phishing and SQL injection attacks—both text-based and less structured—presented a bigger challenge. Here, precision dropped below 82% for most models, with CNN and CNN-LSTM having the most difficulty. This drop in performance means that models trained on sequential and spatial data may not generalize well to raw text unless enhanced with natural language processing techniques. Despite these issues, the high precision values on the phishing and SQL injection tasks indicate that when the model identifies a threat, it is usually correct. However, it may still miss many real-world threats, resulting in lower recall. This trade-off suggests potential for improvement through data augmentation or hybrid systems that combine DL with rule-based methods. Visual analysis using accuracy and loss plots, as well as confusion matrices, provided further insight into the model behavior. In particular, DNN demonstrated robust convergence across all datasets, whereas recurrent models, such as LSTM-GRU, showed greater variance in loss curves, possibly due to their sensitivity to sequence length and temporal noise. These results highlight the need for fine-tuning hyperparameters and more rigorous application of regularization methods for recurrent models. Overall, the experimental results support the applicability of DL for intrusion detection in healthcare cybersecurity. However, further optimization, especially in text-heavy threat categories, remains necessary to build a comprehensive and robust security solution.
V.CONCLUSION
The research focused on the classification of five major cybersecurity threats: DDoS, MitM, malware, phishing, and SQLi, using DL models, including DNN, CNN, CNN-LSTM, and LSTM-GRU. The study addressed the increasingly complex cybersecurity landscape within healthcare institutions, where protecting sensitive patient data was critical. An important element of this research was the implementation of a secure hardware–software architecture that leveraged WireGuard, a lightweight and modern VPN protocol. WireGuard was employed to establish encrypted tunnels (e.g., wg0 and wg1) across network nodes, ensuring secure data communication and robust routing of cryptographic keys. Its configuration utilized conventional network tools such as ifconfig, ip, and route, facilitating a seamless and secure communication framework. WireGuard’s approach to associating each peer with public keys and internal IP addresses significantly enhanced authentication and data exchange security. The threat classification part covered a comprehensive methodology, comprising dataset collection and preprocessing, feature extraction, model training, and performance evaluation. The preprocessing involved specific techniques tailored to the nature of each dataset, including min–max normalization for structured network data and TF-IDF for text-based threats. Chi-square feature selection identified the most significant features for enhancing classification accuracy. For structured threats like DDoS and MitM attacks, all models showed robust performance. Specifically, DNN and CNN-LSTM consistently achieved the highest accuracy and F1-scores, approximately 97.6%, highlighting their effectiveness in distinguishing malicious from legitimate network traffic. LSTM-GRU also showed competitive performance in MitM attacks, reflecting the strength of memory-based architectures in detecting temporal attack patterns. In malware classification tasks, DNN maintained the best performance, achieving 95.6% accuracy, followed closely by CNN. However, overall accuracy and precision slightly declined, indicating the complex and heterogeneous nature of malware features that necessitate deeper or more specialized models. Conversely, detecting less structured, text-based threats such as phishing and SQL injection presented greater challenges. Accuracy and precision notably decreased, with precision dropping below 82% in most cases, especially for CNN and CNN-LSTM models. This reduction suggested limitations in handling textual and sequential data without advanced natural language processing techniques. Despite this, models maintained high precision when identifying actual threats, albeit with lower recall, indicating missed threats. Visual analyses, including accuracy and loss plots alongside confusion matrices, provided deeper insights into model behaviors. DNN consistently demonstrated stable convergence across all tasks, indicating strong generalization capabilities. Recurrent architectures like LSTM-GRU showed higher variability, emphasizing their sensitivity to temporal dynamics and sequence lengths and thus highlighting the importance of careful hyperparameter tuning and regularization. Overall, the results confirmed the viability of DL models for cybersecurity in healthcare, particularly for structured network attacks. However, further optimization and incorporation of sophisticated natural language processing or hybrid approaches are necessary to effectively handle more complex, text-based threats and build a comprehensive security solution.