I.INTRODUCTION
Microbes, also known as microorganisms, are tiny organisms that are visible only under a microscope because they are too small to be seen with the naked eye [1,2]. Microorganisms can be categorized into two types: single-celled and multi-celled. Numerous types of microorganisms exist on Earth, including bacteria, fungi, viruses, algae, protozoa, and others, all of which are vital for both the environment and human well-being [3]. Human illnesses like typhoid, food poisoning, AIDS, polio, milder cases of the common cold, cancer, and others are caused by these microbes [2,4]. According to the World Health Organization (WHO), contaminated drinking water is a major issue, with around 2 billion people worldwide drinking water polluted with feces. It is estimated that this leads to the death of 525,000 children under the age of 5 years each year from diarrheal diseases [5].
Manual microbe detection and counting is a slow, difficult, and expensive process [6]. The advent of artificial intelligence (AI), encompassing machine learning (ML) and deep learning (DL), has greatly propelled progress in the field of object detection [7]. These technologies are extensively utilized in prediction and classification tasks due to their ability to identify and learn patterns from data [8]. In the context of bacterial detection, particularly for Escherichia coli (E. coli), ML has demonstrated promising results in enhancing detection accuracy and efficiency.
In recent years, the need for rapid, accurate, and cost-effective microbial detection has become increasingly urgent, particularly in sectors such as public health, food safety, water quality monitoring, and clinical diagnostics [6]. Traditional laboratory-based detection methods, such as culturing, staining, and manual microscopic analysis, often require skilled personnel and lengthy processing times, making them less suitable for high-throughput or real-time applications [5]. As global challenges like population growth, environmental pollution, and pathogen outbreaks intensify, there is a growing demand for automated systems capable of delivering reliable microbial analysis. Integrating intelligent computational techniques with imaging technologies presents a promising path toward developing scalable microbial detection systems that can support faster decision-making and improve overall safety standards [9].
In summary, this study proposes a bacterial detection system focused on four bacterial classes—E. coli, Pseudomonas aeruginosa, Proteus, and Staphylococcus aureus—using a comprehensive set of geometric, color, texture, and moment features to accurately capture their visual characteristics. By applying the K-nearest neighbor (KNN) classification method, the system leverages feature similarity to achieve reliable categorization of bacterial images. Implemented as a Python-based desktop application, the developed system offers a practical, efficient, and accessible tool for laboratory use. Overall, the approach demonstrates the potential to provide a faster, more cost-effective, and accurate alternative to conventional manual bacterial detection methods.
The rest of this paper is structured as follows. Section II provides an overview of the related work concerning the Grey Wolf Optimizer (GWO) algorithm and feature selection. This is followed by Section III, which details the materials and methods used in this study, including the data preparation and experimental setup. Section IV presents the main results of our experiments and thoroughly discusses their implications. Finally, Section V concludes the paper, summarizing the key findings and suggesting directions for future research.
II.RELATED WORK
Many recent studies have shown that ML and DL methods are very effective at detecting bacteria. Manfredi et al. created a quick and accurate way to detect the bacterial strain E. coli O157:H7 by combining MALDI-TOF mass spectrometry with an ML model [10]. E. coli O157:H7, a type of enterohemorrhagic bacteria that produces Shiga toxin, is a significant pathogen [11]. It spreads through contaminated food and air and can cause health issues in people, including diarrhea, hemorrhagic colitis, and hemolytic uremic syndrome (HUS) [12]. Using MALDI-TOF mass spectrometry alongside ML predictive models, researchers developed a fast and accurate method to detect Shiga toxin-producing Escherichia coli (STEC) serotype O157:H7 [13]. This study achieved a classification accuracy of 99.3%, with a sensitivity of 98.5% and a specificity of 100%. Similarly, Mann et al. developed a DNAzyme-based hydrogel sensor platform combined with AI for colorimetric detection of E. coli, which successfully detected 101 CFU/mL E. coli in lake water samples and achieved high accuracy in clinical samples [14].
Furthermore, DL methods have also been explored for bacterial detection. A deep convolutional neural network (CNN) was employed to identify and classify bacteria in microscopic images by Abougarair et al. [15]. Their approach significantly accelerated and improved the accuracy of bacterial screening, even in visually complex backgrounds. Kotwal et al. [16] applied an optimized support vector machine (SVM) enhanced by GWO for spectroscopic analysis and automatic detection of E. coli in clinical samples, achieving improved sensitivity and specificity. Additionally, Qian et al. [17] proposed a statistical ML framework. It was used to predict E. coli O157:H7 concentrations in untreated surface water for hydroponic lettuce irrigation, achieving a 20% reduction in RMSE compared to conventional methods.
Within the field of feature selection, optimization algorithms have become popular because of their effectiveness in finding the best solutions to complex problems to improve classification performance. For example, Ghosh et al. introduced a hybrid feature selection approach that integrates the GWO with the Ant Lion Optimizer (ALO) for microbial diagnosis based on microarray data, demonstrating improvements in classification accuracy and reductions in selection time [18]. Likewise, Nasip et al. developed a hybrid model integrating DenseNet201-based transfer learning for feature extraction with various feature selection algorithms for classifying 33 bacterial species, confirming the benefits of multi-stage feature selection [19]. Kotwal et al. analyzed ML methods, including CNNs, SVMs, and Random Forests, for detecting and classifying bacteria from microscopic images, achieving accuracies up to 99.7% [2]. Wu et al. conducted a comparative study of pretrained CNN architectures—AlexNet, VGGNet, Inception, ResNet, and DenseNet—for bacterial classification, achieving the best results with DenseNet-121 at 99.08% [11]. These studies highlight the growing success of AI-based techniques in bacterial identification, especially through transfer learning approaches applied to limited datasets.
In the context of the proposed research, the application of ML algorithms like KNN, enhanced with feature selection by the Two-Phase Mutation Grey Wolf Optimizer (TMGWO), is one example of the integration of these techniques. KNN is selected for this study because it is a simple yet effective classification method that performs well on small- to medium-sized datasets [20]. KNN classifies data based on pattern similarity, making it suitable for bacterial detection tasks where similar bacteria exhibit similar feature characteristics. Moreover, KNN does not require complex model training, allowing for faster implementation and adaptability to new datasets. The combination of KNN and the feature selection method optimized by TMGWO is anticipated to make bacterial detection both more accurate and more efficient [21].
Previous studies have shown that the use of optimization algorithms such as GWO in feature selection can significantly improve classification performance. For example, Sallam et al. [22] used GWO for feature selection in the detection of Acute Lymphoblastic Leukemia (ALL) and achieved an accuracy of up to 99.69%. In addition, Hussein et al. introduced an improved variant of the Moth-Flame Optimization (MFO) algorithm, termed GMSMFO, for feature selection, which showed competitive performance in various applications, including intrusion detection systems [23]. Sharaha et al. showed that combining infrared spectroscopic microscopy with multivariate analysis is a promising approach to rapidly detect ESBL-producing E. coli from urinary tract infection samples [24]. This study achieved a success rate of 97%, sensitivity of 99%, and specificity of 94% in detecting ESBL-producing bacteria within minutes of the first culture [24].
Although previous studies have demonstrated the effectiveness of various metaheuristic algorithms such as GWO, ALO, and others for feature selection in microbial detection tasks, these approaches still present challenges related to premature convergence, suboptimal feature subsets, or less stable performance across different datasets. To overcome these limitations, this study employs an enhanced feature selection approach based on TMGWO. TMGWO enhances the original GWO by incorporating mutation strategies in two distinct phases, which increases its exploration and exploitation capabilities and helps avoid local optima during the search process. Therefore, this study aims to develop an effective and efficient bacterial detection system by utilizing this enhanced feature selection technique. Specifically, the research focuses on classifying bacteria with and without the use of feature selection and enhancing both the accuracy and execution time of the bacterial detection process, enabling more precise identification within a shorter time frame.
III.MATERIALS AND METHODS
The research process is designed systematically to ensure optimal results in classifying bacteria based on microscopic images. The design of this study includes several main stages, starting from data collection and processing to analysis of the results. The data used are in the form of bacterial images that will go through a series of preprocessing processes to improve image quality. Furthermore, the image will undergo segmentation to extract bacterial objects from the background. Important features from the segmented image will be extracted to obtain characteristics that optimally represent bacteria.
The core process in this study involves feature selection using TMGWO, designed to identify the optimal feature subset to enhance classification accuracy while minimizing data dimensionality. After the features are selected, the data will be classified using the KNN method to determine the type of bacteria detected. Finally, the classification results will be analyzed based on detection accuracy and execution time to evaluate how well the new method works. The research stages are illustrated in Fig. 1, starting from the input dataset of microscopic images, followed by preprocessing to enhance image quality, segmentation to isolate bacterial objects, feature extraction, and feature selection using TMGWO. The selected features are classified using KNN to determine the type of bacteria.
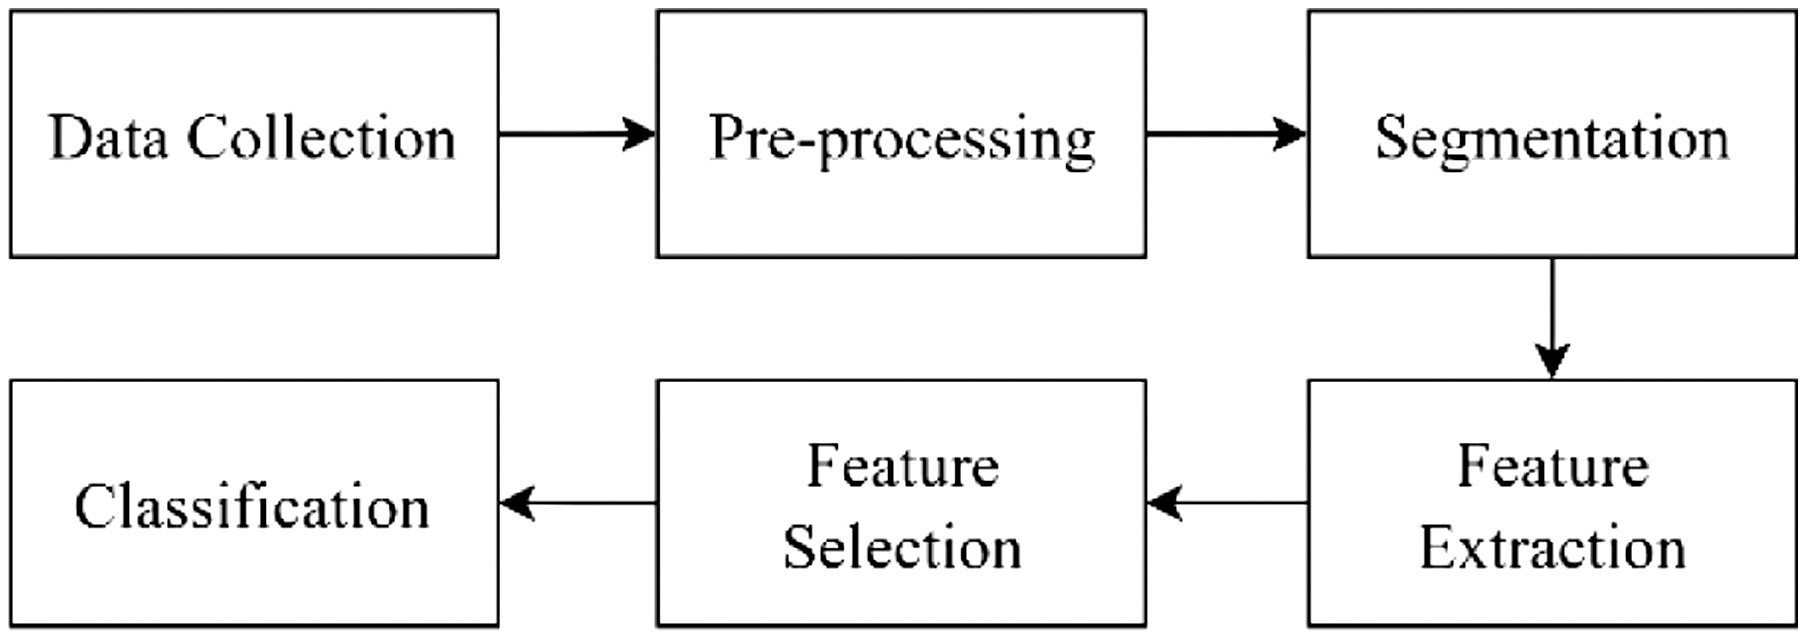 Fig. 1. Flowchart of the proposed bacteria detection system.
A.DATA COLLECTION
In this study, the dataset utilized consists of four types of waterborne bacteria, namely E. coli, P. aeruginosa, S. aureus, and Proteus species. These bacteria are observed and analyzed through microscopic imaging after being subjected to the Gram staining technique, which is a fundamental method in microbiology for classifying bacterial species. The image data of E. coli are obtained directly through microscopic observation conducted at the Microbiology Laboratory of the Samudra University during practical laboratory work utilizing the Gram staining technique. Meanwhile, the image data for the other three bacterial species, P. aeruginosa, S. aureus, and Proteus species, are collected from the Digital Image of Bacterial Species (DIBaS) open-access database to ensure the availability of high-quality and verified microscopic bacterial images.
The Gram staining technique involves a differential staining process that allows researchers to classify bacteria into two main groups—Gram-positive and Gram-negative—according to the structural and chemical characteristics of their cell walls, specifically the thickness of the peptidoglycan layer [25].
The application of the Gram staining process in E. coli samples has resulted in stained cell walls that are clearly visible in the microscopic images, enabling a more effective analysis in the later stages of this research. The application of the gram staining process illustrates in Fig. 2.
All images, regardless of source, are subjected to the same preprocessing pipeline to ensure consistency in the analysis. The following image can be seen in Fig. 3. The datasets are divided into training and testing sets for classification using the KNN algorithm. For each bacterial class, a total of 17 images are allocated for training, while 3 images are reserved for testing. This division ensures that each class is equally represented in both the training and testing phases, facilitating an unbiased evaluation of the classification performance.
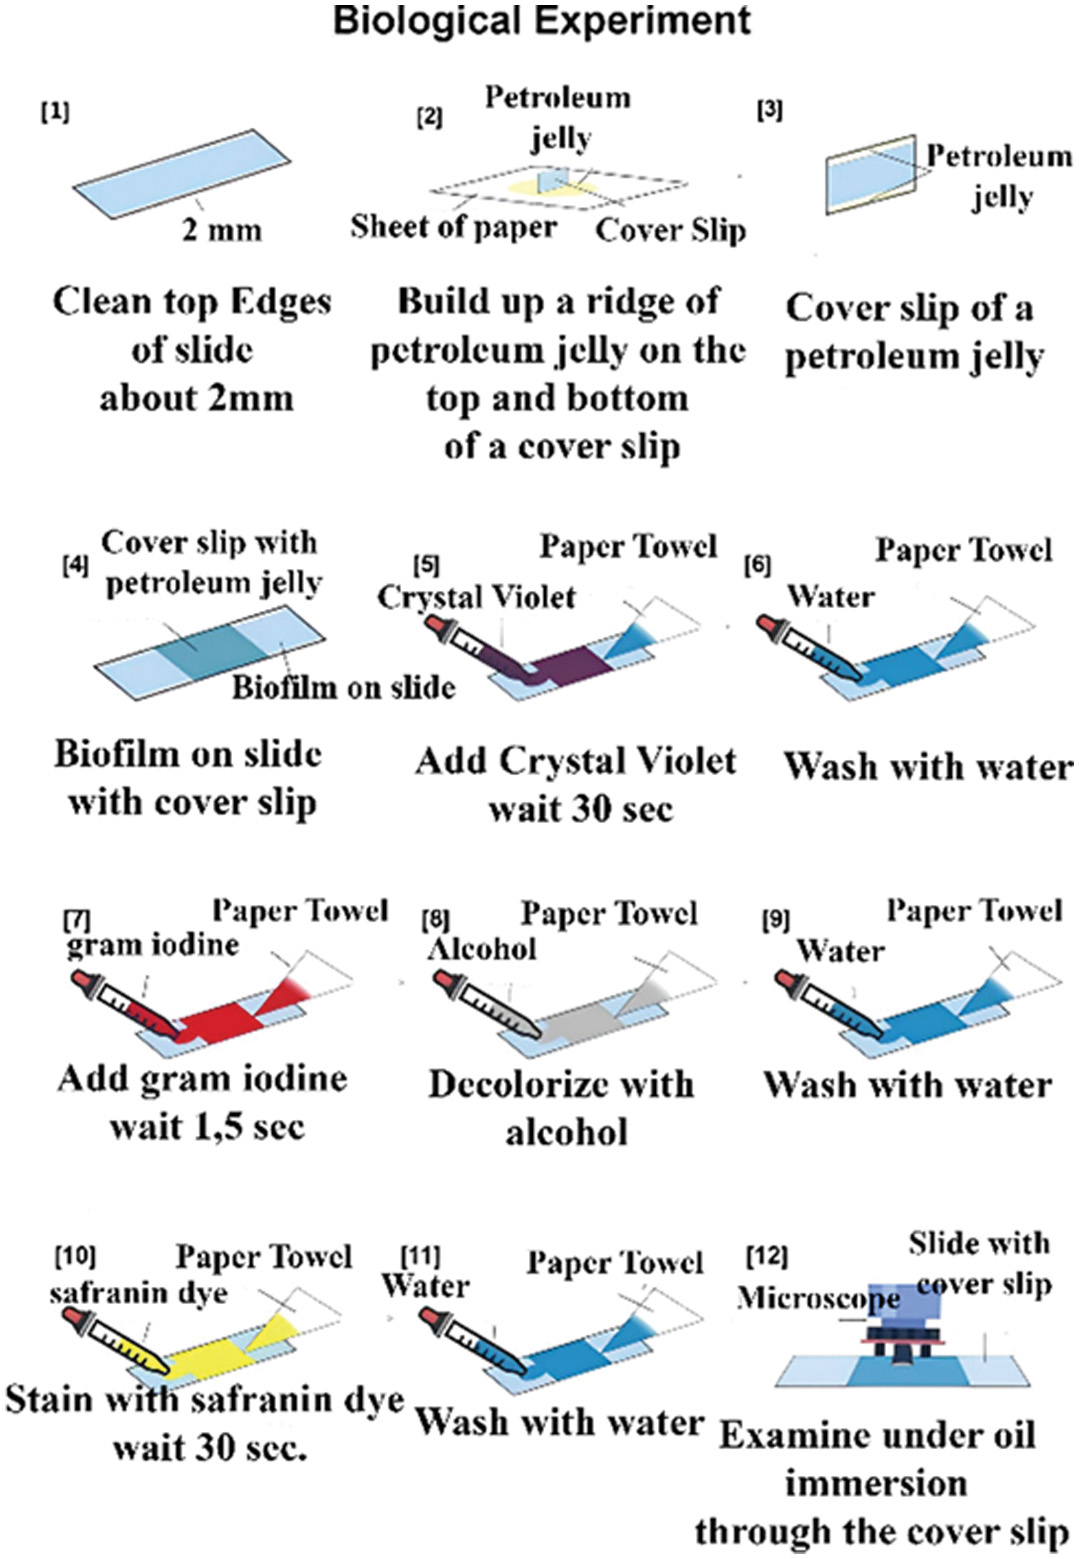 Fig. 2. Gram staining process.
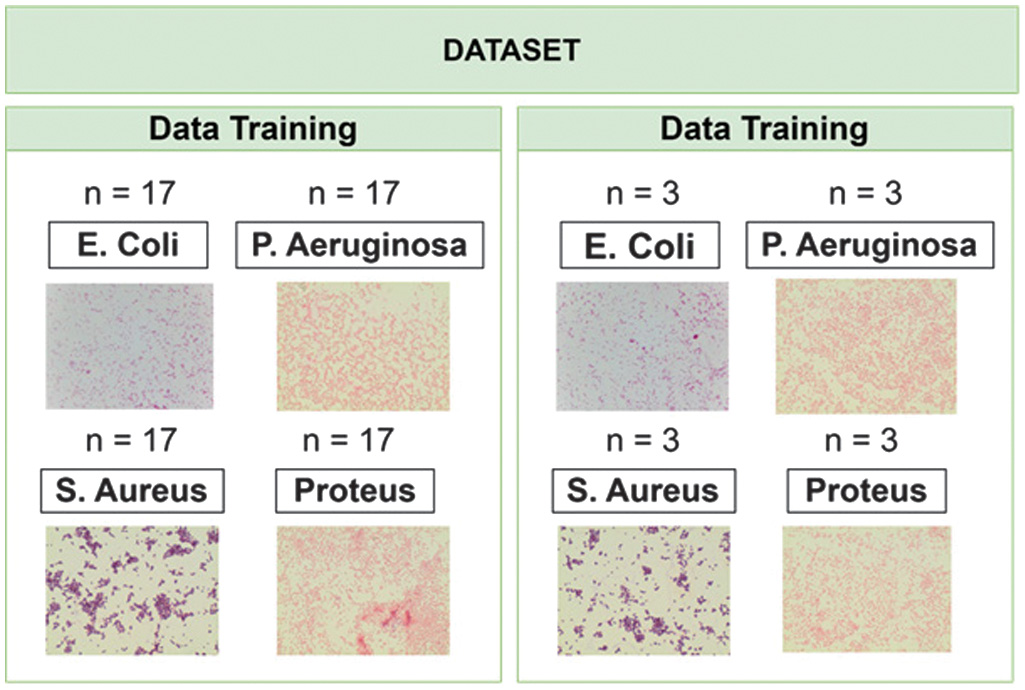 Fig. 3. Training and testing dataset.
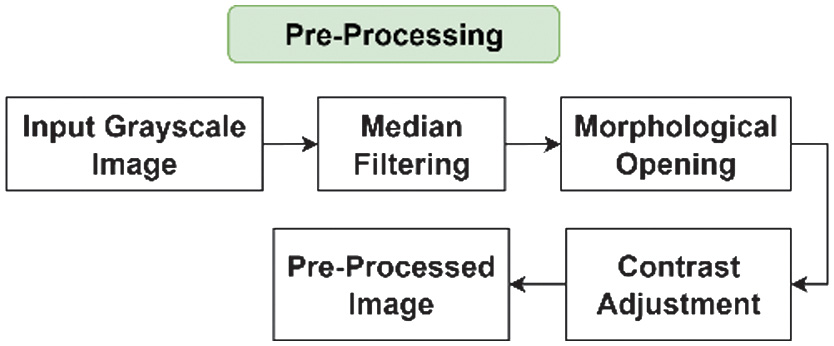 Fig. 4. Preprocessing stages on bacterial images.
The dataset used in this research consists of a total of 80 images, with an approximate total storage size of 500 MB in PNG format with an average resolution of 2048 × 1532 pixels. The microscopic images of bacteria are captured using a Biobase Trinocular Biological Microscope equipped with a digital camera. The software tools used included Python 3.10 with OpenCV, Scikit-learn, and Matplotlib libraries. This hardware and software configuration ensured reliable processing speed and reproducibility of the experimental results.
B.PREPROCESSING
Preprocessing is carried out on the data to clean it. It removes noise and normalizes or standardizes the data so that it is ready to be used in the next process. Fig. 4 shows the flow of the stage for bacterial images preprocessing.
Multiple preprocessing steps have been performed to prepare the bacterial images for subsequent analysis. First, the original bacterial images have been read in RGB format using the cv2.imread function and subsequently converted to grayscale using cv2.cvtColor. This conversion simplifies the analysis by reducing data complexity and allowing the focus to be placed solely on pixel intensity, which is essential for consistent image processing. Second, to suppress image noise while preserving essential structural details, especially along the edges of objects, a median blur operation is applied using a kernel size of 15 (cv2.medianBlur). This technique effectively smooths the image without compromising the morphological characteristics of the bacteria. Third, morphological opening is performed to remove small residual noise that may remain after the blurring process. This operation consists of two main steps: erosion followed by dilation, using a rectangular kernel of size (18, 5), created with the cv2.getStructuringElement function. The kernel defines the shape and area of the region to be processed, ensuring cleaner and more accurate bacterial segmentation. Finally, Contrast Limited Adaptive Histogram Equalization (CLAHE) is used to improve the visibility of bacterial structures. This technique helps make the details in the images clearer by enhancing the contrast in the image with parameters clipLimit = 0.8 and tileGridSize = (8, 8). CLAHE adaptively enhances local contrast, making bacterial features more distinguishable without over-amplifying the contrast across the entire image, thus maintaining a balanced visual representation. Through this preprocessing pipeline, the resulting image clearly distinguishes the bacteria from the background of the culture plate, thereby facilitating more effective segmentation in the subsequent stages of analysis.
Figure 5 presents a comparison of the original bacterial image with the image after the preprocessing pipeline. In the original image, the bacteria are still not clear enough to segment. After applying the preprocessing steps, including grayscale conversion, noise reduction through median blur, morphological opening, and CLAHE, the bacterial objects become more visually distinct from the background. This enhancement results in clearer bacterial boundaries and more uniform contrast, which is crucial for improving the accuracy of subsequent segmentation and feature extraction stages. The preprocessed image demonstrates reduced noise, enhanced contrast, and improved focus on the relevant bacterial structures, thereby ensuring better consistency and reliability in the computational analysis that follows.
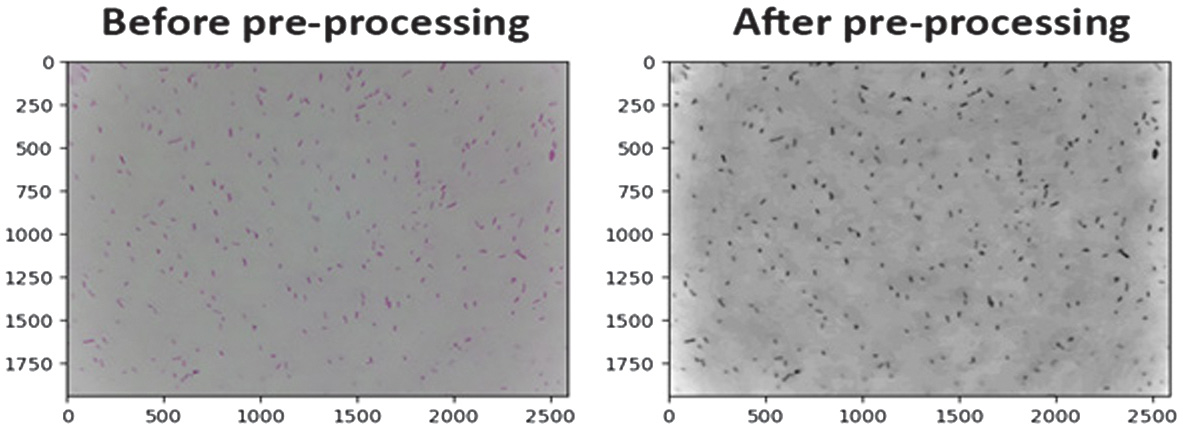 Fig. 5. Comparison of E. coli images before and after preprocessing.
C.SEGMENTATION
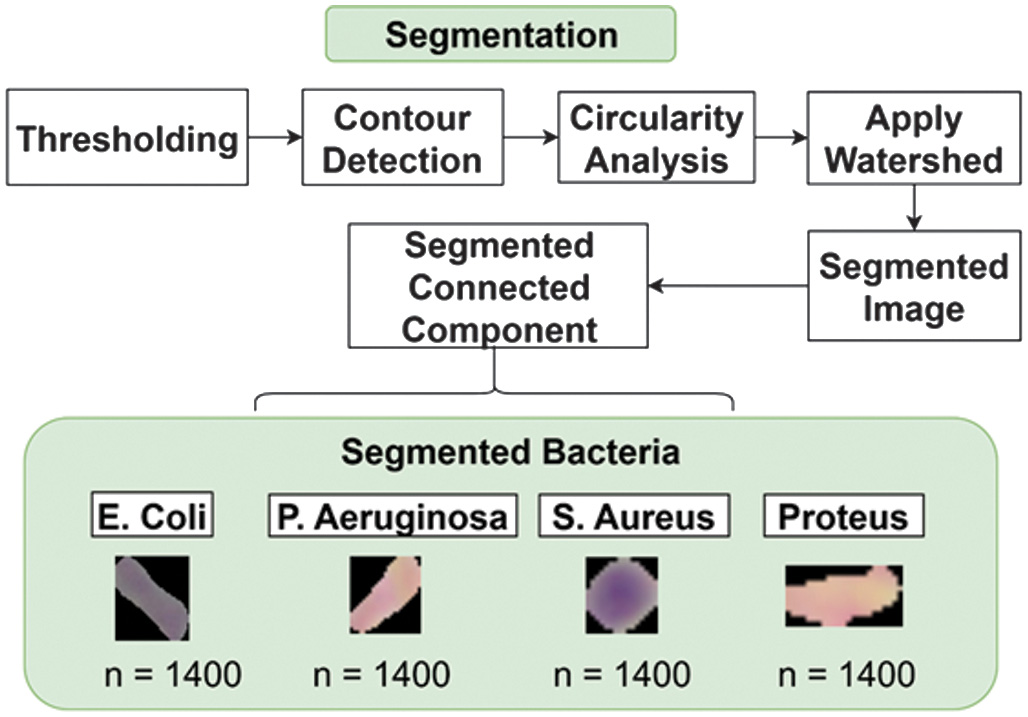
The segmentation stage aims to separate bacterial objects from the background as shown in Fig. 6. Thresholding was applied to generate a binary mask for bacterial regions. Specifically, the binary inverse thresholding method (cv2.THRESH_BINARY_INV) was used on the image enhanced by CLAHE to isolate bacteria from the background. A threshold value of 124 was selected to produce an appropriate binary mask, where darker pixels (representing bacteria) are converted to white (255), and brighter pixels (background) are converted to black (0).
This binary mask effectively highlights bacterial regions in the image, providing a foundation for contour detection. Contours are extracted from the binary mask using the cv2.findContours function, which identifies the outer boundaries of the bright regions in the mask. Each detected contour was analyzed to measure its area and perimeter. The circularity of each contour was then calculated using the formula:
This metric determines how closely the shape of a contour approximates a circle. Contours with circularity values greater than 0.6 and an area larger than 500 pixels are classified as round-shaped bacteria. These contours are then drawn onto the output image as part of the round bacteria mask. For the detection of rod-shaped bacteria, an initial mask was generated from the binary threshold result. This mask was further refined using morphological dilation with a kernel size of 11 × 11. Dilation serves to emphasize the separation between foreground (bacteria) and background regions by expanding the bright areas. Following this, the watershed algorithm was applied to further distinguish between bacterial and non-bacterial regions. Marker-based segmentation was employed to label the foreground (bacteria), background, and unknown regions. The watershed method then accurately segmented rod-shaped bacteria by marking object boundaries more distinctly. The final mask was produced by combining the watershed result with the previously obtained mask using bitwise operations, effectively isolating rod-shaped bacteria while suppressing background interference. As a result, the segmentation output distinctly separates both rod-shaped and round-shaped bacteria, making the image ready for subsequent feature extraction. This segmentation approach enables precise bacterial shape isolation, minimizes background noise, and sharpens the focus on key bacterial regions within the image, thus enhancing the accuracy of the analysis in the later stages.
D.FEATURE EXTRACTION
The feature extraction stage aims to obtain important attributes from the segmented bacteria. These attributes include geometric, texture, color, and moment information of the image, which will be used for the next feature selection and detection process. Figure 7 shows the features used.
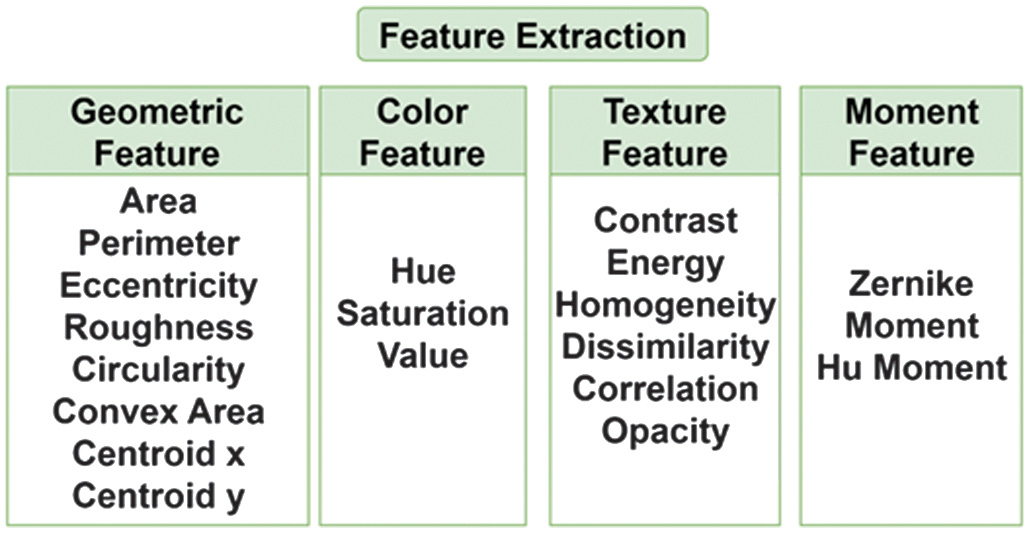
This section describes the extracted features used for bacteria detection. Geometric features capture shape and size information crucial for distinguishing bacteria from one another. Area and perimeter are calculated using cv2.contourArea and cv2.arcLength, while circularity and eccentricity describe the roundness and elongation of bacterial shapes. Roughness, computed as the ratio between the perimeter and the circumference of a circle with the same area, indicates surface irregularity. The convex area derived using cv2.convexHull helps identify shape concavity. Color features are obtained by converting images to the HSV color space. The average values of hue, saturation, and value channels reflect color tone, vividness, and brightness, which are influenced by staining techniques in microscopy. Texture features are extracted using the Gray Level Co-occurrence Matrix (GLCM) on grayscale images. These features include contrast, energy, homogeneity, dissimilarity, and correlation, measured across multiple angles and distances using graycomatrix and graycoprops. These features capture spatial patterns in intensity. Opacity is computed as the ratio of the maximum intensity of the bacteria to the maximum pixel value (255), providing insight into visual darkness. The moment’s features mathematically describe shape and pattern. Hu Moments are invariant to rotation, scale, and translation, while Zernike Moments, calculated with a fixed radius, represent intensity patterns. The mean values of these moments are used as descriptors. These features collectively enhance the accuracy of the detection algorithm by combining geometric, color, texture, and moment-based descriptors.
E.FEATURE SELECTION
The feature selection process in this study is performed using TMGWO [26], an improved variant of the GWO algorithm. The goal of TMGWO is to choose the most useful features for classification. It achieves this by striking a better balance between exploring new solutions and refining the best ones it has already found [27]. This method helps us choose the best features, which improves classification performance while also reducing the amount of data we need to analyze [13].
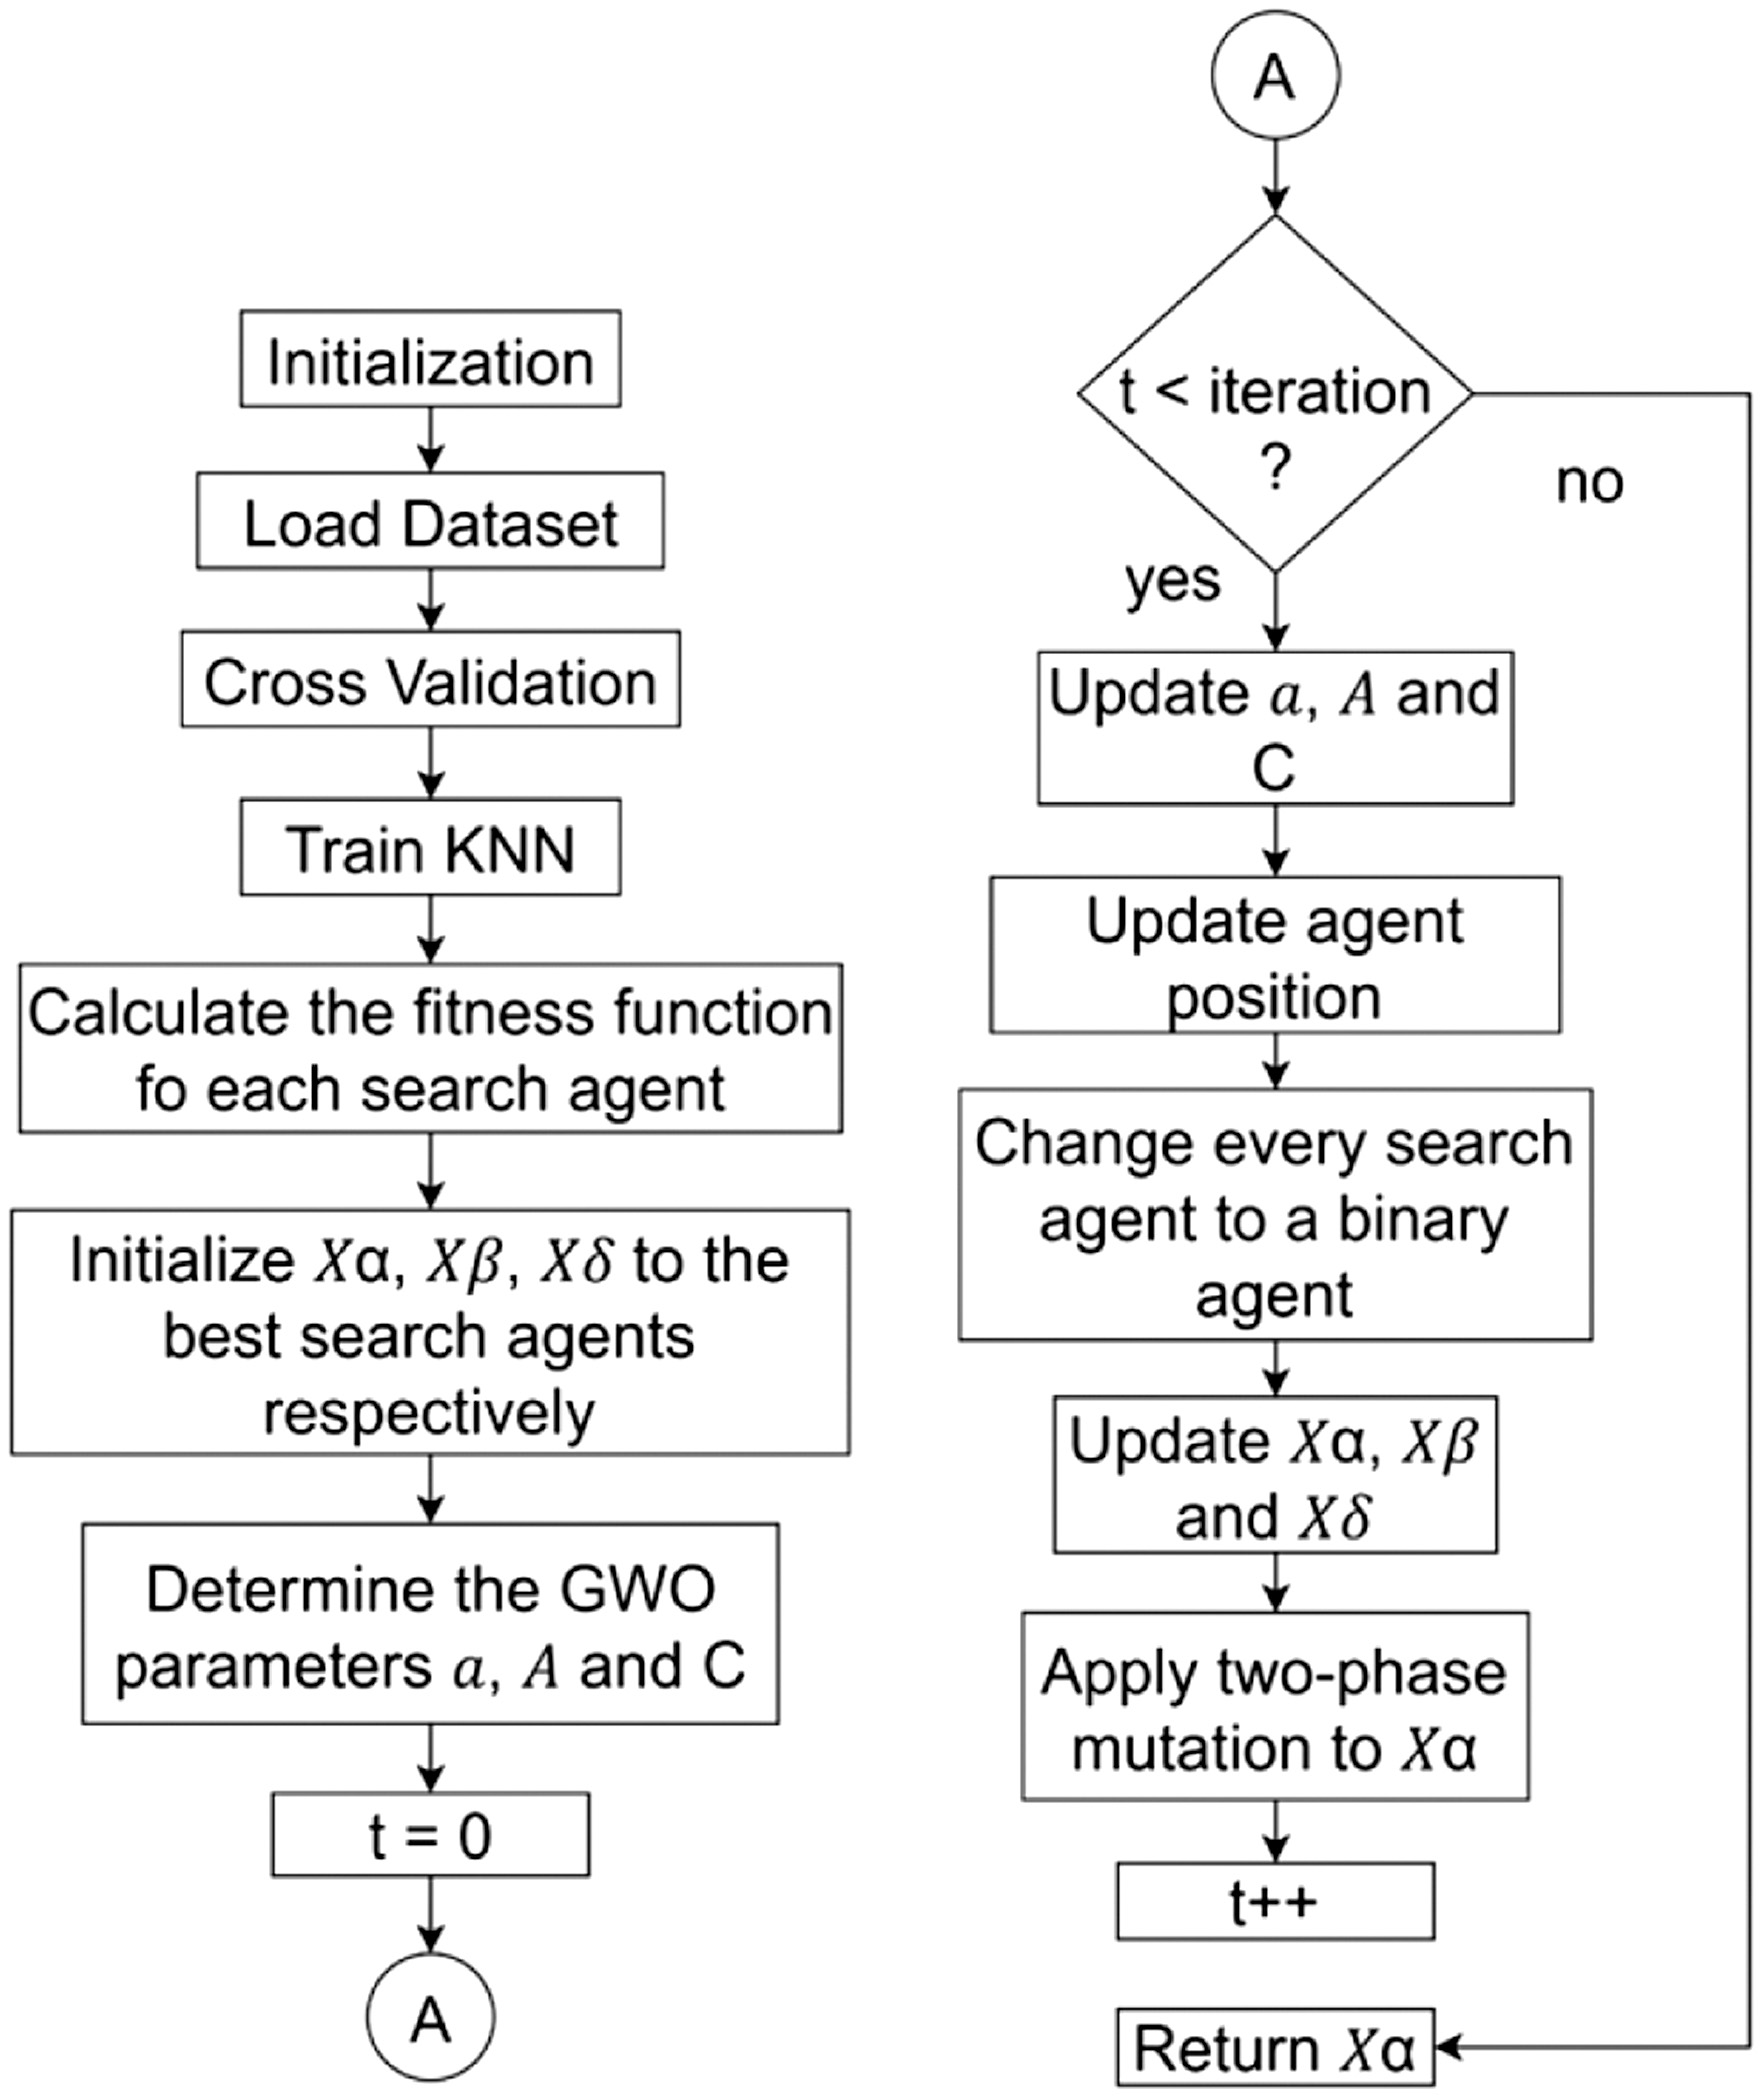
TMGWO introduces a two-phase mutation mechanism into the standard GWO framework. In the first phase, irrelevant features are removed from the candidate feature subset, thereby eliminating noise and reducing redundancy. In the second phase, potentially valuable features that were previously unselected are reconsidered and added back if they contribute positively to the model’s performance [28,29]. This two-phase process ensures that the final feature subset maximizes classification accuracy. The GWO algorithm models the leadership hierarchy and hunting strategies of gray wolves. The population is split into four groups, each representing a different level of dominance: Alpha (α), Beta (β), Delta (δ), and Omega (ω). The alpha wolf signifies the best solution identified to date, and the beta and delta wolves represent the second- and third-best solutions, respectively [30]. The remaining wolves are classified as omega wolves, which follow the guidance of the top three leaders [31,32]. During the optimization process, wolves update their positions relative to the prey, mathematically imitating encircling, hunting, and attacking behaviors. The prey’s position denotes the optimal solution, and the wolves iteratively adjust their locations to converge toward it [33]. During hunting, the wolves are able to encircle their prey [34], which can be mathematically expressed as:
where is the position of the prey and represents the positions of the wolves. The coefficient vectors, a and c, can be shown in the following way: where A and B are random vectors in [0,1]. Over iterations, decreases linearly from 2 to 0 as follows:The iterations parameter sets the maximum number of times a process will repeat [13].
The alpha, beta, and delta wolves know where the prey might be and can simulate the hunting process [13]. The other wolves update their positions based on the best three solutions, which are represented by the alpha, beta, and delta wolves. The following is one way to put this:
As each wolf pursues its prey, it repositions itself between its current spot and the prey’s location right before it attacks [13]. The alpha, beta, and delta wolves separate from one another to find the prey and then converge to attack it. Then, it can compel the wolves to separate from the prey by using random values that are either more than 1 or less than −1. Figure 8 shows the flowchart of the TMGWO algorithm.
F.CLASSIFICATION
In the classification stage, the system identifies the type of bacteria present in the input data. The classification process employs the KNN algorithm, a widely used method for pattern recognition and classification because of its simplicity and effectiveness. The classification process was applied to the training data consisting of four bacterial species: E. coli, P. aeruginosa, Proteus, and S. aureus. The following steps outline the classification process using KNN. First, the best value for the parameter k, representing the number of nearest neighbors, is determined through experimentation to achieve the highest classification accuracy. Once k is selected, the distance between the query data (test sample) and each sample in the training dataset is calculated. In this study, the Euclidean distance metric is used to measure the similarity between feature vectors. This metric quantifies the straight-line distance between two points in a multidimensional space [34]. The squared Euclidean distance is calculated using the following formula:
The term d(p,q) is used to represent the distance that separates two points, p and q, and n denotes the number of features in the feature vector. After calculating the distances, the k smallest distances are selected, and the most frequent class among these neighbors is assigned as the classification result. This approach enables the system to classify bacterial images efficiently based on the selected features obtained from the feature selection process. The KNN algorithm was chosen for this study due to its non-parametric nature and ease of implementation, making it suitable for classifying complex biological images where data distributions may be unknown. Furthermore, its performance in conjunction with the selected features was evaluated based on accuracy and computational efficiency [35].
IV.RESULTS AND DISCUSSION
A.DATASET
For each bacterial class, a total of 325 training samples are used, resulting in a balanced dataset. This approach ensures that the classification model receives an equal representation of each class, which is important to prevent bias toward any particular bacterium during the learning process. From each sample, 19 features were extracted. These features represent the geometric, texture, color, and moment characteristics of the bacteria, which are essential for distinguishing between the different classes. The dataset specifications used in this study, including the number of features and training samples for each bacterial class, are summarized in Table I:
| Bacteria class | Number of features | Number of data training |
|---|---|---|
| E. coli | 19 | 325 |
| P. aeruginosa | 19 | 325 |
| Proteus | 19 | 325 |
| S. aureus | 19 | 325 |
Although each bacterial class has the same number of extracted features (19 features), the characteristics of these features differ between classes. Both are Gram-negative bacteria; E. coli and P. aeruginosa have distinct morphological structures that can be used to differentiate them. For example, E. coli typically appears as a short, rod-shaped bacterium, while P. aeruginosa is often characterized by its longer, rod-like shape and the presence of polar flagella, which give it motility. These structural differences are a key feature in bacterial classification and identification. In contrast, S. aureus is a Gram-positive bacterium characterized by its spherical (coccus) shape and grape-like clustering morphology. Proteus species are also rod-shaped but are known for their swarming motility patterns, which affect their texture and spatial distribution in the images. These inherent biological and morphological differences are captured through geometric, texture, color, and moment-based features, even though the number of features extracted remains the same across all classes.
B.FEATURE SELECTION
The TMGWO algorithm is employed during the feature selection phase to pinpoint the optimal subset of features from the bacterial feature data [19]. This process is designed to enhance the efficiency of bacterial detection by reducing the amount of data (data dimension) while making sure the classification accuracy remains high [23]. The feature selection process carried out is explained as follows. All experiments were carried out using the 10-fold cross-validation approach, with 70% of the data allocated for training and 30% for testing. With four features selected by TMGWO, namely roughness, hue, saturation, and value. This is the fitness value obtained as shown in Fig. 9.
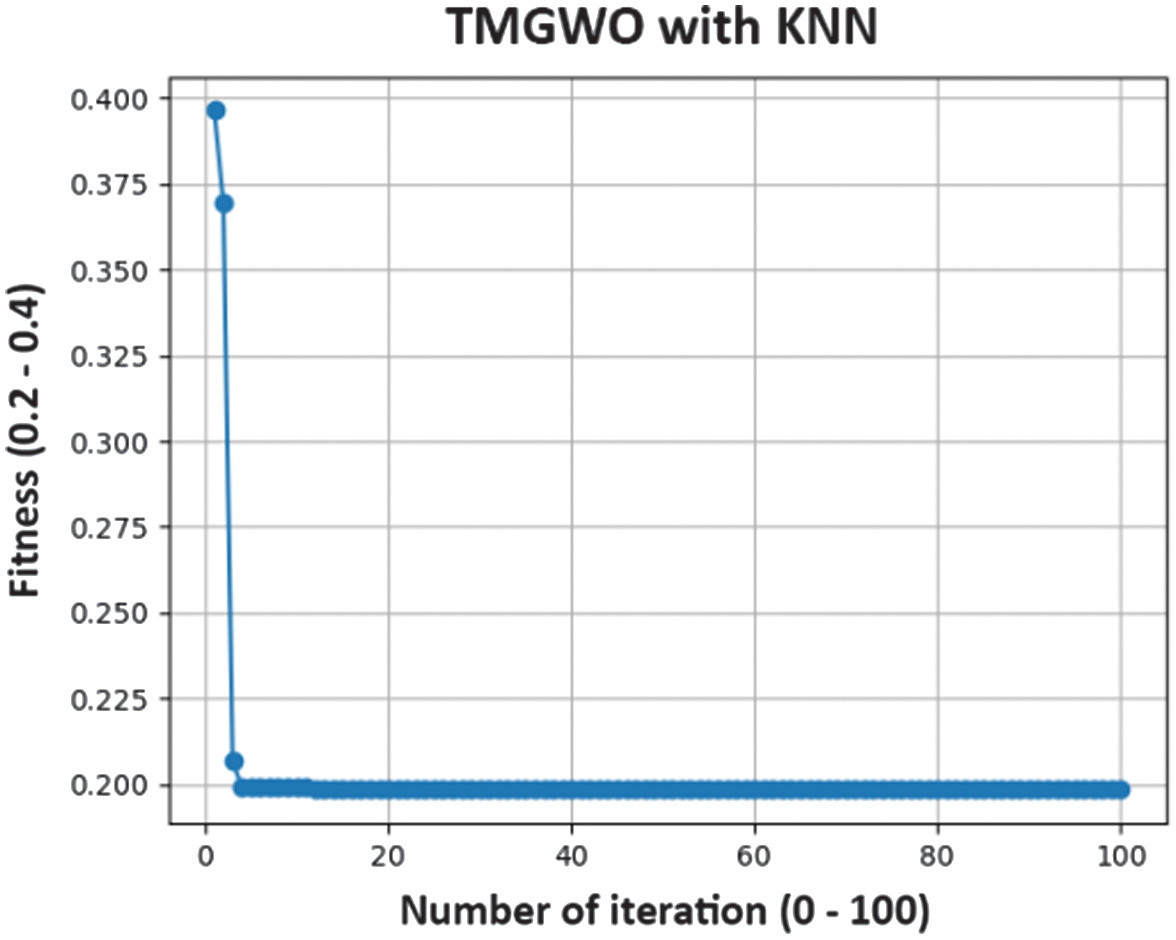 Fig. 9. Fitness convergence plot on feature selection by TMGWO.
C.DETECTION RESULT
After the classification process using KNN, the results of bacterial detection are tested on the testing data, with the bounding box of E. coli bacteria in red, P. aeruginosa in green, S. aureus in yellow, and Proteus in blue. This result is shown in Fig. 10.
D.RESULTS ANALYSIS
After all stages of detection are done, the next step is to analyze the bacterial detection system to see the performance of KNN and feature selection by TMGWO. Analysis is important to see the performance of the system, starting from detection accuracy, and then program execution time. Analysis is done on 10 testing datasets.
1).DETECTION ACCURACY
It was found that the accuracy was 73.43% with feature selection and 67.29% without using feature selection. Feature selection increases accuracy compared to the one with no feature selection step. The graph is shown in Fig. 11. We add more comprehensive summary for evaluation result by comparing KKN method using feature selection in Table II and without feature selection in Table III.
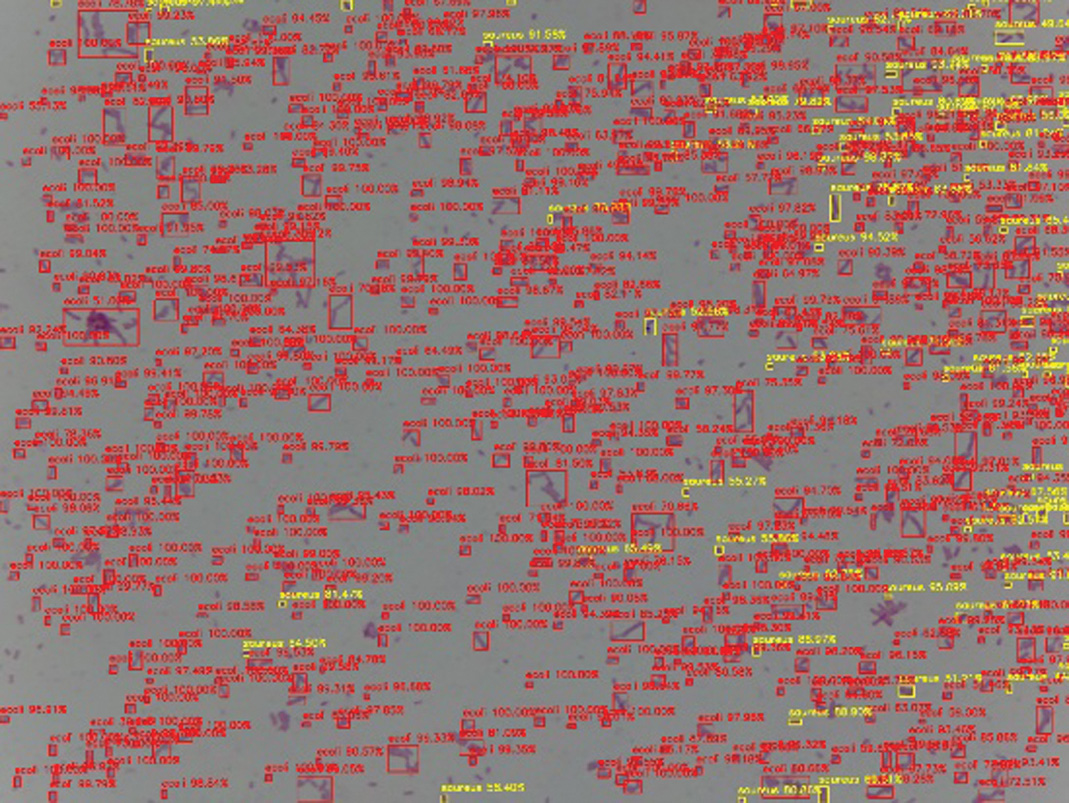 Fig. 10. Bacterial detection results on E. coli images.
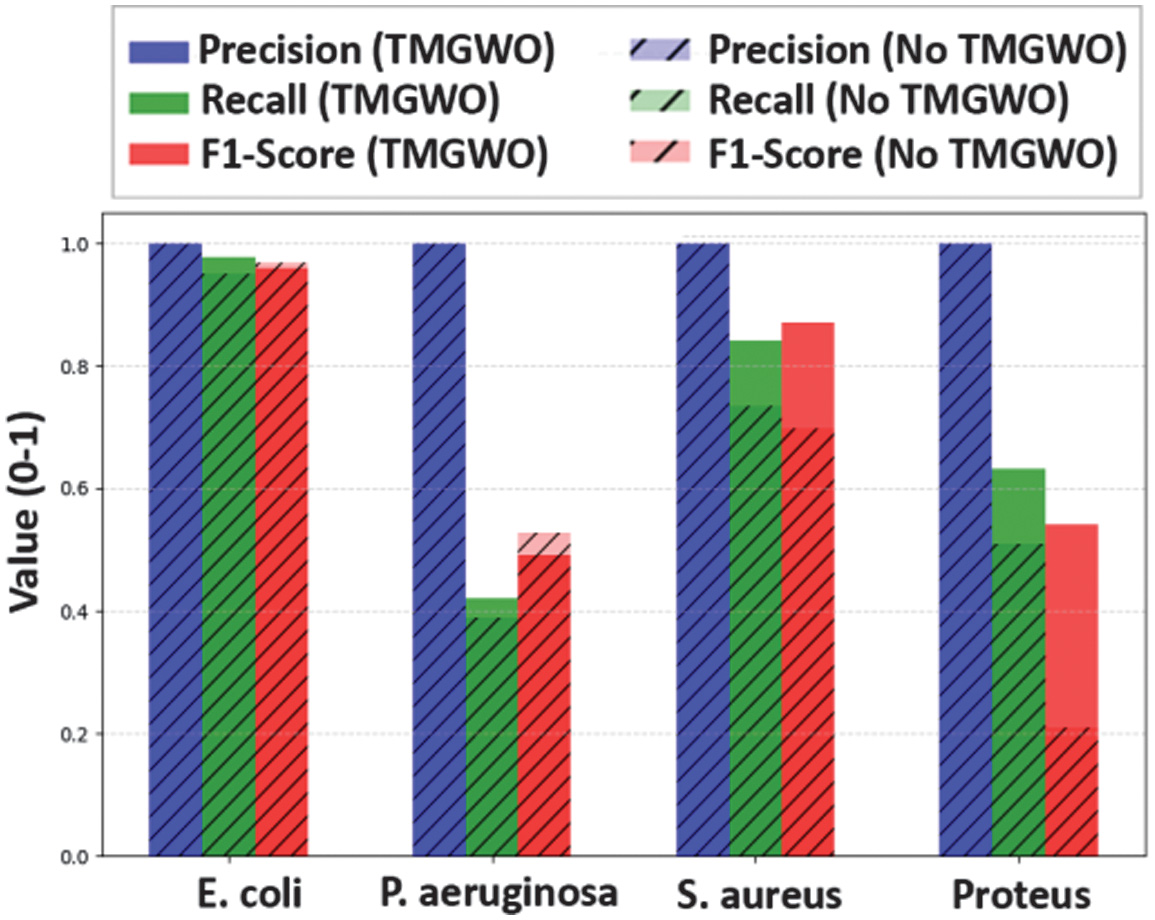 Fig. 11. The comparison accuracy with and without feature selection.
2).EXECUTION TIME
In addition to accuracy, model execution time is also an important factor in performance evaluation. Based on the implemented code, the average execution time recorded for both methods is shown in Table IV.
Table II. Evaluation result (KNN with feature selection)
| Bacteria class | Precision | Recall | F1-score |
|---|---|---|---|
| E. coli | 1 | 0.9776 | 0.9886 |
| P. aeruginosa | 1 | 0.4205 | 0.4906 |
| Proteus | 1 | 0.6318 | 0.5407 |
| S. aureus | 1 | 0.8407 | 0.8709 |
Table III. Evaluation result (KNN without feature selection)
| Bacteria class | Precision | Recall | F1-score |
|---|---|---|---|
| E. coli | 1 | 0.9496 | 0.9692 |
| P. aeruginosa | 1 | 0.3897 | 0.5277 |
| Proteus | 1 | 0.5097 | 0.2081 |
| S. aureus | 1 | 0.7351 | 0.6984 |
Table IV. Execution time evaluation with and without feature selection
| Method | Average execution time |
|---|---|
| Without feature selection | 35.4 s |
| With feature selection | 1.8 s |
V.CONCLUSIONS
Based on the obtained results, several conclusions could be derived from this study. The implementation of TMGWO in the feature selection process effectively improved both detection speed and accuracy compared to the system without feature selection. The overall performance of the detection system became more optimal as the feature selection process reduced the complexity of the processed data. By applying feature selection, the system successfully enhanced the bacterial detection accuracy, reaching 73.43%, representing a noticeable improvement compared to the results without feature selection. In terms of execution speed, the use of TMGWO-based feature selection significantly accelerated the processing time. The average execution time was reduced from 35.4 seconds to 1.8 seconds, indicating a reduction of over 30 seconds. These results demonstrated that the applied feature selection technique successfully improved the efficiency of the bacterial identification process.
However, this research also faced several challenges. One of the primary challenges was the limited quantity and variation of microscopic bacterial image data, which constrained the model’s generalizability to more diverse datasets. Additionally, differences in staining quality, lighting, and background noise in microscopic images still presented obstacles in achieving higher detection accuracy.
For future work, it is recommended to expand the dataset with more diverse and larger image samples, including different bacterial strains and various imaging conditions. Moreover, the integration of advanced classification algorithms, such as DL-based approaches, could further enhance accuracy. Combining TMGWO with hybrid or ensemble feature selection methods might also yield more robust and generalizable results.
The implementation of this method offers valuable benefits in the field of microbiology, particularly for supporting rapid and automated identification of bacterial species from microscopic images. Such systems have potential applications in clinical laboratories to accelerate diagnostic processes, reduce human error, and improve the efficiency of detecting waterborne and pathogenic bacteria in healthcare, environmental monitoring, and food safety sectors.