I.INTRODUCTION
Tobacco and its products, such as cigarettes and cigars, are special commodities that satisfy physiological and psychological needs of consumers. Tobacco leaves contain nicotine that has significant impact on the aroma and flavor of tobacco products [1], [2]. For example, products with low-percentage nicotine volumes can lead to a dark or harsh aroma, whereas excessive nicotine can make the products taste too bitter [3]. In addition, high nicotine levels can have negative effects on the brain and physical health [4]. Therefore, measuring and controlling nicotine volumes are crucial for producing tobacco products with desirable qualities. Traditional methods of detecting and measuring nicotine volumes require several steps. First, the tobacco leaves need to be ground into powder, which are then mixed with various chemical reagents to generate several compounds for measurement [5], [6]. Most of these steps are time-consuming, labor-intensive, and require expensive lab equipment. Furthermore, traditional measurement approach is tobacco leaf destructive [7]. Therefore, it is advantageous to utilize an efficient and nondestructive analytical method to determine the content of nicotine in tobacco leaves. Tobacco leaves are composed of various chemical substances. The spectrum of tobacco leaves contains the information of certain chemical compositions. This paper mainly focuses on analyzing nicotine.
Near-infrared (NIR) spectroscopy has been proven effective and nondestructive for quantitative material analysis and identification tasks [8], [9]. NIR spectroscopy is based on molecular overtone and combination vibrations. The spectral data acquired from NIR sensors contain abundant structural information, in which dissimilative and complex feature information can be extracted [10], [11]. Compared with traditional measuring approaches, an NIR-based approach has several advantages: (1) it is nondestructive and does not require any direct contact with the investigated objects; (2) it is efficient, with high detection/identification speed; (3) it can detect multiple items on a single sample. Fig. 1 shows the spectral data of tobacco leaves from an NIR device, Thermo Antaris II, with multiple sensors. The wavelengths of acquired NIR data range from 10000−1 to 3800−1 cm.
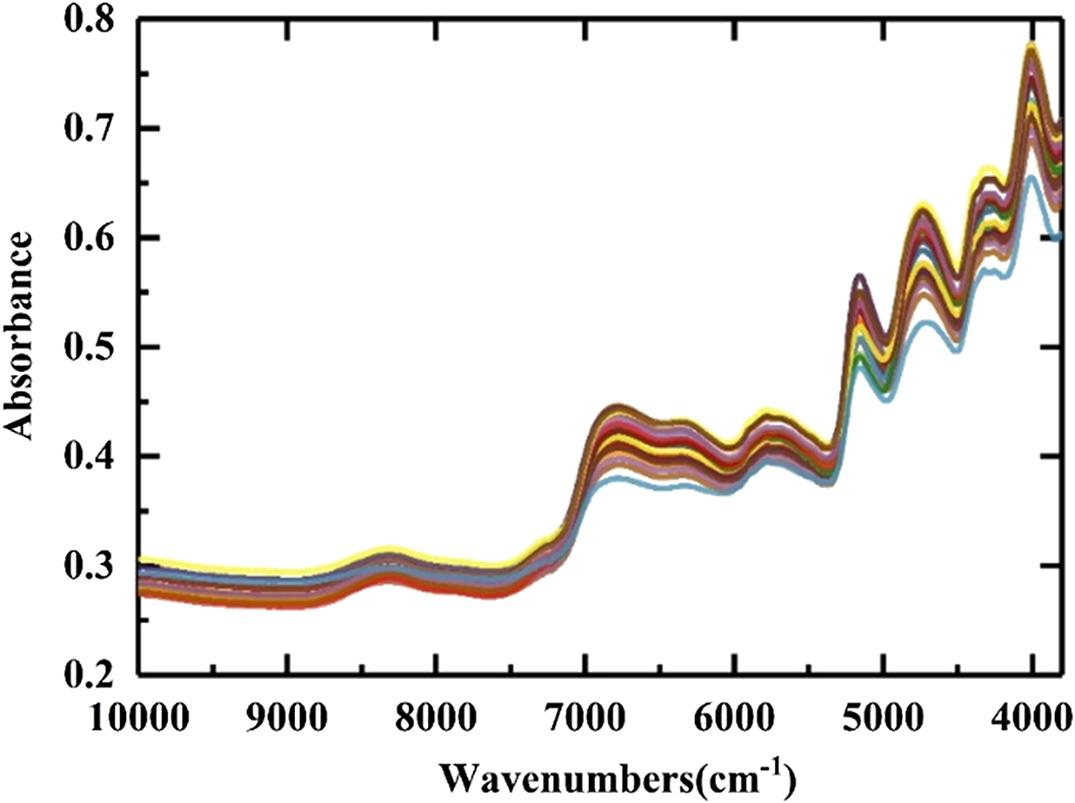 Fig. 1. Raw near-infrared (NIR) spectra of samples.
The absorbance values of different wavelengths indicate the existence of certain substances. A larger value indicates a higher percentage of a certain component within a sample. Table I shows the correlation between the wavelengths and the chemical constituents of tobacco, which characterize the nicotine compositions of tobacco leaves.
TABLE I. Correlation between the Wavelengths and the Chemical Substances of Tobacco
| Range of wavelength (cm) | Chemical substances |
|---|---|
| 7270−1–6110−1 | First overtone regions of N–H, C–H plus C–H |
| 6110−1–5725−1 | S–H, first overtone regions of C–H |
| 5250−1–5050−1 | O–H, second overtone of C = O |
| 4870−1–4570−1 | N–H, first overtone of C = O plus O–H |
| 4570−1–4400−1 | N–H plus O–H |
| 4400−1–4010−1 | C–H plus C–H |
| 4010−1–3900−1 | C–H |
Spectroscopy data only provide the observation of a sample’s chemical materials. Further analysis is required to unveil object detailed structures and precise volumes. Conventionally, machine learning-based methods, such as support vector machine (SVM) [5], partial least squares (PLS) [12], and their variants, have been applied to analyze the spectral data. However, these approaches require substantial empirical parameters, which make the learned model less robust and not viable for a wide range of application domains. Deep learning-based approaches [13], [14] have been the mainstream in the fields of image processing and computer vision. For example, the convolutional neural network (CNN) [15] has powerful feature-learning ability and has been largely used in classification and regression tasks [16], [17]. More recently, there are studies that have been reported to use deep learning for spectral data analysis. Specifically, by processing a sequence of NIR spectral data via a trained deep network model, the high-level complex structures of various chemical substances can be extracted and detected [18]. However, few deep learning approaches are available for detecting nicotine in the tobacco industry.
Following the development of Internet techniques and cloud infrastructure, more and more transaction processing systems have been hosted in cloud platforms [19]–[21]. As one of them, the traditional tobacco transactions are moved to a cloud-based transaction platform. Each batch of tobacco leaves has its own personal identity, which contains the related physical features, cultivation, and weather conditions. The cloud-based transaction platform can refine the analysis process of tobacco leaves. Everything related to a tobacco leaf can be traced. However, a large amount of tobacco data need to be processed. To classify the quality of tobacco leaves objectively, artificial intelligence methods are applied to the analysis of the related tobacco data. The corresponding analysis requires a large number of computational resources. Unfortunately, the traditional server-based platforms cannot provide a large number of computational resources in a reasonable price range. However, cloud-based platforms can use numerous and powerful computation resources within reasonable costs [22]–[24] to implement the analysis of large-size tobacco data. Additionally, the related data from tobacco growers, tobacco markets, cigarette factories, and tobacco supervision department can be processed and shared in a cloud-based platform. Each user of the cloud-based platform can provide their own tobacco data and access other data.
Therefore, in this work, we propose a fully convolutional network (FCN) for accurately analyzing nicotine content in tobacco leaves from NIR data. FCN is able to process data from multiple windows in a single step. The network is trained end to end and outputs a regressed number related to a chemical substance. In the original FCN, the data dimension is reduced by a pooling layer, which can ease the learning burden and enhance the model nonlinearity for image segmentation tasks [25]. In this work, the NIR spectroscopy data at individual wavelength points are highly correlated [26]. Pooling operation could cause spectral information to be missing. Thus, we replace the max-pooling layer with a convolutional layer to avoid data loss in the feature extraction process. This approach has the advantage of regressing values, since the predictions can have enough aggregated information. During the training, mean square error (MSE) is used as the regression objective (loss function) that can penalize the measurement differences from the ground truth.
In our experiments, the optimized one-dimensional FCN (1D-FCN) model is compared with existing analysis methods [5], [6] and a regular CNN model. The results demonstrate that the proposed model is more effective. The main contributions of this paper are threefold:
- 1.Apply 1D-FCN network to directly process the long sequence NIR spectral data to avoid data loss during preprocessing.
- 2.Replace the max-pooling layer in the original FCN network to preserve the information integrity. Thus, the relevance of spectroscopy feature information can be retained, and the prediction accuracy of the model is improved.
- 3.The network is trained end to end and outputs the nicotine percentage within the tobacco leaf samples in a single step.
- 4.A cloud-based framework is proposed, which uses the computational resources of cloud computing to solve the scalability problems in nicotine analysis. Data sharing and accessing are implemented by the proposed cloud-based framework.
The structure of the rest of this paper is as follows: Section II provides some related work; Section III presents the proposed cloud-based framework. The proposed network framework is described in Section IV; In Section V, data and the experimental results are presented; and Section VI draws the conclusion of this work.
II.RELATED WORK
NIR-based approaches have been frequently used for rapidly and reliably revealing chemical composition from food and plants [27]. From the literature, machine-learning methods, such as PLS [6], SVM [5], and their variants, have been widely used to quantitatively determine the volume of chemical substances from NIR data. Zhang et al. [5] proposed a wavelet transformation (WT) SVM method where the spectral data are prepossessed by WT and fed into SVM to find the chemical constituents of tobacco samples. Jing et al. [28] applied a multiblock PLS method to determine the moisture in corn and the nicotine and sugar in tobacco leaves. In that method, the spectral data are divided into subblocks along the wavelengths, and PLS is used to build the submodel for each subblock. Its final determination model is from the combination of all subblock models. Boosting PLS [1] utilizes the optimized training sets by a boosting method, and a PLS regression algorithm is used to determine the nicotine content. In the multivariate calibration method proposed by Tan et al. [29], the spectral data in the training set are transformed into a set of wavelet representations by WT. Then, mutual information is captured to train and construct an optimized PLS model for analyzing the total sugar component of the tobacco. Sample set partitioning based on joint X–Y distances-partial least squares (SPXY-PLS) regression method [6] splits the tobacco samples into calibration and validation sets based on joint X–Y distances. Then, PLS was used to establish the regression model to determine the constituents of tobacco samples. Li et al. [30] utilized both PLS and nonlinear least-squares SVM methods to develop the calibration models to estimate the constituents of tobacco seed. Four preprocessing methods are used to optimize the original spectra before establishing the calibration models. This approach needs dedicated models for individual constituents, which make this approach too complicated to be applicable for wide usage.
The spectral data contain complex and redundant structural information, which causes difficulties for data analysis. To reduce the data complexity, several spectral treatments, such as WT [31], principal component analysis, multiplicative scatter correction [23], and standard normal variate [11], have been adopted as the data preprocessing procedure. However, these preprocessing methods require manual parameter adjustment, which is ad hoc and causes low prediction accuracy due to information loss.
Recently, a CNN-based algorithm [18] is proposed to classify the cultivation regions of tobacco leaves. In this method, one-dimensional CNN (1D-CNN) is first used to extract the features of the one-dimensional (1D) spectrum, and the image convolution method is used to extract the structure features of the two-dimensional spectral images. Then, both features are used for classification and selecting the optimal network. Zhang et al. [16] used CNN model to determine total anthocyanins, total flavonoids, and total phenolics in black goji berries with NIR hyperspectral. These studies have shown that deep learning can be used as modeling methods and feature extraction methods for NIR spectroscopy of tobacco leaves.
III.THE PROPOSED CLOUD-BASED FRAMEWORK
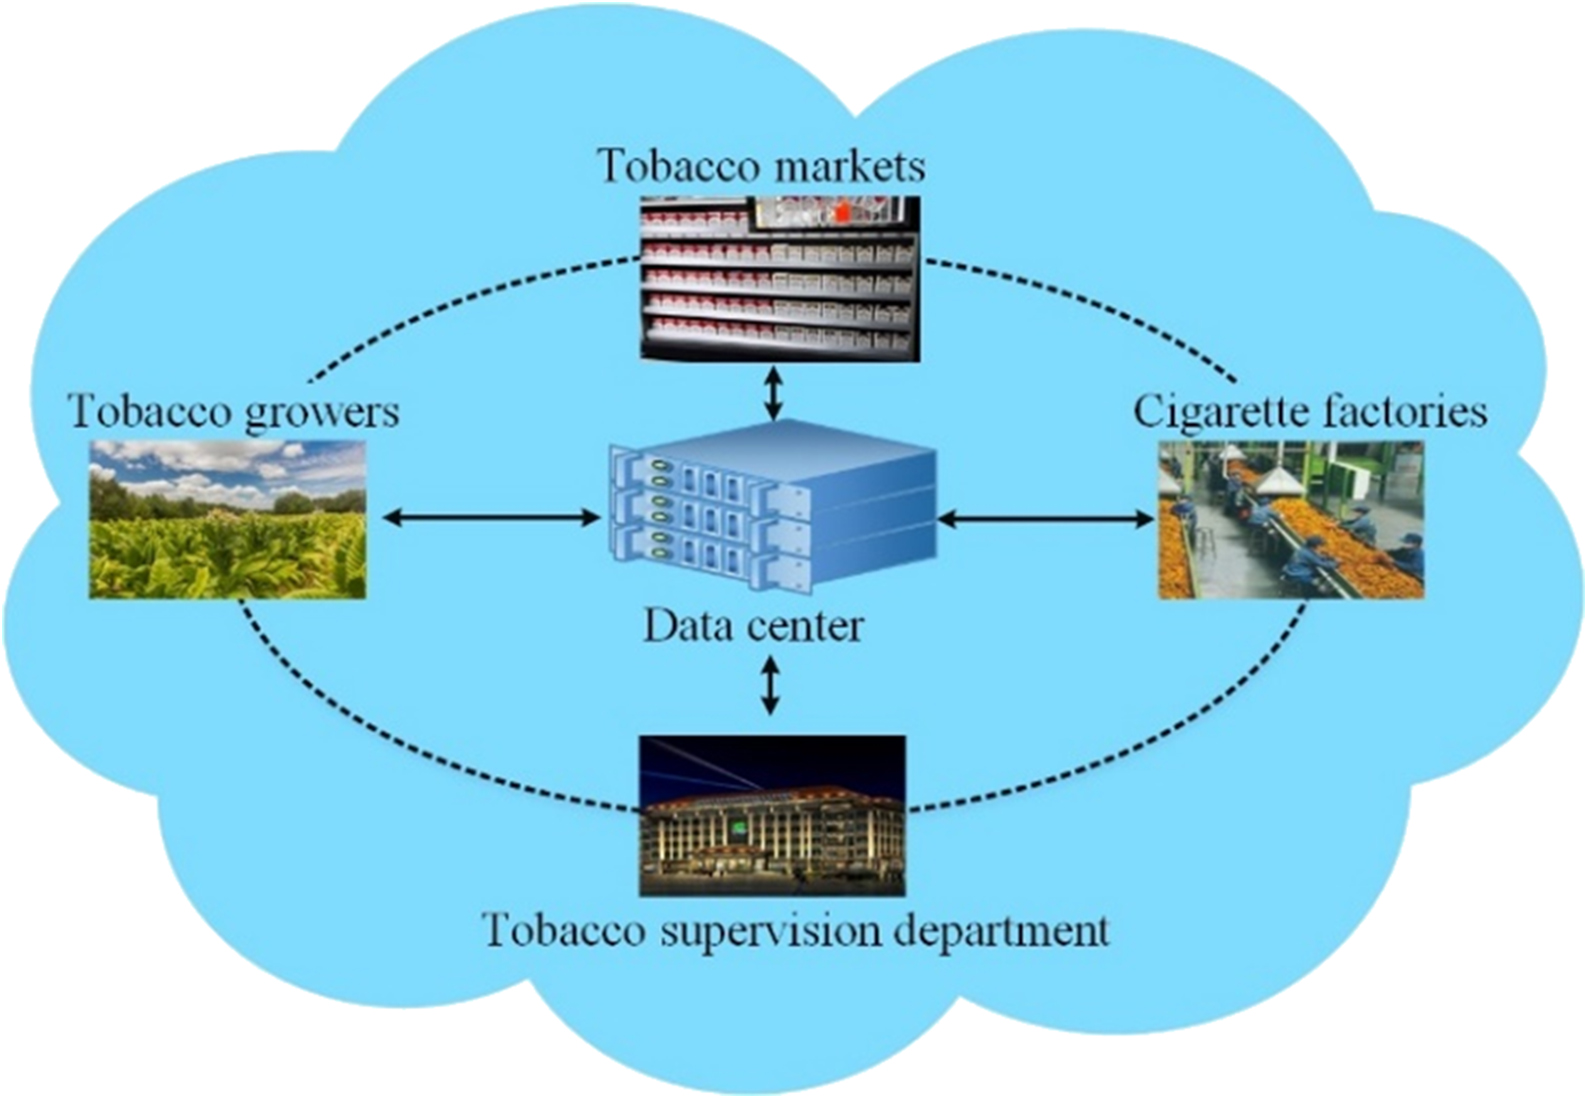
Fig. 2 shows the proposed cloud-based tobacco cultivation area classification framework, which consists of four main components, tobacco growers, tobacco markets, cigarette factories, and the tobacco supervision department. The neural network-based data center is shared with each component. Each component uploads the related tobacco information to the shared data center. The data center uses neural network techniques to analyze the tobacco data. The analyzed results are shared with each component. Tobacco growers can provide basic information, such as cultivation-related information, geographical information, and weather information. Generally, tobacco growers, tobacco markets, and cigarette factories have their own standards for tobacco leaves. In most cases, cigarette factories have more classification levels of tobacco leaves than tobacco growers. The sale of tobacco leaves by tobacco growers and tobacco markets is based on the quality levels of tobacco leaves, the related unit price, and the weight. Cigarette factories sell cigarettes in packs based on the quality levels of tobacco leaves. Comparing with tobacco growers and tobacco markets, cigarette factories classify the tobacco leaves into more levels. Even the same cigarette brand has many types of cigarettes that are sold at different prices. The related standards from each component can help a neural network refine and improve the classification. Tobacco growers can provide more cultivation information. The same type of tobacco leaves from different cultivation regions is sold at tobacco markets. Tobacco markets obtain more information related to the same type of tobacco leaves. For the same type of tobacco leaves, the corresponding quality can be compared and classified according to the cultivation regions. Cigarette factories can use NIR spectroscopy techniques to achieve the fast classification of tobacco leaves. The analyzed and learned results from tobacco growers and tobacco markets can effectively improve the classification accuracy of tobacco leaves.
IV.THE PROPOSED NETWORK FRAMEWORK
In this paper, 1D-FCN model is proposed to determine the nicotine content by analyzing the NIR data of tobacco leaves. Our tobacco leaf dataset comes from the Guizhou Province, China. The collected dataset includes NIR spectroscopy data and their measured ground truth nicotine percentage, which is gathered using a traditional approach. The goal of this network is to build a model to predict the nicotine percentage from NIR data of a tobacco sample. It is a regression model that provides a precise value, given an unseen sample. The 1D-FCN model uses 1D convolution layers to directly process spectral data and output prediction results. MSE is used as the regression loss function during the training process. The overall flowchart of the network is shown in Fig. 3.
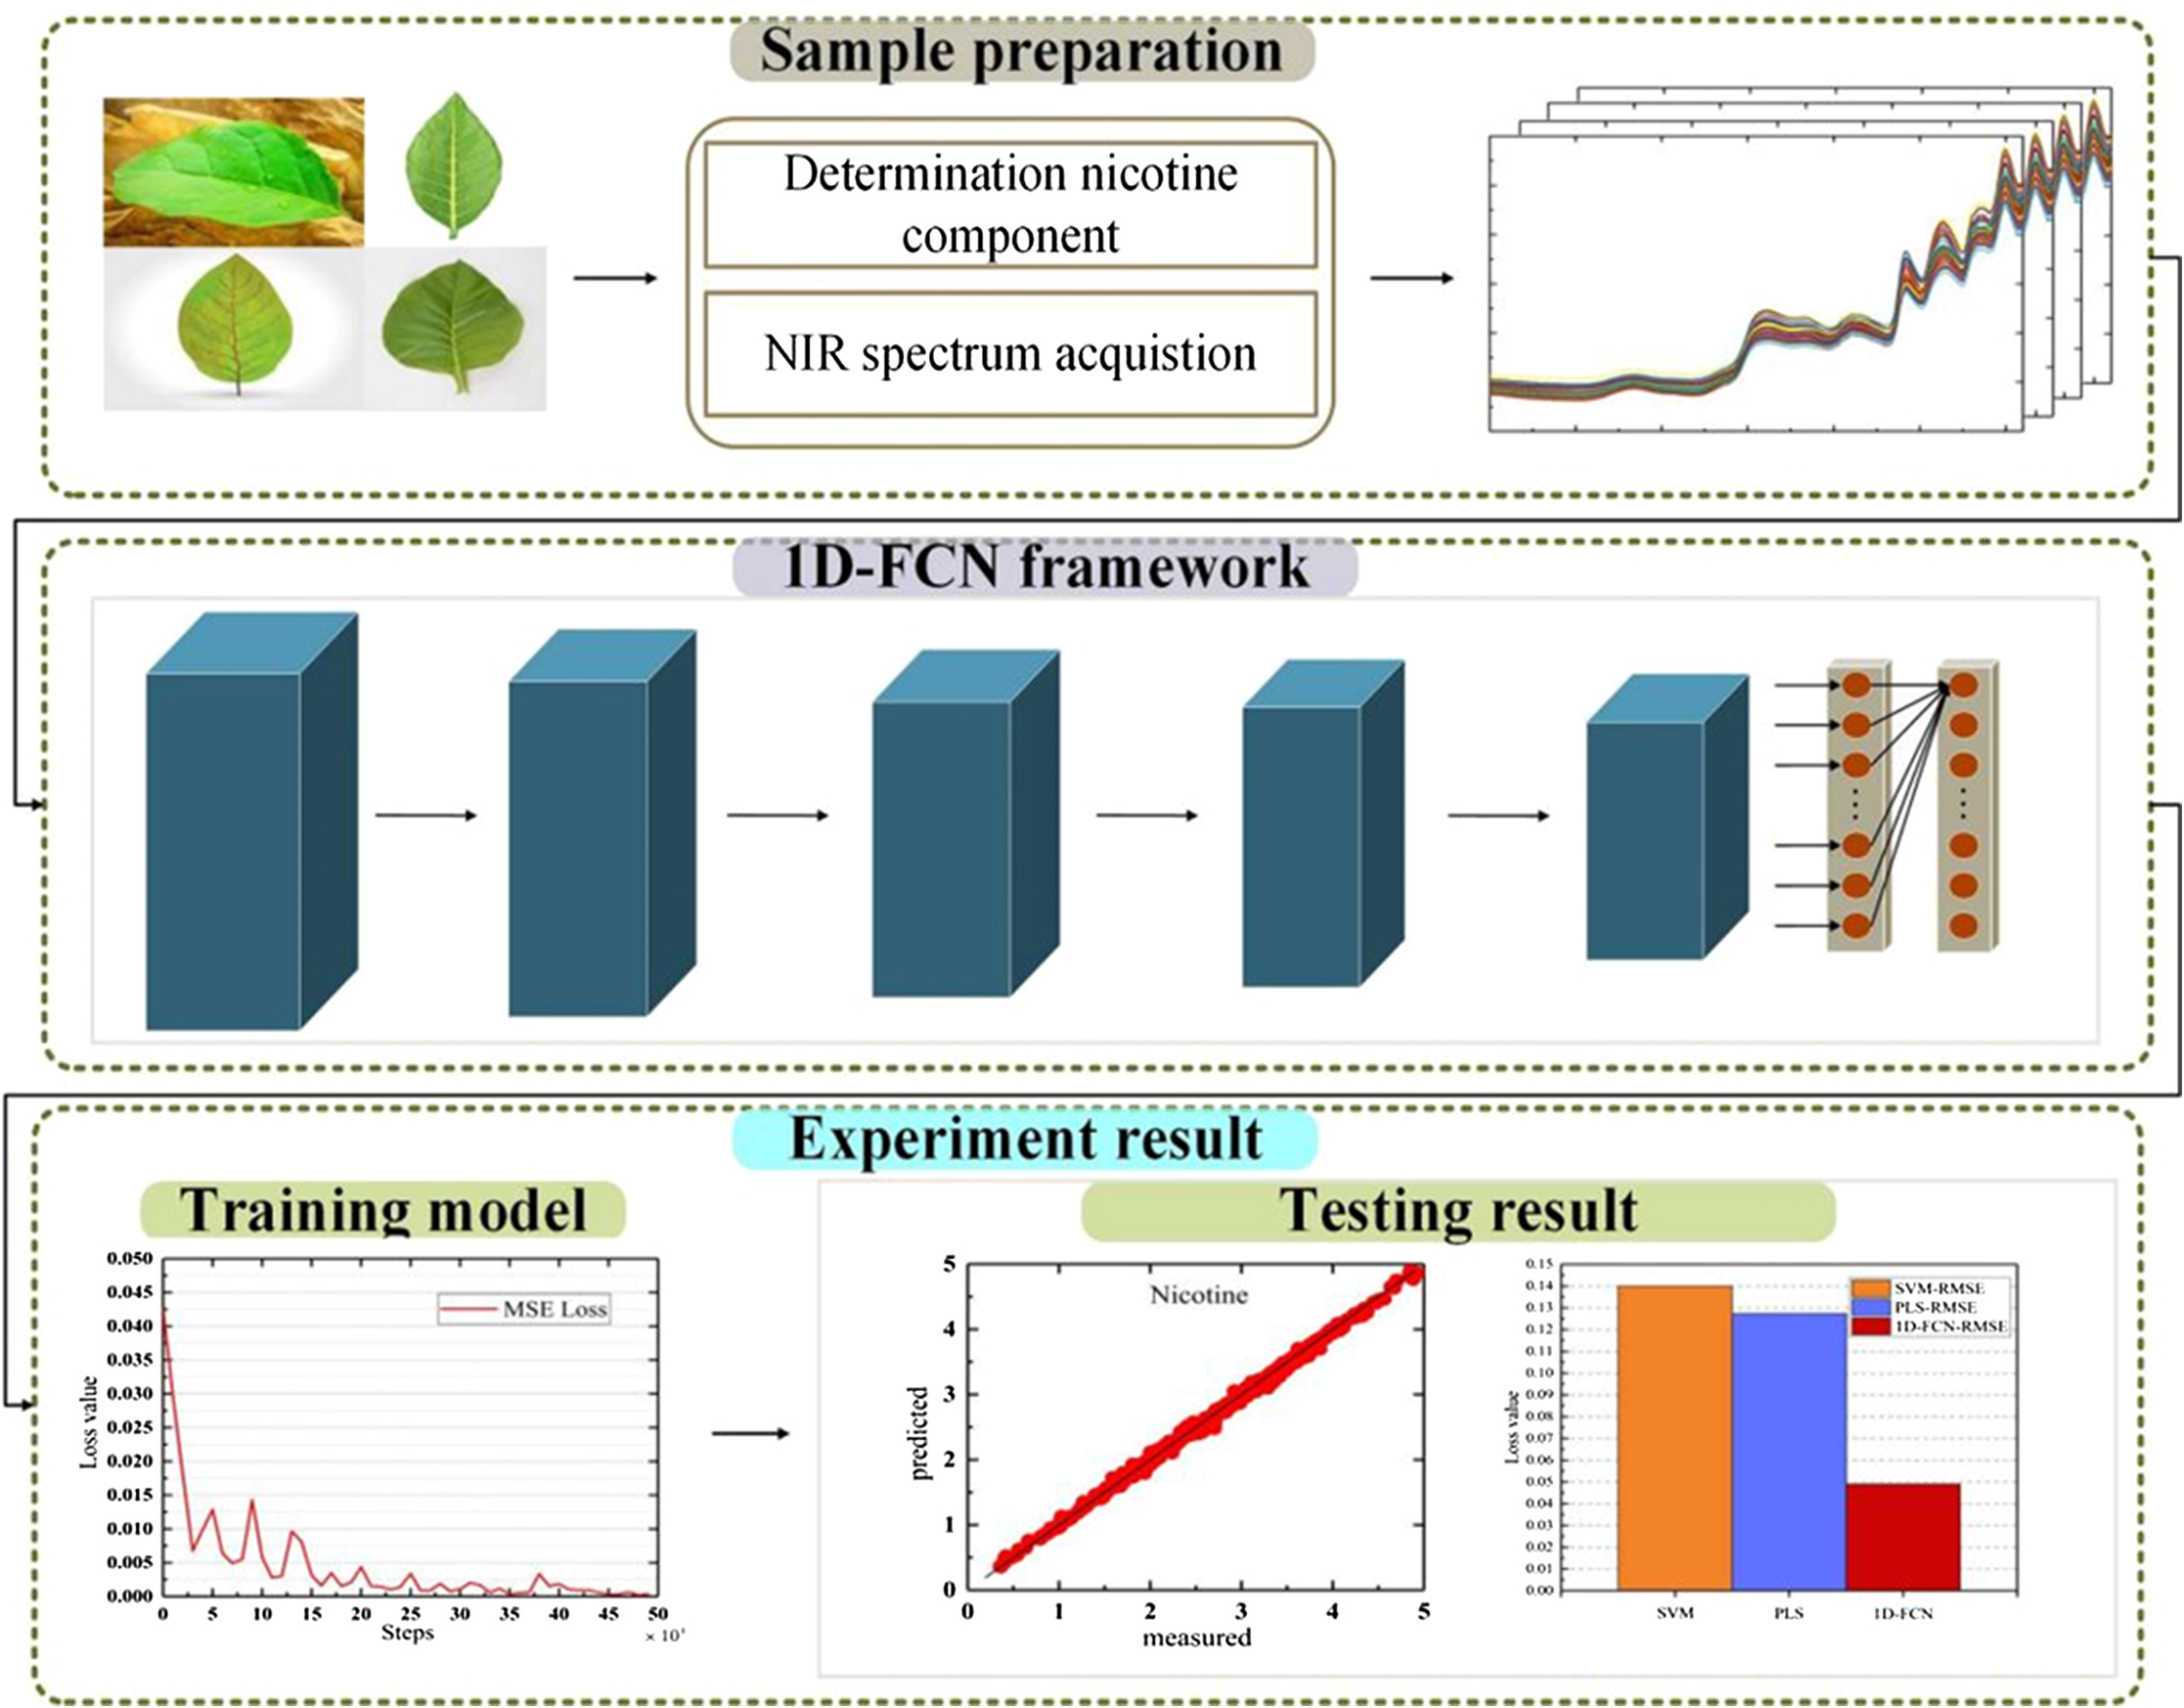 Fig. 3. Block diagram of the one-dimensional fully convolutional network (1D-FCN) framework.
A.CNN
CNN is a deep neural network under deep supervised learning [32]. It can handle complex and redundant data, and high-order structural features [18]. In the network, through the forward propagation of multiple convolution layers, both local and global features can be accurately identified and extracted [13], [14]. During the training process, the CNN model uses the gradient descent method to adjust the weight parameters in the network through the backpropagation to minimize the loss value [33]. The basic structure of CNN consists of convolutional layers, pooling layers, and fully connected layers. Each convolutional layer uses multiple kernels to process the data and outputs feature maps. The usage of the convolutional network is not limited to image processing; it can be used to analyze 1D sequential data, such as NIR spectral data. The calculation process of 1D convolution is shown in the following:
where x is the 1D input data; i is the filter in the i-th convolution layer; a represents the feature map of input x to the i-th convolution layer; represents the filter weight of this convolution layer and bi is its bias; and g(i) is the output feature map after this convolutional layer. In (2), BN represents the batch normalization (BN) [34], and f(·) is the rectified linear unit (ReLU) [35] activation function, which implements nonlinear transformations:where negative values are zeroed out, and positive neurons are kept and forwarded to the next layer.B.THE 1D-FCN MODEL STRUCTURE
An FCN uses CNN as the backbone to transform individual data into designated targets, including regression values. Unlike the CNN described previously, FCN can backtrack the data of the intermediate layer feature maps to the input data through the transposed convolution layer, so that the predictions have a one-to-one correspondence with the input data. In this work, our goal is to predict a single value indicating the nicotine percentage from a sequence of NIR spectral data. The entire data sequence should contribute to the single output value. The FCN architecture perfectly fits the requirement of our task.
To better utilize the FCN network, we customize its architecture with two modifications. First, the pooling layers are abandoned. In the original FCN architecture, to decrease the network computational cost, max-pooling operations are applied after convolutional layers to reduce the parameters while making the model translation invariant in the image-processing tasks. However, the pooling operation causes information loss, which affects the model’s performance. For our case, we just have a single prediction output for each input sequence, and computational cost is not a significant problem as compared to image processing tasks (e.g., segmentation). Meanwhile, data translation variance is not present in this application as the entire wavelength sequence is contributed to a single output. Therefore, the pooling layers are removed and replaced with extra convolutional layers. This modification improves the model accuracy as more feature information is taken into the consideration during the training process. Second, all convolutional kernels are in 1D shape, which fits the nature of the input data and makes the model efficient.
The structure of this model is shown in the second diagram of Fig. 4. The blue blocks represent the convolution layers, and the gray blocks represent the full connection layers. The orange dots are neurons inside the full connection layers.
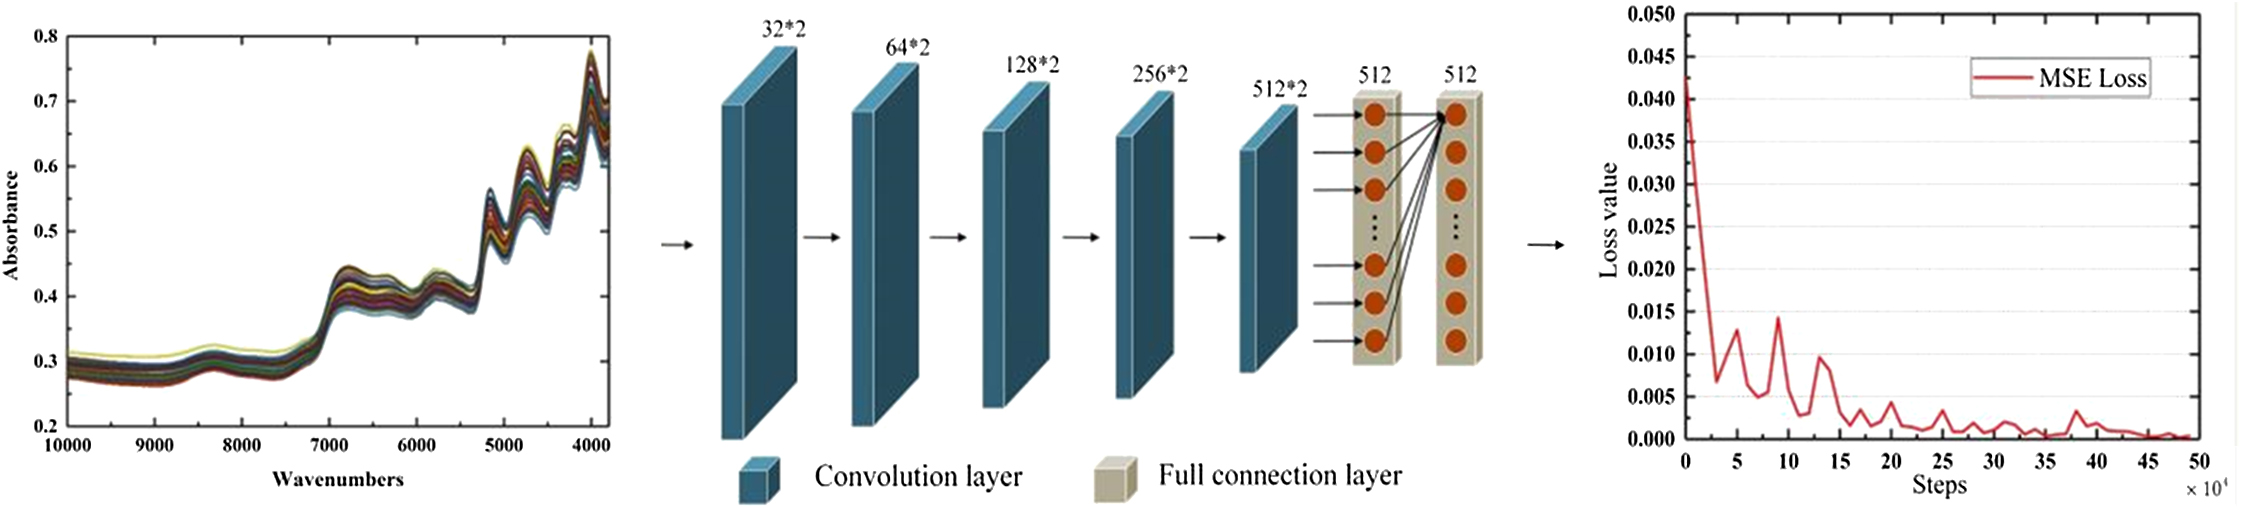 Fig. 4. Structure of 1D-FCN model.
This 1D-FCN model consists of five convolutional layers and two full connection layers. Each convolutional layer uses a kernel with a size of 2 × 1, stride of 2. The number of convolution kernels from the first to fifth layers are 32, 64, 128, 256, and 512, respectively. Each fully connected layer includes 512 neurons. The original spectral data sequence is directly entered into the 1D-FCN framework, and the network outputs the prediction (nicotine percentage) and its corresponding loss, which is calculated by MSE function (4) at the end of each forward iteration.
where yt is the true value of nicotine, is the predicted value, and n is the number of yt.V.EXPERIMENTAL RESULTS
A.DATASET AND EXPERIMENTAL PLATFORM
In this study, a total of 4000 standard samples of tobacco leaves are used. These were collected from different regions in the Guizhou Province, China, by Guizhou Tobacco Science Research Institute of China. To get the ground truth (nicotine percentage) of those tobacco samples, their chemical composition percentage values were measured in a traditional way. Specifically, all tobacco samples were dried in an oven at 60 °C under normal pressure for half an hour. Then, they were ground into powder at a given level of granularity through use of a whirlwind grinding instrument. The tobacco leaf powder was sieved by mesh and put into a continuous flow injection analytical instrument, San+Automated Wet Chemical Analyzer (Skalar, Holand). Then, a series of analytical methods were conducted to detect the chemical values of nicotine. The measured values are used as the ground truth for 1D-FCN model training. The overall distribution of measured nicotine percentage in total tobacco samples is shown in Table II, where the values are normally distributed around the mean value 2.80%. The range is between 0.36% and 6.01%.
TABLE II. Statistic Values of Raw Spectral Data
| Min (%) | Max (%) | Mean (%) | STD | |
|---|---|---|---|---|
| Nicotine | 0.36 | 6.01 | 2.80 | 0.82 |
STD = standard deviations.
Since the dataset size is limited, we used fivefold cross validation to train the network model. All the labeled data (coupled with ground truth) were randomly split into training and testing sets with the ratio of 4∶1. The experiments were conducted on a small cloud environment that consisted of six machines with NVIDIA GTX 2080 GPU, Intel(R) Core(TM) i7-8700 3.20 GHz CPU, and 24 GB RAM. The neural network was built in the deep learning framework TensorFlow 1.15.0 on a Windows 10 operating system. The training and testing codes were programmed in Python using Keras library.
B.EVALUATION METRICS
In this paper, the root MSE (RMSE), mean absolute error (MAE), and determination coefficient R2 are used to evaluate the model performance. Equations (5)–(7) show their equations, respectively.
where yt is the ground-truth value, is the predicted data, is the mean of ground truth for all samples, and n is the number of testing samples. RMSE and MAE reflected the precision of the measurement, which indicates the overall difference between the predictions and the ground truth for all testing samples. On the contrary, R2 measures how successful the fit is in explaining the variation of the data with values ranging from 0 to 1. When R2 is close to 1, the model shows a good fitting. Concisely, a good model should have a high R2 value and low RMSE and MAE values.C.1D-FCN MODEL PARAMETERS
The detailed parameter settings of the proposed 1D-FCN are shown in Table III. Sequence data are processed in Conv layers. The results of BN are restored to the original input characteristics by scaling and shifting. ReLU is the activation function after each Conv layer. Reshape layer adjusts data from 1 × 51 × 512 to 1 × 26,112. Dropout layer is used after each fully connected layer to reduce the neurons to avoid overfitting.
TABLE III. Parameter Size and Data Shapes in the one-dimensional fully convolutional network (1D-FCN)
| Layer | Detailed structure | Convolution kernel | Output size | ||
|---|---|---|---|---|---|
| Size | Number | Stride | |||
| First layer | Conv1 + BN + ReLU | 1×2 | 32 | 2 | 1×805×32 |
| Second layer | Conv2 + BN + ReLU | 1×2 | 64 | 2 | 1×403×64 |
| Third layer | Conv3 + BN + ReLU | 1×2 | 128 | 2 | 1×202×128 |
| Fourth layer | Conv4 + BN + ReLU | 1×2 | 256 | 2 | 1×101×256 |
| Fifth layer | Conv5 + BN + ReLU | 1×2 | 512 | 2 | 1×51×512 |
| Output layer | Reshape | 1×2 | 112 | 2 | 1×26,112 |
| FC1 + ReLU + Dropout | – | – | – | 500 | |
| FC2 | – | – | – | 1 | |
BN = batch normalization; ReLU = rectified linear unit.
The sequential NIR data have 609 spectral elements in a single channel, and the final output is the nicotine percentage of a tobacco leaf sample. It uses h × w × c to denote the data shape, where w and h represent the width and height, respectively, and c represents the channel size. Since the input is 1D data, the size is 1 × 1609 × 1. After being processed by 32 kernels in Conv1 with stride = 2, the output size is 1 × 805 × 32. Conv2 has 64 convolution kernels with stride = 2, and its output size is changed to 1 × 403 × 32. Similarly, the outputs of Conv3–Conv5 are 1 × 202 × 128, 1 × 101 × 256, and 1 × 51 × 512, respectively. There are no max-pooling layers. The Reshape operation makes the data size equal to 1 × 26,112. After the first fully connected (FC1) and ReLU layers, Dropout layer is applied to avoid overfitting. In this work, the dropout rate is 0.5, which means 50% of neurons would stop working (being zeros) in a batch of training. The output of FC1 and Dropout is 500. The second fully connected layer, FC2, outputs the final predicted nicotine percentage.
D.NETWORK TRAINING
During the network training, the batch size of the training data is set to 16, and the total number of training iterations is set to 500,000. The initial learning rate is set to 0.001, and its attenuation coefficient is set to 0.99 and updated every 6300 iterations. The initial weights of the convolutional layers and the fully connected layers are set using the Microsoft Research Asia (msra) method [36].
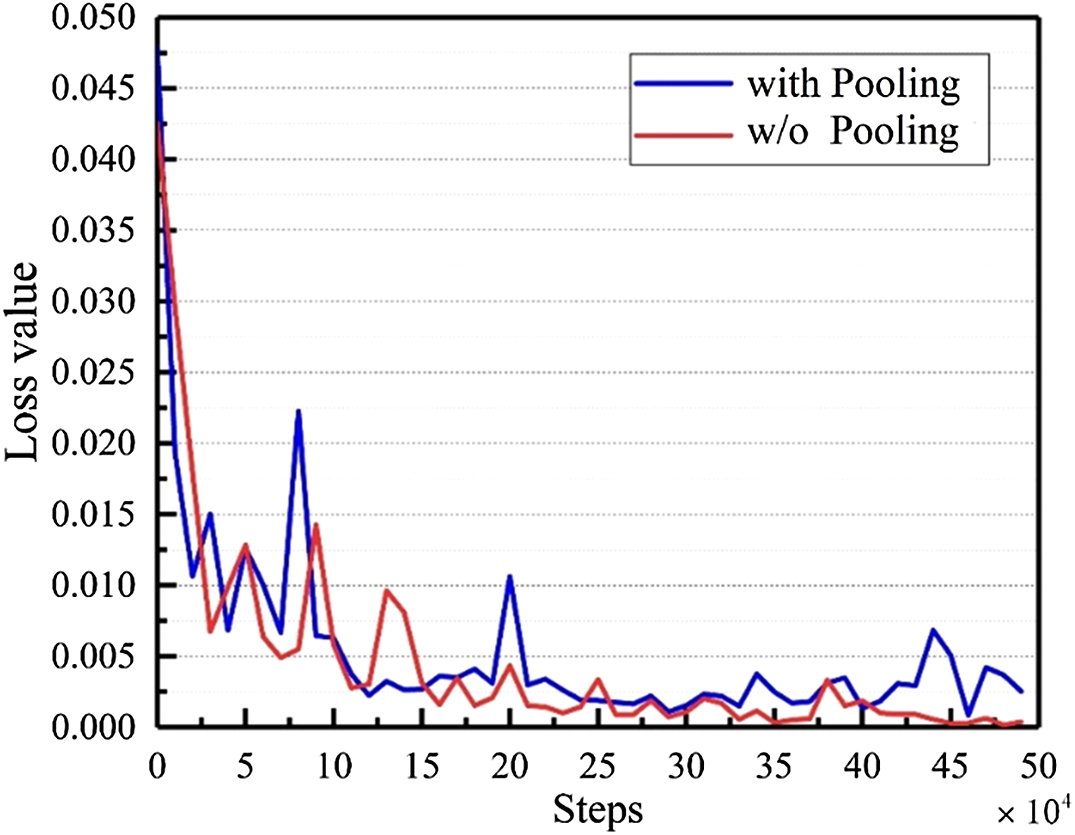
The training loss curves are shown in Fig. 5. The numbers on Y-axis represent the loss values. The numbers on the X-axis represent the training iterations. The blue curve represents the trend of loss value with the max-pooling layer. The red curve is the loss trend for the proposed 1D-FCN. The red loss curve has a rapidly downward trend at the beginning of the training and then slowly decreases until convergence. From 50,000 to 400,000 iteration rounds, the loss values have obvious fluctuations. After 400,000 iterations of network training, the loss value reaches 3.38409 × 10⁻³ and starts to converge. The training loss value is eventually stable and reaches the minimum value 3.92586 × 10⁻⁴ at 500,000 iterations. The blue loss curve shows the training process for the model with the max-pooling layer. Max-pooling causes information loss and performed worse than the proposed model. It can be observed from the chart, that its loss values do not have a smooth downward trend even when it is getting close to the end of the training process.
On the training dataset, the RMSE value of our model was 0.05370, and the MAE value was 0.04058. On the testing set, the RMSE and MAE values are 0.04899 and 0.03409, respectively. These values are better than that on the training set. It indicates the trained model is not overfitting. The correlation coefficient R2 on both training and testing sets are greater than 0.99 and close to 1.
E.COMPARATIVE ANALYSIS WITH OTHER METHODS
In analyzing and determining the nicotine percentage of tobacco leaves, the proposed 1D-FCN model was compared with two conventional machine-learning approaches, PLS regression methods [37], [38] and SVM [5], and a regular deep CNN model. We implemented both PLS and SVM approaches according to the steps described in their original papers. 1D-CNN was implemented as described in Section IV.A. All experiments were conducted on the same datasets and platform, and RMSE, MAE, and R2 were used for evaluation.
Fig. 6 shows the correlations between the predicted values and measured ground truth of the testing tobacco samples for four models. For each scatter diagram, the numbers on the abscissa and ordinate represent the ground truth and the predictions, respectively. The orange, green, blue, and red dots on four diagrams are from the SVM, PLS, 1D-CNN, and the proposed 1D-FCN models, respectively. There is a black line y = x in each scatter diagram. If the predicted values are exactly the same as measured ground-truth values, all points would be perfectly situated on this diagonal line.
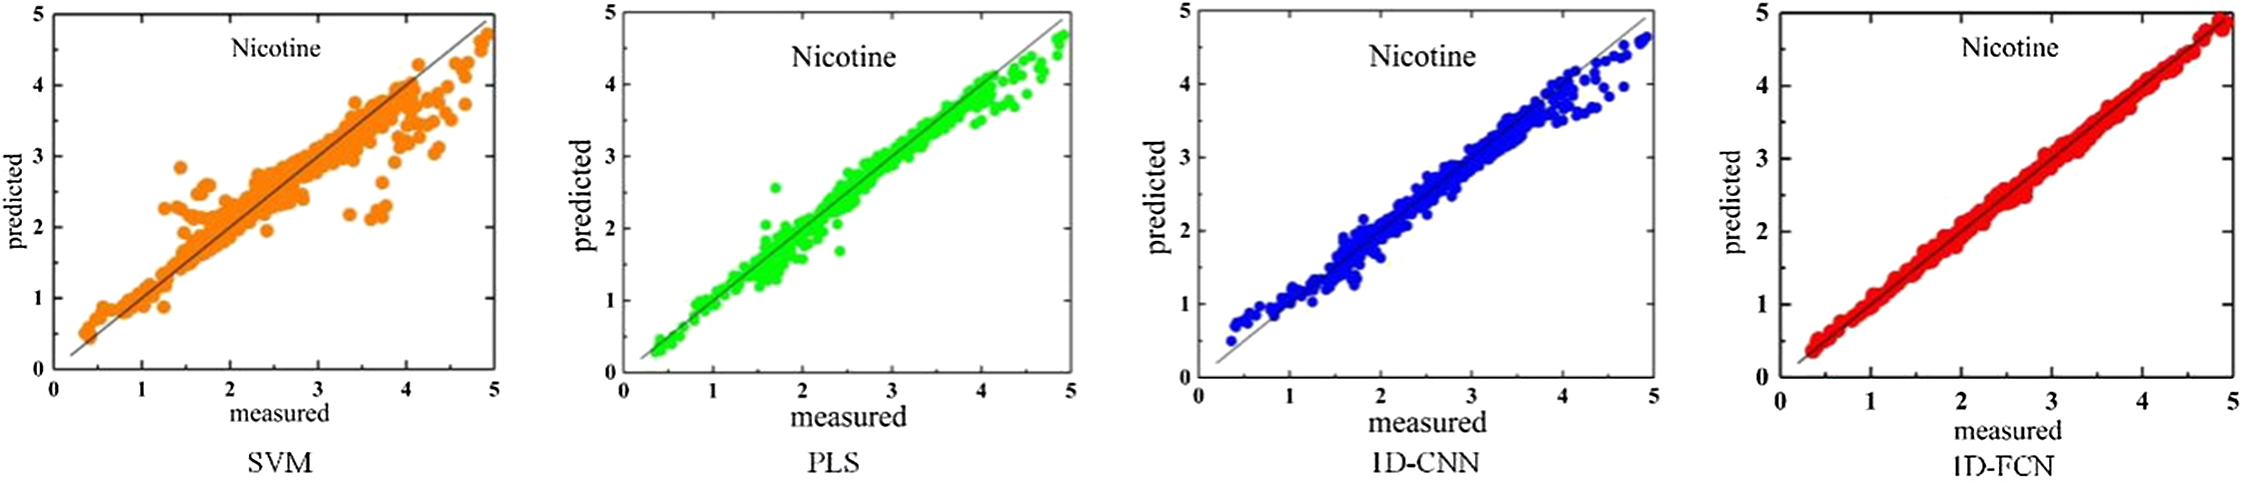 Fig. 6. Correlation between predicted and the ground-truth values of different models.
From the SVM model, many orange points are distributed widely on both sides of the diagonal line. It indicates the predicted values largely differ from the ground truth. Compared with SVM model, PLS and 1D-CNN models are relatively better, but the green points from PLS model are not tightly close to the diagonal lines, especially for the nicotine percentage larger than 4%. Most of these incorrectly predicted samples are under the diagonal line meaning the predicted values are underestimated. For the 1D-CNN model, blue dots are tightly narrowed around the diagonal line in the range of nicotine percentage between 2% and 3.5%, which is near the mass center (mean) of the sample data according to Table II. Meanwhile, blue dots are scattered unevenly over or under the diagonal line in the regions of low (<1%) and high nicotine percentage (>4%), respectively. Those samples with high or low nicotine volumes belong to variances in the dataset as shown in Table II. It indicates that 1D-CNN model works fine for the majority of cases but could not provide accurate predictions for variant samples due to small training dataset. However, the proposed 1D-FCN model can overcome the limitation, as its predicted values are almost consistent with the ground truth, tightly situated along the y = x diagonal line. The closer these points are to the diagonal line the better-fitting effect of the model. Obviously, 1D-FCN performs the best.
Fig. 7 presents four bar charts showing the evaluation metrics RMSE, MAE, and R2 for the models on the testing dataset. In the first two charts, the orange, green, blue, and red bars represent the error rates for SVM, PLS, 1D-CNN, and 1D-FCN models, respectively. Apparently, the error rates of SVM and PLS models are much higher than those of 1D-CNN and 1D-FCN models, and 1D-FCN performs the best. The ordinate in the R2 graph represents the model’s fitting rate, which shows how well the model fits the expected ground truth. The R2 value for 1D-FCN model is greater than others, with a value close to 1.
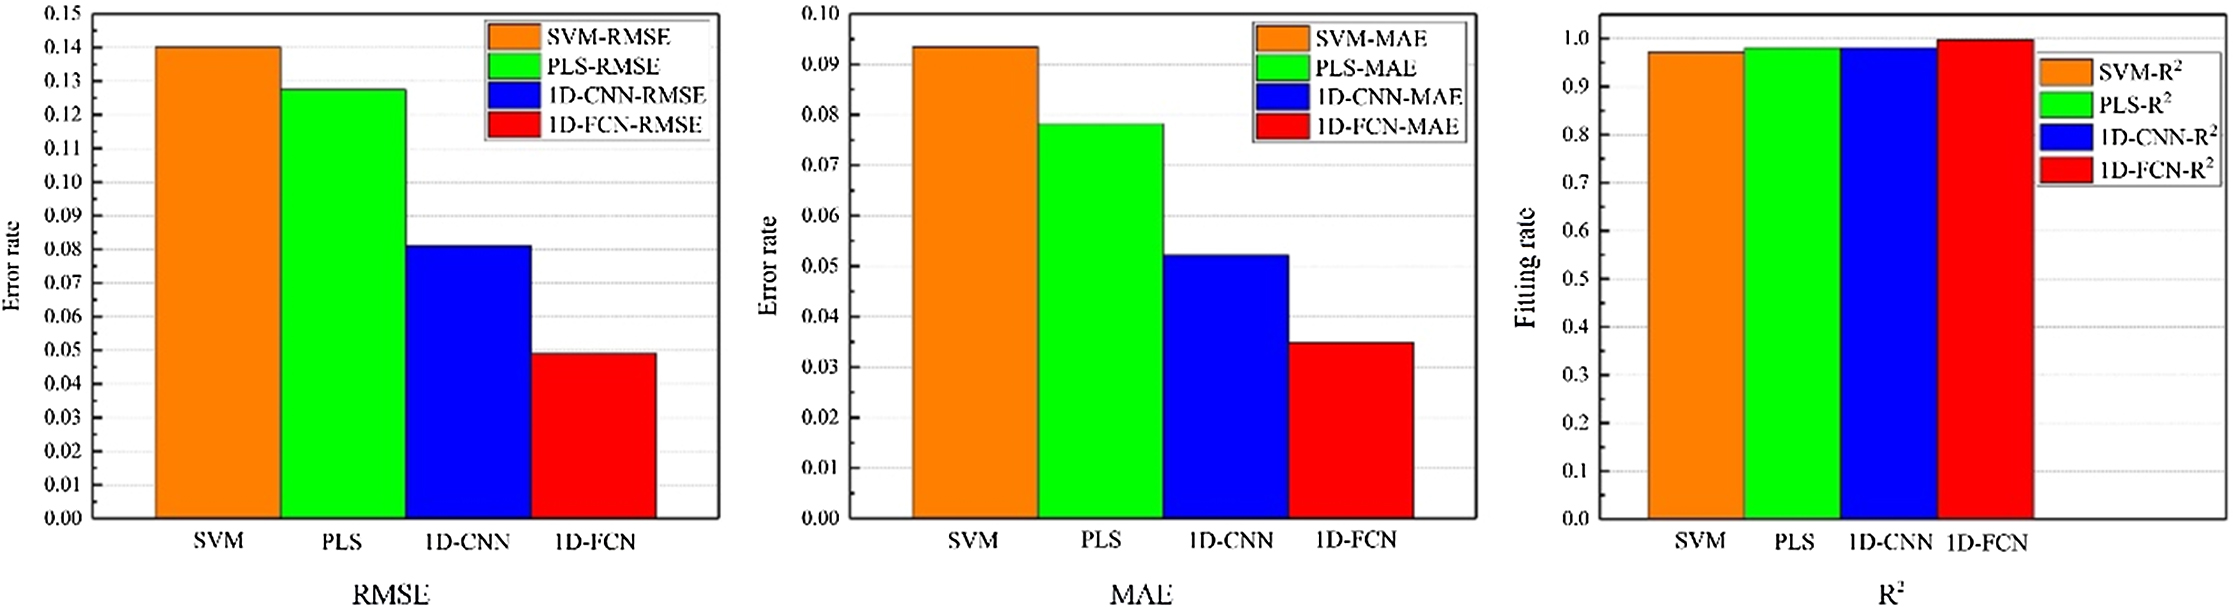 Fig. 7. Different evaluation metrics on the four models.
Table IV shows the detailed analysis results of the four models on the testing dataset. As mentioned previously, a good model should have high R2 values and low RMSE and MAE values. Clearly, 1D-FCN performed the best according to three evaluation metrics. It demonstrates the proposed 1D-FCN has the powerful prediction capability as it outperforms the other conventional machine-learning methods and a regular CNN model for nicotine analysis.
TABLE IV. Nicotine Analysis Results of the Four Models
| Models | RMSE (%) | MAE (%) | R2 |
|---|---|---|---|
| SVM | 0.14001 | 0.09342 | 0.97091 |
| PLS | 0.12074 | 0.07825 | 0.98064 |
| 1D-CNN | 0.08101 | 0.05216 | 0.99005 |
| 1D-FCN |
RMSE = root mean square; MAE = mean absolute error; PLS = partial least squares; SVM = support vector machine; 1D-CNN = one-dimensional convolutional neural network; 1D-FCN = one-dimensional fully convolutional network.
The bold values represent the best results.
VI.CONCLUSIONS
In this paper, we proposed a 1D-FCN model to quantitatively analyze the nicotine levels of tobacco samples from NIR spectroscopy data in a cloud environment. The model is based on the FCN, where the max-pooling layer is replaced by a convolutional layer to avoid information loss. To be adaptive to the nature of sequential NIR spectroscopy data, 1D convolution layers are used to directly extract the structural features. During the model evaluation, RMSE, MAE, and R2 are used as the metrics to verify the prediction performance. Compared with the conventional machine-learning approaches and a regular 1D-CNN model, the proposed network demonstrates superior prediction performance. The overall results show that NIR spectroscopy combined with a deep learning framework can analyze chemical substances efficiently and effectively. This research provides a deep learning foundation for quantitative analysis of NIR spectral data in the tobacco industry. In future, the features of other chemical components will be explored to extend the applicability of the proposed model. The proposed model will also be improved to enhance the analysis accuracy of chemical components.